JSE Presentation Drilling... · Slide JSE Presentation Master Drilling Group Ltd Danie Pretorius,...
20
Slide Master Drilling Group Ltd JSE Presentation Danie Pretorius, CEO Durban JSE Showcase 22 July 2015
Transcript of JSE Presentation Drilling... · Slide JSE Presentation Master Drilling Group Ltd Danie Pretorius,...

Slide
Master Drilling Group LtdJSE Presentation
Danie Pretorius, CEODurban JSE Showcase22 July 2015

Slide
� Largest raise boring fleet in the world
� Fleet size 300% larger than closest competitor
� Most technological advanced drilling fleet in industry
� Most diversified in terms of footprint and service range
� Share price doubled since listing 2years ago
� Never experienced negative growth despite industry volatility
2
MASTER DRILLING – THE BUSINESS
1997

Slide
MASTER DRILLING – THE BUSINESS
We challenge the status quo to provide our clients with specialised, adaptive one-stop drilling solutions
Our strategic pillars (DNA)
3
Sustainable growth
Optimisationand increased
profitability
Technology optimisation and
development
People capacity and development

Slide
MASTER DRILLING – THE BUSINESS
Civil and construction
Energy Mining
Sector applications Sector applications
ReamingPiloting
4

Slide
Vertical integration model
5
MASTER DRILLING – THE BUSINESS

Slide
SUSTAINABLE GROWTH – GLOBAL FOOTPRINT
Did you know calculated risk-taking forms part of our company culture – Expanding Geographically
Since listing 20122013
2014
2015
6

Slide
2013 - US$119m60%
1%
31%
8%50%
2%15%
33%
2014 - US$132m
Other
SUSTAINABLE GROWTH – REVENUE GROWTH
7

Slide
South Africa
OceaniaUS$130b
US$47b
US$130b
Asia
US$33b
AfricaUS$21b
Europe
US$22b
North America
Latin American
SUSTAINABLE GROWTH – GLOBAL MARKET PROJECT COSTING MORE THAN US$1b
Source: Business risks facing mining and metals 2014–2015, E&Y
8

Slide
Diversified global client base
9
SUSTAINABLE GROWTH – CLIENTS

Slide
Gold32%
Iron Ore20%
Polymetalic
16%
Copper15%
Other10%
Platinum7%
Revenue by commodity 2014
SUSTAINABLE GROWTH – COMMODITIES
Gold 21%
Iron Ore 13%
Polymetalic 11%Copper
19%
Other 25%
Platinum 11%
Revenue by commodity 2013
10

Slide 13
TECHNOLOGY OPTIMISATION & DEVELOPMENT
Innovation Highlights� First slot drilling machine
� Compact machine for in-stope
drilling
� Fully computerised shaft borer
from Wirth Germany
� Fully automated drilling rigs
� Design and manufacture
“intelligent” raise bore machine
� Remote monitoring
� Real time grade sampler
Slide
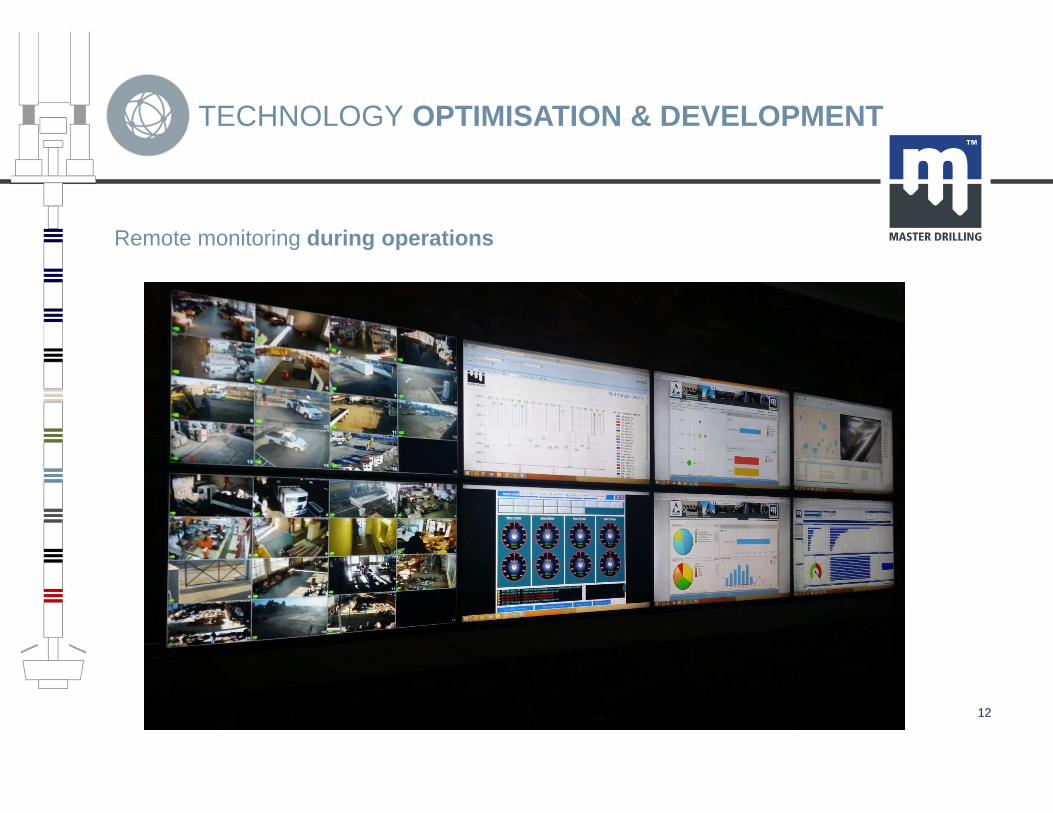
Remote monitoring during operations
12
TECHNOLOGY OPTIMISATION & DEVELOPMENT

Slide
PEOPLE CAPACITY & DEVELOPMENT
• More than 85% of employees directly engaged
in drilling activities
• Training centres in Peru, SA and Chile to
support global operations
• SA mining pedigree and world class
management and engineering expertise
• Executive directors aggregate of 92 years
global experience
10%
56%1%
33%
Geographic
Rest of Africa Latin AmericaOther countries South Africa
13

Slide 14
OPTIMISATION & INCREASED PROFITABILTY
$0
$20,000,000
$40,000,000
$60,000,000
$80,000,000
$100,000,000
$120,000,000
$140,000,000
2010 2011 2012 2013 2014
REVENUE
$0
$5,000,000
$10,000,000
$15,000,000
$20,000,000
$25,000,000
$30,000,000
$35,000,000
$40,000,000
2010 2011 2012 2013 2014
EBITDA

Slide 15
OPTIMISATION & INCREASED PROFITABILTY
0
10
20
30
40
50
60
70
80
90
100
2015 2016 2017 onwards
US
$m
Order book per commodityCopper
Gold
Energy
Polymetallic
Iron Ore
Silver
Platinum
Tin
Diamond
Civil

Slide
* average revenue per operating rig** 31 rigs impaired during the year
2009 2010 2011 2012 2013 2014
Total Raisebore rigs 68 73 78 88 88 94
Utilisation % 65% 80% 80% 71% 77% 75%
*ARPOR (US$) 83 671 82 651 98 128 108 847 117 047 118 215
Total Slim rigs 40 43 54 64 74 45**
Utilisation % 39% 23% 58% 51% 54% 54%
*ARPOR (US$) 43 228 71 874 51 705 34 293 50 740 58 525
Operational key performance metrics
OPTIMISATION & INCREASED PROFITABILTY
16

Slide
Financial Position (US$m)
17
OPTIMISATION & INCREASED PROFITABILTY
2014 2013 COMMENTS
Assets
Total non-current assets 110 071 661 101 965 335 � Total interest bearing debt: US$15.5m (2014) and US$14.5m (2013)
� Gearing ratio (total debt/total equity): 19.6% (2014) and 22.4% (2013)
� Current ratio (current assets/current liabilities): 1.79 (2014) and 1.71 (2013)
Total current assets 60 581 929 60 455 290
Total assets 170 653 590 162 420 625
Equity
Equity 100 203 562 91 867 551
Non-controlling interest 15 474 542 14 250 534
Total equity 115 678 104 106 118 085
Liabilities
Total non-current liabilities 21 096 817 21 015 693
Total current liabilities 33 878 669 35 286 847
Total liabilities 54 975 486 56 302 540
Total equity and liabilities 170 653 590 162 420 625

Slide
Comprehensive Income (US$m)
OPTIMISATION & INCREASED PROFITABILTY
2014 2013 COMMENTS
Revenue 132 034 310 119 688 645 � Revenue: year on year growth – 10.3%
� Operating Profit margin 20.1% (2014) and 18.8% (2013)
� EDITDA: US$35.5m (2014) and US$28.9m (2013)
� PAT: year on year growth – 16.8%
Cost of sales (88 269 543) (79 930 462)
Gross profit 43 764 767 39 758 193
Other operating income 1 782 703 891 774
Other operating expenses (18 923 519) (18 106 951)
Operating profit 26 623 951 22 543 006
Investment revenue 1 296 732 1 473 911
Finance costs (1 506 118) (1 926 791)
Profit before taxation 26 414 565 22 090 126
Taxation (7 961 104) (6 294 382)
Profit for the year 18 453 461 15 795 744
18

Slide
Cash flows (US$m)
OPTIMISATION & INCREASED PROFITABILTY
2014 2013 COMMENTS
Net cash from operating activities 23 845 192 15 590 711 � Cash generated from operating activities up by 52.9% to $23.8 million (2013: $15.6 million)
Net cash from investing activities (20 215 553) (30 072 509)
Net cash from financing activities (6 498 339) (9 489 389)
Total cash movement for the year (2 868 700) (23 971 187)
Cash at the beginning of the year 16 565 233 49 573 277
Effect of exchange rate movement oncash balances
(1 219 451) (9 036 857)
Total cash at the end of the year 12 477 082 16 565 233
19

Slide 20
SHARE PRICE PERFORMANCE
Share price – 1 380c