
JProbe. 1. JProbe Use JProbe Profile –identify method and line level performance bottlenecks Use...
19
JProbe
Transcript of JProbe. 1. JProbe Use JProbe Profile –identify method and line level performance bottlenecks Use...

JProbe

1. JProbe
• Use JProbe Profile– identify method and line level performance bottlenecks
• Use JProbe Memory Debugger– investigating memory leaks and garbage collection activity
• Use JProbe Threadalyze– finding thread deadlocks and stalls
• Use JProbe Coverage– measuring code coverage after testing

1.1 JProbe Profiler
• Hunt Down Performance Bottlenecks– helps developers quickly diagnose performance bottlenecks in Ja
va code. – With highly accurate diagnostics, line-by-line results
• Improved Call Graph– JProbe Profiler Call Graph – encapsulates the valuable information
• Application Server Configuration Wizard– Integrating testing tools with application servers environments

1.1 JProbe Profiler
• Benefits: – Pinpoint performance bottlenecks down to the
line of code with advanced Call Graph – Zero in on critical code with advanced filtering – Analyze your performance using nine different
metrics – Automate the collection of performance
information using triggers – Perform local or remote analysis sessions without
any code changes – Generate reports and share information about
your application performance

1.1 JProbe Profiler
• Prepare

1.1 JProbe Profiler : call graph

1.1 JProbe Profiler : method list

1.1 JProbe Profiler : method detail

1.1 JProbe Profiler

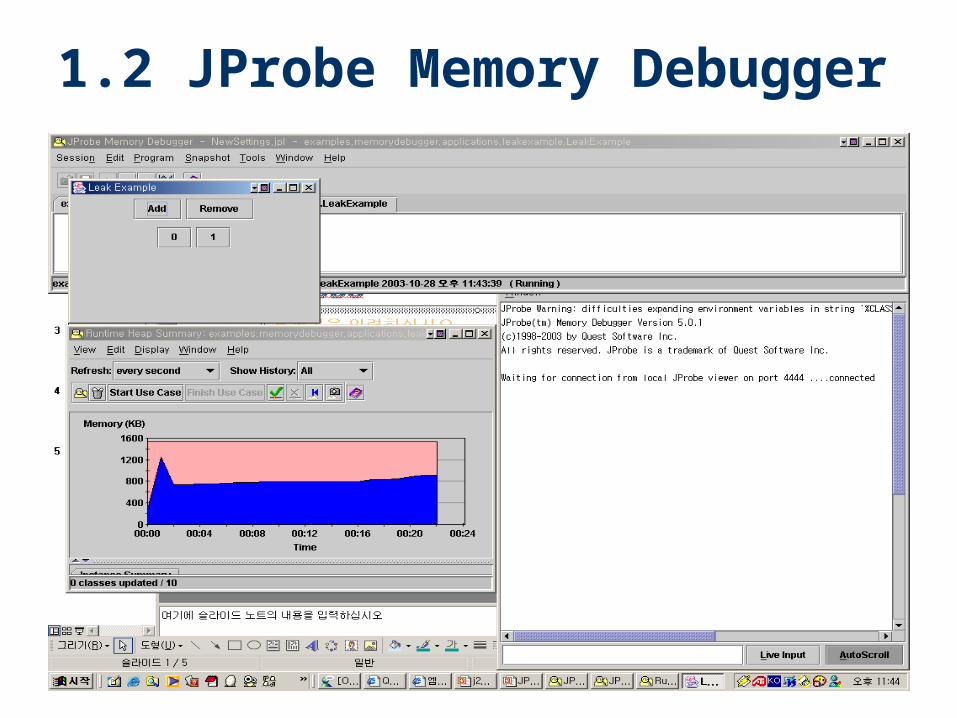
1.2 JProbe Memory Debugger
• Find and Fix Memory Leaks Now– helps developers quickly pinpoint memory leaks in Java code and reduce
application memory usage.– visualize complex data on memory usage and memory leaks
• Benefits JProbe Memory Debugger provides include: – Diagnosis and resolution of memory leaks – Identification and elimination of expensive memory recycling with the Gar
bage Monitor – Dramatic improvement in memory consumption and application performa
nce – Comparing memory usage before and after critical code changes with sn
apshot differencing – Automation of the collection of memory analysis data with triggers - savi
ng you valuable time – Generation reports and metrics on memory use and Garbage Collection
1.2 JProbe Memory Debugger

1.3 JProbe Coverage
• Is Your Code Covered?– To ensure accurate Java applications, Quality Assuran
ce professionals and developers need to know • how much of the code has been tested• where to find any untested code.
– JProbe Coverage • you locate untested code• measure precisely how much code has been exercised.• The result is a higher quality application in a shorter peri
od of time.

1.3 JProbe Coverage
• JProbe Coverage 5.0– dramatically improved analysis time– providing users with up to factor of 10 improvement in
speed– Profiling and code coverage sessions are particularly i
mproved
– New to JProbe Coverage 5.0• the ability to generate class-level coverage reports• to the line and method-level reports offered by previous
versions.

1.3 JProbe Coverage
• With JProbe Coverage you can: – Identify and measure untested lines of code, methods
and classes – Ensure test runs are accurate and comprehensive – Merge total coverage data from multiple runs of your p
rogram – Browse, share and print results in HTML, text, XML, cs
v and PDF – Automate your coverage analysis as part of your nightl
y build and regression testing – Reduce Testing Time with JProbe Coverage
1.3 JProbe Coverage
• Reduce Testing Time with JProbe Coverage
– Testing and Quality Assurance (QA) • expensive and time consuming• QA to find
– problems– inform developers– wait for fixes– retest
• the frequency of the bugs decreases sufficiently

1.3 JProbe Coverage– JProbe Coverage helps
• developers ensure a basic level of testing before sending the application into formal QA.
• This process reduces the overall cost of delivering an application
• helps you deliver higher quality applications in a shorter period of time.

1.3 JProbe Coverage

1.3 JProbe Coverage

1.3 JProbe Coverage


![Visual Analytics of Cascaded Bottlenecks in Planar Flow ...hamann/PostGillmannWis...works is the identification and elimination of bottlenecks [18]. The analysis of bottlenecks in](https://static.fdocuments.net/doc/165x107/6066a715e1fcfc51770dd091/visual-analytics-of-cascaded-bottlenecks-in-planar-flow-hamannpostgillmannwis.jpg)
