J.P. Morgan Country/Region Funds · Also, financial markets were negatively impacted by an...
72
Semi-Annual Report J.P. Morgan Country/Region Funds April 30, 2015 (Unaudited) JPMorgan Asia Pacific Fund JPMorgan China Region Fund JPMorgan Europe Research Enhanced Equity Fund JPMorgan Intrepid European Fund JPMorgan Latin America Fund
Transcript of J.P. Morgan Country/Region Funds · Also, financial markets were negatively impacted by an...
Semi-Annual Report
J.P. Morgan Country/Region FundsApril 30, 2015 (Unaudited)
JPMorgan Asia Pacific FundJPMorgan China Region FundJPMorgan Europe Research Enhanced Equity FundJPMorgan Intrepid European FundJPMorgan Latin America Fund
CONTENTS
CEO’s Letter . . . . . . . . . . . . . . . . . . . . . . . . . . . . . . . . . . . . . . . . . . . . . . . . . . . . . . . . . . . . . . . . . . . . . . . . . . . . . . . . . . . . . . . 1
Market Overview . . . . . . . . . . . . . . . . . . . . . . . . . . . . . . . . . . . . . . . . . . . . . . . . . . . . . . . . . . . . . . . . . . . . . . . . . . . . . . . . . . . 2
Fund Commentaries:
JPMorgan Asia Pacific Fund . . . . . . . . . . . . . . . . . . . . . . . . . . . . . . . . . . . . . . . . . . . . . . . . . . . . . . . . . . . . . . . . . . . . . . . 3
JPMorgan China Region Fund . . . . . . . . . . . . . . . . . . . . . . . . . . . . . . . . . . . . . . . . . . . . . . . . . . . . . . . . . . . . . . . . . . . . . 5
JPMorgan Europe Research Enhanced Equity Fund . . . . . . . . . . . . . . . . . . . . . . . . . . . . . . . . . . . . . . . . . . . . . . . . . . . . . 7
JPMorgan Intrepid European Fund . . . . . . . . . . . . . . . . . . . . . . . . . . . . . . . . . . . . . . . . . . . . . . . . . . . . . . . . . . . . . . . . . . 9
JPMorgan Latin America Fund . . . . . . . . . . . . . . . . . . . . . . . . . . . . . . . . . . . . . . . . . . . . . . . . . . . . . . . . . . . . . . . . . . . . . 11
Schedules of Portfolio Investments . . . . . . . . . . . . . . . . . . . . . . . . . . . . . . . . . . . . . . . . . . . . . . . . . . . . . . . . . . . . . . . . . . . . . 13
Financial Statements . . . . . . . . . . . . . . . . . . . . . . . . . . . . . . . . . . . . . . . . . . . . . . . . . . . . . . . . . . . . . . . . . . . . . . . . . . . . . . . . 26
Financial Highlights . . . . . . . . . . . . . . . . . . . . . . . . . . . . . . . . . . . . . . . . . . . . . . . . . . . . . . . . . . . . . . . . . . . . . . . . . . . . . . . . . 40
Notes to Financial Statements . . . . . . . . . . . . . . . . . . . . . . . . . . . . . . . . . . . . . . . . . . . . . . . . . . . . . . . . . . . . . . . . . . . . . . . . . 50
Schedule of Shareholder Expenses . . . . . . . . . . . . . . . . . . . . . . . . . . . . . . . . . . . . . . . . . . . . . . . . . . . . . . . . . . . . . . . . . . . . . 62
Tax Letter . . . . . . . . . . . . . . . . . . . . . . . . . . . . . . . . . . . . . . . . . . . . . . . . . . . . . . . . . . . . . . . . . . . . . . . . . . . . . . . . . . . . . . . . 64
Investments in a Fund are not bank deposits or obligations of, or guaranteed or endorsed by, any bank and are not insured orguaranteed by the FDIC, the Federal Reserve Board or any other government agency. You could lose money if you sell whenthe Fund’s share price is lower than when you invested.
Past performance is no guarantee of future performance. The general market views expressed in this report are opinions based onmarket and other conditions through the end of the reporting period and are subject to change without notice. These views are notintended to predict the future performance of a Fund or the securities markets. References to specific securities and their issuers arefor illustrative purposes only and are not intended to be, and should not be interpreted as, recommendations to purchase or sell suchsecurities. Such views are not meant as investment advice and may not be relied on as an indication of trading intent on behalf of anyFund.
Prospective investors should refer to the Funds’ prospectus for a discussion of the Funds’ investment objectives, strategies and risks.Call J.P. Morgan Funds Service Center at 1-800-480-4111 for a prospectus containing more complete information about a Fund,including management fees and other expenses. Please read it carefully before investing.
C E O ’ S L E T T E RMay 12 , 2015 (Unaud i ted )
Dear Shareholder,The sharp divergence between U.S. economic growth and therest of the world that marked the end of 2014 receded some-what in 2015 as aggressive actions by central banks and astunning drop in global oil prices brought improved economicgrowth and strength in financial markets. Globally, equitymarkets and bond market aggregate indexes provided positivereturns for the six months ended April 30, 2015.
“The collective, if not concerted,efforts of central bankers helped todrive financial markets higher duringthe six month period.”
By the start of November, the U.S. Federal Reserve had endedits multi-billion dollar bond buying program amid substantialand continued improvement in employment. Meanwhile, Japanunleashed a massive economic stimulus to counter twoconsecutive quarters of economic contraction and the Euro-pean Central Bank moved decisively to head off the threat of adeflationary spiral. China’s central bank also undertook a seriesof actions to counter a slowing economy. By the end of Febru-ary 2015, the nations of India, Australia, Canada, Singapore andDenmark had also enacted monetary policies to counter eco-nomic weakness.
The collective, if not concerted, efforts of central bankershelped drive financial markets higher during the six monthperiod. Global mergers and acquisitions activity and generallyhealthy corporate earnings contributed to strength in equitymarkets. By mid April, European stock prices, as measured bythe FTSEurofirst 300 Index, closed at their highest level since2000, while China’s Shanghai Composite Index rose to close ata seven year high and Japan’s Nikkei Stock Average 225 closedabove the 20,000 point level for the first time in 15 years.
After notching record closing highs in February, March andApril, the Standard & Poor’s 500 Index ended the six monthsthrough April 30, 2015, with a return of 4.40%. The MSCIEurope, Australasia and Far East Index returned 7.06% and theMSCI Emerging Markets Index returned 4.04% for the sameperiod. Among bond indexes, the Barclays U.S. Aggregate Indexreturned 2.06% and the Barclays Emerging Markets AggregateIndex returned 1.15% for the same period.
While U.S. financial markets continued to benefit from low inter-est rates, expanding corporate profits and mergers, the overallU.S. economy — after leading all other developed markets ingrowth through 2014 — showed signs of weakening in early2015.
For the first quarter of 2015, U.S. gross domestic product (GDP)actually contracted by 0.7% compared with 2.2% growth forthe final quarter of 2014. In hindsight, economists noted twosignificant drags on the domestic economy in the first threemonths of 2015: Severe winter weather across the eastern halfof the country impeded construction and transportation and amonths-long labor dispute created significant backlogs at cru-cial West Coast ports. The relative strength of the U.S. dollaralso made exports more expensive and curbed foreign demandfor U.S.-made goods.
Declines in global oil prices, while helping consumer sectors ofthe economy, forced energy sector companies to curtail newprojects and the U.S. dollar’s strength relative to other leadingcurrencies put pressure on the earnings of companies withlarge overseas operations.
While U.S. unemployment fell to 5.4% in April 2015 from 5.8%in November 2014, the pace of job growth in March was theweakest in 15 months at 85,000 total jobs added. While wagegrowth in the U.S. showed improvement in April, it remainedweak overall, as it has throughout the economic recovery.
Meanwhile, GDP growth in the European Union (EU) rose 0.4%in the final quarter of 2014 and by 0.4% in the first threemonths of 2015. The euro’s weakness relative to other curren-cies helped drive export growth and in April 2015, EU consumerprices ended a four-month string of declines and bank lendingin March 2015 rose for the first time since 2012. Further, evenas the ongoing Greek debt crisis curbed investor confidence inthe EU, data from countries ranging from Germany to Spainshowed the economic recovery gaining strength.
The changes in the relative strengths and trajectories in theeconomies of the developed and emerging market nations overthe course of the past six months clearly demonstrate the fluidand interconnected nature of the global economy. We believe awell diversified portfolio and a patient, long-term perspectivemay allow investors to benefit from positive trends while limit-ing the impact of negative trends.
On behalf of everyone at J.P. Morgan Asset Management, thankyou for your continued support. We look forward to managingyour investment needs for years to come. Should you have anyquestions, please visit www.jpmorganfunds.com or contact theJ.P. Morgan Funds Service Center at 1-800-480-4111.
Sincerely yours,
George C.W. GatchCEO, Global Funds ManagementJ.P. Morgan Asset Management
APRIL 30, 2015 J.P. MORGAN COUNTRY/REGION FUNDS 1
J.P. Morgan Country/Region FundsM A R K E T O V E R V I E WS IX M ONTHS ENDED APRIL 30 , 2015
Overall, leading central banks throughout the world took action to maintain the global economic recovery. Increased central bankstimulus in the European Union and the Japanese government’s bulk purchases of equities during the six month reporting periodprovided support for equity markets outside the U.S. Meanwhile, the U.S. Federal Reserve held interest rates at historical lows andU.S. equity prices remained near record highs for much of the period. For the six months ended April 30, 2015, the MSCI Europe,Australasia and Far East Index (net of foreign withholding taxes) returned 7.06% and the S&P 500 Index returned 4.40%.
Greater ChinaSlowing growth in China drove uncertainty across emerging markets. However, the Chinese government took several actions aimedat stabilizing a deceleration of growth to a more moderate pace. During the six month period, Chinese equity prices provided positivereturns and the Shanghai Composite Index closed at a seven year high in late April. For the six months ended April 30, 2015, the MSCIGolden Dragon Index (net of foreign withholding taxes) returned 19.12%.
EuropeThe European Central Bank moved to stave off the threat of a deflationary spiral. The efforts appeared to have a positive effect assigns of inflationary pressures appeared in the latter half of the six month reporting period. While the Greek debt crisis remainedunresolved and conflict in eastern Ukraine continued to smolder, economic data showed improvement across much of the EuropeanUnion. For the six month reporting period, the MSCI Europe Index (net of foreign withholding taxes) returned 6.04%.
Latin AmericaEconomic growth slowed in Latin America late 2014 and into 2015, amid slower export demand and policy uncertainties. Globalweakness in commodities prices put pressure on regional economies throughout South America. In Brazil, growth was weak as con-fidence declined sharply across most sectors of the economy and inflation remained elevated. On the political front, the popularity ofBrazilian President Dilma Rousseff experienced a nose dive in opinion polls, injecting a degree of political uncertainty. Also, financialmarkets were negatively impacted by an investigation into a massive bid-rigging scandal at Brazil’s leading oil company, known asPetrobras. For the six month reporting period, the MSCI Emerging Markets Latin America Index (net of foreign withholding taxes)returned -13.55%.
2 J.P. MORGAN COUNTRY/REGION FUNDS APRIL 30, 2015
JPMorgan Asia Pacific FundF U N D C O M M E N T A R YS IX M ONTHS ENDED APRIL 30 , 2015 (Unaud i ted )
Reporting Period Return:
Fund (Select Class Shares)* . . . . . . . . . . . . . . . . . . . . . . . . . . . . . . . . . . . . . . . . . . . . . . . . . . . . . . . . . . . . . . . . . . . . . . . . . . . 7.64%Morgan Stanley Capital International (“MSCI”) All Country Asia Pacific ex-Japan Index (net of foreign withholding taxes) . . 6.79%
Net Assets as of 4/30/2015 (In Thousands) . . . . . . . . . . . . . . . . . . . . . . . . . . . . . . . . . . . . . . . . . . . . . . . . . . . . . . . . . . . . . . $ 9,506
INVESTMENT OBJECTIVE**The JPMorgan Asia Pacific Fund (the “Fund”) seeks to providelong-term capital growth.
WHAT WERE THE MAIN DRIVERS OF THE FUND’SPERFORMANCE?The Fund’s Select Class Shares outperformed the MSCI AllCountry Asia Pacific ex-Japan Index (net of foreign withholdingtaxes) (the “Benchmark”) for the six months ended April 30,2015.
The Fund’s security selection in India and Australia and its allo-cation to Malaysia were leading contributors to performancerelative to the Benchmark for the six month reporting period.The Fund’s security selection in China was the largest detractorfrom relative performance. The Fund’s allocation to Indonesiamarginally detracted from relative performance.
Leading individual contributors to the Fund’s relative perform-ance included its overweight positions in China Resources LandLtd., New China Life Insurance Co. and Ping An Insurance GroupCo. All three companies operate in China’s financial servicessector, which benefitted from Chinese government efforts tocounter slowing economic growth, in part by easing lendingrules.
Leading individual detractors from relative performanceincluded the Fund’s lack of holdings in Hong Kong Exchanges &Clearing Ltd., China Life Insurance Co. and Hanergy Thin FilmPower Group Ltd. Shares of Hong Kong Exchanges, which oper-ates securities exchanges, rose on an expanded cross-tradingagreement with the Shenzhen securities exchange. Shares ofChina Life rose on Chinese government stimulus that reducedfunding costs. Shares of Hanergy Thin Film, a maker of solarenergy technology, also rose during the six month reportingperiod.
HOW WAS THE FUND POSITIONED?During the reporting period, the Fund employed bottom-upsecurity selection based on a systematic approach of findingwhat the Fund’s portfolio managers believed were securitiesthat had attractive momentum characteristics, as well as secu-rities that they believed were attractively valued and funda-mentally strong. At the end of the reporting period, the Fundwas overweight versus the Benchmark in China by a large
margin, and the next largest overweight position was in thePhilippines. The Fund was underweight in Malaysia andAustralia. By sector, the Fund was overweight in theinformation technology and health care sectors and wasunderweight in the consumer staples and industrials sectors.
TOP TEN EQUITY HOLDINGS OF THE PORTFOLIO***
1. Samsung Electronics Co., Ltd. (South Korea) . . . . . . 4.6%2. Taiwan Semiconductor Manufacturing Co., Ltd.
(Taiwan) . . . . . . . . . . . . . . . . . . . . . . . . . . . . . . . . . 3.23. Tencent Holdings Ltd. (China) . . . . . . . . . . . . . . . . . 3.24. Commonwealth Bank of Australia (Australia) . . . . . 2.65. AIA Group Ltd. (Hong Kong) . . . . . . . . . . . . . . . . . . 2.66. China Mobile Ltd. (Hong Kong) . . . . . . . . . . . . . . . . 2.67. China Construction Bank Corp., Class H (China) . . . . 2.38. Bank of China Ltd., Class H (China) . . . . . . . . . . . . . 2.19. Westpac Banking Corp. (Australia) . . . . . . . . . . . . . 2.1
10. Industrial & Commercial Bank of China Ltd., Class H(China) . . . . . . . . . . . . . . . . . . . . . . . . . . . . . . . . . . . 2.0
PORTFOLIO COMPOSITION BY COUNTRY***
China . . . . . . . . . . . . . . . . . . . . . . . . . . . . . . . . . . . . . . . . 20.0%Australia . . . . . . . . . . . . . . . . . . . . . . . . . . . . . . . . . . . . . 19.5Hong Kong . . . . . . . . . . . . . . . . . . . . . . . . . . . . . . . . . . . 18.2South Korea . . . . . . . . . . . . . . . . . . . . . . . . . . . . . . . . . . 14.6Taiwan . . . . . . . . . . . . . . . . . . . . . . . . . . . . . . . . . . . . . . 10.0India . . . . . . . . . . . . . . . . . . . . . . . . . . . . . . . . . . . . . . . . 7.2Philippines . . . . . . . . . . . . . . . . . . . . . . . . . . . . . . . . . . . 2.5Indonesia . . . . . . . . . . . . . . . . . . . . . . . . . . . . . . . . . . . . 2.2Singapore . . . . . . . . . . . . . . . . . . . . . . . . . . . . . . . . . . . . 2.0Thailand . . . . . . . . . . . . . . . . . . . . . . . . . . . . . . . . . . . . . 1.8Others (each less than 1.0%) . . . . . . . . . . . . . . . . . . . . . 2.0
* The return shown is based on net asset values calculated forshareholder transactions and may differ from the return shown inthe financial highlights, which reflects adjustments made to thenet asset values in accordance with accounting principlesgenerally accepted in the United States of America.
** The adviser seeks to achieve the Fund’s objective. There can beno guarantee it will be achieved.
*** Percentages indicated are based on total investments as ofApril 30, 2015. The Fund’s portfolio composition is subject tochange.
APRIL 30, 2015 J.P. MORGAN COUNTRY/REGION FUNDS 3
JPMorgan Asia Pacific FundF U N D C O M M E N T A R YS IX M ONTHS ENDED APRIL 30 , 2015 (Unaud i ted ) ( con t inued )
AVERAGE ANNUAL TOTAL RETURNS AS OF APRIL 30, 2015
INCEPTION DATE OFCLASS 6 MONTH* 1 YEAR 3 YEAR
SINCEINCEPTION
CLASS A SHARES November 30, 2011Without Sales Charge 7.52% 12.64% 8.44% 10.47%With Sales Charge** 1.87 6.74 6.50 8.74
CLASS C SHARES November 30, 2011Without CDSC 7.24 12.06 7.88 9.91With CDSC*** 6.24 11.06 7.88 9.91
SELECT CLASS SHARES November 30, 2011 7.64 12.93 8.70 10.74
* Not annualized.** Sales Charge for Class A Shares is 5.25%.
*** Assumes a 1% CDSC (contingent deferred sales charge) for the one year period and 0% CDSC thereafter.
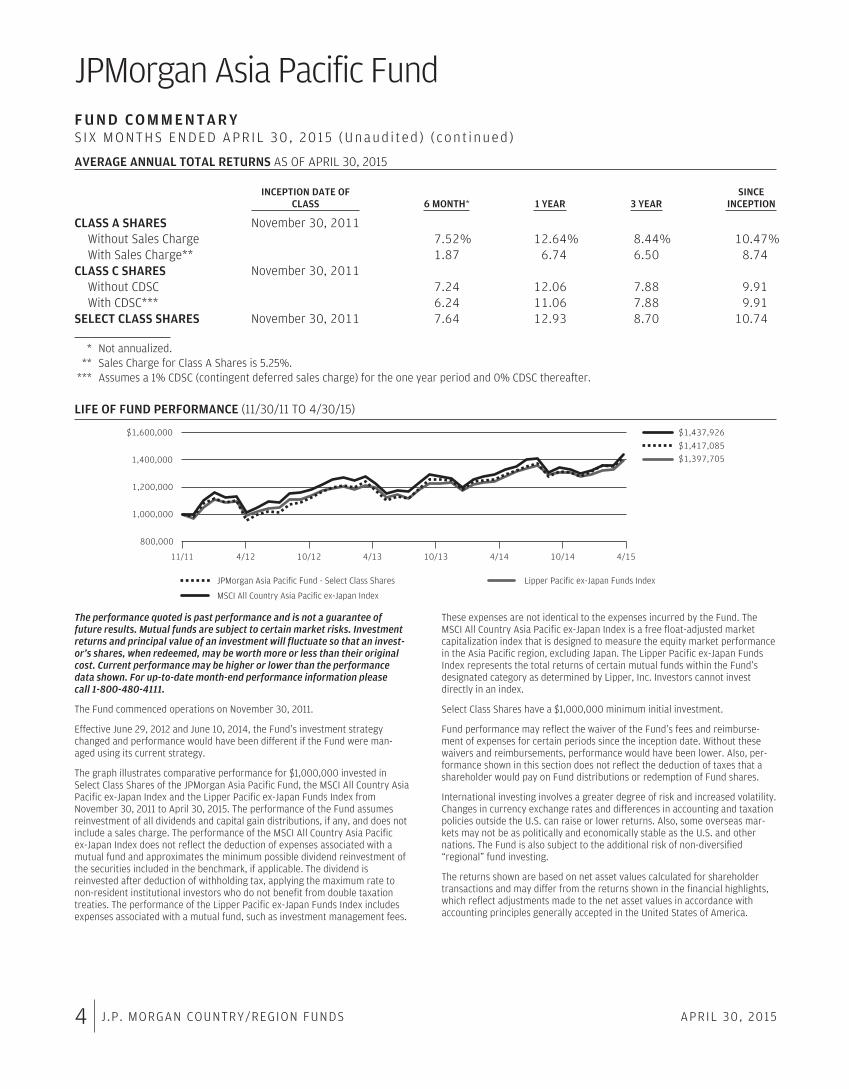
LIFE OF FUND PERFORMANCE (11/30/11 TO 4/30/15)
800,000
1,000,000
1,200,000
$1,600,000
1,400,000
11/11 4/12 10/12 4/13 10/13 4/14 10/14 4/15
$1,397,705
$1,437,926
$1,417,085
JPMorgan Asia Pacific Fund - Select Class Shares
MSCI All Country Asia Pacific ex-Japan Index
Lipper Pacific ex-Japan Funds Index
The performance quoted is past performance and is not a guarantee offuture results. Mutual funds are subject to certain market risks. Investmentreturns and principal value of an investment will fluctuate so that an invest-or’s shares, when redeemed, may be worth more or less than their originalcost. Current performance may be higher or lower than the performancedata shown. For up-to-date month-end performance information pleasecall 1-800-480-4111.
The Fund commenced operations on November 30, 2011.
Effective June 29, 2012 and June 10, 2014, the Fund’s investment strategychanged and performance would have been different if the Fund were man-aged using its current strategy.
The graph illustrates comparative performance for $1,000,000 invested inSelect Class Shares of the JPMorgan Asia Pacific Fund, the MSCI All Country AsiaPacific ex-Japan Index and the Lipper Pacific ex-Japan Funds Index fromNovember 30, 2011 to April 30, 2015. The performance of the Fund assumesreinvestment of all dividends and capital gain distributions, if any, and does notinclude a sales charge. The performance of the MSCI All Country Asia Pacificex-Japan Index does not reflect the deduction of expenses associated with amutual fund and approximates the minimum possible dividend reinvestment ofthe securities included in the benchmark, if applicable. The dividend isreinvested after deduction of withholding tax, applying the maximum rate tonon-resident institutional investors who do not benefit from double taxationtreaties. The performance of the Lipper Pacific ex-Japan Funds Index includesexpenses associated with a mutual fund, such as investment management fees.
These expenses are not identical to the expenses incurred by the Fund. TheMSCI All Country Asia Pacific ex-Japan Index is a free float-adjusted marketcapitalization index that is designed to measure the equity market performancein the Asia Pacific region, excluding Japan. The Lipper Pacific ex-Japan FundsIndex represents the total returns of certain mutual funds within the Fund’sdesignated category as determined by Lipper, Inc. Investors cannot investdirectly in an index.
Select Class Shares have a $1,000,000 minimum initial investment.
Fund performance may reflect the waiver of the Fund’s fees and reimburse-ment of expenses for certain periods since the inception date. Without thesewaivers and reimbursements, performance would have been lower. Also, per-formance shown in this section does not reflect the deduction of taxes that ashareholder would pay on Fund distributions or redemption of Fund shares.
International investing involves a greater degree of risk and increased volatility.Changes in currency exchange rates and differences in accounting and taxationpolicies outside the U.S. can raise or lower returns. Also, some overseas mar-kets may not be as politically and economically stable as the U.S. and othernations. The Fund is also subject to the additional risk of non-diversified“regional” fund investing.
The returns shown are based on net asset values calculated for shareholdertransactions and may differ from the returns shown in the financial highlights,which reflect adjustments made to the net asset values in accordance withaccounting principles generally accepted in the United States of America.
4 J.P. MORGAN COUNTRY/REGION FUNDS APRIL 30, 2015
JPMorgan China Region FundF U N D C O M M E N T A R YS IX M ONTHS ENDED APRIL 30 , 2015 (Unaud i ted )
Reporting Period Return:
Fund (Select Class Shares)* . . . . . . . . . . . . . . . . . . . . . . . . . . . . . . . . . . . . . . . . . . . . . . . . . . . . . . . . . . . . . . . . . . . . . . . . . 18.78%Morgan Stanley Capital International (“MSCI”) Golden Dragon Index (net of foreign withholding taxes) . . . . . . . . . . . . . . 19.12%
Net Assets as of 4/30/2015 (In Thousands) . . . . . . . . . . . . . . . . . . . . . . . . . . . . . . . . . . . . . . . . . . . . . . . . . . . . . . . . . . . . $390,480
INVESTMENT OBJECTIVE**The JPMorgan China Region Fund (the “Fund”) will seek long-term capital growth.
WHAT WERE THE MAIN DRIVERS OF THE FUND’SPERFORMANCE?The Fund’s Select Class Shares underperformed the MSCIGolden Dragon Index (net of foreign withholding taxes) (the“Benchmark”) for the six months ended April 30, 2015.
The Fund’s security selection in China was a leading detractorfrom performance relative to the Benchmark during the sixmonth reporting period. The Fund’s security selection in Taiwanand its overweight position in China was a leading positivecontributor to relative performance.
Leading individual detractors from relative performanceincluded the Fund’s overweight position in MGM China HoldingsLtd. and its lack of positions in China Life Insurance Co. andBank of China Ltd. Shares of MGM China Holdings, a Macaucasino operator, fell as the Chinese government’s efforts tocurb corruption reduced casino traffic among wealthy custom-ers. Shares of both China Life Insurance and Bank of China roseas Chinese government stimulus efforts reduced their fundingcosts.
Leading individual contributors to relative performanceincluded the Fund’s overweight positions Ping An Insurance Co.and China Merchants Bank Co. and its lack of a position in HonHai Precision Industry Co. Shares of both Ping An InsuranceGroup, a Chinese insurer, and China Merchants Bank, a Chinesecommercial bank, rose as Chinese government stimulusreduced their funding costs. Shares of Hon Hai Precision, aTaiwanese consumer electronics maker, fell on the company’sforecast for slower growth in the second quarter of 2015.
HOW WAS THE FUND POSITIONED?The Fund’s portfolio managers employed a bottom-up funda-mental approach to security selection, rigorously researching
companies in an attempt to determine their underlying valueand potential for future earnings growth. The portfolio manag-ers sought opportunities in the environmental, health care andtechnology sectors, as well as in nascent consumer sectors andChinese financial companies that benefitted from governmentstimulus efforts.
TOP TEN EQUITY HOLDINGS OF THE PORTFOLIO***
1. Tencent Holdings Ltd. (China) . . . . . . . . . . . . . . . . . 7.5%2. Taiwan Semiconductor Manufacturing Co., Ltd.,
ADR (Taiwan) . . . . . . . . . . . . . . . . . . . . . . . . . . . . . . 6.43. China Construction Bank Corp., Class H (China) . . . . 5.14. AIA Group Ltd. (Hong Kong) . . . . . . . . . . . . . . . . . . 4.85. Ping An Insurance Group Co. of China Ltd., Class H
(China) . . . . . . . . . . . . . . . . . . . . . . . . . . . . . . . . . . . 4.26. CK Hutchison Holdings Ltd. (Hong Kong) . . . . . . . . . 3.87. China Pacific Insurance Group Co., Ltd., Class H
(China) . . . . . . . . . . . . . . . . . . . . . . . . . . . . . . . . . . . 2.88. China Merchants Bank Co., Ltd., Class H (China) . . . 2.89. China Petroleum & Chemical Corp., Class H
(China) . . . . . . . . . . . . . . . . . . . . . . . . . . . . . . . . . . . 2.810. Fubon Financial Holding Co., Ltd. (Taiwan) . . . . . . . 2.2
PORTFOLIO COMPOSITION BY COUNTRY***
China . . . . . . . . . . . . . . . . . . . . . . . . . . . . . . . . . . . . . . . . 52.0%Hong Kong . . . . . . . . . . . . . . . . . . . . . . . . . . . . . . . . . . . 25.7Taiwan . . . . . . . . . . . . . . . . . . . . . . . . . . . . . . . . . . . . . . 22.3
* The return shown is based on net asset values calculated forshareholder transactions and may differ from the return shown inthe financial highlights, which reflects adjustments made to thenet asset values in accordance with accounting principles gen-erally accepted in the United States of America.
** The adviser seeks to achieve the Fund’s objective. There can beno guarantee it will be achieved.
*** Percentages indicated are based on total investments as ofApril 30, 2015. The Fund’s portfolio composition is subject tochange.
APRIL 30, 2015 J.P. MORGAN COUNTRY/REGION FUNDS 5
JPMorgan China Region FundF U N D C O M M E N T A R YS IX M ONTHS ENDED APRIL 30 , 2015 (Unaud i ted ) ( con t inued )
AVERAGE ANNUAL TOTAL RETURNS AS OF APRIL 30, 2015
INCEPTION DATE OFCLASS 6 MONTH* 1 YEAR 5 YEAR
SINCEINCEPTION
CLASS A SHARES February 28, 2007Without Sales Charge 18.64% 31.02% 8.97% 7.38%With Sales Charge** 12.41 24.17 7.79 6.67
CLASS C SHARES February 28, 2007Without CDSC 18.36 30.37 8.42 6.84With CDSC*** 17.36 29.37 8.42 6.84
SELECT CLASS SHARES February 28, 2007 18.78 31.28 9.24 7.64
* Not annualized.** Sales Charge for Class A Shares is 5.25%.
*** Assumes a 1% CDSC (contingent deferred sales charge) for the one year period and 0% CDSC thereafter.
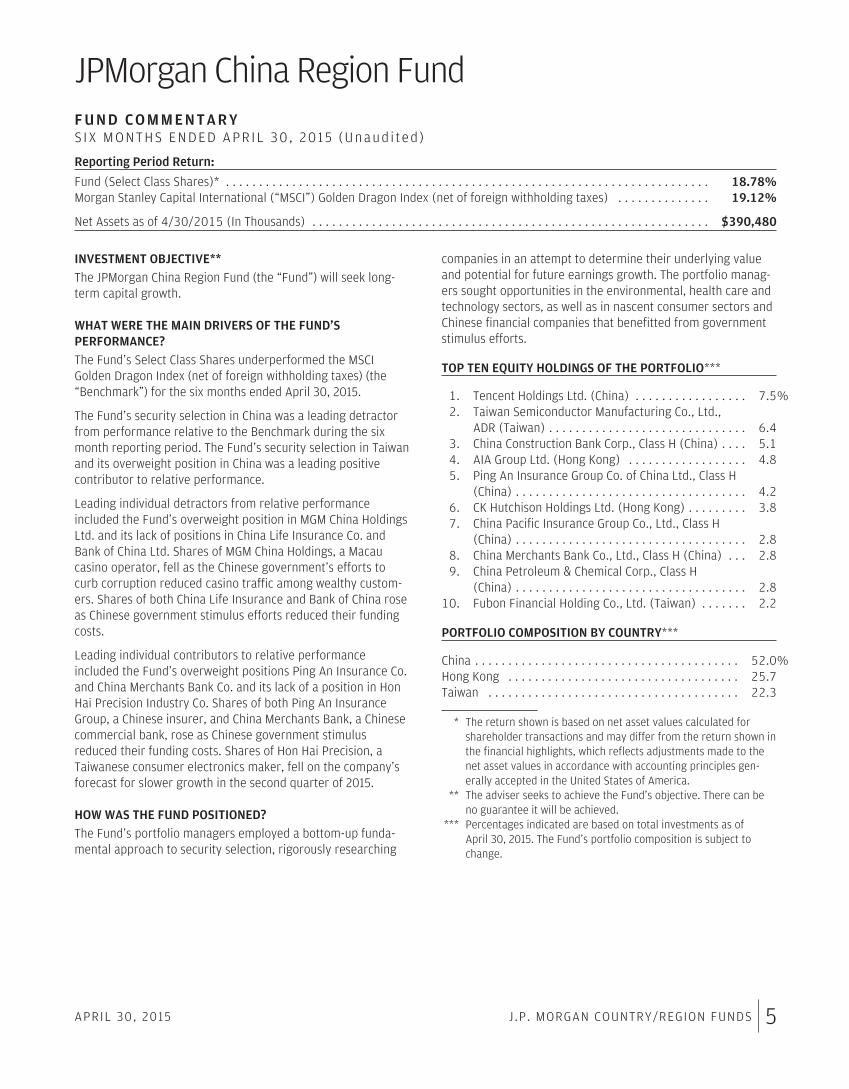
LIFE OF FUND PERFORMANCE (2/28/07 TO 4/30/15)
500,000
1,000,000
1,500,000
$2,000,000
4/154/134/124/114/104/094/08 4/14
$1,880,280
$1,824,406$1,832,265
JPMorgan China Region Fund - Select Class Shares
MSCI Golden Dragon Index
Lipper China Region Funds Index
4/072/07
The performance quoted is past performance and is not a guarantee offuture results. Mutual funds are subject to certain market risks. Investmentreturns and principal value of an investment will fluctuate so that an invest-or’s shares, when redeemed, may be worth more or less than their originalcost. Current performance may be higher or lower than the performancedata shown. For up-to-date month-end performance information pleasecall 1-800-480-4111.
The Fund commenced operations on February 28, 2007.
The graph illustrates comparative performance for $1,000,000 invested inSelect Class Shares of the JPMorgan China Region Fund, the MSCI GoldenDragon Index and the Lipper China Region Funds Index from February 28, 2007to April 30, 2015. The performance of the Fund assumes reinvestment of alldividends and capital gain distributions, if any, and does not include a salescharge. The performance of the MSCI Golden Dragon Index does not reflect thededuction of expenses or a sales charge associated with a mutual fund andapproximates the minimum possible dividend reinvestment of the securitiesincluded in the benchmark, if applicable. The dividend is reinvested afterdeduction of withholding tax, applying the maximum rate to non-residentindividual investors who do not benefit from double taxation treaties. The per-formance of the Lipper China Region Funds Index includes expenses associatedwith a mutual fund, such as investment management fees. These expenses arenot identical to the expenses incurred by the Fund. The MSCI Golden Dragon
Index is a free float-adjusted market capitalization index that is designed tomeasure equity market performance in the China region. The Lipper ChinaRegion Funds Index represents the total returns of certain mutual funds withinthe Fund’s designated category as determined by Lipper, Inc. Investors cannotinvest directly in an index.
Select Class Shares have a $1,000,000 minimum initial investment.
Fund performance may reflect the waiver of the Fund’s fees and reimburse-ment of expenses for certain periods since the inception date. Without thesewaivers and reimbursements, performance would have been lower. Also, per-formance shown in this section does not reflect the deduction of taxes that ashareholder would pay on Fund distributions or redemption of Fund shares.
International investing involves a greater degree of risk and increased volatility.Changes in currency exchange rates and differences in accounting and taxationpolicies outside the U.S. can raise or lower returns. Also, some overseas mar-kets may not be as politically and economically stable as the U.S. and othernations. The Fund is also subject to the additional risk of non-diversified“regional” fund investing.
The returns shown are based on net asset values calculated for shareholdertransactions and may differ from the returns shown in the financial highlights,which reflect adjustments made to the net asset values in accordance withaccounting principles generally accepted in the United States of America.
6 J.P. MORGAN COUNTRY/REGION FUNDS APRIL 30, 2015
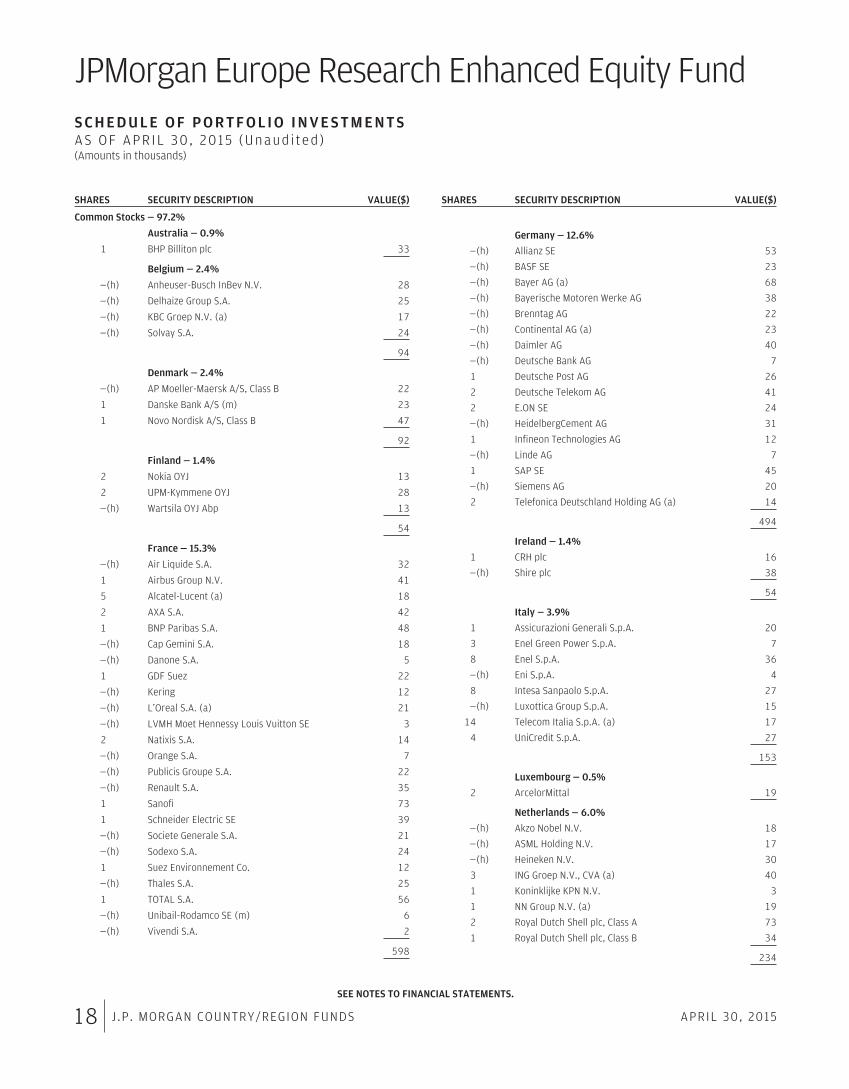
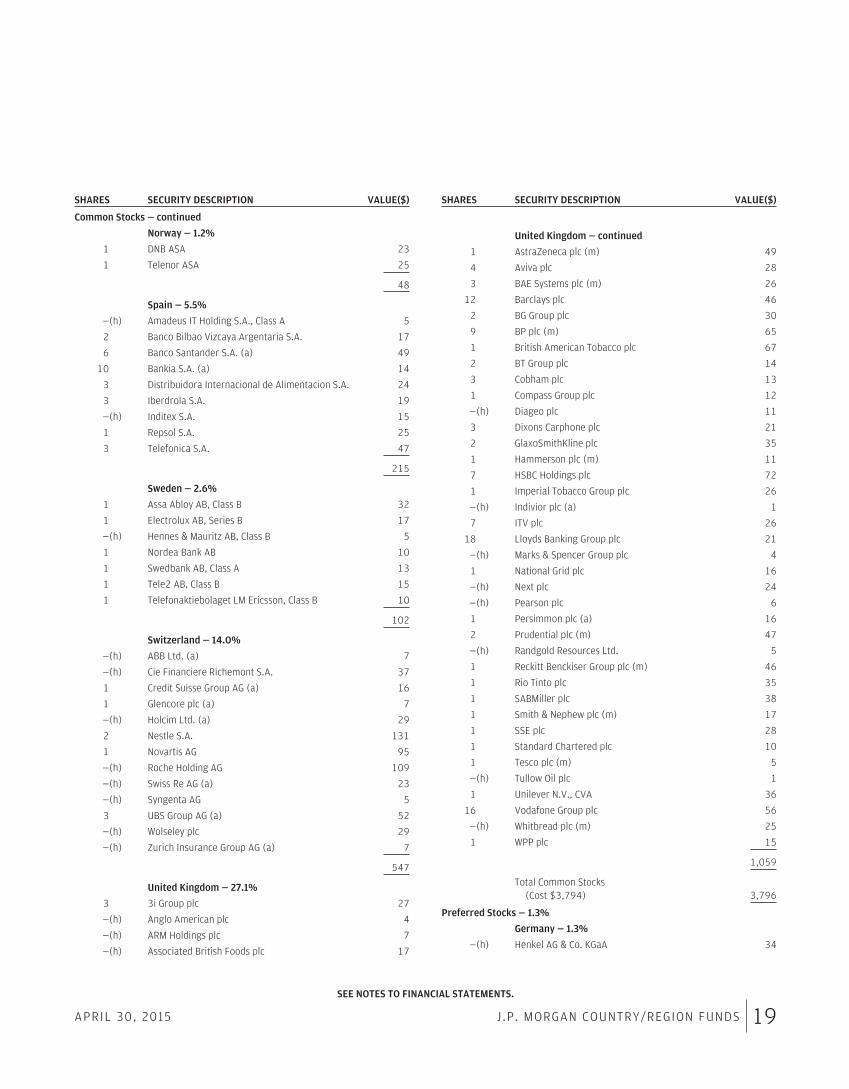
JPMorgan Europe Research Enhanced Equity FundF U N D C O M M E N T A R YS IX M ONTHS ENDED APRIL 30 , 2015 (Unaud i ted )
Reporting Period Return:
Fund (Select Class Shares)* . . . . . . . . . . . . . . . . . . . . . . . . . . . . . . . . . . . . . . . . . . . . . . . . . . . . . . . . . . . . . . . . . . . . . . . . . . . 5.60%Morgan Stanley Capital International (“MSCI”) Europe Index (net of foreign withholding taxes) . . . . . . . . . . . . . . . . . . . . . . 6.04%
Net Assets as of 4/30/2015 (In Thousands) . . . . . . . . . . . . . . . . . . . . . . . . . . . . . . . . . . . . . . . . . . . . . . . . . . . . . . . . . . . . . . $ 3,906
INVESTMENT OBJECTIVE**The JPMorgan Europe Research Enhanced Equity Fund (the“Fund”) seeks to provide long-term capital appreciation.
WHAT WERE THE MAIN DRIVERS OF THE FUND’SPERFORMANCE?The Fund’s Select Class Shares underperformed the MSCIEurope Index (net of foreign withholding taxes) (the“Benchmark”) for the six months ended April 30, 2015.
The Fund’s security selection in the insurance sector and thetransport services & trading sector detracted from relativeperformance, while the Fund’s security selection in the banksand oil sectors contributed to performance relative to theBenchmark for the six month reporting period.
Leading individual detractors from relative performanceincluded the Fund’s overweight positions in Bankia SA,SABMiller PLC and Kering SA. Shares of Bankia, a Spanishcommercial bank, declined on disappointing results for the firstquarter of 2015. Shares of SABMiller, a U.K. brewing and bev-erages company, fell after a decline in sales in key Europeanmarkets. Shares of Kering, a French distributor of retail andluxury goods, fell on a bigger-than-expected drop in first quar-ter 2015 sales of its flagship Gucci brand.
Leading individual contributors to relative performanceincluded the Fund’s overweight positions in 3i Group PLC,Renault SA and Thales SA. Shares of 3i Group, a U.K. invest-ment management company, rose on increased global mergersand acquisitions activity. Shares of Renault, a French auto-maker, rose as European auto sales picked up and the companycontinued to cut costs. Shares of Thales, a French provider ofsecurity systems to the aerospace and defense industries, roseon increased demand for information security systems.
HOW WAS THE FUND POSITIONED?The Fund’s portfolio managers conducted in-depth funda-mental research into individual securities and ranked securitieswithin each economic sector according to what they believed tobe their relative value. During the reporting period, the Fund’sportfolio managers sought to overweight positions relative tothe Benchmark in securities that they believed were under-valued and underweighted or did not hold positions relative tothe Benchmark in securities they believed to be overvalued.
INFORMATION ABOUT YOUR FUNDAt a May 2015 meeting, the Board of Trustees of the Fundapproved the liquidation of the Fund, which was scheduled tooccur on or about June 15, 2015.
TOP TEN EQUITY HOLDINGS OF THE PORTFOLIO***
1. Nestle S.A. (Switzerland) . . . . . . . . . . . . . . . . . . . . . 3.4%2. Roche Holding AG (Switzerland) . . . . . . . . . . . . . . . 2.83. Novartis AG (Switzerland) . . . . . . . . . . . . . . . . . . . . 2.54. Royal Dutch Shell plc, Class A (Netherlands) . . . . . . 1.95. Sanofi (France) . . . . . . . . . . . . . . . . . . . . . . . . . . . . 1.96. HSBC Holdings plc (United Kingdom) . . . . . . . . . . . 1.97. Bayer AG (Germany) . . . . . . . . . . . . . . . . . . . . . . . . 1.88. British American Tobacco plc (United Kingdom) . . . 1.79. BP plc (United Kingdom) . . . . . . . . . . . . . . . . . . . . . 1.7
10. Vodafone Group plc (United Kingdom) . . . . . . . . . . 1.5
PORTFOLIO COMPOSITION BY COUNTRY***
United Kingdom . . . . . . . . . . . . . . . . . . . . . . . . . . . . . . . 27.5%France . . . . . . . . . . . . . . . . . . . . . . . . . . . . . . . . . . . . . . . 15.5Germany . . . . . . . . . . . . . . . . . . . . . . . . . . . . . . . . . . . . . 14.2Switzerland . . . . . . . . . . . . . . . . . . . . . . . . . . . . . . . . . . . 14.2Netherlands . . . . . . . . . . . . . . . . . . . . . . . . . . . . . . . . . . 6.1Spain . . . . . . . . . . . . . . . . . . . . . . . . . . . . . . . . . . . . . . . . 5.6Italy . . . . . . . . . . . . . . . . . . . . . . . . . . . . . . . . . . . . . . . . . 4.0Sweden . . . . . . . . . . . . . . . . . . . . . . . . . . . . . . . . . . . . . . 2.7Belgium . . . . . . . . . . . . . . . . . . . . . . . . . . . . . . . . . . . . . . 2.4Denmark . . . . . . . . . . . . . . . . . . . . . . . . . . . . . . . . . . . . . 2.4Finland . . . . . . . . . . . . . . . . . . . . . . . . . . . . . . . . . . . . . . 1.4Ireland . . . . . . . . . . . . . . . . . . . . . . . . . . . . . . . . . . . . . . 1.4Norway . . . . . . . . . . . . . . . . . . . . . . . . . . . . . . . . . . . . . . 1.2Others (each less than 1.0%) . . . . . . . . . . . . . . . . . . . . . 1.4
* The return shown is based on net asset values calculated forshareholder transactions and may differ from the return shown inthe financial highlights, which reflects adjustments made to thenet asset values in accordance with accounting principles gen-erally accepted in the United States of America.
** The adviser seeks to achieve the Fund’s objective. There can beno guarantee it will be achieved.
*** Percentages indicated are based on total investments as ofApril 30, 2015. The Fund’s portfolio composition is subject tochange.
APRIL 30, 2015 J.P. MORGAN COUNTRY/REGION FUNDS 7
JPMorgan Europe Research Enhanced Equity FundF U N D C O M M E N T A R YS IX M ONTHS ENDED APRIL 30 , 2015 (Unaud i ted ) ( con t inued )
TOTAL RETURNS AS OF APRIL 30, 2015
INCEPTION DATE OFCLASS 6 MONTH*
SINCEINCEPTION
CLASS A SHARES September 15, 2014Without Sales Charge 5.45% (0.32)%With Sales Charge** (0.12) (5.54)
CLASS C SHARES September 15, 2014Without CDSC 5.22 (0.60)With CDSC*** 4.22 (1.60)
SELECT CLASS SHARES September 15, 2014 5.60 (0.18)
* Not annualized.** Sales Charge for Class A Shares is 5.25%.
*** Assumes a 1% CDSC (contingent deferred sales charge) for the one year period and 0% CDSC thereafter.
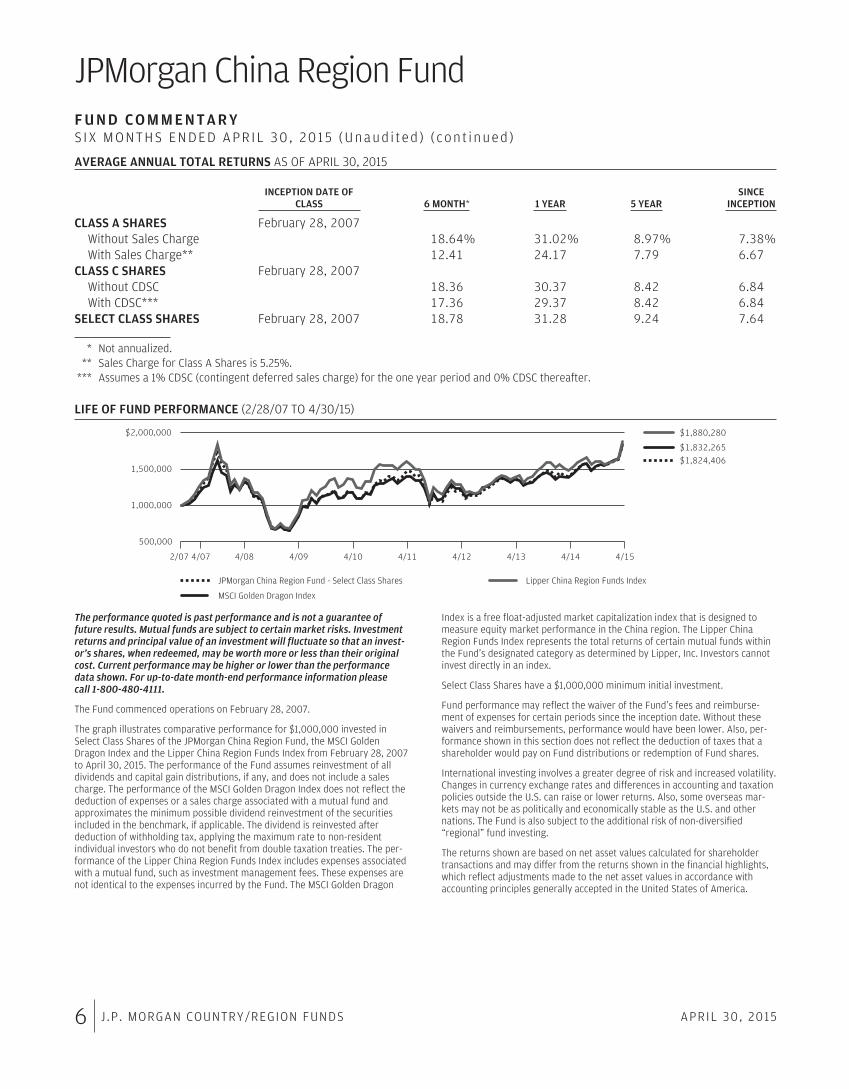
LIFE OF FUND PERFORMANCE (9/15/14 TO 4/30/15)
800,000
1,000,000
$1,200,000
4/159/15/14 9/14 1/15 3/1510/14 11/14 12/14 2/15
$ 998,226
$1,004,893
JPMorgan Europe Research Enhanced Equity Fund - Select Class Shares
MSCI Europe Index (net of foreign withholding taxes)
The performance quoted is past performance and is not a guarantee offuture results. Mutual funds are subject to certain market risks. Investmentreturns and principal value of an investment will fluctuate so that an invest-or’s shares, when redeemed, may be worth more or less than their originalcost. Current performance may be higher or lower than the performancedata shown. For up-to-date month-end performance information please call1-800-480-4111.
The Fund commenced operations on September 15, 2014.
The graph illustrates comparative performance for $1,000,000 invested inSelect Class Shares of the JPMorgan Europe Research Enhanced Equity Fundand the MSCI Europe Index from September 15, 2014 to April 30, 2015. Theperformance of the Fund assumes reinvestment of all dividends and capitalgain distributions, if any, and does not include a sales charge. The performanceof the MSCI Europe Index does not reflect the deduction of expenses or a salescharge associated with a mutual fund and approximates the minimum possibledividend reinvestment of the securities included in the benchmark, if appli-cable. The dividend is reinvested after deduction of withholding tax, applyingthe maximum rate to non-resident individual investors who do not benefit fromdouble taxation treaties. The MSCI Europe Index is a free float-adjusted marketcapitalization weighted index that is designed to measure the equity marketperformance of the developed markets in Europe. Investors cannot investdirectly in an index.
Select Class Shares have a $1,000,000 minimum initial investment.
Fund performance may reflect the waiver of the Fund’s fees and reimburse-ment of expenses for certain periods since the inception date. Without thesewaivers and reimbursements, performance would have been lower. Also, per-formance shown in this section does not reflect the deduction of taxes that ashareholder would pay on Fund distributions or redemption of Fund shares.
International investing involves a greater degree of risk and increased volatility.Changes in currency exchange rates and differences in accounting and taxationpolicies outside the U.S. can raise or lower returns. Also, some overseas mar-kets may not be as politically and economically stable as the U.S. and othernations.
The returns shown are based on net asset values calculated for shareholdertransactions and may differ from the returns shown in the financial highlights,which reflect adjustments made to the net asset values in accordance withaccounting principles generally accepted in the United States of America.
The MSCI information may only be used for your internal use, may not be repro-duced or redisseminated in any form and may not be used as a basis for or acomponent of any financial instruments or products or indices. None of theMSCI information is intended to constitute investment advice or a recom-mendation to make (or refrain from making) any kind of investment decisionand may not be relied on as such. Historical data and analysis should not betaken as an indication or guarantee of any future performance analysis, fore-cast or prediction. The MSCI information is provided on an ‘‘as is’’ basis and theuser of this information assumes the entire risk of any use made of thisinformation. MSCI, each of its affiliates and each other person involved in orrelated to compiling, computing or creating any MSCI information (collectively,the ‘‘MSCI Parties’’) expressly disclaims all warranties (including, without limi-tation, any warranties of originality, accuracy, completeness, timeliness, non-infringement, merchantability and fitness for a particular purpose) with respectto this information. Without limiting any of the foregoing, in no event shall anyMSCI Party have any liability for any direct, indirect, special, incidental, punitive,consequential (including, without limitation, lost profits) or any other damages.(www.msci.com)
8 J.P. MORGAN COUNTRY/REGION FUNDS APRIL 30, 2015
JPMorgan Intrepid European FundF U N D C O M M E N T A R YS IX M ONTHS ENDED APRIL 30 , 2015 (Unaud i ted )
Reporting Period Return:
Fund (Class A Shares, without a sales charge)* . . . . . . . . . . . . . . . . . . . . . . . . . . . . . . . . . . . . . . . . . . . . . . . . . . . . . . . . 5.52%Morgan Stanley Capital International (“MSCI”) Europe Index (net of foreign withholding taxes) . . . . . . . . . . . . . . . . . . . 6.04%
Net Assets as of 4/30/2015 (In Thousands) . . . . . . . . . . . . . . . . . . . . . . . . . . . . . . . . . . . . . . . . . . . . . . . . . . . . . . . . . . $1,105,708
INVESTMENT OBJECTIVE**The JPMorgan Intrepid European Fund (the “Fund”) seeks totalreturn from long-term capital growth. Total return consists ofcapital growth and current income.
WHAT WERE THE MAIN DRIVERS OF THE FUND’SPERFORMANCE?The Fund’s Class A Shares, without a sales charge, under-performed the MSCI Europe Index (net of foreign withholdingtaxes) (the “Benchmark”) for the six months ended April 30,2015.
The Fund’s security selection in the financials and tele-communication services sectors was a leading detractor fromperformance relative to the Benchmark for the six monthreporting period. The Fund’s security selection in the healthcare sector and its underweight position in the energy sectorwere leading contributors to relative performance.
Individual detractors from relative performance included theFund’s overweight positions in Atos SE, Telefonica SA andBankia SA. Shares of Atos, a French information technologycompany, fell after the company reported fourth quarter2014 revenue growth and cash generation that were belowinvestor expectations. Shares of Telefonica, a Spanish tele-communications company, fell after BT Group PLC declined toacquire Telefonica’s U.K. mobile telephony business. Shares ofBankia, a Spanish commercial bank, declined on disappointingresults for the first quarter of 2015.
Individual contributors to relative performance included theFund’s overweight positions in Cap Gemini SA, DialogSemiconductor PLC and International Consolidate AirlinesGroup SA. Shares of Cap Gemini, a French provider of technol-ogy consulting, outsourcing and professional services, rose onstrong revenue growth, particularly in North America, in thefirst quarter of 2015. Shares of Dialog Semiconductor, a Ger-man maker of integrated circuits for mobile technology, roseon solid earnings for the final quarter of 2014 and the compa-ny’s growth forecast for 2015. Shares of InternationalConsolidated Airlines, the U.K. operator of British Airways andIberia airline, rose after the company posted a first quarter2015 profit on improved North American operations and lowerfuel costs.
HOW WAS THE FUND POSITIONED?The Fund’s portfolio managers believe that attractively valued,high quality securities with positive momentum have thepotential to outperform the market. During the reportingperiod, the Fund’s portfolio managers invested in securitiesthat they believed had these style characteristics. Portfoliopositions were based on bottom-up security selection ratherthan top-down asset allocation decisions.
TOP TEN EQUITY HOLDINGS OF THE PORTFOLIO***
1. Novo Nordisk A/S, Class B (Denmark) . . . . . . . . . . . 2.9%2. ING Groep N.V., CVA (Netherlands) . . . . . . . . . . . . . 2.43. Cap Gemini S.A. (France) . . . . . . . . . . . . . . . . . . . . . 2.24. BT Group plc (United Kingdom) . . . . . . . . . . . . . . . . 2.15. Novartis AG (Switzerland) . . . . . . . . . . . . . . . . . . . . 2.16. Natixis S.A. (France) . . . . . . . . . . . . . . . . . . . . . . . . 2.07. Reckitt Benckiser Group plc (United Kingdom) . . . . 1.98. Pandora A/S (Denmark) . . . . . . . . . . . . . . . . . . . . . 1.89. Prudential plc (United Kingdom) . . . . . . . . . . . . . . . 1.8
10. Continental AG (Germany) . . . . . . . . . . . . . . . . . . . . 1.7
PORTFOLIO COMPOSITION BY COUNTRY***
United Kingdom . . . . . . . . . . . . . . . . . . . . . . . . . . . . . . . 26.7%France . . . . . . . . . . . . . . . . . . . . . . . . . . . . . . . . . . . . . . . 19.7Germany . . . . . . . . . . . . . . . . . . . . . . . . . . . . . . . . . . . . . 14.3Switzerland . . . . . . . . . . . . . . . . . . . . . . . . . . . . . . . . . . . 8.1Denmark . . . . . . . . . . . . . . . . . . . . . . . . . . . . . . . . . . . . . 7.3Netherlands . . . . . . . . . . . . . . . . . . . . . . . . . . . . . . . . . . 7.1Ireland . . . . . . . . . . . . . . . . . . . . . . . . . . . . . . . . . . . . . . 5.7Belgium . . . . . . . . . . . . . . . . . . . . . . . . . . . . . . . . . . . . . . 4.9Spain . . . . . . . . . . . . . . . . . . . . . . . . . . . . . . . . . . . . . . . . 1.7Luxembourg . . . . . . . . . . . . . . . . . . . . . . . . . . . . . . . . . . 1.0Others (each less than 1.0%) . . . . . . . . . . . . . . . . . . . . . 1.1Short-Term Investment . . . . . . . . . . . . . . . . . . . . . . . . . . 2.4
* The return shown is based on net asset values calculated forshareholder transactions and may differ from the return shown inthe financial highlights, which reflects adjustments made to thenet asset values in accordance with accounting principles gen-erally accepted in the United States of America.
** The adviser seeks to achieve the Fund’s objective. There can beno guarantee it will be achieved.
*** Percentages indicated are based on total investments as ofApril 30, 2015. The Fund’s portfolio composition is subject tochange.
APRIL 30, 2015 J.P. MORGAN COUNTRY/REGION FUNDS 9
JPMorgan Intrepid European FundF U N D C O M M E N T A R YS IX M ONTHS ENDED APRIL 30 , 2015 (Unaud i ted ) ( con t inued )
AVERAGE ANNUAL TOTAL RETURNS AS OF APRIL 30, 2015
INCEPTION DATE OFCLASS 6 MONTH* 1 YEAR 5 YEAR 10 YEAR
CLASS A SHARES November 2, 1995Without Sales Charge 5.52% (3.84)% 10.00% 7.22%With Sales Charge** (0.02) (8.88) 8.82 6.65
CLASS B SHARES November 3, 1995Without CDSC 5.26 (4.32) 9.45 6.78With CDSC*** 0.26 (9.32) 9.17 6.78
CLASS C SHARES November 1, 1998Without CDSC 5.28 (4.29) 9.46 6.69With CDSC**** 4.28 (5.29) 9.46 6.69
INSTITUTIONAL CLASS SHARES September 10, 2001 5.79 (3.39) 10.53 7.72SELECT CLASS SHARES September 10, 2001 5.76 (3.52) 10.29 7.50
* Not annualized.** Sales Charge for Class A Shares is 5.25%.
*** Assumes a 5% CDSC (contingent deferred sales charge) for the one year period, 2% CDSC for the five year period and 0% CDSC thereafter.**** Assumes a 1% CDSC for the one year period and 0% CDSC thereafter.
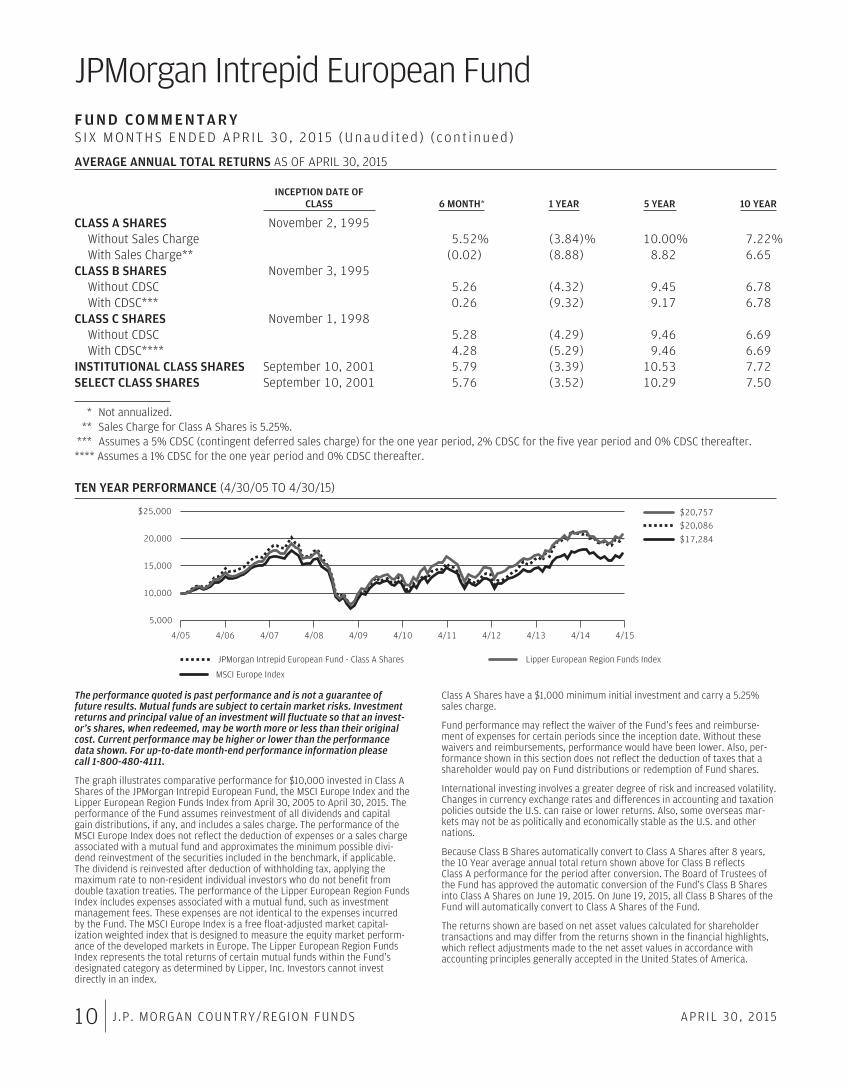
TEN YEAR PERFORMANCE (4/30/05 TO 4/30/15)
5,000
10,000
15,000
20,000
$25,000
4/154/134/124/114/104/094/084/074/064/05 4/14
$20,757
$17,284
$20,086
JPMorgan Intrepid European Fund - Class A Shares
MSCI Europe Index
Lipper European Region Funds Index
The performance quoted is past performance and is not a guarantee offuture results. Mutual funds are subject to certain market risks. Investmentreturns and principal value of an investment will fluctuate so that an invest-or’s shares, when redeemed, may be worth more or less than their originalcost. Current performance may be higher or lower than the performancedata shown. For up-to-date month-end performance information pleasecall 1-800-480-4111.
The graph illustrates comparative performance for $10,000 invested in Class AShares of the JPMorgan Intrepid European Fund, the MSCI Europe Index and theLipper European Region Funds Index from April 30, 2005 to April 30, 2015. Theperformance of the Fund assumes reinvestment of all dividends and capitalgain distributions, if any, and includes a sales charge. The performance of theMSCI Europe Index does not reflect the deduction of expenses or a sales chargeassociated with a mutual fund and approximates the minimum possible divi-dend reinvestment of the securities included in the benchmark, if applicable.The dividend is reinvested after deduction of withholding tax, applying themaximum rate to non-resident individual investors who do not benefit fromdouble taxation treaties. The performance of the Lipper European Region FundsIndex includes expenses associated with a mutual fund, such as investmentmanagement fees. These expenses are not identical to the expenses incurredby the Fund. The MSCI Europe Index is a free float-adjusted market capital-ization weighted index that is designed to measure the equity market perform-ance of the developed markets in Europe. The Lipper European Region FundsIndex represents the total returns of certain mutual funds within the Fund’sdesignated category as determined by Lipper, Inc. Investors cannot investdirectly in an index.
Class A Shares have a $1,000 minimum initial investment and carry a 5.25%sales charge.
Fund performance may reflect the waiver of the Fund’s fees and reimburse-ment of expenses for certain periods since the inception date. Without thesewaivers and reimbursements, performance would have been lower. Also, per-formance shown in this section does not reflect the deduction of taxes that ashareholder would pay on Fund distributions or redemption of Fund shares.
International investing involves a greater degree of risk and increased volatility.Changes in currency exchange rates and differences in accounting and taxationpolicies outside the U.S. can raise or lower returns. Also, some overseas mar-kets may not be as politically and economically stable as the U.S. and othernations.
Because Class B Shares automatically convert to Class A Shares after 8 years,the 10 Year average annual total return shown above for Class B reflectsClass A performance for the period after conversion. The Board of Trustees ofthe Fund has approved the automatic conversion of the Fund’s Class B Sharesinto Class A Shares on June 19, 2015. On June 19, 2015, all Class B Shares of theFund will automatically convert to Class A Shares of the Fund.
The returns shown are based on net asset values calculated for shareholdertransactions and may differ from the returns shown in the financial highlights,which reflect adjustments made to the net asset values in accordance withaccounting principles generally accepted in the United States of America.
10 J.P. MORGAN COUNTRY/REGION FUNDS APRIL 30, 2015
JPMorgan Latin America FundF U N D C O M M E N T A R YS IX M ONTHS ENDED APRIL 30 , 2015 (Unaud i ted )
Reporting Period Return:
Fund (Class A Shares, without a sales charge)* . . . . . . . . . . . . . . . . . . . . . . . . . . . . . . . . . . . . . . . . . . . . . . . . . . . . . . . . . (14.91)%Morgan Stanley Capital International (“MSCI”) Emerging Markets (“EM”) Latin America Index (net of foreignwithholding taxes) . . . . . . . . . . . . . . . . . . . . . . . . . . . . . . . . . . . . . . . . . . . . . . . . . . . . . . . . . . . . . . . . . . . . . . . . . . . . . . . (13.55)%
Net Assets as of 4/30/2015 (In Thousands) . . . . . . . . . . . . . . . . . . . . . . . . . . . . . . . . . . . . . . . . . . . . . . . . . . . . . . . . . . . $ 87,346
INVESTMENT OBJECTIVE**The JPMorgan Latin America Fund (the “Fund”) seeks long-termcapital growth.
WHAT WERE THE MAIN DRIVERS OF THE FUND’SPERFORMANCE?The Fund’s Class A Shares, without a sales charge, under-performed the MSCI EM Latin America Index (net of foreignwithholding taxes) (the “Benchmark”) for the six months ended
April 30, 2015. The Fund’s security selection detracted fromperformance relative to the Benchmark for the six monthreporting period, particularly in the information technology andconsumer discretionary sectors. The Fund’s underweight posi-tion in the energy and telecommunication services sectors wasa leading positive contributor to relative performance.
Leading individual detractors from the Fund’s relative perform-ance included its overweight positions in Estacio ParticipacoesSA and Mexichem SAB and its lack of a position in GrupoTelevisa SAB. Shares of Estacio Participacoes, a Brazilian pri-vate education company, declined after the Brazilian govern-ment revised its student loan program that reduced studentapplications. Shares of Mexichem, a Mexican petrochemicalcompany, fell on a decline in profit for the first quarter of 2015.Shares of Grupo Televisa, a Mexican television broadcastingcompany, rose on strong revenue growth for the first quarterof 2015.
Leading individual contributors to the Fund’s relative perform-ance included its underweight positions in Petroleo BrasileiroSA (Petrobras) and Vale SA and its overweight positions inLojas Renner SA. Shares of Petrobras, a Brazilian integrated oiland gas company, fell on weakness in global oil prices and anongoing corruption scandal. Shares of Vale, a Brazilian metalsand mining company, fell on weakness in global prices for ironore. The Fund’s lack of positions in both Petrobras and Valehelped relative performance. Shares of Lojas Renner, a Brazil-ian department store operator, rose on better-than-expectedresults for the first quarter of 2015.
HOW WAS THE FUND POSITIONED?During the reporting period, the Fund employed a strategy inwhich portfolio construction was focused on the opportunitiesat the security level. The Fund’s portfolio managers used
bottom-up fundamental research to determine the Fund’s secu-rity weightings, rigorously researching companies in anattempt to determine their underlying value and potential forfuture growth. As a result of this process, at the end of thereporting period, the Fund’s largest overweight versus theBenchmark was in the industrials sector and the Fund’s largestunderweight versus the Benchmark was in the energy sector.
TOP TEN EQUITY HOLDINGS OF THE PORTFOLIO***
1. Itau Unibanco Holding S.A. (Preference Shares),ADR (Brazil) . . . . . . . . . . . . . . . . . . . . . . . . . . . . . . . 6.3%
2. Banco Bradesco S.A., ADR (Brazil) . . . . . . . . . . . . . . 5.73. AMBEV S.A., ADR (Brazil) . . . . . . . . . . . . . . . . . . . . 4.54. Credicorp Ltd. (Peru) . . . . . . . . . . . . . . . . . . . . . . . . 3.95. Cemex S.A.B. de C.V., ADR (Mexico) . . . . . . . . . . . . 3.46. Fomento Economico Mexicano S.A.B. de C.V., ADR
(Mexico) . . . . . . . . . . . . . . . . . . . . . . . . . . . . . . . . . 3.27. Copa Holdings S.A., Class A (Panama) . . . . . . . . . . . 2.88. Itausa-Investimentos Itau S.A. (Brazil) . . . . . . . . . . 2.89. BB Seguridade Participacoes S.A. (Brazil) . . . . . . . . 2.6
10. Lojas Renner S.A. (Brazil) . . . . . . . . . . . . . . . . . . . . 2.6
PORTFOLIO COMPOSITION BY COUNTRY***
Brazil . . . . . . . . . . . . . . . . . . . . . . . . . . . . . . . . . . . . . . . . 54.0%Mexico . . . . . . . . . . . . . . . . . . . . . . . . . . . . . . . . . . . . . . . 29.0Peru . . . . . . . . . . . . . . . . . . . . . . . . . . . . . . . . . . . . . . . . 5.3Chile . . . . . . . . . . . . . . . . . . . . . . . . . . . . . . . . . . . . . . . . 2.9Panama . . . . . . . . . . . . . . . . . . . . . . . . . . . . . . . . . . . . . . 2.8United States . . . . . . . . . . . . . . . . . . . . . . . . . . . . . . . . . . 2.3Spain . . . . . . . . . . . . . . . . . . . . . . . . . . . . . . . . . . . . . . . . 1.1Others (each less than 1.0%) . . . . . . . . . . . . . . . . . . . . . 1.5Short-Term Investment . . . . . . . . . . . . . . . . . . . . . . . . . . 1.1
* The return shown is based on net asset values calculated forshareholder transactions and may differ from the return shown inthe financial highlights, which reflects adjustments made to thenet asset values in accordance with accounting principles gen-erally accepted in the United States of America.
** The adviser seeks to achieve the Fund’s objective. There can beno guarantee it will be achieved.
*** Percentages indicated are based on total investments as ofApril 30, 2015. The Fund’s portfolio composition is subject tochange.
APRIL 30, 2015 J.P. MORGAN COUNTRY/REGION FUNDS 11
JPMorgan Latin America FundF U N D C O M M E N T A R YS IX M ONTHS ENDED APRIL 30 , 2015 (Unaud i ted ) ( con t inued )
AVERAGE ANNUAL TOTAL RETURNS AS OF APRIL 30, 2015
INCEPTION DATE OFCLASS 6 MONTH* 1 YEAR 5 YEAR
SINCEINCEPTION
CLASS A SHARES February 28, 2007Without Sales Charge (14.91)% (16.25)% (4.02)% 1.24%With Sales Charge** (19.39) (20.64) (5.05) 0.58
CLASS C SHARES February 28, 2007Without CDSC (15.06) (16.62) (4.48) 0.75With CDSC*** (16.06) (17.62) (4.48) 0.75
SELECT CLASS SHARES February 28, 2007 (14.78) (16.02) (3.77) 1.50
* Not annualized.** Sales Charge for Class A Shares is 5.25%.
*** Assumes a 1% CDSC (contingent deferred sales charge) for the one year period and 0% CDSC thereafter.
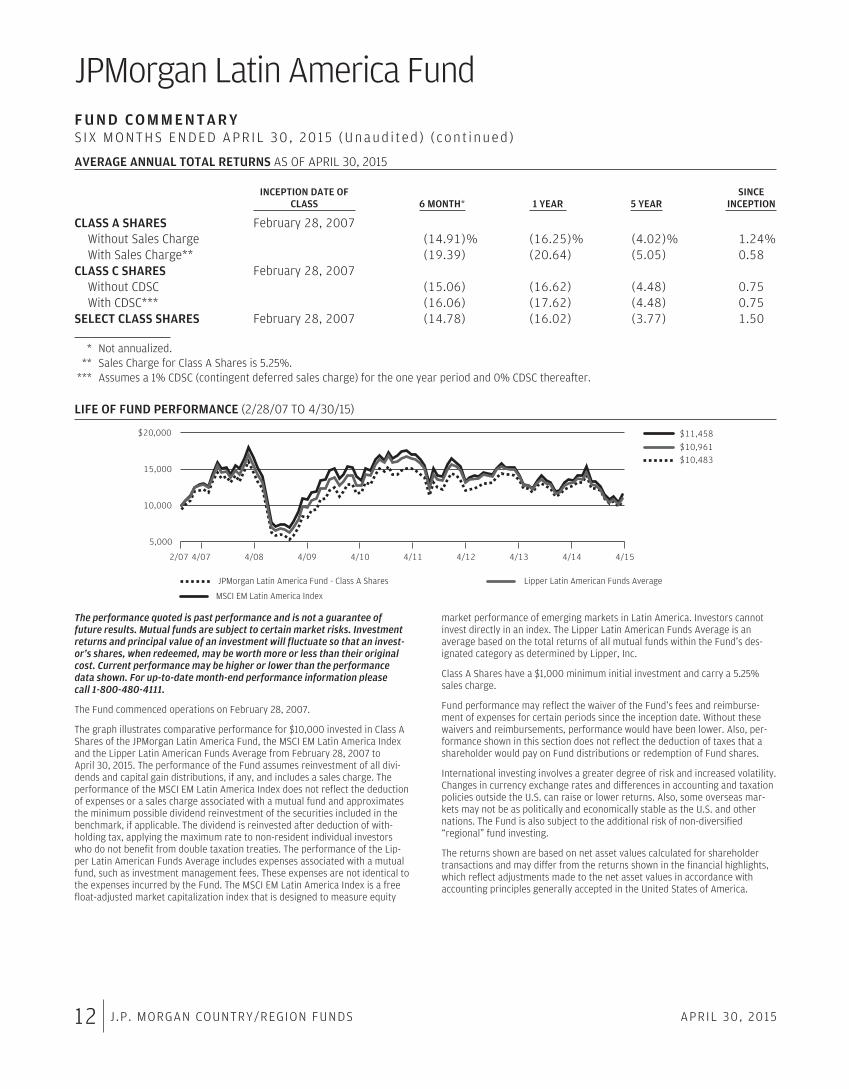
LIFE OF FUND PERFORMANCE (2/28/07 TO 4/30/15)
5,000
10,000
15,000
$20,000
2/07 4/07 4/08 4/09 4/10 4/11 4/12 4/13 4/154/14
$10,961
$11,458
$10,483
JPMorgan Latin America Fund - Class A Shares
MSCI EM Latin America Index
Lipper Latin American Funds Average
The performance quoted is past performance and is not a guarantee offuture results. Mutual funds are subject to certain market risks. Investmentreturns and principal value of an investment will fluctuate so that an invest-or’s shares, when redeemed, may be worth more or less than their originalcost. Current performance may be higher or lower than the performancedata shown. For up-to-date month-end performance information pleasecall 1-800-480-4111.
The Fund commenced operations on February 28, 2007.
The graph illustrates comparative performance for $10,000 invested in Class AShares of the JPMorgan Latin America Fund, the MSCI EM Latin America Indexand the Lipper Latin American Funds Average from February 28, 2007 toApril 30, 2015. The performance of the Fund assumes reinvestment of all divi-dends and capital gain distributions, if any, and includes a sales charge. Theperformance of the MSCI EM Latin America Index does not reflect the deductionof expenses or a sales charge associated with a mutual fund and approximatesthe minimum possible dividend reinvestment of the securities included in thebenchmark, if applicable. The dividend is reinvested after deduction of with-holding tax, applying the maximum rate to non-resident individual investorswho do not benefit from double taxation treaties. The performance of the Lip-per Latin American Funds Average includes expenses associated with a mutualfund, such as investment management fees. These expenses are not identical tothe expenses incurred by the Fund. The MSCI EM Latin America Index is a freefloat-adjusted market capitalization index that is designed to measure equity
market performance of emerging markets in Latin America. Investors cannotinvest directly in an index. The Lipper Latin American Funds Average is anaverage based on the total returns of all mutual funds within the Fund’s des-ignated category as determined by Lipper, Inc.
Class A Shares have a $1,000 minimum initial investment and carry a 5.25%sales charge.
Fund performance may reflect the waiver of the Fund’s fees and reimburse-ment of expenses for certain periods since the inception date. Without thesewaivers and reimbursements, performance would have been lower. Also, per-formance shown in this section does not reflect the deduction of taxes that ashareholder would pay on Fund distributions or redemption of Fund shares.
International investing involves a greater degree of risk and increased volatility.Changes in currency exchange rates and differences in accounting and taxationpolicies outside the U.S. can raise or lower returns. Also, some overseas mar-kets may not be as politically and economically stable as the U.S. and othernations. The Fund is also subject to the additional risk of non-diversified“regional” fund investing.
The returns shown are based on net asset values calculated for shareholdertransactions and may differ from the returns shown in the financial highlights,which reflect adjustments made to the net asset values in accordance withaccounting principles generally accepted in the United States of America.
12 J.P. MORGAN COUNTRY/REGION FUNDS APRIL 30, 2015
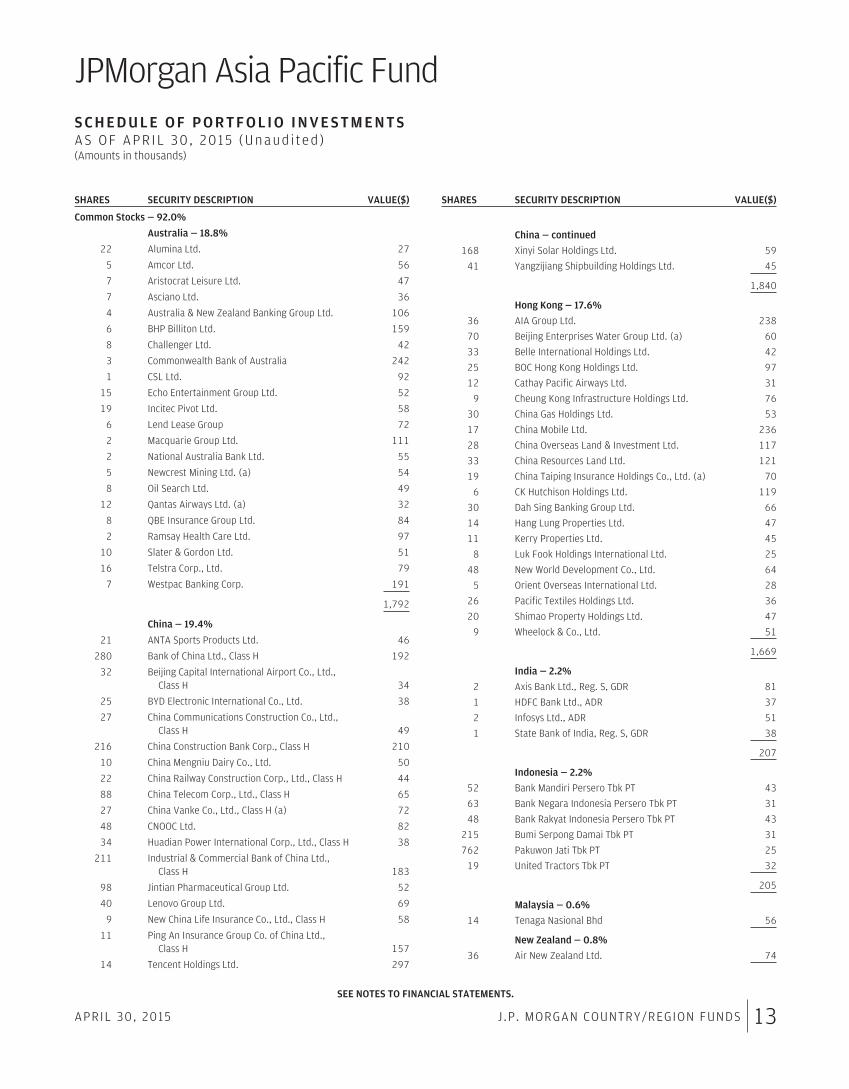
JPMorgan Asia Pacific FundS C H E D U L E O F P O R T F O L I O I N V E S T M E N T SAS OF APR IL 30 , 2015 (Unaud i ted )(Amounts in thousands)
SHARES SECURITY DESCRIPTION VALUE($)
Common Stocks — 92.0%
Australia — 18.8%
22 Alumina Ltd. 27
5 Amcor Ltd. 56
7 Aristocrat Leisure Ltd. 47
7 Asciano Ltd. 36
4 Australia & New Zealand Banking Group Ltd. 106
6 BHP Billiton Ltd. 159
8 Challenger Ltd. 42
3 Commonwealth Bank of Australia 242
1 CSL Ltd. 92
15 Echo Entertainment Group Ltd. 52
19 Incitec Pivot Ltd. 58
6 Lend Lease Group 72
2 Macquarie Group Ltd. 111
2 National Australia Bank Ltd. 55
5 Newcrest Mining Ltd. (a) 54
8 Oil Search Ltd. 49
12 Qantas Airways Ltd. (a) 32
8 QBE Insurance Group Ltd. 84
2 Ramsay Health Care Ltd. 97
10 Slater & Gordon Ltd. 51
16 Telstra Corp., Ltd. 79
7 Westpac Banking Corp. 191
1,792
China — 19.4%
21 ANTA Sports Products Ltd. 46
280 Bank of China Ltd., Class H 192
32 Beijing Capital International Airport Co., Ltd.,Class H 34
25 BYD Electronic International Co., Ltd. 38
27 China Communications Construction Co., Ltd.,Class H 49
216 China Construction Bank Corp., Class H 210
10 China Mengniu Dairy Co., Ltd. 50
22 China Railway Construction Corp., Ltd., Class H 44
88 China Telecom Corp., Ltd., Class H 65
27 China Vanke Co., Ltd., Class H (a) 72
48 CNOOC Ltd. 82
34 Huadian Power International Corp., Ltd., Class H 38
211 Industrial & Commercial Bank of China Ltd.,Class H 183
98 Jintian Pharmaceutical Group Ltd. 52
40 Lenovo Group Ltd. 69
9 New China Life Insurance Co., Ltd., Class H 58
11 Ping An Insurance Group Co. of China Ltd.,Class H 157
14 Tencent Holdings Ltd. 297
SHARES SECURITY DESCRIPTION VALUE($)
China — continued
168 Xinyi Solar Holdings Ltd. 59
41 Yangzijiang Shipbuilding Holdings Ltd. 45
1,840
Hong Kong — 17.6%
36 AIA Group Ltd. 238
70 Beijing Enterprises Water Group Ltd. (a) 60
33 Belle International Holdings Ltd. 42
25 BOC Hong Kong Holdings Ltd. 97
12 Cathay Pacific Airways Ltd. 31
9 Cheung Kong Infrastructure Holdings Ltd. 76
30 China Gas Holdings Ltd. 53
17 China Mobile Ltd. 236
28 China Overseas Land & Investment Ltd. 117
33 China Resources Land Ltd. 121
19 China Taiping Insurance Holdings Co., Ltd. (a) 70
6 CK Hutchison Holdings Ltd. 119
30 Dah Sing Banking Group Ltd. 66
14 Hang Lung Properties Ltd. 47
11 Kerry Properties Ltd. 45
8 Luk Fook Holdings International Ltd. 25
48 New World Development Co., Ltd. 64
5 Orient Overseas International Ltd. 28
26 Pacific Textiles Holdings Ltd. 36
20 Shimao Property Holdings Ltd. 47
9 Wheelock & Co., Ltd. 51
1,669
India — 2.2%
2 Axis Bank Ltd., Reg. S, GDR 81
1 HDFC Bank Ltd., ADR 37
2 Infosys Ltd., ADR 51
1 State Bank of India, Reg. S, GDR 38
207
Indonesia — 2.2%
52 Bank Mandiri Persero Tbk PT 43
63 Bank Negara Indonesia Persero Tbk PT 31
48 Bank Rakyat Indonesia Persero Tbk PT 43
215 Bumi Serpong Damai Tbk PT 31
762 Pakuwon Jati Tbk PT 25
19 United Tractors Tbk PT 32
205
Malaysia — 0.6%
14 Tenaga Nasional Bhd 56
New Zealand — 0.8%
36 Air New Zealand Ltd. 74
SEE NOTES TO FINANCIAL STATEMENTS.
APRIL 30, 2015 J.P. MORGAN COUNTRY/REGION FUNDS 13
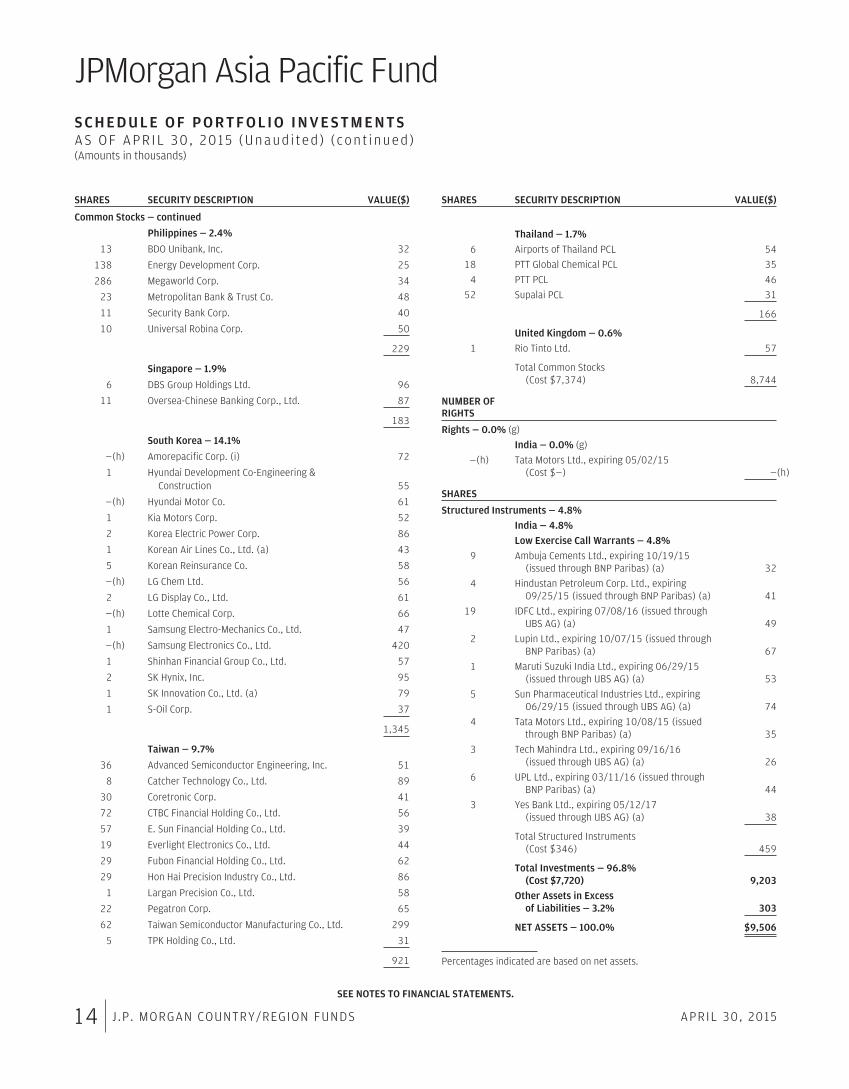
JPMorgan Asia Pacific FundS C H E D U L E O F P O R T F O L I O I N V E S T M E N T SAS OF APR IL 30 , 2015 (Unaud i ted ) ( con t inued )(Amounts in thousands)
SHARES SECURITY DESCRIPTION VALUE($)
Common Stocks — continued
Philippines — 2.4%
13 BDO Unibank, Inc. 32
138 Energy Development Corp. 25
286 Megaworld Corp. 34
23 Metropolitan Bank & Trust Co. 48
11 Security Bank Corp. 40
10 Universal Robina Corp. 50
229
Singapore — 1.9%
6 DBS Group Holdings Ltd. 96
11 Oversea-Chinese Banking Corp., Ltd. 87
183
South Korea — 14.1%
—(h) Amorepacific Corp. (i) 72
1 Hyundai Development Co-Engineering &Construction 55
—(h) Hyundai Motor Co. 61
1 Kia Motors Corp. 52
2 Korea Electric Power Corp. 86
1 Korean Air Lines Co., Ltd. (a) 43
5 Korean Reinsurance Co. 58
—(h) LG Chem Ltd. 56
2 LG Display Co., Ltd. 61
—(h) Lotte Chemical Corp. 66
1 Samsung Electro-Mechanics Co., Ltd. 47
—(h) Samsung Electronics Co., Ltd. 420
1 Shinhan Financial Group Co., Ltd. 57
2 SK Hynix, Inc. 95
1 SK Innovation Co., Ltd. (a) 79
1 S-Oil Corp. 37
1,345
Taiwan — 9.7%
36 Advanced Semiconductor Engineering, Inc. 51
8 Catcher Technology Co., Ltd. 89
30 Coretronic Corp. 41
72 CTBC Financial Holding Co., Ltd. 56
57 E. Sun Financial Holding Co., Ltd. 39
19 Everlight Electronics Co., Ltd. 44
29 Fubon Financial Holding Co., Ltd. 62
29 Hon Hai Precision Industry Co., Ltd. 86
1 Largan Precision Co., Ltd. 58
22 Pegatron Corp. 65
62 Taiwan Semiconductor Manufacturing Co., Ltd. 299
5 TPK Holding Co., Ltd. 31
921
SHARES SECURITY DESCRIPTION VALUE($)
Thailand — 1.7%
6 Airports of Thailand PCL 54
18 PTT Global Chemical PCL 35
4 PTT PCL 46
52 Supalai PCL 31
166
United Kingdom — 0.6%
1 Rio Tinto Ltd. 57
Total Common Stocks(Cost $7,374) 8,744
NUMBER OFRIGHTS
Rights — 0.0% (g)
India — 0.0% (g)
—(h) Tata Motors Ltd., expiring 05/02/15(Cost $—) —(h)
SHARES
Structured Instruments — 4.8%
India — 4.8%
Low Exercise Call Warrants — 4.8%
9 Ambuja Cements Ltd., expiring 10/19/15(issued through BNP Paribas) (a) 32
4 Hindustan Petroleum Corp. Ltd., expiring09/25/15 (issued through BNP Paribas) (a) 41
19 IDFC Ltd., expiring 07/08/16 (issued throughUBS AG) (a) 49
2 Lupin Ltd., expiring 10/07/15 (issued throughBNP Paribas) (a) 67
1 Maruti Suzuki India Ltd., expiring 06/29/15(issued through UBS AG) (a) 53
5 Sun Pharmaceutical Industries Ltd., expiring06/29/15 (issued through UBS AG) (a) 74
4 Tata Motors Ltd., expiring 10/08/15 (issuedthrough BNP Paribas) (a) 35
3 Tech Mahindra Ltd., expiring 09/16/16(issued through UBS AG) (a) 26
6 UPL Ltd., expiring 03/11/16 (issued throughBNP Paribas) (a) 44
3 Yes Bank Ltd., expiring 05/12/17(issued through UBS AG) (a) 38
Total Structured Instruments(Cost $346) 459
Total Investments — 96.8%(Cost $7,720) 9,203
Other Assets in Excessof Liabilities — 3.2% 303
NET ASSETS — 100.0% $9,506
Percentages indicated are based on net assets.
SEE NOTES TO FINANCIAL STATEMENTS.
14 J.P. MORGAN COUNTRY/REGION FUNDS APRIL 30, 2015
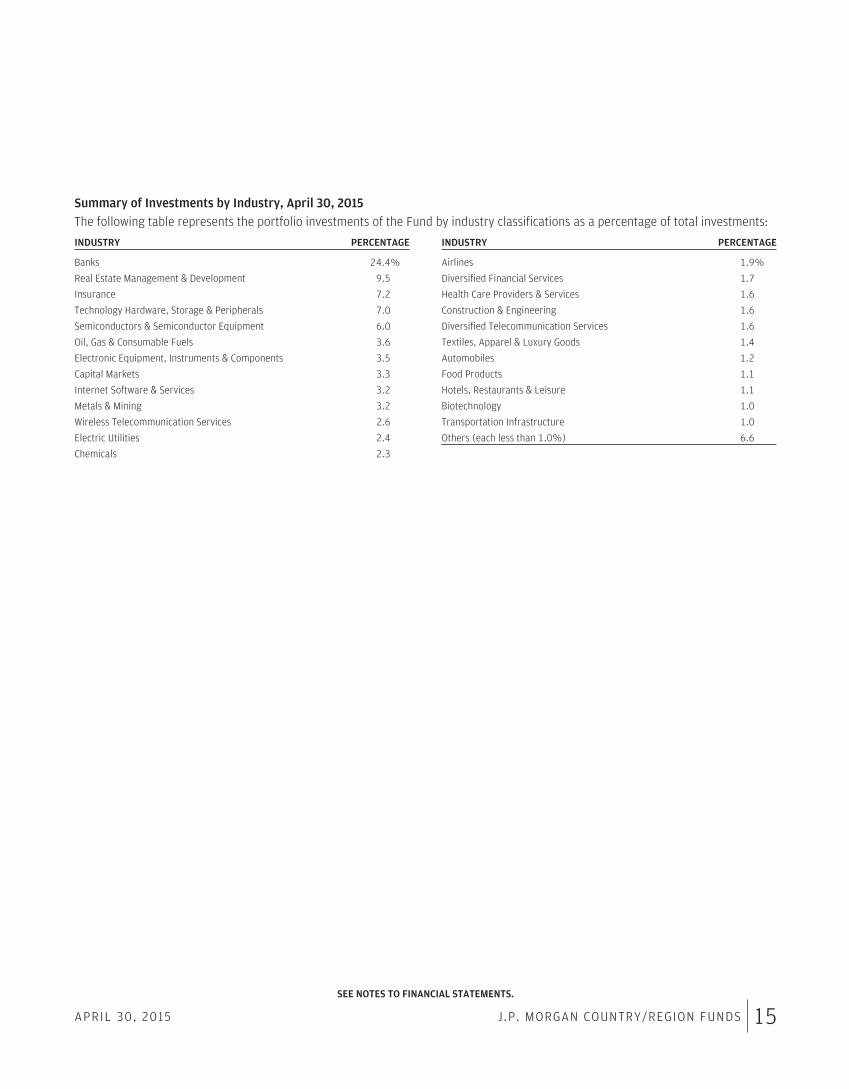
Summary of Investments by Industry, April 30, 2015The following table represents the portfolio investments of the Fund by industry classifications as a percentage of total investments:
INDUSTRY PERCENTAGE
Banks 24.4%
Real Estate Management & Development 9.5
Insurance 7.2
Technology Hardware, Storage & Peripherals 7.0
Semiconductors & Semiconductor Equipment 6.0
Oil, Gas & Consumable Fuels 3.6
Electronic Equipment, Instruments & Components 3.5
Capital Markets 3.3
Internet Software & Services 3.2
Metals & Mining 3.2
Wireless Telecommunication Services 2.6
Electric Utilities 2.4
Chemicals 2.3
INDUSTRY PERCENTAGE
Airlines 1.9%
Diversified Financial Services 1.7
Health Care Providers & Services 1.6
Construction & Engineering 1.6
Diversified Telecommunication Services 1.6
Textiles, Apparel & Luxury Goods 1.4
Automobiles 1.2
Food Products 1.1
Hotels, Restaurants & Leisure 1.1
Biotechnology 1.0
Transportation Infrastructure 1.0
Others (each less than 1.0%) 6.6
SEE NOTES TO FINANCIAL STATEMENTS.
APRIL 30, 2015 J.P. MORGAN COUNTRY/REGION FUNDS 15

JPMorgan China Region FundS C H E D U L E O F P O R T F O L I O I N V E S T M E N T SAS OF APR IL 30 , 2015 (Unaud i ted )(Amounts in thousands)
SHARES SECURITY DESCRIPTION VALUE($)
Common Stocks — 97.8%
China — 49.9%
459 AAC Technologies Holdings, Inc. 2,423
13,890 Agricultural Bank of China Ltd., Class H 7,820
22 Alibaba Group Holding Ltd., ADR (a) 1,807
3,674 Angang Steel Co., Ltd., Class H 3,053
2,368 CAR, Inc. (a) 5,597
5,332 China Cinda Asset Management Co., Ltd.,Class H (a) 3,164
6,255 China CITIC Bank Corp., Ltd., Class H 5,672
961 China Conch Venture Holdings Ltd. 2,579
20,358 China Construction Bank Corp., Class H 19,762
3,841 China Longyuan Power Group Corp., Ltd., Class H 4,760
1,918 China Machinery Engineering Corp., Class H 2,546
875 China Mengniu Dairy Co., Ltd. 4,431
3,632 China Merchants Bank Co., Ltd., Class H 10,900
4,033 China Minsheng Banking Corp., Ltd., Class H 5,888
2,039 China Pacific Insurance Group Co., Ltd., Class H 11,052
11,380 China Petroleum & Chemical Corp., Class H 10,740
9,628 China Telecom Corp., Ltd., Class H 7,133
2,866 China Vanke Co., Ltd., Class H (a) 7,591
1,351 Chongqing Changan Automobile Co., Ltd., Class B 4,431
2,888 CNOOC Ltd. 4,925
3,384 CSPC Pharmaceutical Group Ltd. 3,519
790 Fuyao Glass Industry Group Co., Ltd.,Class H (a) (e) 1,983
108 iKang Healthcare Group, Inc., ADR (a) 1,887
1,174 Jiangxi Copper Co., Ltd., Class H 2,423
1,946 MGM China Holdings Ltd. 3,673
1,902 Phoenix Healthcare Group Co., Ltd. 3,924
1,146 Ping An Insurance Group Co. of China Ltd.,Class H 16,382
4,026 Sunac China Holdings Ltd. 5,294
1,420 Tencent Holdings Ltd. 29,301
194,660
Hong Kong — 25.6%
2,841 AIA Group Ltd. 18,895
5,014 Beijing Enterprises Water Group Ltd. (a) 4,324
1,674 BOC Hong Kong Holdings Ltd. 6,491
3,083 China Everbright International Ltd. 5,749
475 China Mobile Ltd. 6,777
1,402 China Resources Gas Group Ltd. 4,869
3,404 China Unicom Hong Kong Ltd. (a) 6,393
1,909 Chow Tai Fook Jewellery Group Ltd. 2,310
677 CK Hutchison Holdings Ltd. 14,678
1,779 HKBN Ltd. (a) 2,300
215 Hong Kong Exchanges and Clearing Ltd. 8,177
SHARES SECURITY DESCRIPTION VALUE($)
Hong Kong — (continued)
647 Hongkong Land Holdings Ltd. 5,239
978 Lifestyle International Holdings Ltd. 1,830
595 Orient Overseas International Ltd. 3,652
4,432 Sino Biopharmaceutical Ltd. 5,060
591 Wheelock & Co., Ltd. 3,328
100,072
Taiwan — 22.3%
4,853 Advanced Semiconductor Engineering, Inc. 6,882
620 Catcher Technology Co., Ltd. 7,255
1,395 Chailease Holding Co., Ltd. 3,823
477 China Steel Chemical Corp. 2,316
1,658 Chipbond Technology Corp. 3,583
845 Delta Electronics, Inc. 5,085
6,261 E. Sun Financial Holding Co., Ltd. 4,287
4,026 Fubon Financial Holding Co., Ltd. 8,658
70 Largan Precision Co., Ltd. 7,014
1,061 Nanya Technology Corp. (a) 2,356
519 President Chain Store Corp. 3,841
1,731 Ruentex Development Co., Ltd. 3,077
89 Silicon Motion Technology Corp., ADR 2,602
1,072 Taiwan Semiconductor Manufacturing Co., Ltd.,ADR 26,211
86,990
Total Common Stocks(Cost $267,205) 381,722
NUMBER OFWARRANTS
Warrants — 2.1%
China — 2.1%
557 Hangzhou Hikvision Digital Technology Co., Ltd.,expiring 09/11/15 (Strike Price $0.00) (a) 2,939
102 Spring Airlines Co., Ltd., expiring 05/24/16(Strike Price $0.00) (a) 1,880
706 Zhengzhou Yutong Bus Co., Ltd., expiring01/20/16 (Strike Price $0.00) (a) 3,487
Total Warrants(Cost $7,465) 8,306
Total Investments — 99.9%(Cost $274,670) 390,028
Other Assets in Excess ofLiabilities — 0.1% 452
NET ASSETS — 100.0% $390,480
Percentages indicated are based on net assets.
SEE NOTES TO FINANCIAL STATEMENTS.
16 J.P. MORGAN COUNTRY/REGION FUNDS APRIL 30, 2015
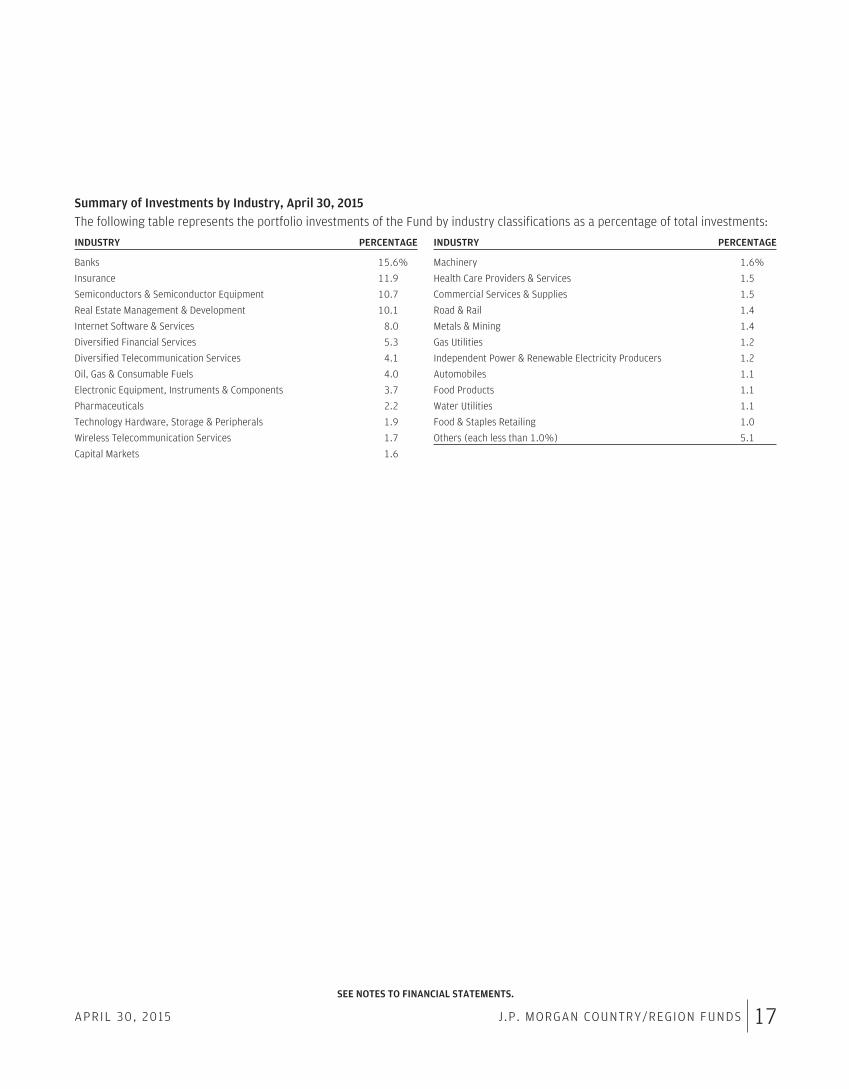
Summary of Investments by Industry, April 30, 2015The following table represents the portfolio investments of the Fund by industry classifications as a percentage of total investments:
INDUSTRY PERCENTAGE
Banks 15.6%
Insurance 11.9
Semiconductors & Semiconductor Equipment 10.7
Real Estate Management & Development 10.1
Internet Software & Services 8.0
Diversified Financial Services 5.3
Diversified Telecommunication Services 4.1
Oil, Gas & Consumable Fuels 4.0
Electronic Equipment, Instruments & Components 3.7
Pharmaceuticals 2.2
Technology Hardware, Storage & Peripherals 1.9
Wireless Telecommunication Services 1.7
Capital Markets 1.6
INDUSTRY PERCENTAGE
Machinery 1.6%
Health Care Providers & Services 1.5
Commercial Services & Supplies 1.5
Road & Rail 1.4
Metals & Mining 1.4
Gas Utilities 1.2
Independent Power & Renewable Electricity Producers 1.2
Automobiles 1.1
Food Products 1.1
Water Utilities 1.1
Food & Staples Retailing 1.0
Others (each less than 1.0%) 5.1
SEE NOTES TO FINANCIAL STATEMENTS.
APRIL 30, 2015 J.P. MORGAN COUNTRY/REGION FUNDS 17
JPMorgan Europe Research Enhanced Equity FundS C H E D U L E O F P O R T F O L I O I N V E S T M E N T SAS OF APR IL 30 , 2015 (Unaud i ted )(Amounts in thousands)
SHARES SECURITY DESCRIPTION VALUE($)
Common Stocks — 97.2%
Australia — 0.9%
1 BHP Billiton plc 33
Belgium — 2.4%
—(h) Anheuser-Busch InBev N.V. 28
—(h) Delhaize Group S.A. 25
—(h) KBC Groep N.V. (a) 17
—(h) Solvay S.A. 24
94
Denmark — 2.4%
—(h) AP Moeller-Maersk A/S, Class B 22
1 Danske Bank A/S (m) 23
1 Novo Nordisk A/S, Class B 47
92
Finland — 1.4%
2 Nokia OYJ 13
2 UPM-Kymmene OYJ 28
—(h) Wartsila OYJ Abp 13
54
France — 15.3%
—(h) Air Liquide S.A. 32
1 Airbus Group N.V. 41
5 Alcatel-Lucent (a) 18
2 AXA S.A. 42
1 BNP Paribas S.A. 48
—(h) Cap Gemini S.A. 18
—(h) Danone S.A. 5
1 GDF Suez 22
—(h) Kering 12
—(h) L’Oreal S.A. (a) 21
—(h) LVMH Moet Hennessy Louis Vuitton SE 3
2 Natixis S.A. 14
—(h) Orange S.A. 7
—(h) Publicis Groupe S.A. 22
—(h) Renault S.A. 35
1 Sanofi 73
1 Schneider Electric SE 39
—(h) Societe Generale S.A. 21
—(h) Sodexo S.A. 24
1 Suez Environnement Co. 12
—(h) Thales S.A. 25
1 TOTAL S.A. 56
—(h) Unibail-Rodamco SE (m) 6
—(h) Vivendi S.A. 2
598
SHARES SECURITY DESCRIPTION VALUE($)
Germany — 12.6%
—(h) Allianz SE 53
—(h) BASF SE 23
—(h) Bayer AG (a) 68
—(h) Bayerische Motoren Werke AG 38
—(h) Brenntag AG 22
—(h) Continental AG (a) 23
—(h) Daimler AG 40
—(h) Deutsche Bank AG 7
1 Deutsche Post AG 26
2 Deutsche Telekom AG 41
2 E.ON SE 24
—(h) HeidelbergCement AG 31
1 Infineon Technologies AG 12
—(h) Linde AG 7
1 SAP SE 45
—(h) Siemens AG 20
2 Telefonica Deutschland Holding AG (a) 14
494
Ireland — 1.4%
1 CRH plc 16
—(h) Shire plc 38
54
Italy — 3.9%
1 Assicurazioni Generali S.p.A. 20
3 Enel Green Power S.p.A. 7
8 Enel S.p.A. 36
—(h) Eni S.p.A. 4
8 Intesa Sanpaolo S.p.A. 27
—(h) Luxottica Group S.p.A. 15
14 Telecom Italia S.p.A. (a) 17
4 UniCredit S.p.A. 27
153
Luxembourg — 0.5%
2 ArcelorMittal 19
Netherlands — 6.0%
—(h) Akzo Nobel N.V. 18
—(h) ASML Holding N.V. 17
—(h) Heineken N.V. 30
3 ING Groep N.V., CVA (a) 40
1 Koninklijke KPN N.V. 3
1 NN Group N.V. (a) 19
2 Royal Dutch Shell plc, Class A 73
1 Royal Dutch Shell plc, Class B 34
234
SEE NOTES TO FINANCIAL STATEMENTS.
18 J.P. MORGAN COUNTRY/REGION FUNDS APRIL 30, 2015
SHARES SECURITY DESCRIPTION VALUE($)
Common Stocks — continued
Norway — 1.2%
1 DNB ASA 23
1 Telenor ASA 25
48
Spain — 5.5%
—(h) Amadeus IT Holding S.A., Class A 5
2 Banco Bilbao Vizcaya Argentaria S.A. 17
6 Banco Santander S.A. (a) 49
10 Bankia S.A. (a) 14
3 Distribuidora Internacional de Alimentacion S.A. 24
3 Iberdrola S.A. 19
—(h) Inditex S.A. 15
1 Repsol S.A. 25
3 Telefonica S.A. 47
215
Sweden — 2.6%
1 Assa Abloy AB, Class B 32
1 Electrolux AB, Series B 17
—(h) Hennes & Mauritz AB, Class B 5
1 Nordea Bank AB 10
1 Swedbank AB, Class A 13
1 Tele2 AB, Class B 15
1 Telefonaktiebolaget LM Ericsson, Class B 10
102
Switzerland — 14.0%
—(h) ABB Ltd. (a) 7
—(h) Cie Financiere Richemont S.A. 37
1 Credit Suisse Group AG (a) 16
1 Glencore plc (a) 7
—(h) Holcim Ltd. (a) 29
2 Nestle S.A. 131
1 Novartis AG 95
—(h) Roche Holding AG 109
—(h) Swiss Re AG (a) 23
—(h) Syngenta AG 5
3 UBS Group AG (a) 52
—(h) Wolseley plc 29
—(h) Zurich Insurance Group AG (a) 7
547
United Kingdom — 27.1%
3 3i Group plc 27
—(h) Anglo American plc 4
—(h) ARM Holdings plc 7
—(h) Associated British Foods plc 17
SHARES SECURITY DESCRIPTION VALUE($)
United Kingdom — continued
1 AstraZeneca plc (m) 49
4 Aviva plc 28
3 BAE Systems plc (m) 26
12 Barclays plc 46
2 BG Group plc 30
9 BP plc (m) 65
1 British American Tobacco plc 67
2 BT Group plc 14
3 Cobham plc 13
1 Compass Group plc 12
—(h) Diageo plc 11
3 Dixons Carphone plc 21
2 GlaxoSmithKline plc 35
1 Hammerson plc (m) 11
7 HSBC Holdings plc 72
1 Imperial Tobacco Group plc 26
—(h) Indivior plc (a) 1
7 ITV plc 26
18 Lloyds Banking Group plc 21
—(h) Marks & Spencer Group plc 4
1 National Grid plc 16
—(h) Next plc 24
—(h) Pearson plc 6
1 Persimmon plc (a) 16
2 Prudential plc (m) 47
—(h) Randgold Resources Ltd. 5
1 Reckitt Benckiser Group plc (m) 46
1 Rio Tinto plc 35
1 SABMiller plc 38
1 Smith & Nephew plc (m) 17
1 SSE plc 28
1 Standard Chartered plc 10
1 Tesco plc (m) 5
—(h) Tullow Oil plc 1
1 Unilever N.V., CVA 36
16 Vodafone Group plc 56
—(h) Whitbread plc (m) 25
1 WPP plc 15
1,059
Total Common Stocks(Cost $3,794) 3,796
Preferred Stocks — 1.3%
Germany — 1.3%
—(h) Henkel AG & Co. KGaA 34
SEE NOTES TO FINANCIAL STATEMENTS.
APRIL 30, 2015 J.P. MORGAN COUNTRY/REGION FUNDS 19
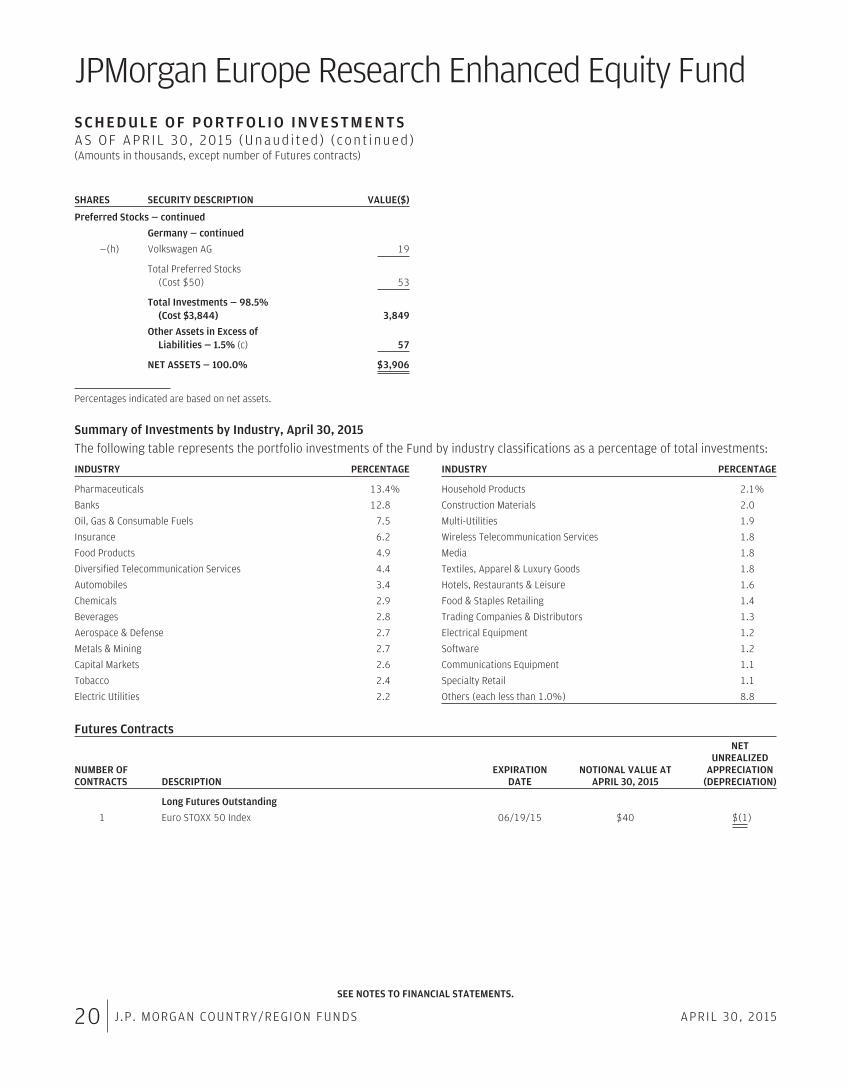
JPMorgan Europe Research Enhanced Equity FundS C H E D U L E O F P O R T F O L I O I N V E S T M E N T SAS OF APR IL 30 , 2015 (Unaud i ted ) ( con t inued )(Amounts in thousands, except number of Futures contracts)
SHARES SECURITY DESCRIPTION VALUE($)
Preferred Stocks — continued
Germany — continued
—(h) Volkswagen AG 19
Total Preferred Stocks(Cost $50) 53
Total Investments — 98.5%(Cost $3,844) 3,849
Other Assets in Excess ofLiabilities — 1.5% (c) 57
NET ASSETS — 100.0% $3,906
Percentages indicated are based on net assets.
Summary of Investments by Industry, April 30, 2015The following table represents the portfolio investments of the Fund by industry classifications as a percentage of total investments:
INDUSTRY PERCENTAGE
Pharmaceuticals 13.4%
Banks 12.8
Oil, Gas & Consumable Fuels 7.5
Insurance 6.2
Food Products 4.9
Diversified Telecommunication Services 4.4
Automobiles 3.4
Chemicals 2.9
Beverages 2.8
Aerospace & Defense 2.7
Metals & Mining 2.7
Capital Markets 2.6
Tobacco 2.4
Electric Utilities 2.2
INDUSTRY PERCENTAGE
Household Products 2.1%
Construction Materials 2.0
Multi-Utilities 1.9
Wireless Telecommunication Services 1.8
Media 1.8
Textiles, Apparel & Luxury Goods 1.8
Hotels, Restaurants & Leisure 1.6
Food & Staples Retailing 1.4
Trading Companies & Distributors 1.3
Electrical Equipment 1.2
Software 1.2
Communications Equipment 1.1
Specialty Retail 1.1
Others (each less than 1.0%) 8.8
Futures Contracts
NUMBER OFCONTRACTS DESCRIPTION
EXPIRATIONDATE
NOTIONAL VALUE ATAPRIL 30, 2015
NETUNREALIZED
APPRECIATION(DEPRECIATION)
Long Futures Outstanding
1 Euro STOXX 50 Index 06/19/15 $40 $(1)
SEE NOTES TO FINANCIAL STATEMENTS.
20 J.P. MORGAN COUNTRY/REGION FUNDS APRIL 30, 2015
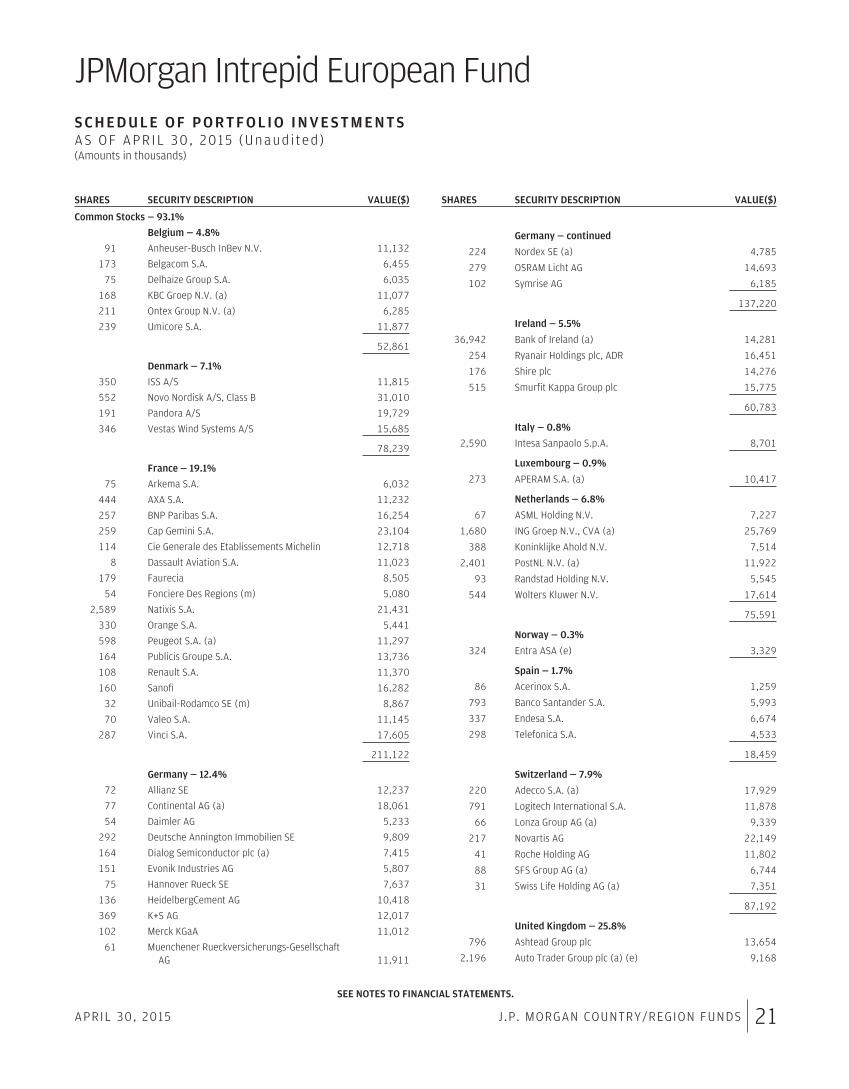
JPMorgan Intrepid European FundS C H E D U L E O F P O R T F O L I O I N V E S T M E N T SAS OF APR IL 30 , 2015 (Unaud i ted )(Amounts in thousands)
SHARES SECURITY DESCRIPTION VALUE($)
Common Stocks — 93.1%
Belgium — 4.8%
91 Anheuser-Busch InBev N.V. 11,132
173 Belgacom S.A. 6,455
75 Delhaize Group S.A. 6,035
168 KBC Groep N.V. (a) 11,077
211 Ontex Group N.V. (a) 6,285
239 Umicore S.A. 11,877
52,861
Denmark — 7.1%
350 ISS A/S 11,815
552 Novo Nordisk A/S, Class B 31,010
191 Pandora A/S 19,729
346 Vestas Wind Systems A/S 15,685
78,239
France — 19.1%
75 Arkema S.A. 6,032
444 AXA S.A. 11,232
257 BNP Paribas S.A. 16,254
259 Cap Gemini S.A. 23,104
114 Cie Generale des Etablissements Michelin 12,718
8 Dassault Aviation S.A. 11,023
179 Faurecia 8,505
54 Fonciere Des Regions (m) 5,080
2,589 Natixis S.A. 21,431
330 Orange S.A. 5,441
598 Peugeot S.A. (a) 11,297
164 Publicis Groupe S.A. 13,736
108 Renault S.A. 11,370
160 Sanofi 16,282
32 Unibail-Rodamco SE (m) 8,867
70 Valeo S.A. 11,145
287 Vinci S.A. 17,605
211,122
Germany — 12.4%
72 Allianz SE 12,237
77 Continental AG (a) 18,061
54 Daimler AG 5,233
292 Deutsche Annington Immobilien SE 9,809
164 Dialog Semiconductor plc (a) 7,415
151 Evonik Industries AG 5,807
75 Hannover Rueck SE 7,637
136 HeidelbergCement AG 10,418
369 K+S AG 12,017
102 Merck KGaA 11,012
61 Muenchener Rueckversicherungs-GesellschaftAG 11,911
SHARES SECURITY DESCRIPTION VALUE($)
Germany — continued
224 Nordex SE (a) 4,785
279 OSRAM Licht AG 14,693
102 Symrise AG 6,185
137,220
Ireland — 5.5%
36,942 Bank of Ireland (a) 14,281
254 Ryanair Holdings plc, ADR 16,451
176 Shire plc 14,276
515 Smurfit Kappa Group plc 15,775
60,783
Italy — 0.8%
2,590 Intesa Sanpaolo S.p.A. 8,701
Luxembourg — 0.9%
273 APERAM S.A. (a) 10,417
Netherlands — 6.8%
67 ASML Holding N.V. 7,227
1,680 ING Groep N.V., CVA (a) 25,769
388 Koninklijke Ahold N.V. 7,514
2,401 PostNL N.V. (a) 11,922
93 Randstad Holding N.V. 5,545
544 Wolters Kluwer N.V. 17,614
75,591
Norway — 0.3%
324 Entra ASA (e) 3,329
Spain — 1.7%
86 Acerinox S.A. 1,259
793 Banco Santander S.A. 5,993
337 Endesa S.A. 6,674
298 Telefonica S.A. 4,533
18,459
Switzerland — 7.9%
220 Adecco S.A. (a) 17,929
791 Logitech International S.A. 11,878
66 Lonza Group AG (a) 9,339
217 Novartis AG 22,149
41 Roche Holding AG 11,802
88 SFS Group AG (a) 6,744
31 Swiss Life Holding AG (a) 7,351
87,192
United Kingdom — 25.8%
796 Ashtead Group plc 13,654
2,196 Auto Trader Group plc (a) (e) 9,168
SEE NOTES TO FINANCIAL STATEMENTS.
APRIL 30, 2015 J.P. MORGAN COUNTRY/REGION FUNDS 21
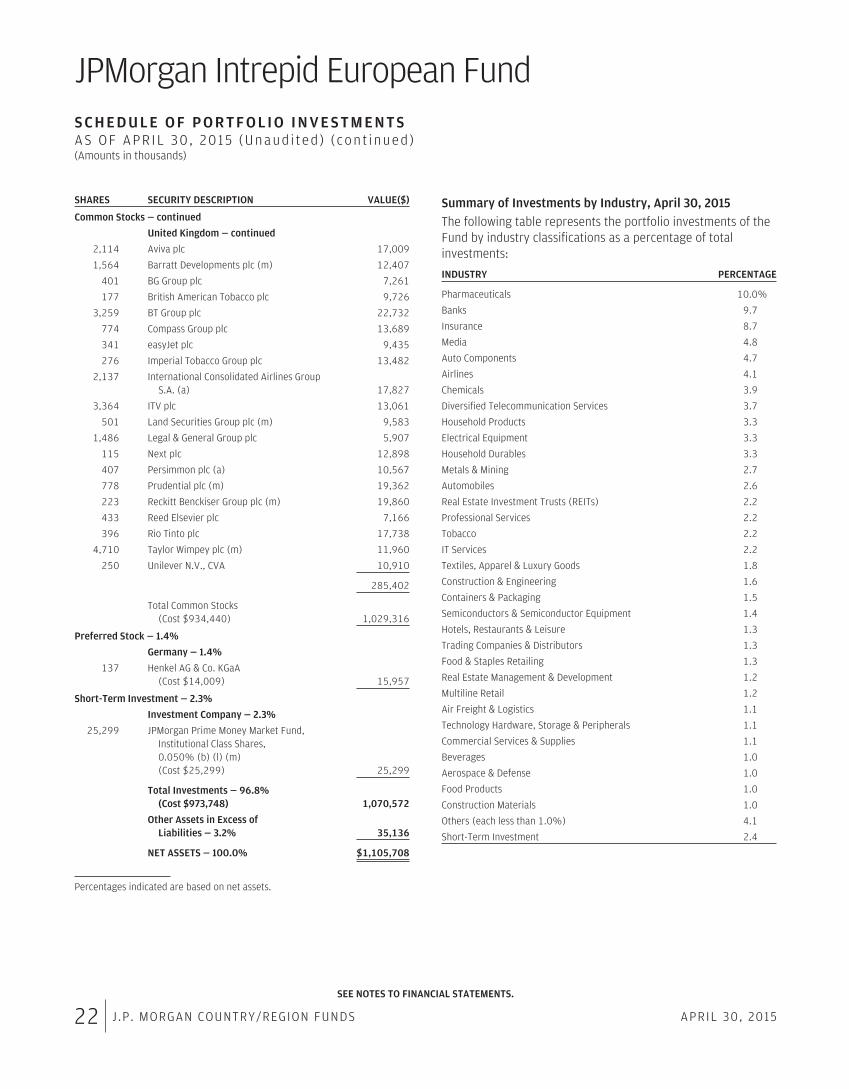
JPMorgan Intrepid European FundS C H E D U L E O F P O R T F O L I O I N V E S T M E N T SAS OF APR IL 30 , 2015 (Unaud i ted ) ( con t inued )(Amounts in thousands)
SHARES SECURITY DESCRIPTION VALUE($)
Common Stocks — continued
United Kingdom — continued
2,114 Aviva plc 17,009
1,564 Barratt Developments plc (m) 12,407
401 BG Group plc 7,261
177 British American Tobacco plc 9,726
3,259 BT Group plc 22,732
774 Compass Group plc 13,689
341 easyJet plc 9,435
276 Imperial Tobacco Group plc 13,482
2,137 International Consolidated Airlines GroupS.A. (a) 17,827
3,364 ITV plc 13,061
501 Land Securities Group plc (m) 9,583
1,486 Legal & General Group plc 5,907
115 Next plc 12,898
407 Persimmon plc (a) 10,567
778 Prudential plc (m) 19,362
223 Reckitt Benckiser Group plc (m) 19,860
433 Reed Elsevier plc 7,166
396 Rio Tinto plc 17,738
4,710 Taylor Wimpey plc (m) 11,960
250 Unilever N.V., CVA 10,910
285,402
Total Common Stocks(Cost $934,440) 1,029,316
Preferred Stock — 1.4%
Germany — 1.4%
137 Henkel AG & Co. KGaA(Cost $14,009) 15,957
Short-Term Investment — 2.3%
Investment Company — 2.3%
25,299 JPMorgan Prime Money Market Fund,Institutional Class Shares,0.050% (b) (l) (m)(Cost $25,299) 25,299
Total Investments — 96.8%(Cost $973,748) 1,070,572
Other Assets in Excess ofLiabilities — 3.2% 35,136
NET ASSETS — 100.0% $1,105,708
Percentages indicated are based on net assets.
Summary of Investments by Industry, April 30, 2015The following table represents the portfolio investments of theFund by industry classifications as a percentage of totalinvestments:
INDUSTRY PERCENTAGE
Pharmaceuticals 10.0%
Banks 9.7
Insurance 8.7
Media 4.8
Auto Components 4.7
Airlines 4.1
Chemicals 3.9
Diversified Telecommunication Services 3.7
Household Products 3.3
Electrical Equipment 3.3
Household Durables 3.3
Metals & Mining 2.7
Automobiles 2.6
Real Estate Investment Trusts (REITs) 2.2
Professional Services 2.2
Tobacco 2.2
IT Services 2.2
Textiles, Apparel & Luxury Goods 1.8
Construction & Engineering 1.6
Containers & Packaging 1.5
Semiconductors & Semiconductor Equipment 1.4
Hotels, Restaurants & Leisure 1.3
Trading Companies & Distributors 1.3
Food & Staples Retailing 1.3
Real Estate Management & Development 1.2
Multiline Retail 1.2
Air Freight & Logistics 1.1
Technology Hardware, Storage & Peripherals 1.1
Commercial Services & Supplies 1.1
Beverages 1.0
Aerospace & Defense 1.0
Food Products 1.0
Construction Materials 1.0
Others (each less than 1.0%) 4.1
Short-Term Investment 2.4
SEE NOTES TO FINANCIAL STATEMENTS.
22 J.P. MORGAN COUNTRY/REGION FUNDS APRIL 30, 2015
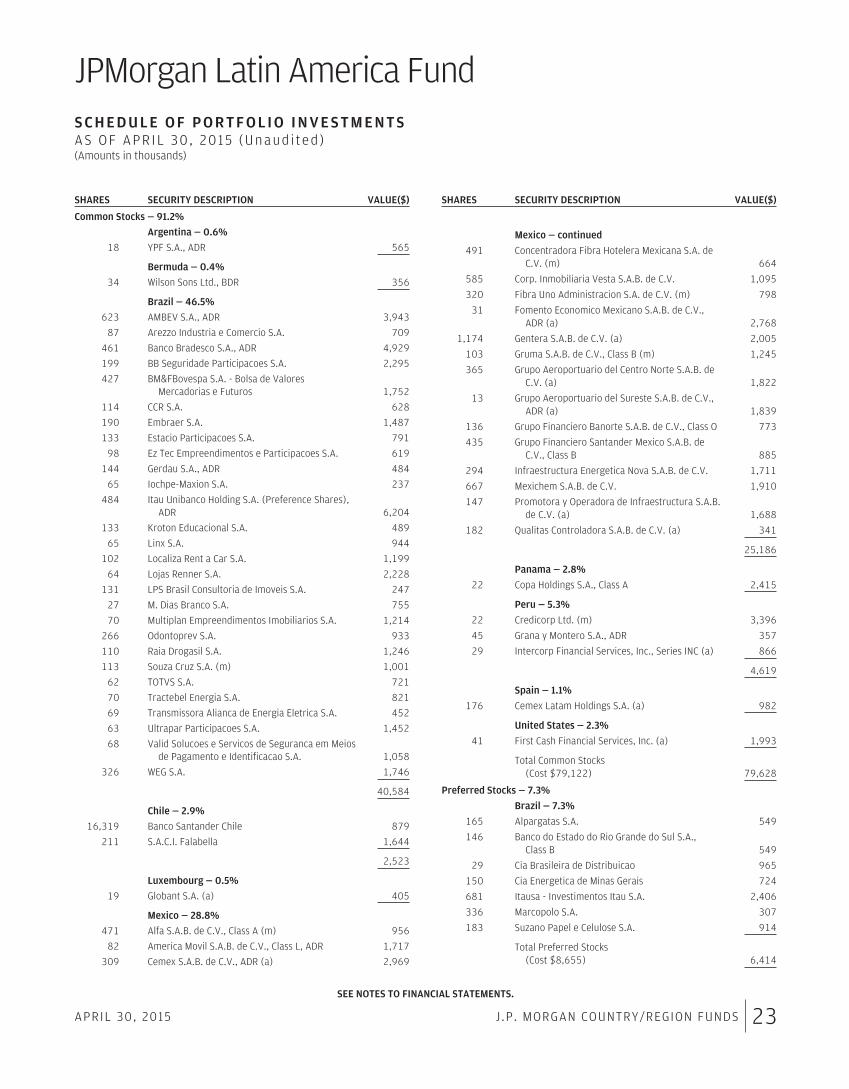
JPMorgan Latin America FundS C H E D U L E O F P O R T F O L I O I N V E S T M E N T SAS OF APR IL 30 , 2015 (Unaud i ted )(Amounts in thousands)
SHARES SECURITY DESCRIPTION VALUE($)
Common Stocks — 91.2%
Argentina — 0.6%
18 YPF S.A., ADR 565
Bermuda — 0.4%
34 Wilson Sons Ltd., BDR 356
Brazil — 46.5%
623 AMBEV S.A., ADR 3,943
87 Arezzo Industria e Comercio S.A. 709
461 Banco Bradesco S.A., ADR 4,929
199 BB Seguridade Participacoes S.A. 2,295
427 BM&FBovespa S.A. - Bolsa de ValoresMercadorias e Futuros 1,752
114 CCR S.A. 628
190 Embraer S.A. 1,487
133 Estacio Participacoes S.A. 791
98 Ez Tec Empreendimentos e Participacoes S.A. 619
144 Gerdau S.A., ADR 484
65 Iochpe-Maxion S.A. 237
484 Itau Unibanco Holding S.A. (Preference Shares),ADR 6,204
133 Kroton Educacional S.A. 489
65 Linx S.A. 944
102 Localiza Rent a Car S.A. 1,199
64 Lojas Renner S.A. 2,228
131 LPS Brasil Consultoria de Imoveis S.A. 247
27 M. Dias Branco S.A. 755
70 Multiplan Empreendimentos Imobiliarios S.A. 1,214
266 Odontoprev S.A. 933
110 Raia Drogasil S.A. 1,246
113 Souza Cruz S.A. (m) 1,001
62 TOTVS S.A. 721
70 Tractebel Energia S.A. 821
69 Transmissora Alianca de Energia Eletrica S.A. 452
63 Ultrapar Participacoes S.A. 1,452
68 Valid Solucoes e Servicos de Seguranca em Meiosde Pagamento e Identificacao S.A. 1,058
326 WEG S.A. 1,746
40,584
Chile — 2.9%
16,319 Banco Santander Chile 879
211 S.A.C.I. Falabella 1,644
2,523
Luxembourg — 0.5%
19 Globant S.A. (a) 405
Mexico — 28.8%
471 Alfa S.A.B. de C.V., Class A (m) 956
82 America Movil S.A.B. de C.V., Class L, ADR 1,717
309 Cemex S.A.B. de C.V., ADR (a) 2,969
SHARES SECURITY DESCRIPTION VALUE($)
Mexico — continued
491 Concentradora Fibra Hotelera Mexicana S.A. deC.V. (m) 664
585 Corp. Inmobiliaria Vesta S.A.B. de C.V. 1,095
320 Fibra Uno Administracion S.A. de C.V. (m) 798
31 Fomento Economico Mexicano S.A.B. de C.V.,ADR (a) 2,768
1,174 Gentera S.A.B. de C.V. (a) 2,005
103 Gruma S.A.B. de C.V., Class B (m) 1,245
365 Grupo Aeroportuario del Centro Norte S.A.B. deC.V. (a) 1,822
13 Grupo Aeroportuario del Sureste S.A.B. de C.V.,ADR (a) 1,839
136 Grupo Financiero Banorte S.A.B. de C.V., Class O 773
435 Grupo Financiero Santander Mexico S.A.B. deC.V., Class B 885
294 Infraestructura Energetica Nova S.A.B. de C.V. 1,711
667 Mexichem S.A.B. de C.V. 1,910
147 Promotora y Operadora de Infraestructura S.A.B.de C.V. (a) 1,688
182 Qualitas Controladora S.A.B. de C.V. (a) 341
25,186
Panama — 2.8%
22 Copa Holdings S.A., Class A 2,415
Peru — 5.3%
22 Credicorp Ltd. (m) 3,396
45 Grana y Montero S.A., ADR 357
29 Intercorp Financial Services, Inc., Series INC (a) 866
4,619
Spain — 1.1%
176 Cemex Latam Holdings S.A. (a) 982
United States — 2.3%
41 First Cash Financial Services, Inc. (a) 1,993
Total Common Stocks(Cost $79,122) 79,628
Preferred Stocks — 7.3%
Brazil — 7.3%
165 Alpargatas S.A. 549
146 Banco do Estado do Rio Grande do Sul S.A.,Class B 549
29 Cia Brasileira de Distribuicao 965
150 Cia Energetica de Minas Gerais 724
681 Itausa - Investimentos Itau S.A. 2,406
336 Marcopolo S.A. 307
183 Suzano Papel e Celulose S.A. 914
Total Preferred Stocks(Cost $8,655) 6,414
SEE NOTES TO FINANCIAL STATEMENTS.
APRIL 30, 2015 J.P. MORGAN COUNTRY/REGION FUNDS 23
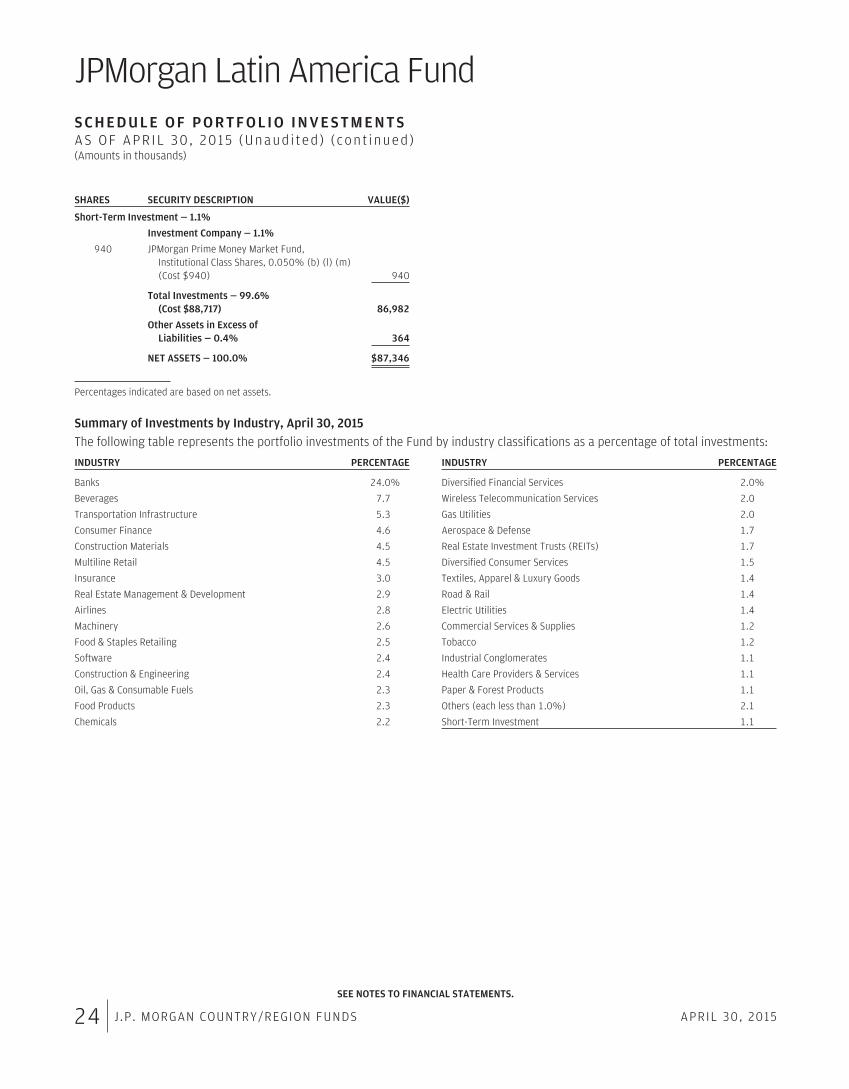
JPMorgan Latin America FundS C H E D U L E O F P O R T F O L I O I N V E S T M E N T SAS OF APR IL 30 , 2015 (Unaud i ted ) ( con t inued )(Amounts in thousands)
SHARES SECURITY DESCRIPTION VALUE($)
Short-Term Investment — 1.1%
Investment Company — 1.1%
940 JPMorgan Prime Money Market Fund,Institutional Class Shares, 0.050% (b) (l) (m)(Cost $940) 940
Total Investments — 99.6%(Cost $88,717) 86,982
Other Assets in Excess ofLiabilities — 0.4% 364
NET ASSETS — 100.0% $87,346
Percentages indicated are based on net assets.
Summary of Investments by Industry, April 30, 2015The following table represents the portfolio investments of the Fund by industry classifications as a percentage of total investments:
INDUSTRY PERCENTAGE
Banks 24.0%
Beverages 7.7
Transportation Infrastructure 5.3
Consumer Finance 4.6
Construction Materials 4.5
Multiline Retail 4.5
Insurance 3.0
Real Estate Management & Development 2.9
Airlines 2.8
Machinery 2.6
Food & Staples Retailing 2.5
Software 2.4
Construction & Engineering 2.4
Oil, Gas & Consumable Fuels 2.3
Food Products 2.3
Chemicals 2.2
INDUSTRY PERCENTAGE
Diversified Financial Services 2.0%
Wireless Telecommunication Services 2.0
Gas Utilities 2.0
Aerospace & Defense 1.7
Real Estate Investment Trusts (REITs) 1.7
Diversified Consumer Services 1.5
Textiles, Apparel & Luxury Goods 1.4
Road & Rail 1.4
Electric Utilities 1.4
Commercial Services & Supplies 1.2
Tobacco 1.2
Industrial Conglomerates 1.1
Health Care Providers & Services 1.1
Paper & Forest Products 1.1
Others (each less than 1.0%) 2.1
Short-Term Investment 1.1
SEE NOTES TO FINANCIAL STATEMENTS.
24 J.P. MORGAN COUNTRY/REGION FUNDS APRIL 30, 2015
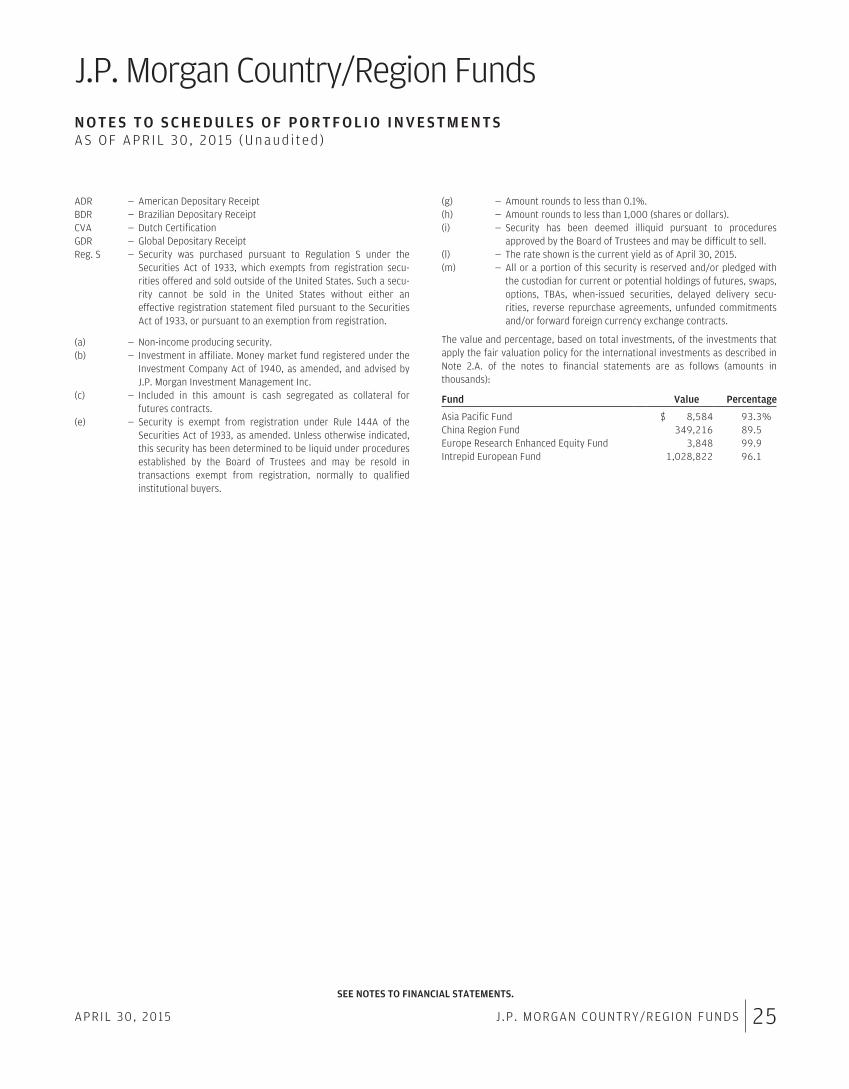
J.P. Morgan Country/Region FundsN O T E S T O S C H E D U L E S O F P O R T F O L I O I N V E S T M E N T SAS OF APR IL 30 , 2015 (Unaud i ted )
ADR — American Depositary ReceiptBDR — Brazilian Depositary ReceiptCVA — Dutch CertificationGDR — Global Depositary ReceiptReg. S — Security was purchased pursuant to Regulation S under the
Securities Act of 1933, which exempts from registration secu-rities offered and sold outside of the United States. Such a secu-rity cannot be sold in the United States without either aneffective registration statement filed pursuant to the SecuritiesAct of 1933, or pursuant to an exemption from registration.
(a) — Non-income producing security.(b) — Investment in affiliate. Money market fund registered under the
Investment Company Act of 1940, as amended, and advised byJ.P. Morgan Investment Management Inc.
(c) — Included in this amount is cash segregated as collateral forfutures contracts.
(e) — Security is exempt from registration under Rule 144A of theSecurities Act of 1933, as amended. Unless otherwise indicated,this security has been determined to be liquid under proceduresestablished by the Board of Trustees and may be resold intransactions exempt from registration, normally to qualifiedinstitutional buyers.
(g) — Amount rounds to less than 0.1%.(h) — Amount rounds to less than 1,000 (shares or dollars).(i) — Security has been deemed illiquid pursuant to procedures
approved by the Board of Trustees and may be difficult to sell.(l) — The rate shown is the current yield as of April 30, 2015.(m) — All or a portion of this security is reserved and/or pledged with
the custodian for current or potential holdings of futures, swaps,options, TBAs, when-issued securities, delayed delivery secu-rities, reverse repurchase agreements, unfunded commitmentsand/or forward foreign currency exchange contracts.
The value and percentage, based on total investments, of the investments thatapply the fair valuation policy for the international investments as described inNote 2.A. of the notes to financial statements are as follows (amounts inthousands):
Fund Value Percentage
Asia Pacific Fund $ 8,584 93.3%China Region Fund 349,216 89.5Europe Research Enhanced Equity Fund 3,848 99.9Intrepid European Fund 1,028,822 96.1
SEE NOTES TO FINANCIAL STATEMENTS.
APRIL 30, 2015 J.P. MORGAN COUNTRY/REGION FUNDS 25
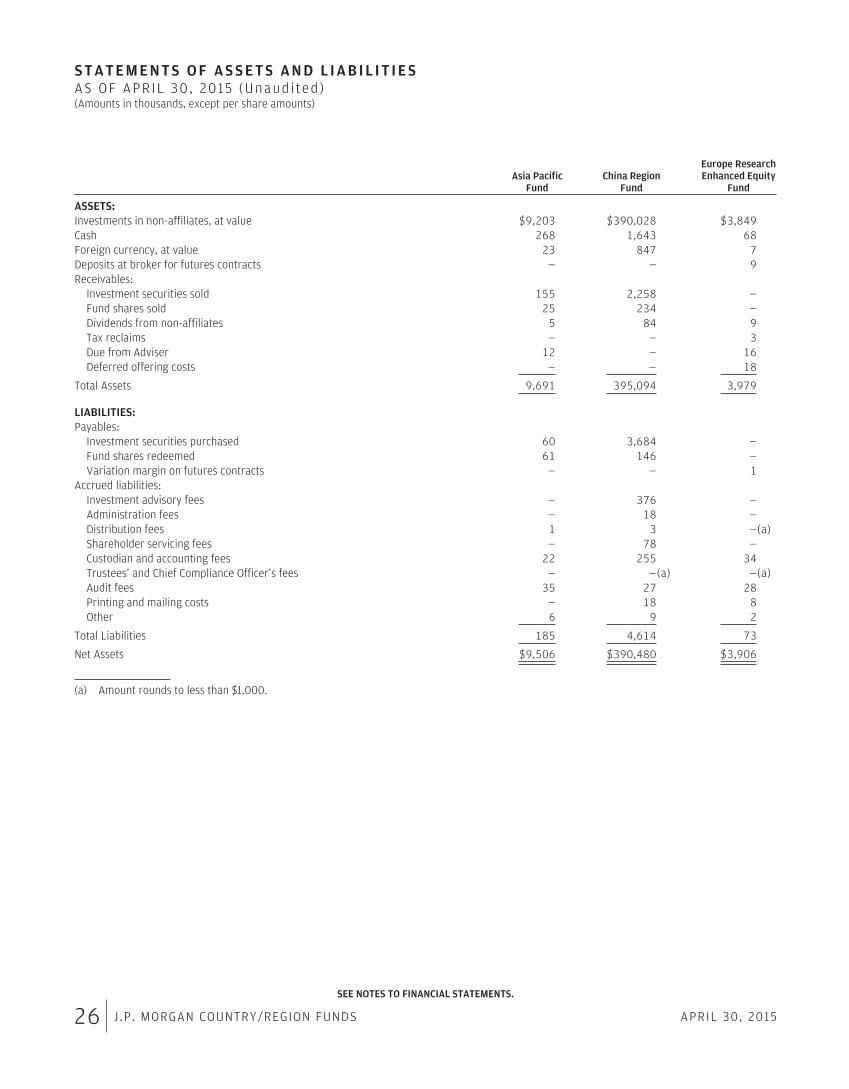
S T A T E M E N T S O F A S S E T S A N D L I A B I L I T I E SAS OF APR IL 30 , 2015 (Unaud i ted )(Amounts in thousands, except per share amounts)
Asia PacificFund
China RegionFund
Europe ResearchEnhanced Equity
Fund
ASSETS:Investments in non-affiliates, at value $9,203 $390,028 $3,849Cash 268 1,643 68Foreign currency, at value 23 847 7Deposits at broker for futures contracts — — 9Receivables:
Investment securities sold 155 2,258 —Fund shares sold 25 234 —Dividends from non-affiliates 5 84 9Tax reclaims — — 3Due from Adviser 12 — 16Deferred offering costs — — 18
Total Assets 9,691 395,094 3,979
LIABILITIES:Payables:
Investment securities purchased 60 3,684 —Fund shares redeemed 61 146 —Variation margin on futures contracts — — 1
Accrued liabilities:Investment advisory fees — 376 —Administration fees — 18 —Distribution fees 1 3 —(a)Shareholder servicing fees — 78 —Custodian and accounting fees 22 255 34Trustees’ and Chief Compliance Officer’s fees — —(a) —(a)Audit fees 35 27 28Printing and mailing costs — 18 8Other 6 9 2
Total Liabilities 185 4,614 73
Net Assets $9,506 $390,480 $3,906
(a) Amount rounds to less than $1,000.
SEE NOTES TO FINANCIAL STATEMENTS.
26 J.P. MORGAN COUNTRY/REGION FUNDS APRIL 30, 2015
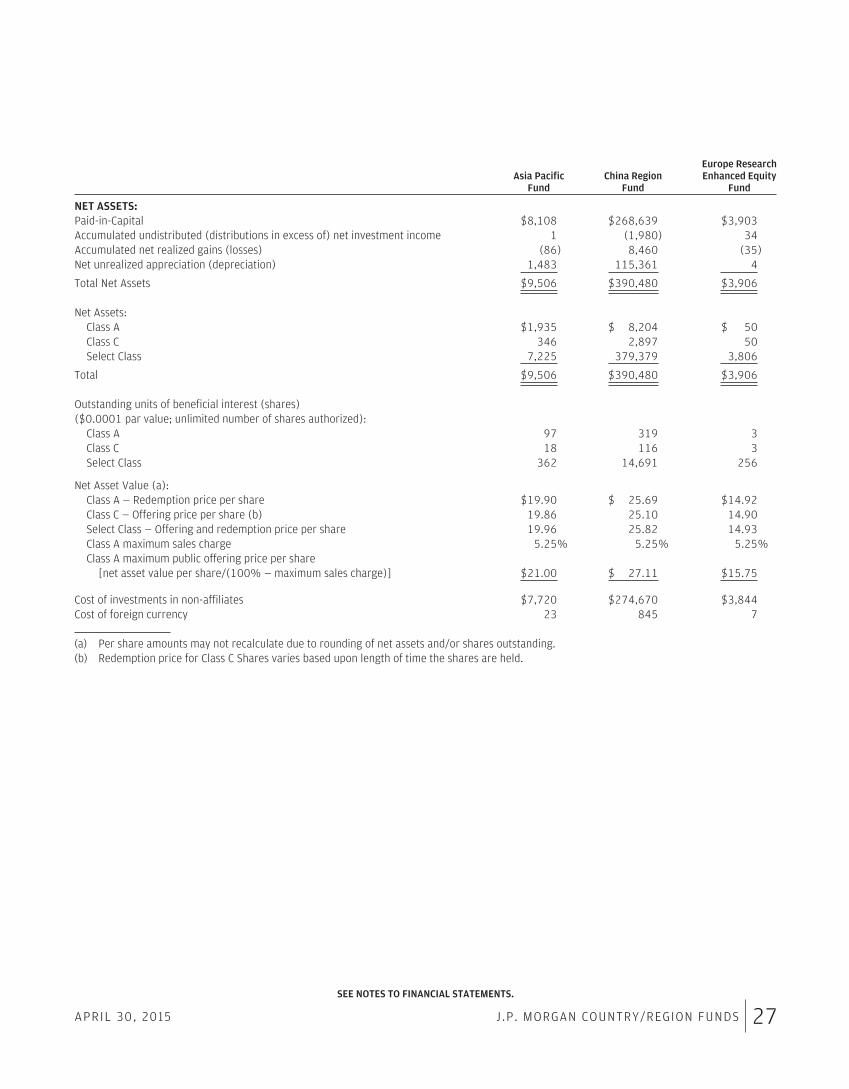
Asia PacificFund
China RegionFund
Europe ResearchEnhanced Equity
Fund
NET ASSETS:Paid-in-Capital $8,108 $268,639 $3,903Accumulated undistributed (distributions in excess of) net investment income 1 (1,980) 34Accumulated net realized gains (losses) (86) 8,460 (35)Net unrealized appreciation (depreciation) 1,483 115,361 4
Total Net Assets $9,506 $390,480 $3,906
Net Assets:Class A $1,935 $ 8,204 $ 50Class C 346 2,897 50Select Class 7,225 379,379 3,806
Total $9,506 $390,480 $3,906
Outstanding units of beneficial interest (shares)($0.0001 par value; unlimited number of shares authorized):
Class A 97 319 3Class C 18 116 3Select Class 362 14,691 256
Net Asset Value (a):Class A — Redemption price per share $19.90 $ 25.69 $14.92Class C — Offering price per share (b) 19.86 25.10 14.90Select Class — Offering and redemption price per share 19.96 25.82 14.93Class A maximum sales charge 5.25% 5.25% 5.25%Class A maximum public offering price per share
[net asset value per share/(100% — maximum sales charge)] $21.00 $ 27.11 $15.75
Cost of investments in non-affiliates $7,720 $274,670 $3,844Cost of foreign currency 23 845 7
(a) Per share amounts may not recalculate due to rounding of net assets and/or shares outstanding.(b) Redemption price for Class C Shares varies based upon length of time the shares are held.
SEE NOTES TO FINANCIAL STATEMENTS.
APRIL 30, 2015 J.P. MORGAN COUNTRY/REGION FUNDS 27
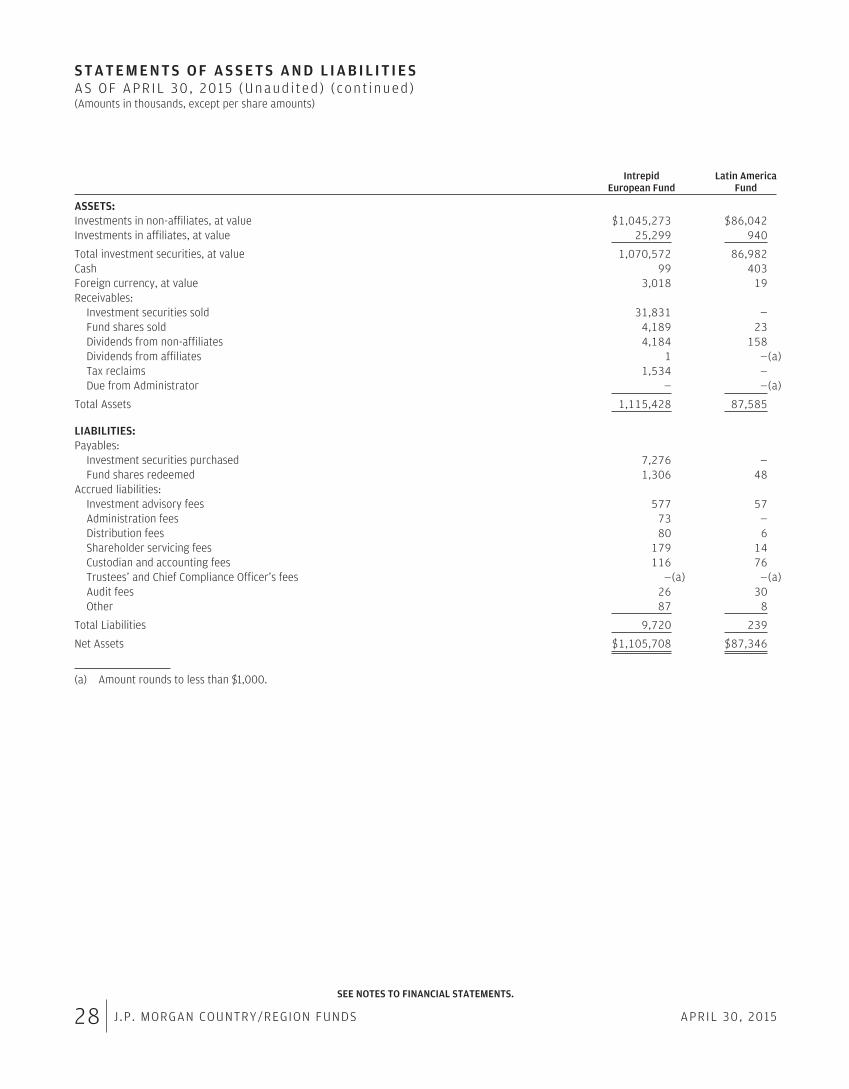
S T A T E M E N T S O F A S S E T S A N D L I A B I L I T I E SAS OF APR IL 30 , 2015 (Unaud i ted ) ( con t inued )(Amounts in thousands, except per share amounts)
IntrepidEuropean Fund
Latin AmericaFund
ASSETS:Investments in non-affiliates, at value $1,045,273 $86,042Investments in affiliates, at value 25,299 940
Total investment securities, at value 1,070,572 86,982Cash 99 403Foreign currency, at value 3,018 19Receivables:
Investment securities sold 31,831 —Fund shares sold 4,189 23Dividends from non-affiliates 4,184 158Dividends from affiliates 1 —(a)Tax reclaims 1,534 —Due from Administrator — —(a)
Total Assets 1,115,428 87,585
LIABILITIES:Payables:
Investment securities purchased 7,276 —Fund shares redeemed 1,306 48
Accrued liabilities:Investment advisory fees 577 57Administration fees 73 —Distribution fees 80 6Shareholder servicing fees 179 14Custodian and accounting fees 116 76Trustees’ and Chief Compliance Officer’s fees —(a) —(a)Audit fees 26 30Other 87 8
Total Liabilities 9,720 239
Net Assets $1,105,708 $87,346
(a) Amount rounds to less than $1,000.
SEE NOTES TO FINANCIAL STATEMENTS.
28 J.P. MORGAN COUNTRY/REGION FUNDS APRIL 30, 2015
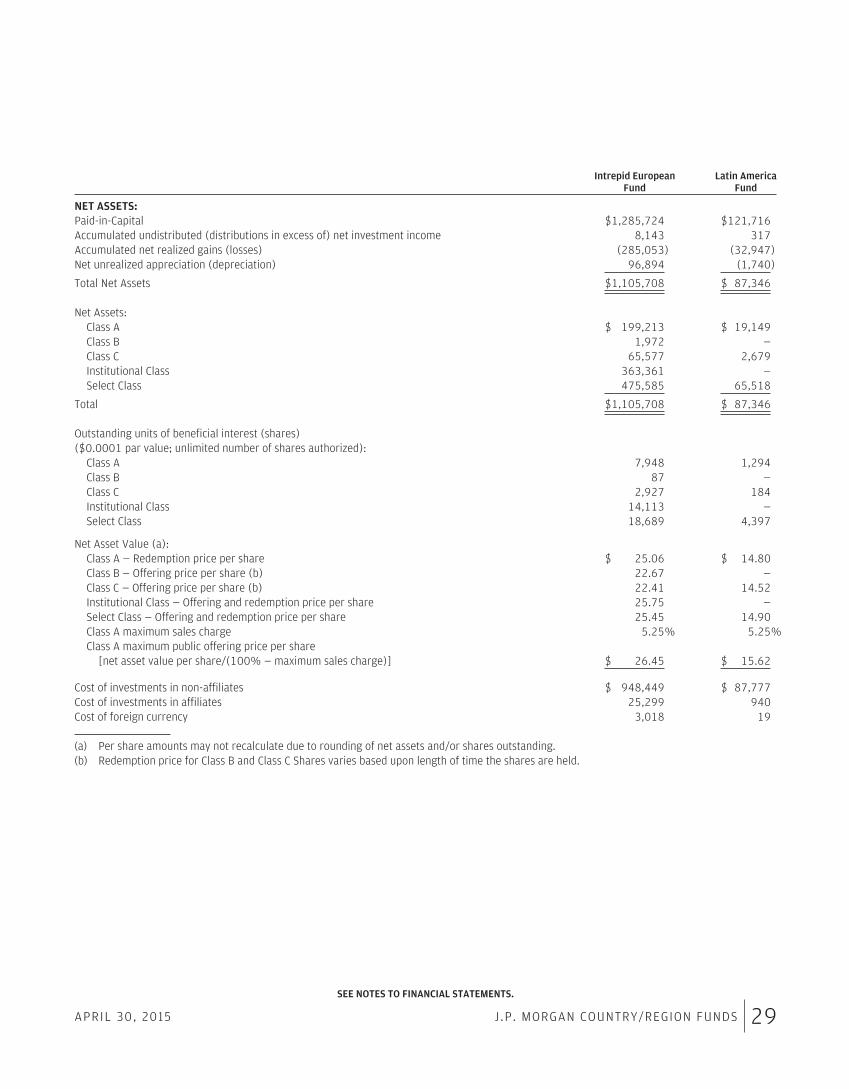
Intrepid EuropeanFund
Latin AmericaFund
NET ASSETS:Paid-in-Capital $1,285,724 $121,716Accumulated undistributed (distributions in excess of) net investment income 8,143 317Accumulated net realized gains (losses) (285,053) (32,947)Net unrealized appreciation (depreciation) 96,894 (1,740)
Total Net Assets $1,105,708 $ 87,346
Net Assets:Class A $ 199,213 $ 19,149Class B 1,972 —Class C 65,577 2,679Institutional Class 363,361 —Select Class 475,585 65,518
Total $1,105,708 $ 87,346
Outstanding units of beneficial interest (shares)($0.0001 par value; unlimited number of shares authorized):
Class A 7,948 1,294Class B 87 —Class C 2,927 184Institutional Class 14,113 —Select Class 18,689 4,397
Net Asset Value (a):Class A — Redemption price per share $ 25.06 $ 14.80Class B — Offering price per share (b) 22.67 —Class C — Offering price per share (b) 22.41 14.52Institutional Class — Offering and redemption price per share 25.75 —Select Class — Offering and redemption price per share 25.45 14.90Class A maximum sales charge 5.25% 5.25%Class A maximum public offering price per share
[net asset value per share/(100% — maximum sales charge)] $ 26.45 $ 15.62
Cost of investments in non-affiliates $ 948,449 $ 87,777Cost of investments in affiliates 25,299 940Cost of foreign currency 3,018 19
(a) Per share amounts may not recalculate due to rounding of net assets and/or shares outstanding.(b) Redemption price for Class B and Class C Shares varies based upon length of time the shares are held.
SEE NOTES TO FINANCIAL STATEMENTS.
APRIL 30, 2015 J.P. MORGAN COUNTRY/REGION FUNDS 29
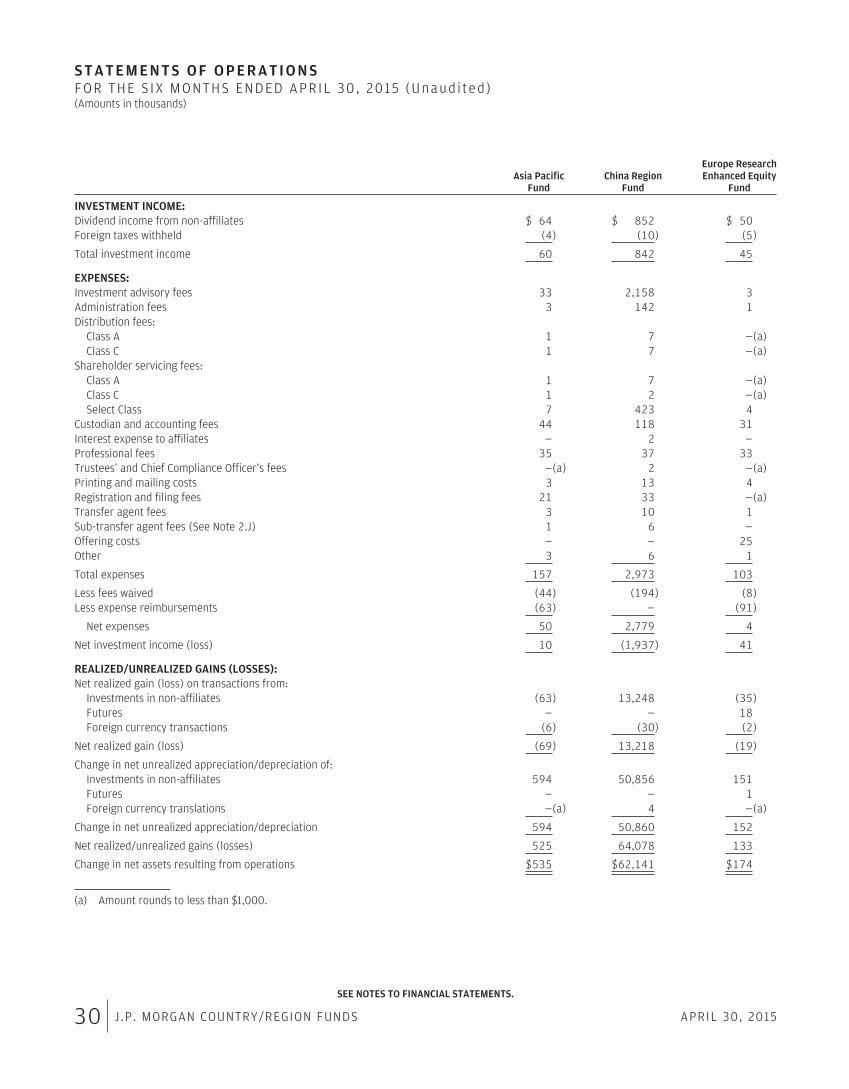
S T A T E M E N T S O F O P E R A T I O N SFOR THE S IX M ONTHS ENDED APRIL 30 , 2015 (Unaud i ted )(Amounts in thousands)
Asia PacificFund
China RegionFund
Europe ResearchEnhanced Equity
Fund
INVESTMENT INCOME:Dividend income from non-affiliates $ 64 $ 852 $ 50Foreign taxes withheld (4) (10) (5)
Total investment income 60 842 45
EXPENSES:Investment advisory fees 33 2,158 3Administration fees 3 142 1Distribution fees:
Class A 1 7 —(a)Class C 1 7 —(a)
Shareholder servicing fees:Class A 1 7 —(a)Class C 1 2 —(a)Select Class 7 423 4
Custodian and accounting fees 44 118 31Interest expense to affiliates — 2 —Professional fees 35 37 33Trustees’ and Chief Compliance Officer’s fees —(a) 2 —(a)Printing and mailing costs 3 13 4Registration and filing fees 21 33 —(a)Transfer agent fees 3 10 1Sub-transfer agent fees (See Note 2.J) 1 6 —Offering costs — — 25Other 3 6 1
Total expenses 157 2,973 103
Less fees waived (44) (194) (8)Less expense reimbursements (63) — (91)
Net expenses 50 2,779 4
Net investment income (loss) 10 (1,937) 41
REALIZED/UNREALIZED GAINS (LOSSES):Net realized gain (loss) on transactions from:
Investments in non-affiliates (63) 13,248 (35)Futures — — 18Foreign currency transactions (6) (30) (2)
Net realized gain (loss) (69) 13,218 (19)
Change in net unrealized appreciation/depreciation of:Investments in non-affiliates 594 50,856 151Futures — — 1Foreign currency translations —(a) 4 —(a)
Change in net unrealized appreciation/depreciation 594 50,860 152
Net realized/unrealized gains (losses) 525 64,078 133
Change in net assets resulting from operations $535 $62,141 $174
(a) Amount rounds to less than $1,000.
SEE NOTES TO FINANCIAL STATEMENTS.
30 J.P. MORGAN COUNTRY/REGION FUNDS APRIL 30, 2015
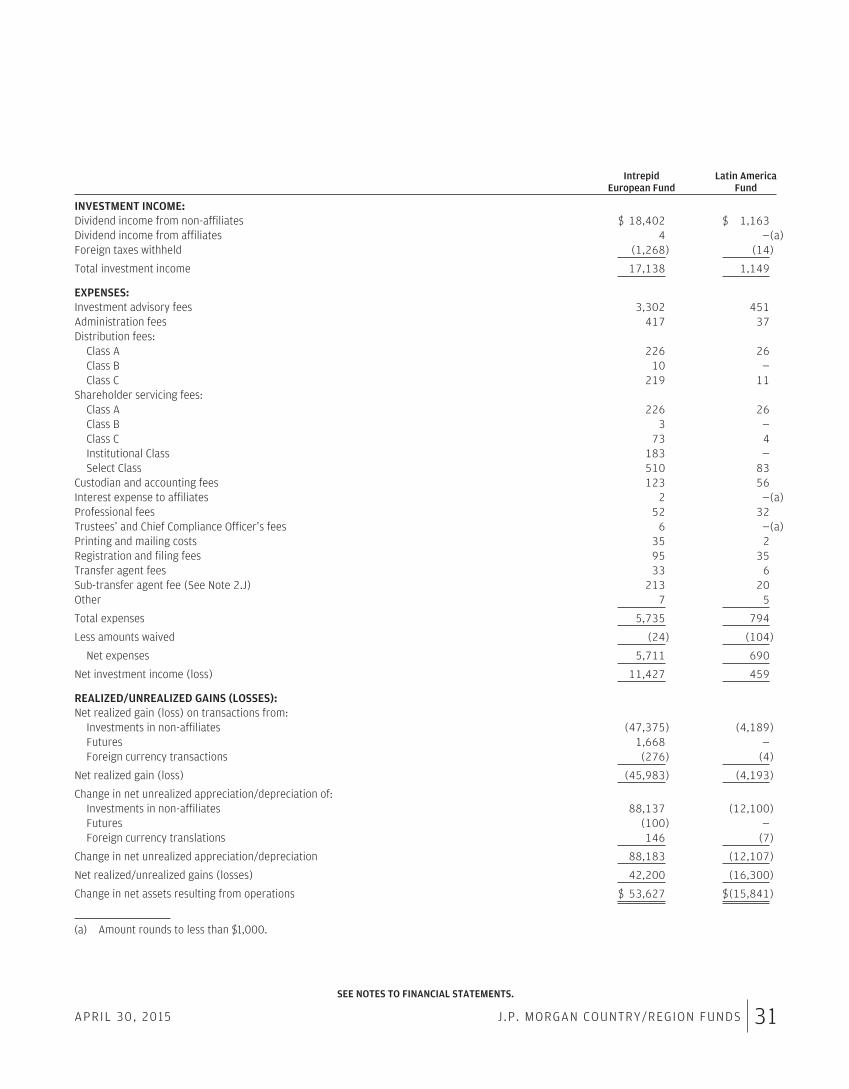
IntrepidEuropean Fund
Latin AmericaFund
INVESTMENT INCOME:Dividend income from non-affiliates $ 18,402 $ 1,163Dividend income from affiliates 4 —(a)Foreign taxes withheld (1,268) (14)
Total investment income 17,138 1,149
EXPENSES:Investment advisory fees 3,302 451Administration fees 417 37Distribution fees:
Class A 226 26Class B 10 —Class C 219 11
Shareholder servicing fees:Class A 226 26Class B 3 —Class C 73 4Institutional Class 183 —Select Class 510 83
Custodian and accounting fees 123 56Interest expense to affiliates 2 —(a)Professional fees 52 32Trustees’ and Chief Compliance Officer’s fees 6 —(a)Printing and mailing costs 35 2Registration and filing fees 95 35Transfer agent fees 33 6Sub-transfer agent fee (See Note 2.J) 213 20Other 7 5
Total expenses 5,735 794
Less amounts waived (24) (104)
Net expenses 5,711 690
Net investment income (loss) 11,427 459
REALIZED/UNREALIZED GAINS (LOSSES):Net realized gain (loss) on transactions from:
Investments in non-affiliates (47,375) (4,189)Futures 1,668 —Foreign currency transactions (276) (4)
Net realized gain (loss) (45,983) (4,193)
Change in net unrealized appreciation/depreciation of:Investments in non-affiliates 88,137 (12,100)Futures (100) —Foreign currency translations 146 (7)
Change in net unrealized appreciation/depreciation 88,183 (12,107)
Net realized/unrealized gains (losses) 42,200 (16,300)
Change in net assets resulting from operations $ 53,627 $(15,841)
(a) Amount rounds to less than $1,000.
SEE NOTES TO FINANCIAL STATEMENTS.
APRIL 30, 2015 J.P. MORGAN COUNTRY/REGION FUNDS 31
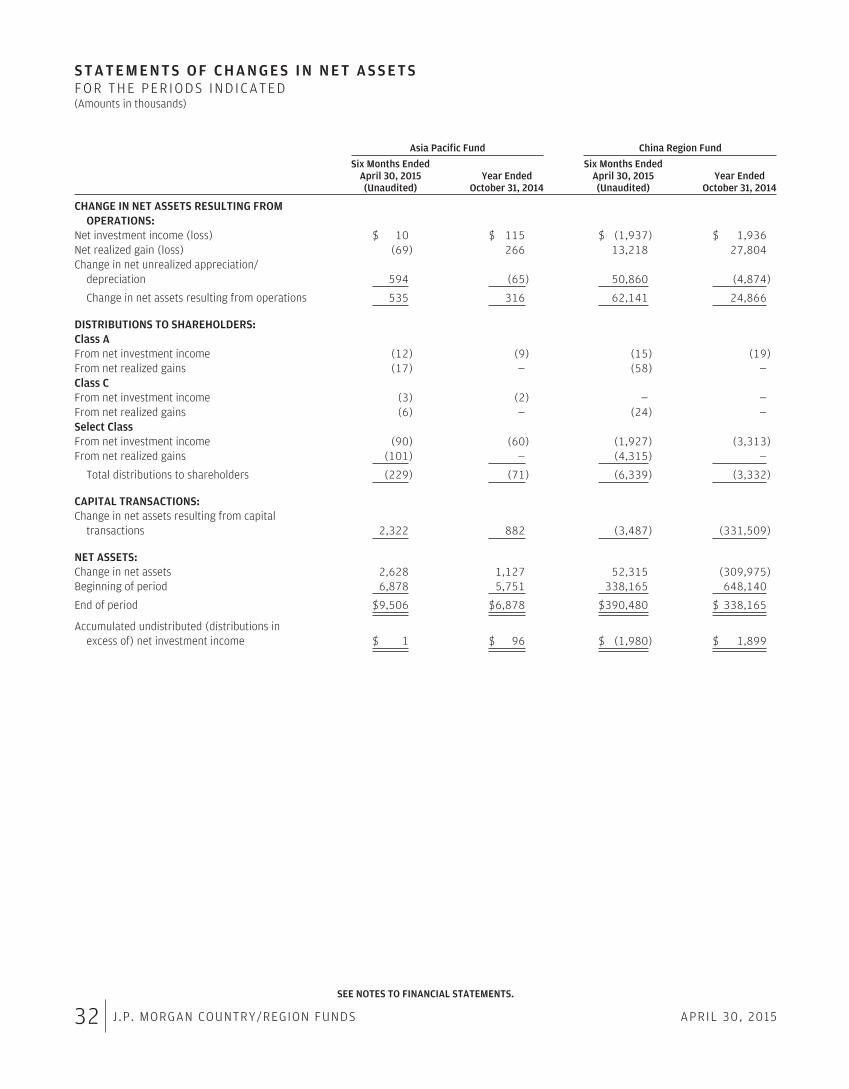
S T A T E M E N T S O F C H A N G E S I N N E T A S S E T SFOR THE PER IODS IND ICATED(Amounts in thousands)
Asia Pacific Fund China Region Fund
Six Months EndedApril 30, 2015(Unaudited)
Year EndedOctober 31, 2014
Six Months EndedApril 30, 2015(Unaudited)
Year EndedOctober 31, 2014
CHANGE IN NET ASSETS RESULTING FROMOPERATIONS:
Net investment income (loss) $ 10 $ 115 $ (1,937) $ 1,936Net realized gain (loss) (69) 266 13,218 27,804Change in net unrealized appreciation/
depreciation 594 (65) 50,860 (4,874)
Change in net assets resulting from operations 535 316 62,141 24,866
DISTRIBUTIONS TO SHAREHOLDERS:Class AFrom net investment income (12) (9) (15) (19)From net realized gains (17) — (58) —Class CFrom net investment income (3) (2) — —From net realized gains (6) — (24) —Select ClassFrom net investment income (90) (60) (1,927) (3,313)From net realized gains (101) — (4,315) —
Total distributions to shareholders (229) (71) (6,339) (3,332)
CAPITAL TRANSACTIONS:Change in net assets resulting from capital
transactions 2,322 882 (3,487) (331,509)
NET ASSETS:Change in net assets 2,628 1,127 52,315 (309,975)Beginning of period 6,878 5,751 338,165 648,140
End of period $9,506 $6,878 $390,480 $ 338,165
Accumulated undistributed (distributions inexcess of) net investment income $ 1 $ 96 $ (1,980) $ 1,899
SEE NOTES TO FINANCIAL STATEMENTS.
32 J.P. MORGAN COUNTRY/REGION FUNDS APRIL 30, 2015
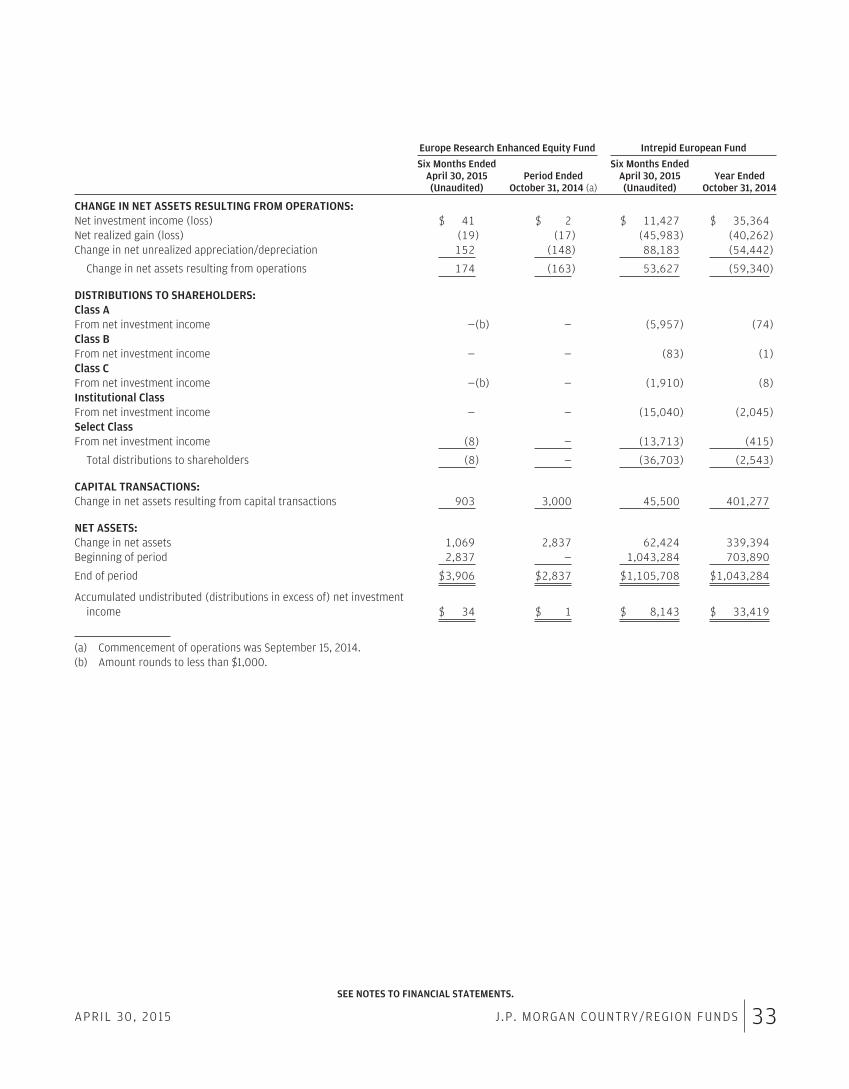
Europe Research Enhanced Equity Fund Intrepid European Fund
Six Months EndedApril 30, 2015(Unaudited)
Period EndedOctober 31, 2014 (a)
Six Months EndedApril 30, 2015(Unaudited)
Year EndedOctober 31, 2014
CHANGE IN NET ASSETS RESULTING FROM OPERATIONS:Net investment income (loss) $ 41 $ 2 $ 11,427 $ 35,364Net realized gain (loss) (19) (17) (45,983) (40,262)Change in net unrealized appreciation/depreciation 152 (148) 88,183 (54,442)
Change in net assets resulting from operations 174 (163) 53,627 (59,340)
DISTRIBUTIONS TO SHAREHOLDERS:Class AFrom net investment income —(b) — (5,957) (74)Class BFrom net investment income — — (83) (1)Class CFrom net investment income —(b) — (1,910) (8)Institutional ClassFrom net investment income — — (15,040) (2,045)Select ClassFrom net investment income (8) — (13,713) (415)
Total distributions to shareholders (8) — (36,703) (2,543)
CAPITAL TRANSACTIONS:Change in net assets resulting from capital transactions 903 3,000 45,500 401,277
NET ASSETS:Change in net assets 1,069 2,837 62,424 339,394Beginning of period 2,837 — 1,043,284 703,890
End of period $3,906 $2,837 $1,105,708 $1,043,284
Accumulated undistributed (distributions in excess of) net investmentincome $ 34 $ 1 $ 8,143 $ 33,419
(a) Commencement of operations was September 15, 2014.(b) Amount rounds to less than $1,000.
SEE NOTES TO FINANCIAL STATEMENTS.
APRIL 30, 2015 J.P. MORGAN COUNTRY/REGION FUNDS 33
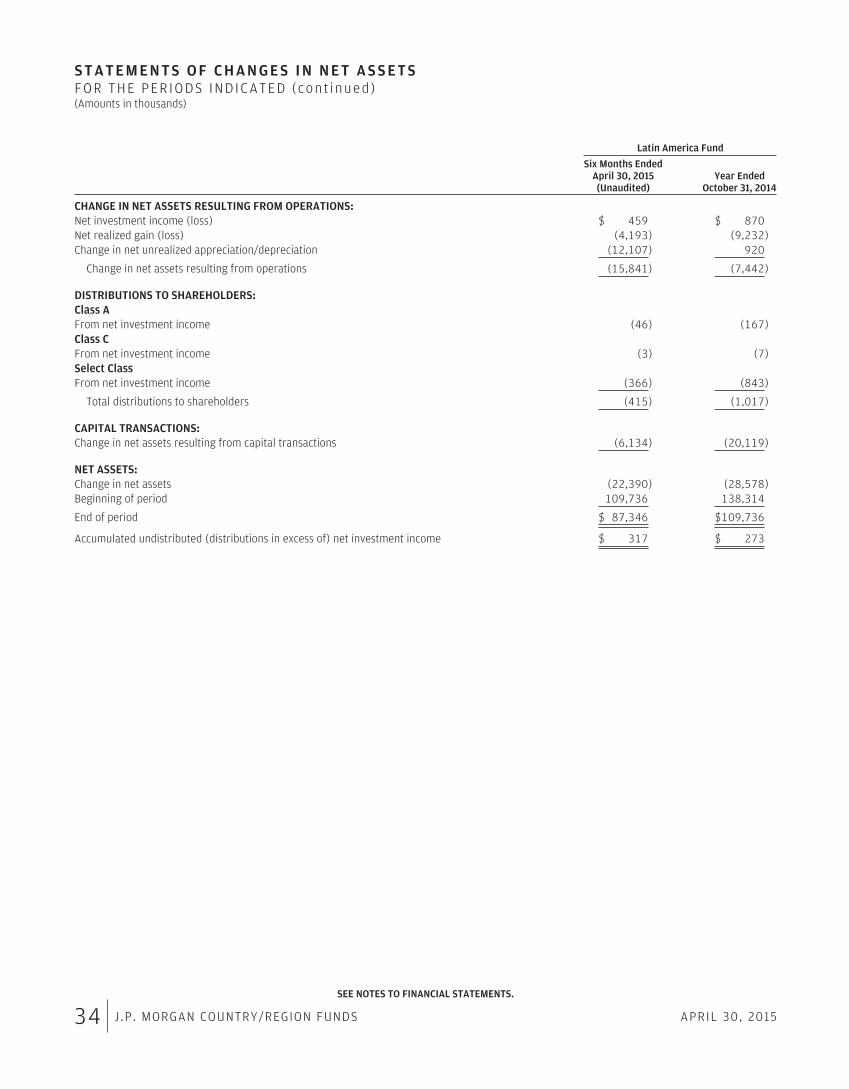
S T A T E M E N T S O F C H A N G E S I N N E T A S S E T SFOR THE PER IODS IND ICATED (con t inued )(Amounts in thousands)
Latin America Fund
Six Months EndedApril 30, 2015(Unaudited)
Year EndedOctober 31, 2014
CHANGE IN NET ASSETS RESULTING FROM OPERATIONS:Net investment income (loss) $ 459 $ 870Net realized gain (loss) (4,193) (9,232)Change in net unrealized appreciation/depreciation (12,107) 920
Change in net assets resulting from operations (15,841) (7,442)
DISTRIBUTIONS TO SHAREHOLDERS:Class AFrom net investment income (46) (167)Class CFrom net investment income (3) (7)Select ClassFrom net investment income (366) (843)
Total distributions to shareholders (415) (1,017)
CAPITAL TRANSACTIONS:Change in net assets resulting from capital transactions (6,134) (20,119)
NET ASSETS:Change in net assets (22,390) (28,578)Beginning of period 109,736 138,314
End of period $ 87,346 $109,736
Accumulated undistributed (distributions in excess of) net investment income $ 317 $ 273
SEE NOTES TO FINANCIAL STATEMENTS.
34 J.P. MORGAN COUNTRY/REGION FUNDS APRIL 30, 2015
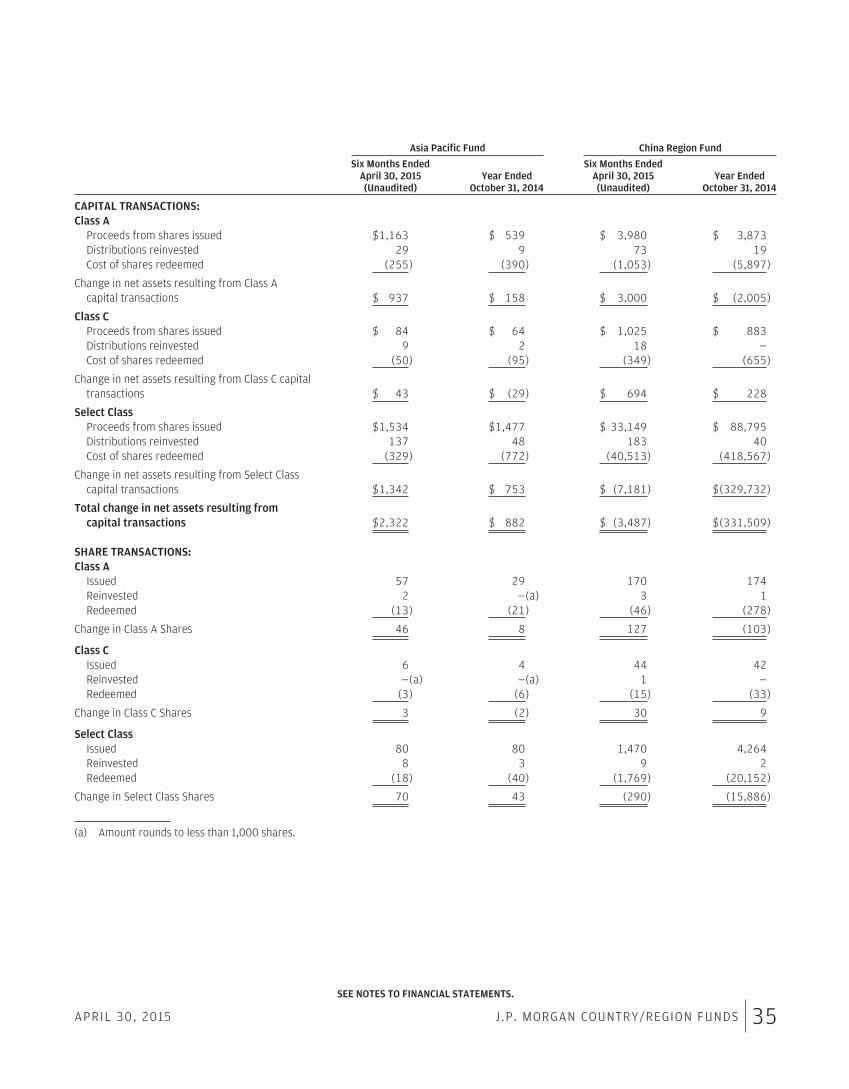
Asia Pacific Fund China Region Fund
Six Months EndedApril 30, 2015(Unaudited)
Year EndedOctober 31, 2014
Six Months EndedApril 30, 2015(Unaudited)
Year EndedOctober 31, 2014
CAPITAL TRANSACTIONS:Class A
Proceeds from shares issued $1,163 $ 539 $ 3,980 $ 3,873Distributions reinvested 29 9 73 19Cost of shares redeemed (255) (390) (1,053) (5,897)
Change in net assets resulting from Class Acapital transactions $ 937 $ 158 $ 3,000 $ (2,005)
Class CProceeds from shares issued $ 84 $ 64 $ 1,025 $ 883Distributions reinvested 9 2 18 —Cost of shares redeemed (50) (95) (349) (655)
Change in net assets resulting from Class C capitaltransactions $ 43 $ (29) $ 694 $ 228
Select ClassProceeds from shares issued $1,534 $1,477 $ 33,149 $ 88,795Distributions reinvested 137 48 183 40Cost of shares redeemed (329) (772) (40,513) (418,567)
Change in net assets resulting from Select Classcapital transactions $1,342 $ 753 $ (7,181) $(329,732)
Total change in net assets resulting fromcapital transactions $2,322 $ 882 $ (3,487) $(331,509)
SHARE TRANSACTIONS:Class A
Issued 57 29 170 174Reinvested 2 —(a) 3 1Redeemed (13) (21) (46) (278)
Change in Class A Shares 46 8 127 (103)
Class CIssued 6 4 44 42Reinvested —(a) —(a) 1 —Redeemed (3) (6) (15) (33)
Change in Class C Shares 3 (2) 30 9
Select ClassIssued 80 80 1,470 4,264Reinvested 8 3 9 2Redeemed (18) (40) (1,769) (20,152)
Change in Select Class Shares 70 43 (290) (15,886)
(a) Amount rounds to less than 1,000 shares.
SEE NOTES TO FINANCIAL STATEMENTS.
APRIL 30, 2015 J.P. MORGAN COUNTRY/REGION FUNDS 35
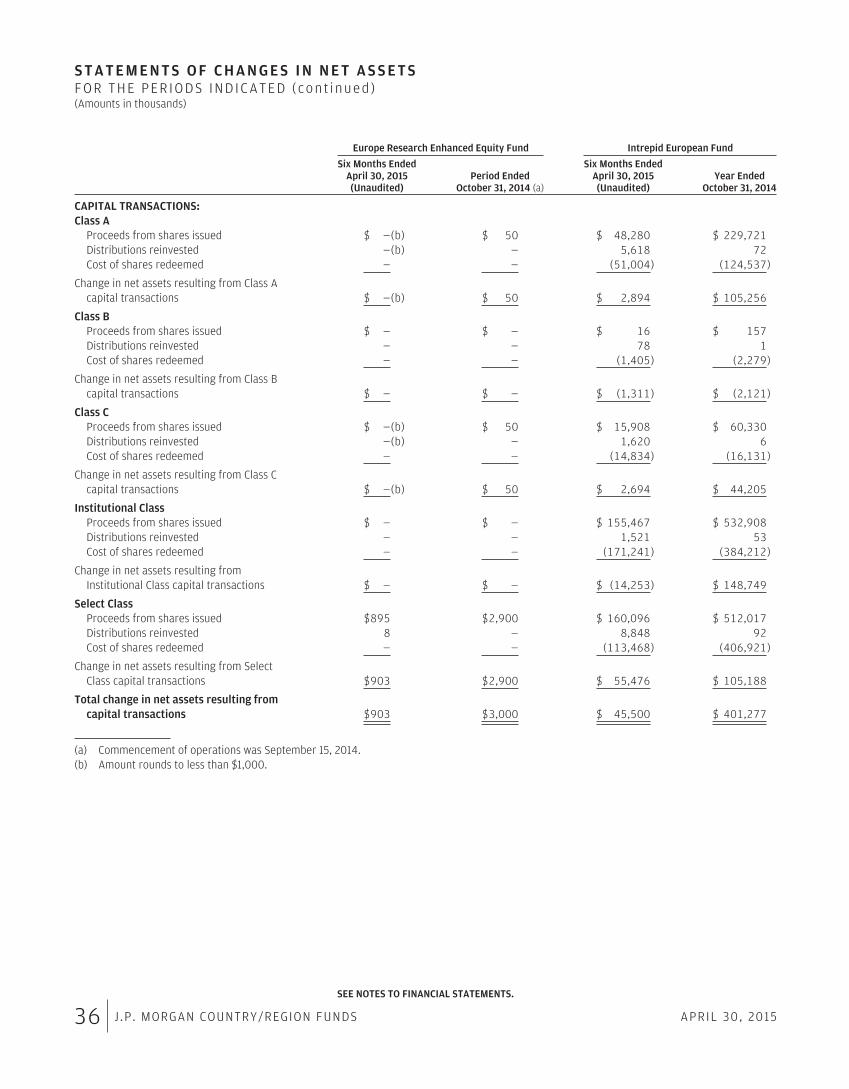
S T A T E M E N T S O F C H A N G E S I N N E T A S S E T SFOR THE PER IODS IND ICATED (con t inued )(Amounts in thousands)
Europe Research Enhanced Equity Fund Intrepid European Fund
Six Months EndedApril 30, 2015(Unaudited)
Period EndedOctober 31, 2014 (a)
Six Months EndedApril 30, 2015(Unaudited)
Year EndedOctober 31, 2014
CAPITAL TRANSACTIONS:Class A
Proceeds from shares issued $ —(b) $ 50 $ 48,280 $ 229,721Distributions reinvested —(b) — 5,618 72Cost of shares redeemed — — (51,004) (124,537)
Change in net assets resulting from Class Acapital transactions $ —(b) $ 50 $ 2,894 $ 105,256
Class BProceeds from shares issued $ — $ — $ 16 $ 157Distributions reinvested — — 78 1Cost of shares redeemed — — (1,405) (2,279)
Change in net assets resulting from Class Bcapital transactions $ — $ — $ (1,311) $ (2,121)
Class CProceeds from shares issued $ —(b) $ 50 $ 15,908 $ 60,330Distributions reinvested —(b) — 1,620 6Cost of shares redeemed — — (14,834) (16,131)
Change in net assets resulting from Class Ccapital transactions $ —(b) $ 50 $ 2,694 $ 44,205
Institutional ClassProceeds from shares issued $ — $ — $ 155,467 $ 532,908Distributions reinvested — — 1,521 53Cost of shares redeemed — — (171,241) (384,212)
Change in net assets resulting fromInstitutional Class capital transactions $ — $ — $ (14,253) $ 148,749
Select ClassProceeds from shares issued $895 $2,900 $ 160,096 $ 512,017Distributions reinvested 8 — 8,848 92Cost of shares redeemed — — (113,468) (406,921)
Change in net assets resulting from SelectClass capital transactions $903 $2,900 $ 55,476 $ 105,188
Total change in net assets resulting fromcapital transactions $903 $3,000 $ 45,500 $ 401,277
(a) Commencement of operations was September 15, 2014.(b) Amount rounds to less than $1,000.
SEE NOTES TO FINANCIAL STATEMENTS.
36 J.P. MORGAN COUNTRY/REGION FUNDS APRIL 30, 2015
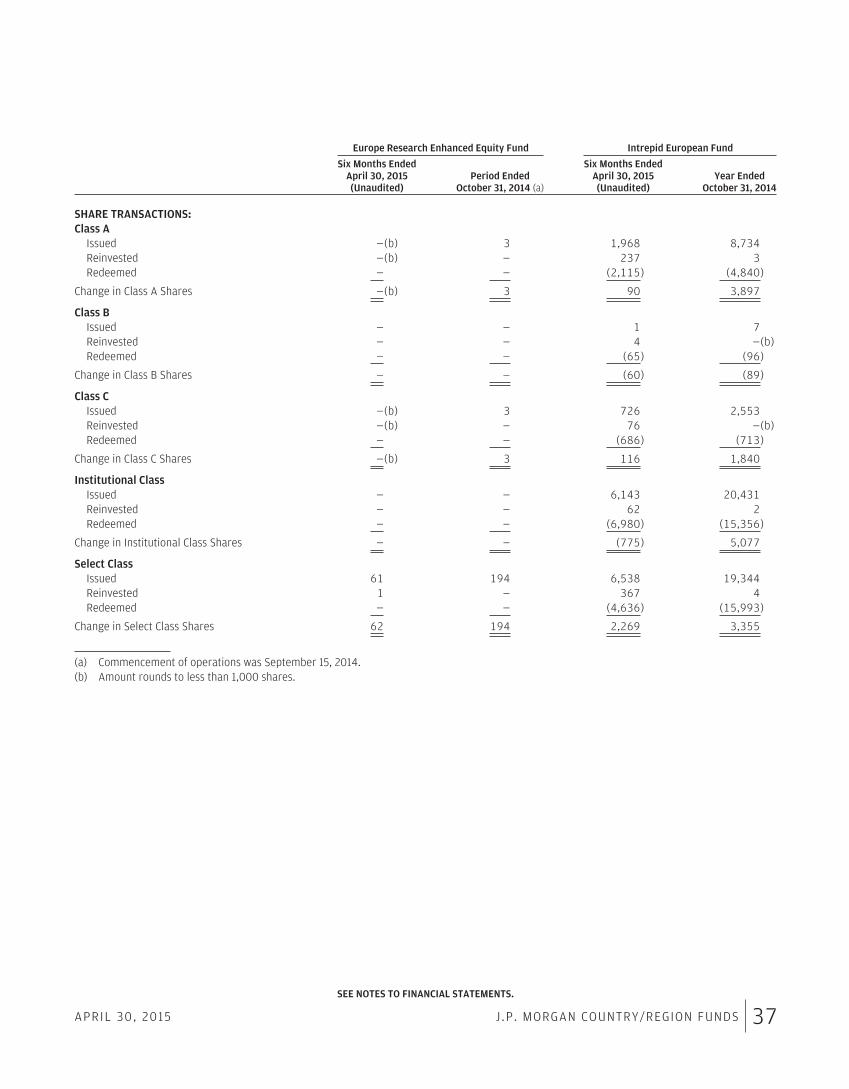
Europe Research Enhanced Equity Fund Intrepid European Fund
Six Months EndedApril 30, 2015(Unaudited)
Period EndedOctober 31, 2014 (a)
Six Months EndedApril 30, 2015(Unaudited)
Year EndedOctober 31, 2014
SHARE TRANSACTIONS:Class A
Issued —(b) 3 1,968 8,734Reinvested —(b) — 237 3Redeemed — — (2,115) (4,840)
Change in Class A Shares —(b) 3 90 3,897
Class BIssued — — 1 7Reinvested — — 4 —(b)Redeemed — — (65) (96)
Change in Class B Shares — — (60) (89)
Class CIssued —(b) 3 726 2,553Reinvested —(b) — 76 —(b)Redeemed — — (686) (713)
Change in Class C Shares —(b) 3 116 1,840
Institutional ClassIssued — — 6,143 20,431Reinvested — — 62 2Redeemed — — (6,980) (15,356)
Change in Institutional Class Shares — — (775) 5,077
Select ClassIssued 61 194 6,538 19,344Reinvested 1 — 367 4Redeemed — — (4,636) (15,993)
Change in Select Class Shares 62 194 2,269 3,355
(a) Commencement of operations was September 15, 2014.(b) Amount rounds to less than 1,000 shares.
SEE NOTES TO FINANCIAL STATEMENTS.
APRIL 30, 2015 J.P. MORGAN COUNTRY/REGION FUNDS 37
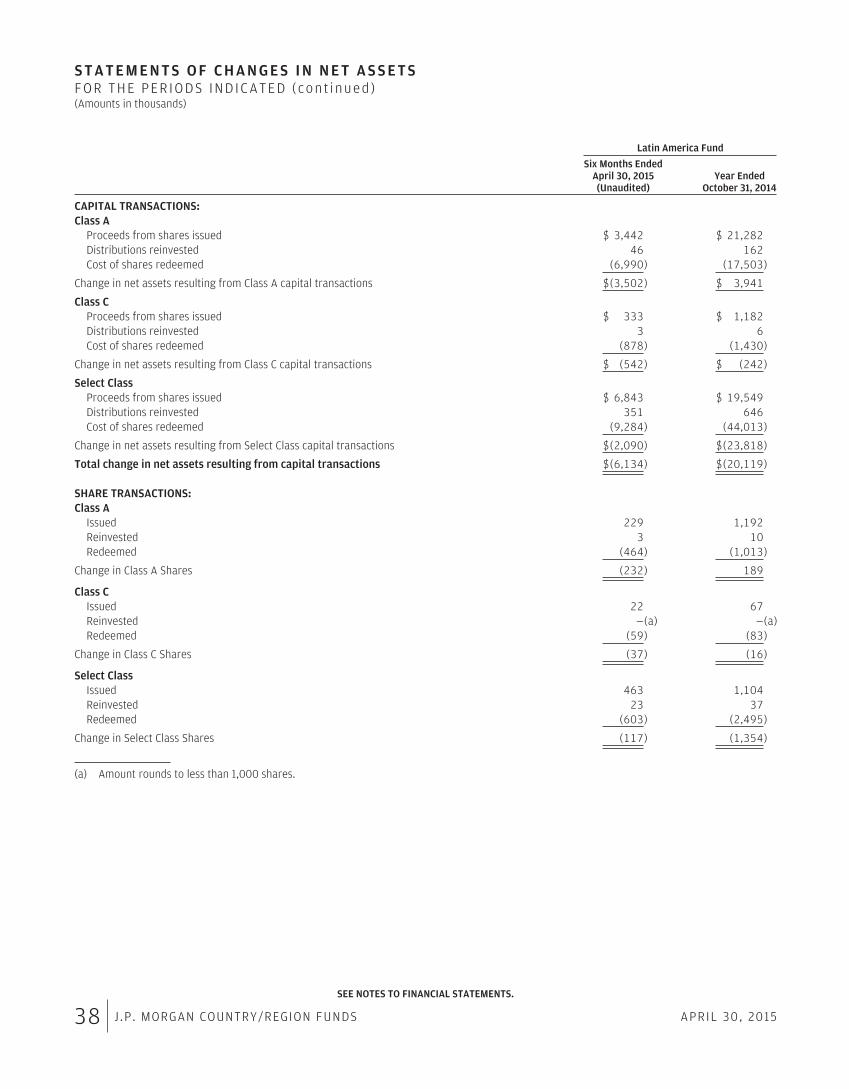
S T A T E M E N T S O F C H A N G E S I N N E T A S S E T SFOR THE PER IODS IND ICATED (con t inued )(Amounts in thousands)
Latin America Fund
Six Months EndedApril 30, 2015(Unaudited)
Year EndedOctober 31, 2014
CAPITAL TRANSACTIONS:Class A
Proceeds from shares issued $ 3,442 $ 21,282Distributions reinvested 46 162Cost of shares redeemed (6,990) (17,503)
Change in net assets resulting from Class A capital transactions $(3,502) $ 3,941
Class CProceeds from shares issued $ 333 $ 1,182Distributions reinvested 3 6Cost of shares redeemed (878) (1,430)
Change in net assets resulting from Class C capital transactions $ (542) $ (242)
Select ClassProceeds from shares issued $ 6,843 $ 19,549Distributions reinvested 351 646Cost of shares redeemed (9,284) (44,013)
Change in net assets resulting from Select Class capital transactions $(2,090) $(23,818)
Total change in net assets resulting from capital transactions $(6,134) $(20,119)
SHARE TRANSACTIONS:Class A
Issued 229 1,192Reinvested 3 10Redeemed (464) (1,013)
Change in Class A Shares (232) 189
Class CIssued 22 67Reinvested —(a) —(a)Redeemed (59) (83)
Change in Class C Shares (37) (16)
Select ClassIssued 463 1,104Reinvested 23 37Redeemed (603) (2,495)
Change in Select Class Shares (117) (1,354)
(a) Amount rounds to less than 1,000 shares.
SEE NOTES TO FINANCIAL STATEMENTS.
38 J.P. MORGAN COUNTRY/REGION FUNDS APRIL 30, 2015

THIS PAGE IS INTENTIONALLY LEFT BLANK
APRIL 30, 2015 J.P. MORGAN COUNTRY/REGION FUNDS 39
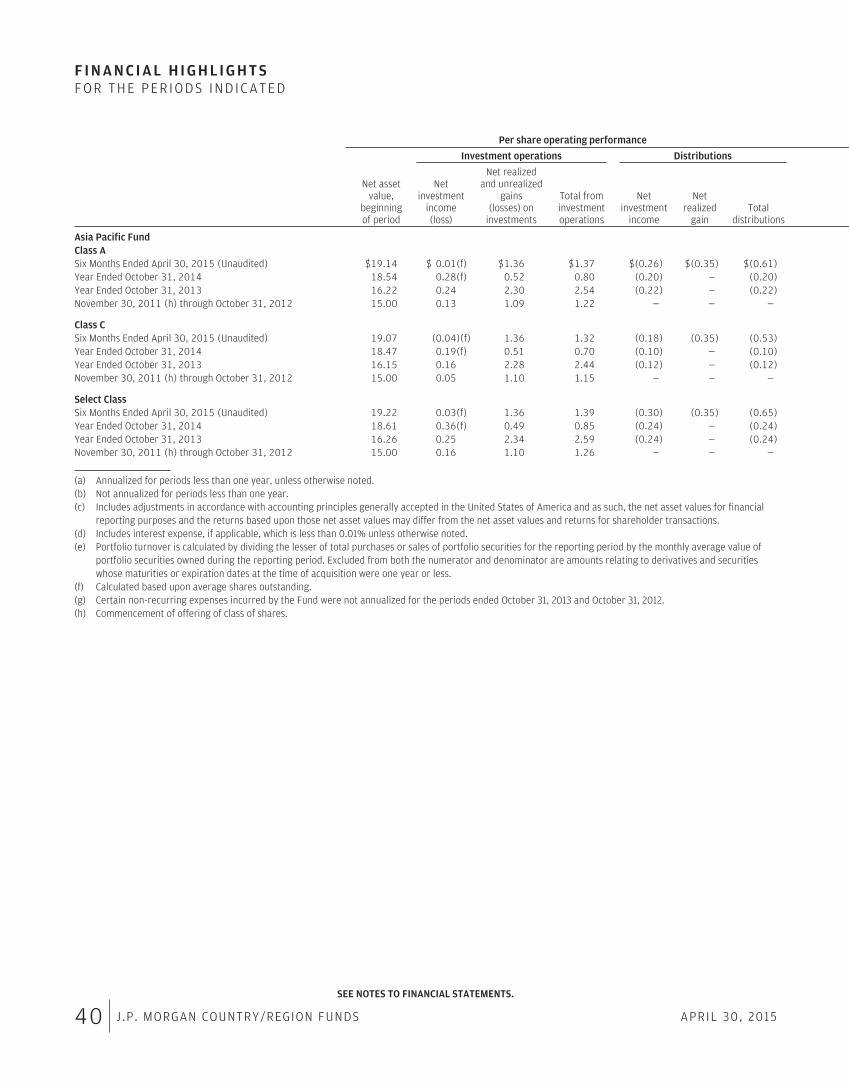
F I N A N C I A L H I G H L I G H T SFOR THE PER IODS IND ICATED
Per share operating performance
Investment operations Distributions
Net assetvalue,
beginningof period
Netinvestment
income(loss)
Net realizedand unrealized
gains(losses) on
investments
Total frominvestmentoperations
Netinvestment
income
Netrealized
gainTotal
distributions
Asia Pacific FundClass ASix Months Ended April 30, 2015 (Unaudited) $19.14 $ 0.01(f) $1.36 $1.37 $(0.26) $(0.35) $(0.61)Year Ended October 31, 2014 18.54 0.28(f) 0.52 0.80 (0.20) — (0.20)Year Ended October 31, 2013 16.22 0.24 2.30 2.54 (0.22) — (0.22)November 30, 2011 (h) through October 31, 2012 15.00 0.13 1.09 1.22 — — —
Class CSix Months Ended April 30, 2015 (Unaudited) 19.07 (0.04)(f) 1.36 1.32 (0.18) (0.35) (0.53)Year Ended October 31, 2014 18.47 0.19(f) 0.51 0.70 (0.10) — (0.10)Year Ended October 31, 2013 16.15 0.16 2.28 2.44 (0.12) — (0.12)November 30, 2011 (h) through October 31, 2012 15.00 0.05 1.10 1.15 — — —
Select ClassSix Months Ended April 30, 2015 (Unaudited) 19.22 0.03(f) 1.36 1.39 (0.30) (0.35) (0.65)Year Ended October 31, 2014 18.61 0.36(f) 0.49 0.85 (0.24) — (0.24)Year Ended October 31, 2013 16.26 0.25 2.34 2.59 (0.24) — (0.24)November 30, 2011 (h) through October 31, 2012 15.00 0.16 1.10 1.26 — — —
(a) Annualized for periods less than one year, unless otherwise noted.(b) Not annualized for periods less than one year.(c) Includes adjustments in accordance with accounting principles generally accepted in the United States of America and as such, the net asset values for financial
reporting purposes and the returns based upon those net asset values may differ from the net asset values and returns for shareholder transactions.(d) Includes interest expense, if applicable, which is less than 0.01% unless otherwise noted.(e) Portfolio turnover is calculated by dividing the lesser of total purchases or sales of portfolio securities for the reporting period by the monthly average value of
portfolio securities owned during the reporting period. Excluded from both the numerator and denominator are amounts relating to derivatives and securitieswhose maturities or expiration dates at the time of acquisition were one year or less.
(f) Calculated based upon average shares outstanding.(g) Certain non-recurring expenses incurred by the Fund were not annualized for the periods ended October 31, 2013 and October 31, 2012.(h) Commencement of offering of class of shares.
SEE NOTES TO FINANCIAL STATEMENTS.
40 J.P. MORGAN COUNTRY/REGION FUNDS APRIL 30, 2015
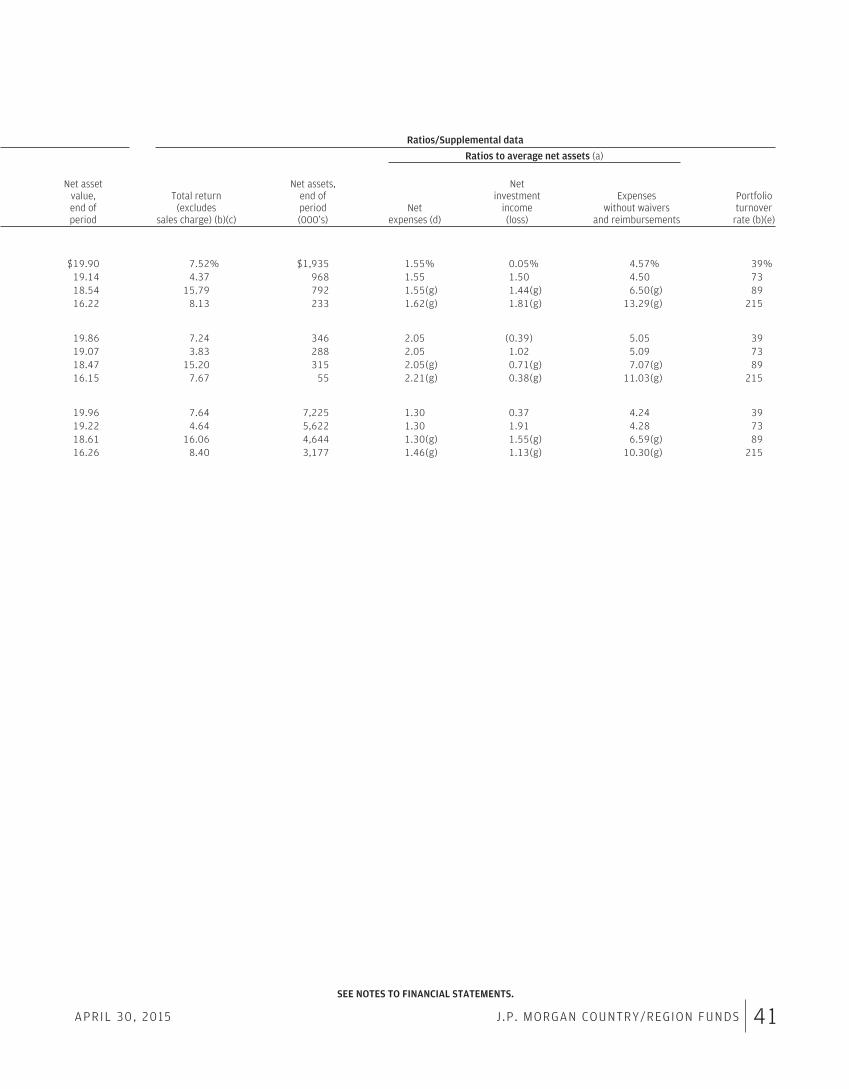
Ratios/Supplemental data
Ratios to average net assets (a)
Net assetvalue,end ofperiod
Total return(excludes
sales charge) (b)(c)
Net assets,end ofperiod(000’s)
Netexpenses (d)
Netinvestment
income(loss)
Expenseswithout waivers
and reimbursements
Portfolioturnover
rate (b)(e)
$19.90 7.52% $1,935 1.55% 0.05% 4.57% 39%19.14 4.37 968 1.55 1.50 4.50 7318.54 15.79 792 1.55(g) 1.44(g) 6.50(g) 8916.22 8.13 233 1.62(g) 1.81(g) 13.29(g) 215
19.86 7.24 346 2.05 (0.39) 5.05 3919.07 3.83 288 2.05 1.02 5.09 7318.47 15.20 315 2.05(g) 0.71(g) 7.07(g) 8916.15 7.67 55 2.21(g) 0.38(g) 11.03(g) 215
19.96 7.64 7,225 1.30 0.37 4.24 3919.22 4.64 5,622 1.30 1.91 4.28 7318.61 16.06 4,644 1.30(g) 1.55(g) 6.59(g) 8916.26 8.40 3,177 1.46(g) 1.13(g) 10.30(g) 215
SEE NOTES TO FINANCIAL STATEMENTS.
APRIL 30, 2015 J.P. MORGAN COUNTRY/REGION FUNDS 41
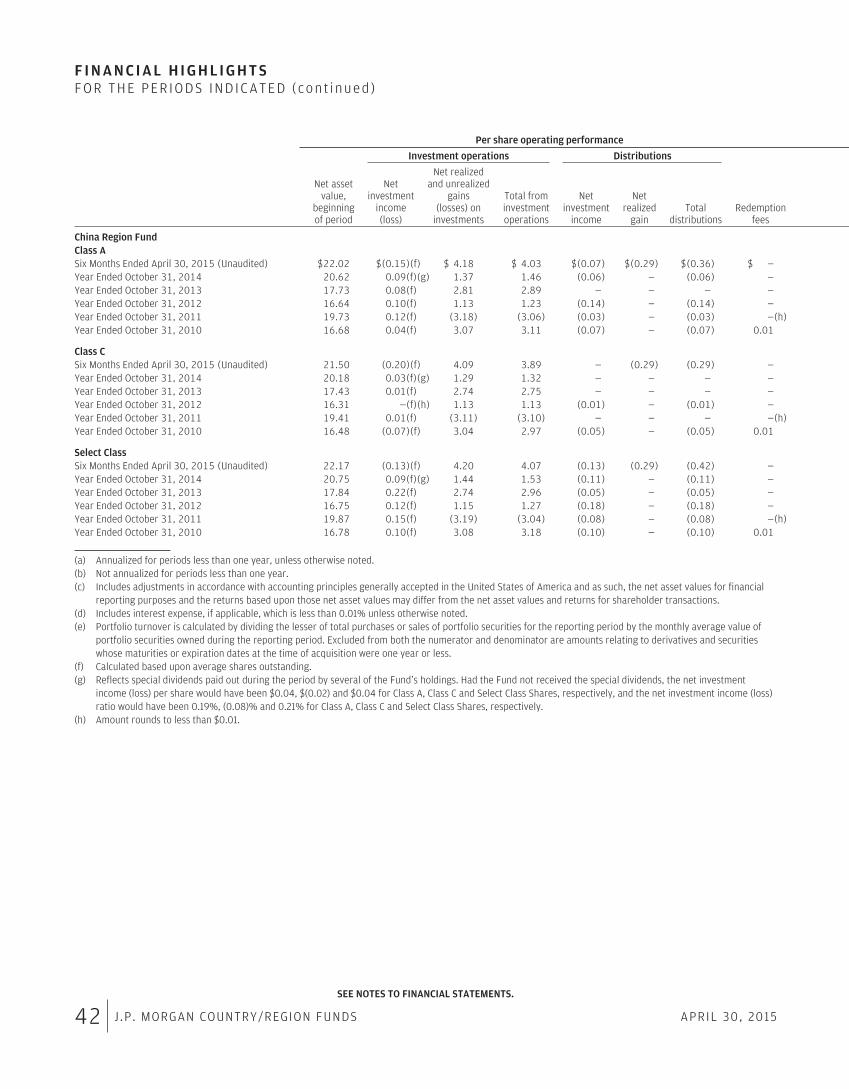
F I N A N C I A L H I G H L I G H T SFOR THE PER IODS IND ICATED (con t inued )
Per share operating performance
Investment operations Distributions
Net assetvalue,
beginningof period
Netinvestment
income(loss)
Net realizedand unrealized
gains(losses) on
investments
Total frominvestmentoperations
Netinvestment
income
Netrealized
gainTotal
distributionsRedemption
fees
China Region FundClass ASix Months Ended April 30, 2015 (Unaudited) $22.02 $(0.15)(f) $ 4.18 $ 4.03 $(0.07) $(0.29) $(0.36) $ —Year Ended October 31, 2014 20.62 0.09(f)(g) 1.37 1.46 (0.06) — (0.06) —Year Ended October 31, 2013 17.73 0.08(f) 2.81 2.89 — — — —Year Ended October 31, 2012 16.64 0.10(f) 1.13 1.23 (0.14) — (0.14) —Year Ended October 31, 2011 19.73 0.12(f) (3.18) (3.06) (0.03) — (0.03) —(h)Year Ended October 31, 2010 16.68 0.04(f) 3.07 3.11 (0.07) — (0.07) 0.01
Class CSix Months Ended April 30, 2015 (Unaudited) 21.50 (0.20)(f) 4.09 3.89 — (0.29) (0.29) —Year Ended October 31, 2014 20.18 0.03(f)(g) 1.29 1.32 — — — —Year Ended October 31, 2013 17.43 0.01(f) 2.74 2.75 — — — —Year Ended October 31, 2012 16.31 —(f)(h) 1.13 1.13 (0.01) — (0.01) —Year Ended October 31, 2011 19.41 0.01(f) (3.11) (3.10) — — — —(h)Year Ended October 31, 2010 16.48 (0.07)(f) 3.04 2.97 (0.05) — (0.05) 0.01
Select ClassSix Months Ended April 30, 2015 (Unaudited) 22.17 (0.13)(f) 4.20 4.07 (0.13) (0.29) (0.42) —Year Ended October 31, 2014 20.75 0.09(f)(g) 1.44 1.53 (0.11) — (0.11) —Year Ended October 31, 2013 17.84 0.22(f) 2.74 2.96 (0.05) — (0.05) —Year Ended October 31, 2012 16.75 0.12(f) 1.15 1.27 (0.18) — (0.18) —Year Ended October 31, 2011 19.87 0.15(f) (3.19) (3.04) (0.08) — (0.08) —(h)Year Ended October 31, 2010 16.78 0.10(f) 3.08 3.18 (0.10) — (0.10) 0.01
(a) Annualized for periods less than one year, unless otherwise noted.(b) Not annualized for periods less than one year.(c) Includes adjustments in accordance with accounting principles generally accepted in the United States of America and as such, the net asset values for financial
reporting purposes and the returns based upon those net asset values may differ from the net asset values and returns for shareholder transactions.(d) Includes interest expense, if applicable, which is less than 0.01% unless otherwise noted.(e) Portfolio turnover is calculated by dividing the lesser of total purchases or sales of portfolio securities for the reporting period by the monthly average value of
portfolio securities owned during the reporting period. Excluded from both the numerator and denominator are amounts relating to derivatives and securitieswhose maturities or expiration dates at the time of acquisition were one year or less.
(f) Calculated based upon average shares outstanding.(g) Reflects special dividends paid out during the period by several of the Fund’s holdings. Had the Fund not received the special dividends, the net investment
income (loss) per share would have been $0.04, $(0.02) and $0.04 for Class A, Class C and Select Class Shares, respectively, and the net investment income (loss)ratio would have been 0.19%, (0.08)% and 0.21% for Class A, Class C and Select Class Shares, respectively.
(h) Amount rounds to less than $0.01.
SEE NOTES TO FINANCIAL STATEMENTS.
42 J.P. MORGAN COUNTRY/REGION FUNDS APRIL 30, 2015
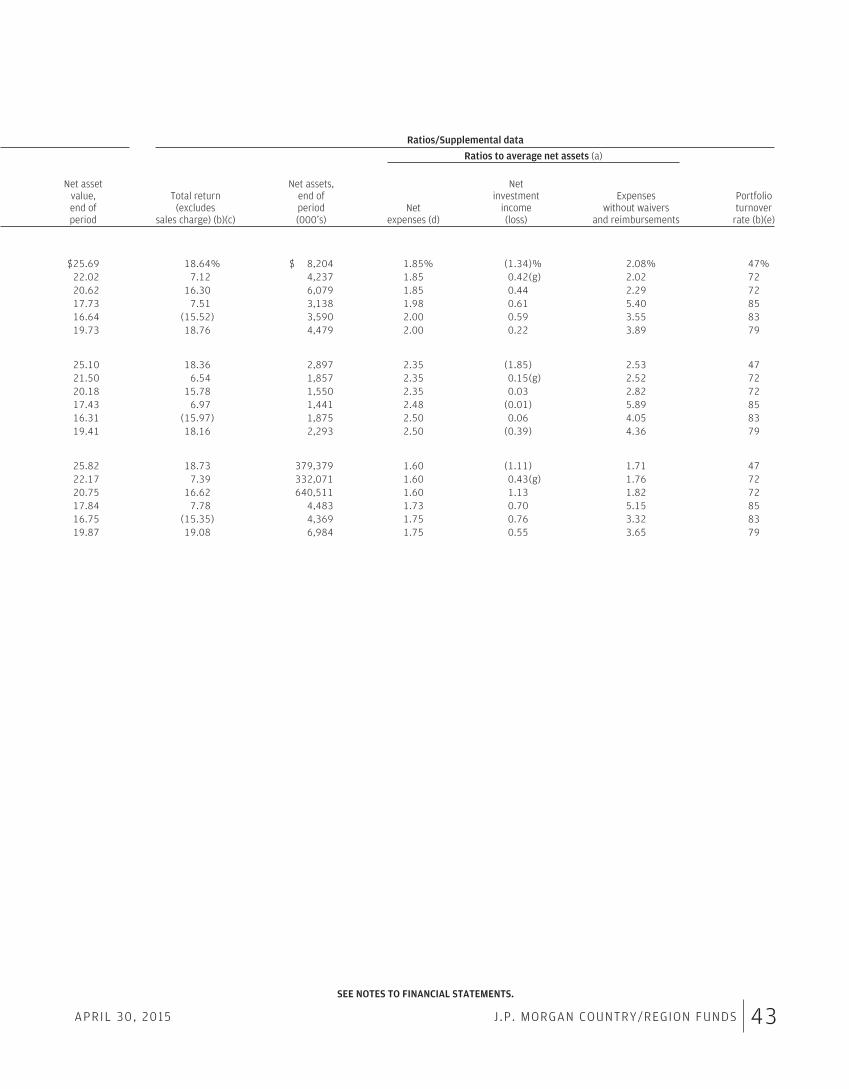
Ratios/Supplemental data
Ratios to average net assets (a)
Net assetvalue,end ofperiod
Total return(excludes
sales charge) (b)(c)
Net assets,end ofperiod(000’s)
Netexpenses (d)
Netinvestment
income(loss)
Expenseswithout waivers
and reimbursements
Portfolioturnover
rate (b)(e)
$25.69 18.64% $ 8,204 1.85% (1.34)% 2.08% 47%22.02 7.12 4,237 1.85 0.42(g) 2.02 7220.62 16.30 6,079 1.85 0.44 2.29 7217.73 7.51 3,138 1.98 0.61 5.40 8516.64 (15.52) 3,590 2.00 0.59 3.55 8319.73 18.76 4,479 2.00 0.22 3.89 79
25.10 18.36 2,897 2.35 (1.85) 2.53 4721.50 6.54 1,857 2.35 0.15(g) 2.52 7220.18 15.78 1,550 2.35 0.03 2.82 7217.43 6.97 1,441 2.48 (0.01) 5.89 8516.31 (15.97) 1,875 2.50 0.06 4.05 8319.41 18.16 2,293 2.50 (0.39) 4.36 79
25.82 18.73 379,379 1.60 (1.11) 1.71 4722.17 7.39 332,071 1.60 0.43(g) 1.76 7220.75 16.62 640,511 1.60 1.13 1.82 7217.84 7.78 4,483 1.73 0.70 5.15 8516.75 (15.35) 4,369 1.75 0.76 3.32 8319.87 19.08 6,984 1.75 0.55 3.65 79
SEE NOTES TO FINANCIAL STATEMENTS.
APRIL 30, 2015 J.P. MORGAN COUNTRY/REGION FUNDS 43
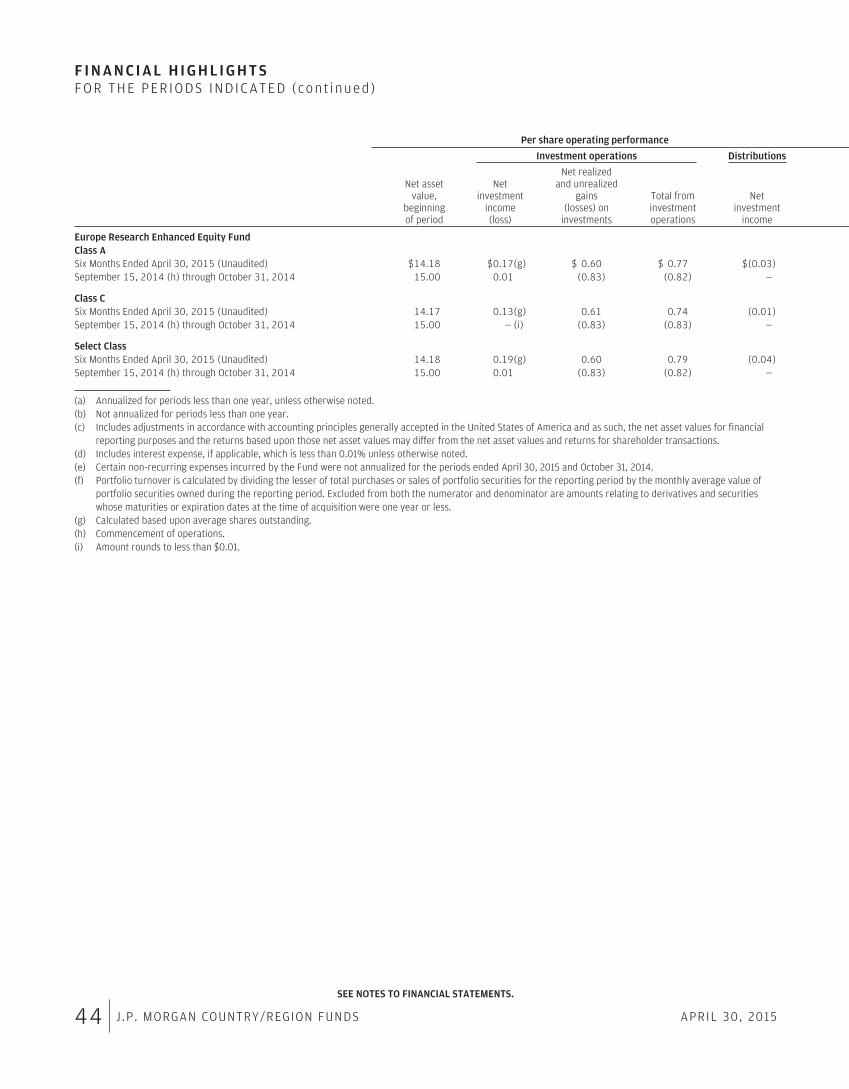
F I N A N C I A L H I G H L I G H T SFOR THE PER IODS IND ICATED (con t inued )
Per share operating performance
Investment operations Distributions
Net assetvalue,
beginningof period
Netinvestment
income(loss)
Net realizedand unrealized
gains(losses) on
investments
Total frominvestmentoperations
Netinvestment
income
Europe Research Enhanced Equity FundClass ASix Months Ended April 30, 2015 (Unaudited) $14.18 $0.17(g) $ 0.60 $ 0.77 $(0.03)September 15, 2014 (h) through October 31, 2014 15.00 0.01 (0.83) (0.82) —
Class CSix Months Ended April 30, 2015 (Unaudited) 14.17 0.13(g) 0.61 0.74 (0.01)September 15, 2014 (h) through October 31, 2014 15.00 — (i) (0.83) (0.83) —
Select ClassSix Months Ended April 30, 2015 (Unaudited) 14.18 0.19(g) 0.60 0.79 (0.04)September 15, 2014 (h) through October 31, 2014 15.00 0.01 (0.83) (0.82) —
(a) Annualized for periods less than one year, unless otherwise noted.(b) Not annualized for periods less than one year.(c) Includes adjustments in accordance with accounting principles generally accepted in the United States of America and as such, the net asset values for financial
reporting purposes and the returns based upon those net asset values may differ from the net asset values and returns for shareholder transactions.(d) Includes interest expense, if applicable, which is less than 0.01% unless otherwise noted.(e) Certain non-recurring expenses incurred by the Fund were not annualized for the periods ended April 30, 2015 and October 31, 2014.(f) Portfolio turnover is calculated by dividing the lesser of total purchases or sales of portfolio securities for the reporting period by the monthly average value of
portfolio securities owned during the reporting period. Excluded from both the numerator and denominator are amounts relating to derivatives and securitieswhose maturities or expiration dates at the time of acquisition were one year or less.
(g) Calculated based upon average shares outstanding.(h) Commencement of operations.(i) Amount rounds to less than $0.01.
SEE NOTES TO FINANCIAL STATEMENTS.
44 J.P. MORGAN COUNTRY/REGION FUNDS APRIL 30, 2015
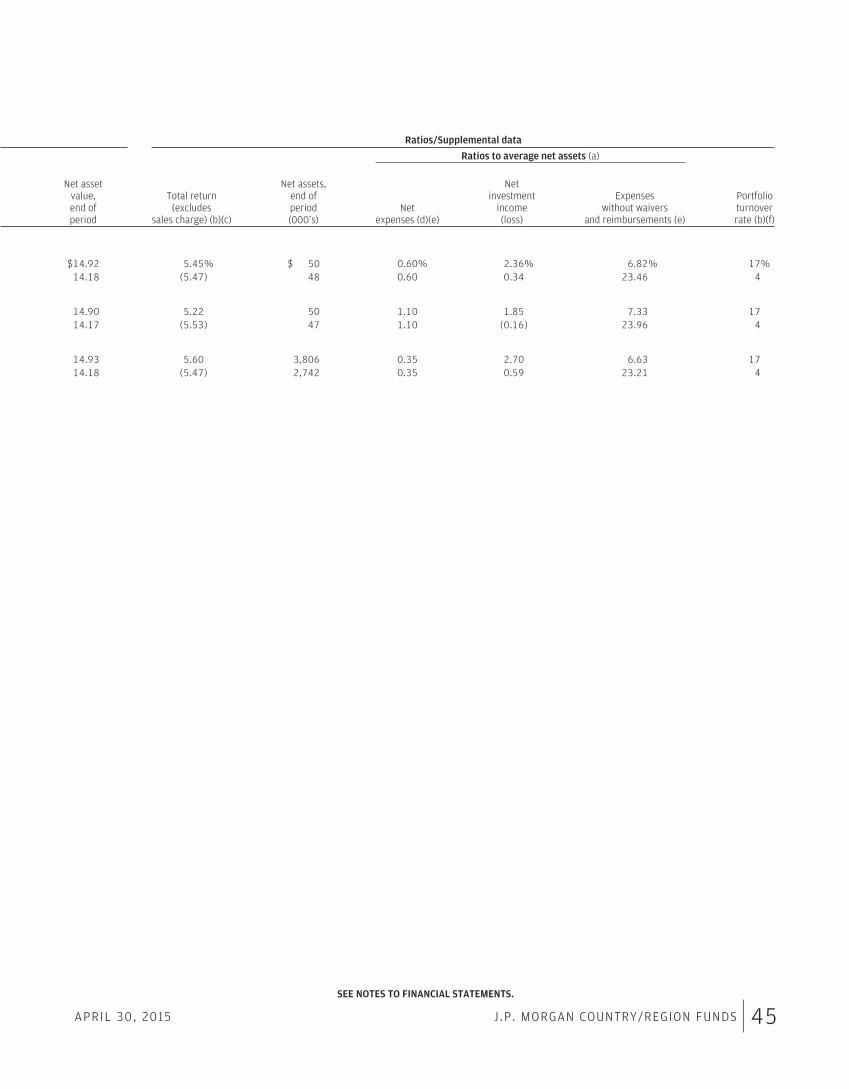
Ratios/Supplemental data
Ratios to average net assets (a)
Net assetvalue,end ofperiod
Total return(excludes
sales charge) (b)(c)
Net assets,end ofperiod(000’s)
Netexpenses (d)(e)
Netinvestment
income(loss)
Expenseswithout waivers
and reimbursements (e)
Portfolioturnoverrate (b)(f)
$14.92 5.45% $ 50 0.60% 2.36% 6.82% 17%14.18 (5.47) 48 0.60 0.34 23.46 4
14.90 5.22 50 1.10 1.85 7.33 1714.17 (5.53) 47 1.10 (0.16) 23.96 4
14.93 5.60 3,806 0.35 2.70 6.63 1714.18 (5.47) 2,742 0.35 0.59 23.21 4
SEE NOTES TO FINANCIAL STATEMENTS.
APRIL 30, 2015 J.P. MORGAN COUNTRY/REGION FUNDS 45
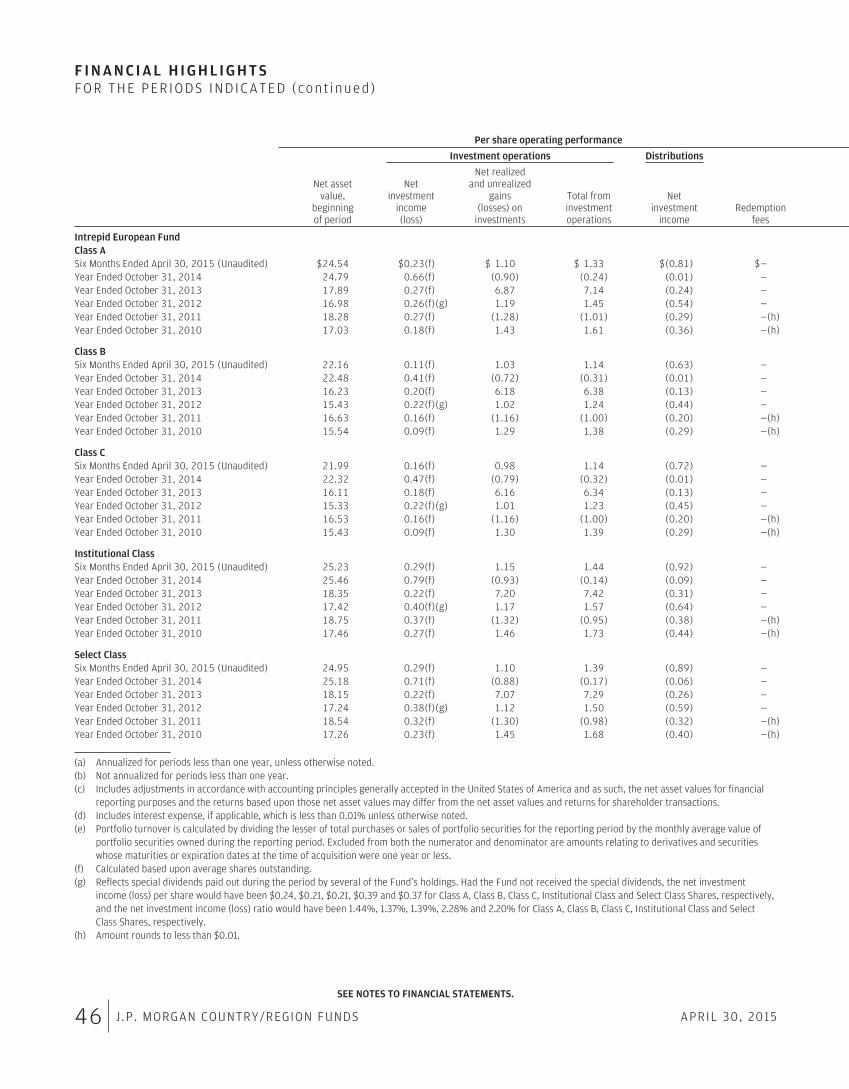
F I N A N C I A L H I G H L I G H T SFOR THE PER IODS IND ICATED (con t inued )
Per share operating performance
Investment operations Distributions
Net assetvalue,
beginningof period
Netinvestment
income(loss)
Net realizedand unrealized
gains(losses) on
investments
Total frominvestmentoperations
Netinvestment
incomeRedemption
fees
Intrepid European FundClass ASix Months Ended April 30, 2015 (Unaudited) $24.54 $0.23(f) $ 1.10 $ 1.33 $(0.81) $—Year Ended October 31, 2014 24.79 0.66(f) (0.90) (0.24) (0.01) —Year Ended October 31, 2013 17.89 0.27(f) 6.87 7.14 (0.24) —Year Ended October 31, 2012 16.98 0.26(f)(g) 1.19 1.45 (0.54) —Year Ended October 31, 2011 18.28 0.27(f) (1.28) (1.01) (0.29) —(h)Year Ended October 31, 2010 17.03 0.18(f) 1.43 1.61 (0.36) —(h)
Class BSix Months Ended April 30, 2015 (Unaudited) 22.16 0.11(f) 1.03 1.14 (0.63) —Year Ended October 31, 2014 22.48 0.41(f) (0.72) (0.31) (0.01) —Year Ended October 31, 2013 16.23 0.20(f) 6.18 6.38 (0.13) —Year Ended October 31, 2012 15.43 0.22(f)(g) 1.02 1.24 (0.44) —Year Ended October 31, 2011 16.63 0.16(f) (1.16) (1.00) (0.20) —(h)Year Ended October 31, 2010 15.54 0.09(f) 1.29 1.38 (0.29) —(h)
Class CSix Months Ended April 30, 2015 (Unaudited) 21.99 0.16(f) 0.98 1.14 (0.72) —Year Ended October 31, 2014 22.32 0.47(f) (0.79) (0.32) (0.01) —Year Ended October 31, 2013 16.11 0.18(f) 6.16 6.34 (0.13) —Year Ended October 31, 2012 15.33 0.22(f)(g) 1.01 1.23 (0.45) —Year Ended October 31, 2011 16.53 0.16(f) (1.16) (1.00) (0.20) —(h)Year Ended October 31, 2010 15.43 0.09(f) 1.30 1.39 (0.29) —(h)
Institutional ClassSix Months Ended April 30, 2015 (Unaudited) 25.23 0.29(f) 1.15 1.44 (0.92) —Year Ended October 31, 2014 25.46 0.79(f) (0.93) (0.14) (0.09) —Year Ended October 31, 2013 18.35 0.22(f) 7.20 7.42 (0.31) —Year Ended October 31, 2012 17.42 0.40(f)(g) 1.17 1.57 (0.64) —Year Ended October 31, 2011 18.75 0.37(f) (1.32) (0.95) (0.38) —(h)Year Ended October 31, 2010 17.46 0.27(f) 1.46 1.73 (0.44) —(h)
Select ClassSix Months Ended April 30, 2015 (Unaudited) 24.95 0.29(f) 1.10 1.39 (0.89) —Year Ended October 31, 2014 25.18 0.71(f) (0.88) (0.17) (0.06) —Year Ended October 31, 2013 18.15 0.22(f) 7.07 7.29 (0.26) —Year Ended October 31, 2012 17.24 0.38(f)(g) 1.12 1.50 (0.59) —Year Ended October 31, 2011 18.54 0.32(f) (1.30) (0.98) (0.32) —(h)Year Ended October 31, 2010 17.26 0.23(f) 1.45 1.68 (0.40) —(h)
(a) Annualized for periods less than one year, unless otherwise noted.(b) Not annualized for periods less than one year.(c) Includes adjustments in accordance with accounting principles generally accepted in the United States of America and as such, the net asset values for financial
reporting purposes and the returns based upon those net asset values may differ from the net asset values and returns for shareholder transactions.(d) Includes interest expense, if applicable, which is less than 0.01% unless otherwise noted.(e) Portfolio turnover is calculated by dividing the lesser of total purchases or sales of portfolio securities for the reporting period by the monthly average value of
portfolio securities owned during the reporting period. Excluded from both the numerator and denominator are amounts relating to derivatives and securitieswhose maturities or expiration dates at the time of acquisition were one year or less.
(f) Calculated based upon average shares outstanding.(g) Reflects special dividends paid out during the period by several of the Fund’s holdings. Had the Fund not received the special dividends, the net investment
income (loss) per share would have been $0.24, $0.21, $0.21, $0.39 and $0.37 for Class A, Class B, Class C, Institutional Class and Select Class Shares, respectively,and the net investment income (loss) ratio would have been 1.44%, 1.37%, 1.39%, 2.28% and 2.20% for Class A, Class B, Class C, Institutional Class and SelectClass Shares, respectively.
(h) Amount rounds to less than $0.01.
SEE NOTES TO FINANCIAL STATEMENTS.
46 J.P. MORGAN COUNTRY/REGION FUNDS APRIL 30, 2015
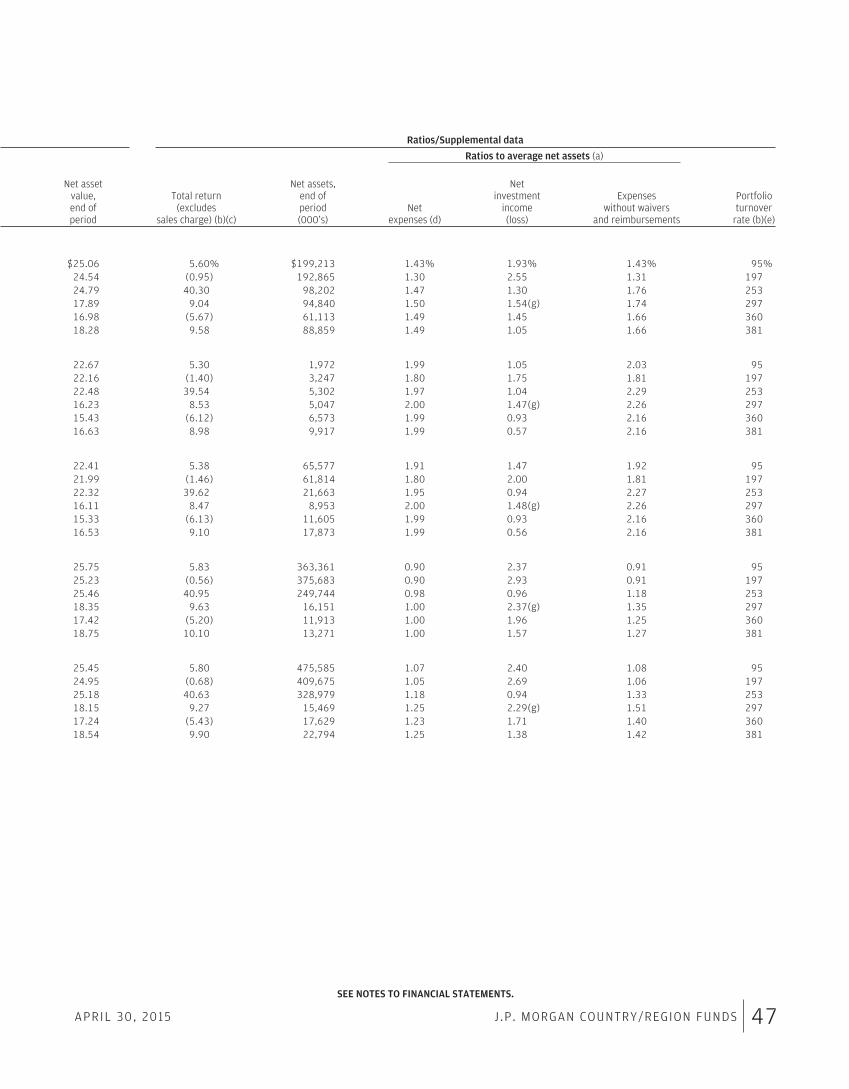
Ratios/Supplemental data
Ratios to average net assets (a)
Net assetvalue,end ofperiod
Total return(excludes
sales charge) (b)(c)
Net assets,end ofperiod(000’s)
Netexpenses (d)
Netinvestment
income(loss)
Expenseswithout waivers
and reimbursements
Portfolioturnover
rate (b)(e)
$25.06 5.60% $199,213 1.43% 1.93% 1.43% 95%24.54 (0.95) 192,865 1.30 2.55 1.31 19724.79 40.30 98,202 1.47 1.30 1.76 25317.89 9.04 94,840 1.50 1.54(g) 1.74 29716.98 (5.67) 61,113 1.49 1.45 1.66 36018.28 9.58 88,859 1.49 1.05 1.66 381
22.67 5.30 1,972 1.99 1.05 2.03 9522.16 (1.40) 3,247 1.80 1.75 1.81 19722.48 39.54 5,302 1.97 1.04 2.29 25316.23 8.53 5,047 2.00 1.47(g) 2.26 29715.43 (6.12) 6,573 1.99 0.93 2.16 36016.63 8.98 9,917 1.99 0.57 2.16 381
22.41 5.38 65,577 1.91 1.47 1.92 9521.99 (1.46) 61,814 1.80 2.00 1.81 19722.32 39.62 21,663 1.95 0.94 2.27 25316.11 8.47 8,953 2.00 1.48(g) 2.26 29715.33 (6.13) 11,605 1.99 0.93 2.16 36016.53 9.10 17,873 1.99 0.56 2.16 381
25.75 5.83 363,361 0.90 2.37 0.91 9525.23 (0.56) 375,683 0.90 2.93 0.91 19725.46 40.95 249,744 0.98 0.96 1.18 25318.35 9.63 16,151 1.00 2.37(g) 1.35 29717.42 (5.20) 11,913 1.00 1.96 1.25 36018.75 10.10 13,271 1.00 1.57 1.27 381
25.45 5.80 475,585 1.07 2.40 1.08 9524.95 (0.68) 409,675 1.05 2.69 1.06 19725.18 40.63 328,979 1.18 0.94 1.33 25318.15 9.27 15,469 1.25 2.29(g) 1.51 29717.24 (5.43) 17,629 1.23 1.71 1.40 36018.54 9.90 22,794 1.25 1.38 1.42 381
SEE NOTES TO FINANCIAL STATEMENTS.
APRIL 30, 2015 J.P. MORGAN COUNTRY/REGION FUNDS 47
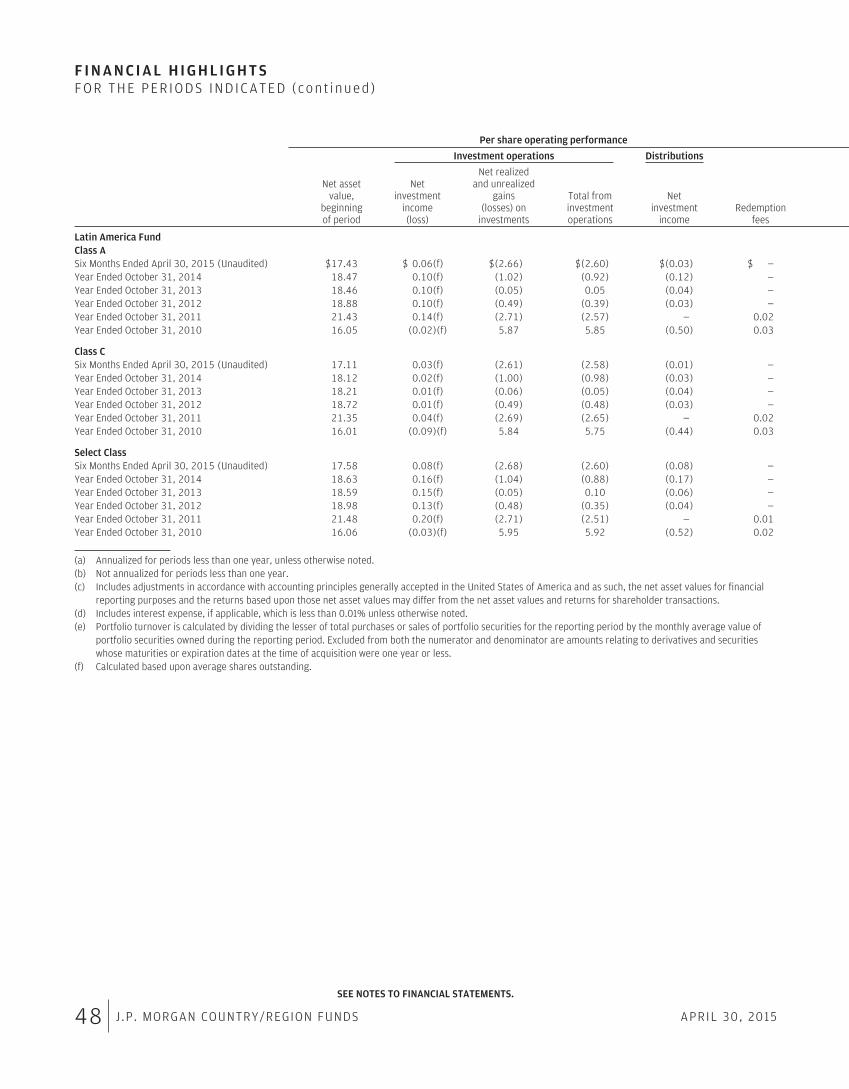
F I N A N C I A L H I G H L I G H T SFOR THE PER IODS IND ICATED (con t inued )
Per share operating performance
Investment operations Distributions
Net assetvalue,
beginningof period
Netinvestment
income(loss)
Net realizedand unrealized
gains(losses) on
investments
Total frominvestmentoperations
Netinvestment
incomeRedemption
fees
Latin America FundClass ASix Months Ended April 30, 2015 (Unaudited) $17.43 $ 0.06(f) $(2.66) $(2.60) $(0.03) $ —Year Ended October 31, 2014 18.47 0.10(f) (1.02) (0.92) (0.12) —Year Ended October 31, 2013 18.46 0.10(f) (0.05) 0.05 (0.04) —Year Ended October 31, 2012 18.88 0.10(f) (0.49) (0.39) (0.03) —Year Ended October 31, 2011 21.43 0.14(f) (2.71) (2.57) — 0.02Year Ended October 31, 2010 16.05 (0.02)(f) 5.87 5.85 (0.50) 0.03
Class CSix Months Ended April 30, 2015 (Unaudited) 17.11 0.03(f) (2.61) (2.58) (0.01) —Year Ended October 31, 2014 18.12 0.02(f) (1.00) (0.98) (0.03) —Year Ended October 31, 2013 18.21 0.01(f) (0.06) (0.05) (0.04) —Year Ended October 31, 2012 18.72 0.01(f) (0.49) (0.48) (0.03) —Year Ended October 31, 2011 21.35 0.04(f) (2.69) (2.65) — 0.02Year Ended October 31, 2010 16.01 (0.09)(f) 5.84 5.75 (0.44) 0.03
Select ClassSix Months Ended April 30, 2015 (Unaudited) 17.58 0.08(f) (2.68) (2.60) (0.08) —Year Ended October 31, 2014 18.63 0.16(f) (1.04) (0.88) (0.17) —Year Ended October 31, 2013 18.59 0.15(f) (0.05) 0.10 (0.06) —Year Ended October 31, 2012 18.98 0.13(f) (0.48) (0.35) (0.04) —Year Ended October 31, 2011 21.48 0.20(f) (2.71) (2.51) — 0.01Year Ended October 31, 2010 16.06 (0.03)(f) 5.95 5.92 (0.52) 0.02
(a) Annualized for periods less than one year, unless otherwise noted.(b) Not annualized for periods less than one year.(c) Includes adjustments in accordance with accounting principles generally accepted in the United States of America and as such, the net asset values for financial
reporting purposes and the returns based upon those net asset values may differ from the net asset values and returns for shareholder transactions.(d) Includes interest expense, if applicable, which is less than 0.01% unless otherwise noted.(e) Portfolio turnover is calculated by dividing the lesser of total purchases or sales of portfolio securities for the reporting period by the monthly average value of
portfolio securities owned during the reporting period. Excluded from both the numerator and denominator are amounts relating to derivatives and securitieswhose maturities or expiration dates at the time of acquisition were one year or less.
(f) Calculated based upon average shares outstanding.
SEE NOTES TO FINANCIAL STATEMENTS.
48 J.P. MORGAN COUNTRY/REGION FUNDS APRIL 30, 2015
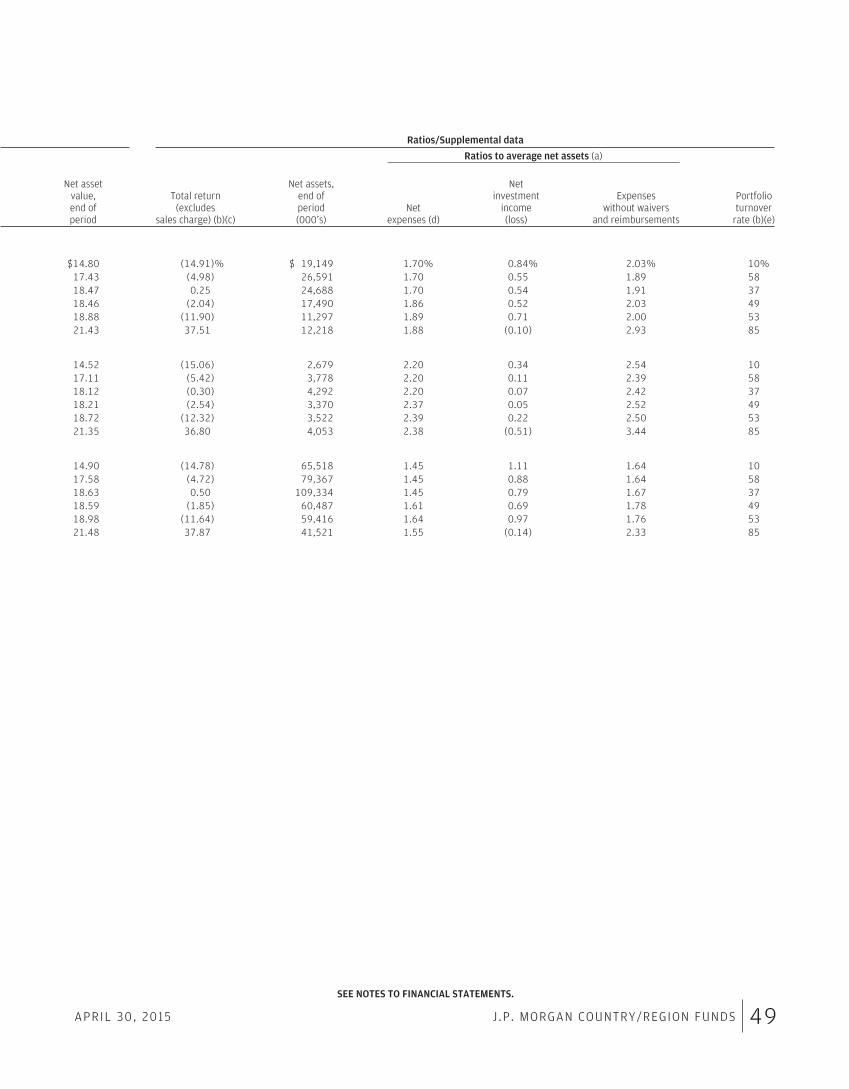
Ratios/Supplemental data
Ratios to average net assets (a)
Net assetvalue,end ofperiod
Total return(excludes
sales charge) (b)(c)
Net assets,end ofperiod(000’s)
Netexpenses (d)
Netinvestment
income(loss)
Expenseswithout waivers
and reimbursements
Portfolioturnover
rate (b)(e)
$14.80 (14.91)% $ 19,149 1.70% 0.84% 2.03% 10%17.43 (4.98) 26,591 1.70 0.55 1.89 5818.47 0.25 24,688 1.70 0.54 1.91 3718.46 (2.04) 17,490 1.86 0.52 2.03 4918.88 (11.90) 11,297 1.89 0.71 2.00 5321.43 37.51 12,218 1.88 (0.10) 2.93 85
14.52 (15.06) 2,679 2.20 0.34 2.54 1017.11 (5.42) 3,778 2.20 0.11 2.39 5818.12 (0.30) 4,292 2.20 0.07 2.42 3718.21 (2.54) 3,370 2.37 0.05 2.52 4918.72 (12.32) 3,522 2.39 0.22 2.50 5321.35 36.80 4,053 2.38 (0.51) 3.44 85
14.90 (14.78) 65,518 1.45 1.11 1.64 1017.58 (4.72) 79,367 1.45 0.88 1.64 5818.63 0.50 109,334 1.45 0.79 1.67 3718.59 (1.85) 60,487 1.61 0.69 1.78 4918.98 (11.64) 59,416 1.64 0.97 1.76 5321.48 37.87 41,521 1.55 (0.14) 2.33 85
SEE NOTES TO FINANCIAL STATEMENTS.
APRIL 30, 2015 J.P. MORGAN COUNTRY/REGION FUNDS 49
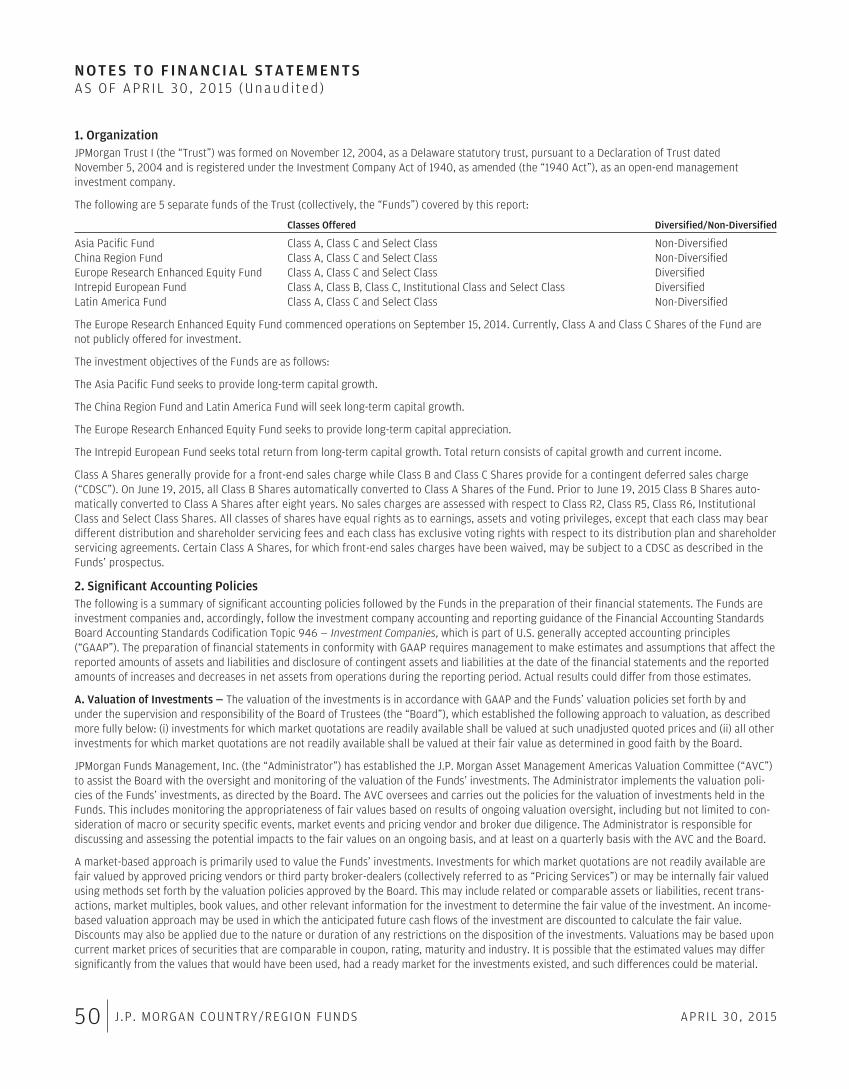
N O T E S T O F I N A N C I A L S T A T E M E N T SAS OF APR IL 30 , 2015 (Unaud i ted )
1. OrganizationJPMorgan Trust I (the “Trust”) was formed on November 12, 2004, as a Delaware statutory trust, pursuant to a Declaration of Trust datedNovember 5, 2004 and is registered under the Investment Company Act of 1940, as amended (the “1940 Act”), as an open-end managementinvestment company.
The following are 5 separate funds of the Trust (collectively, the “Funds”) covered by this report:
Classes Offered Diversified/Non-Diversified
Asia Pacific Fund Class A, Class C and Select Class Non-DiversifiedChina Region Fund Class A, Class C and Select Class Non-DiversifiedEurope Research Enhanced Equity Fund Class A, Class C and Select Class DiversifiedIntrepid European Fund Class A, Class B, Class C, Institutional Class and Select Class DiversifiedLatin America Fund Class A, Class C and Select Class Non-Diversified
The Europe Research Enhanced Equity Fund commenced operations on September 15, 2014. Currently, Class A and Class C Shares of the Fund arenot publicly offered for investment.
The investment objectives of the Funds are as follows:
The Asia Pacific Fund seeks to provide long-term capital growth.
The China Region Fund and Latin America Fund will seek long-term capital growth.
The Europe Research Enhanced Equity Fund seeks to provide long-term capital appreciation.
The Intrepid European Fund seeks total return from long-term capital growth. Total return consists of capital growth and current income.
Class A Shares generally provide for a front-end sales charge while Class B and Class C Shares provide for a contingent deferred sales charge(“CDSC”). On June 19, 2015, all Class B Shares automatically converted to Class A Shares of the Fund. Prior to June 19, 2015 Class B Shares auto-matically converted to Class A Shares after eight years. No sales charges are assessed with respect to Class R2, Class R5, Class R6, InstitutionalClass and Select Class Shares. All classes of shares have equal rights as to earnings, assets and voting privileges, except that each class may beardifferent distribution and shareholder servicing fees and each class has exclusive voting rights with respect to its distribution plan and shareholderservicing agreements. Certain Class A Shares, for which front-end sales charges have been waived, may be subject to a CDSC as described in theFunds’ prospectus.
2. Significant Accounting PoliciesThe following is a summary of significant accounting policies followed by the Funds in the preparation of their financial statements. The Funds areinvestment companies and, accordingly, follow the investment company accounting and reporting guidance of the Financial Accounting StandardsBoard Accounting Standards Codification Topic 946 — Investment Companies, which is part of U.S. generally accepted accounting principles(“GAAP”). The preparation of financial statements in conformity with GAAP requires management to make estimates and assumptions that affect thereported amounts of assets and liabilities and disclosure of contingent assets and liabilities at the date of the financial statements and the reportedamounts of increases and decreases in net assets from operations during the reporting period. Actual results could differ from those estimates.
A. Valuation of Investments — The valuation of the investments is in accordance with GAAP and the Funds’ valuation policies set forth by andunder the supervision and responsibility of the Board of Trustees (the “Board”), which established the following approach to valuation, as describedmore fully below: (i) investments for which market quotations are readily available shall be valued at such unadjusted quoted prices and (ii) all otherinvestments for which market quotations are not readily available shall be valued at their fair value as determined in good faith by the Board.
JPMorgan Funds Management, Inc. (the “Administrator”) has established the J.P. Morgan Asset Management Americas Valuation Committee (“AVC”)to assist the Board with the oversight and monitoring of the valuation of the Funds’ investments. The Administrator implements the valuation poli-cies of the Funds’ investments, as directed by the Board. The AVC oversees and carries out the policies for the valuation of investments held in theFunds. This includes monitoring the appropriateness of fair values based on results of ongoing valuation oversight, including but not limited to con-sideration of macro or security specific events, market events and pricing vendor and broker due diligence. The Administrator is responsible fordiscussing and assessing the potential impacts to the fair values on an ongoing basis, and at least on a quarterly basis with the AVC and the Board.
A market-based approach is primarily used to value the Funds’ investments. Investments for which market quotations are not readily available arefair valued by approved pricing vendors or third party broker-dealers (collectively referred to as “Pricing Services”) or may be internally fair valuedusing methods set forth by the valuation policies approved by the Board. This may include related or comparable assets or liabilities, recent trans-actions, market multiples, book values, and other relevant information for the investment to determine the fair value of the investment. An income-based valuation approach may be used in which the anticipated future cash flows of the investment are discounted to calculate the fair value.Discounts may also be applied due to the nature or duration of any restrictions on the disposition of the investments. Valuations may be based uponcurrent market prices of securities that are comparable in coupon, rating, maturity and industry. It is possible that the estimated values may differsignificantly from the values that would have been used, had a ready market for the investments existed, and such differences could be material.
50 J.P. MORGAN COUNTRY/REGION FUNDS APRIL 30, 2015
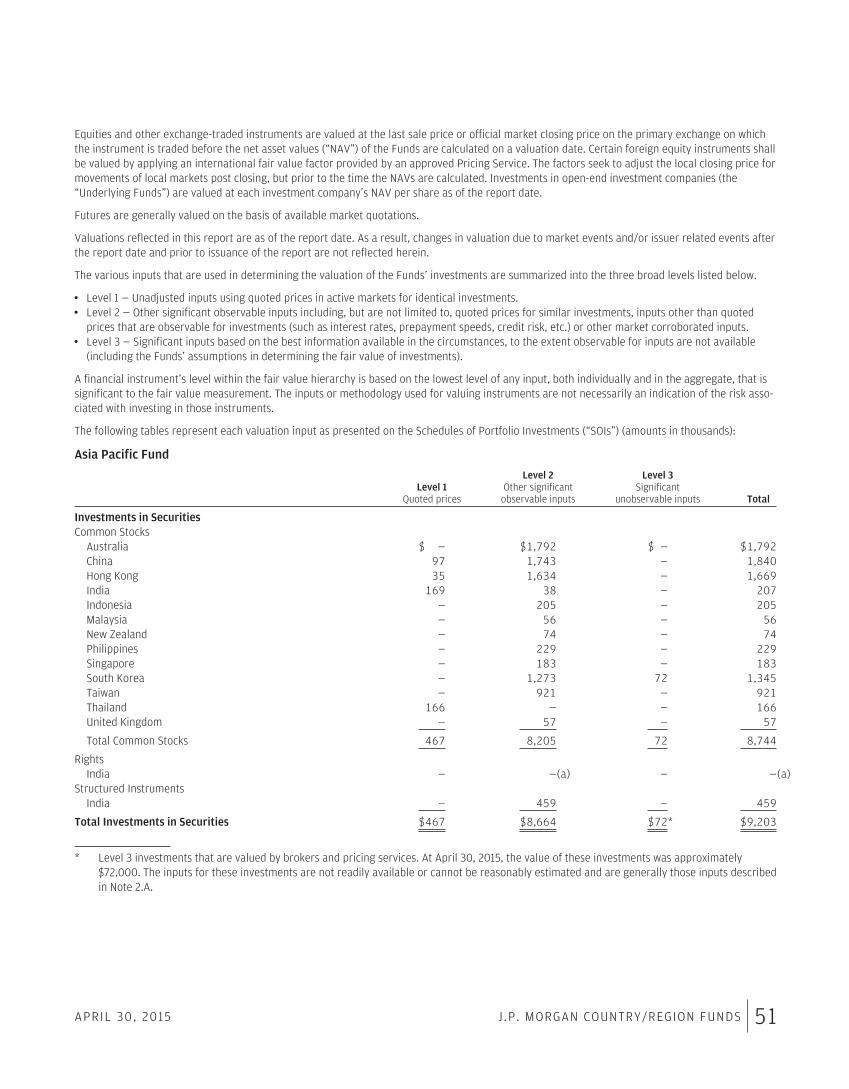
Equities and other exchange-traded instruments are valued at the last sale price or official market closing price on the primary exchange on whichthe instrument is traded before the net asset values (“NAV”) of the Funds are calculated on a valuation date. Certain foreign equity instruments shallbe valued by applying an international fair value factor provided by an approved Pricing Service. The factors seek to adjust the local closing price formovements of local markets post closing, but prior to the time the NAVs are calculated. Investments in open-end investment companies (the“Underlying Funds”) are valued at each investment company’s NAV per share as of the report date.
Futures are generally valued on the basis of available market quotations.
Valuations reflected in this report are as of the report date. As a result, changes in valuation due to market events and/or issuer related events afterthe report date and prior to issuance of the report are not reflected herein.
The various inputs that are used in determining the valuation of the Funds’ investments are summarized into the three broad levels listed below.
‰ Level 1 — Unadjusted inputs using quoted prices in active markets for identical investments.‰ Level 2 — Other significant observable inputs including, but are not limited to, quoted prices for similar investments, inputs other than quoted
prices that are observable for investments (such as interest rates, prepayment speeds, credit risk, etc.) or other market corroborated inputs.‰ Level 3 — Significant inputs based on the best information available in the circumstances, to the extent observable for inputs are not available
(including the Funds’ assumptions in determining the fair value of investments).
A financial instrument’s level within the fair value hierarchy is based on the lowest level of any input, both individually and in the aggregate, that issignificant to the fair value measurement. The inputs or methodology used for valuing instruments are not necessarily an indication of the risk asso-ciated with investing in those instruments.
The following tables represent each valuation input as presented on the Schedules of Portfolio Investments (“SOIs”) (amounts in thousands):
Asia Pacific Fund
Level 1Quoted prices
Level 2Other significant
observable inputs
Level 3Significant
unobservable inputs Total
Investments in SecuritiesCommon Stocks
Australia $ — $1,792 $ — $1,792China 97 1,743 — 1,840Hong Kong 35 1,634 — 1,669India 169 38 — 207Indonesia — 205 — 205Malaysia — 56 — 56New Zealand — 74 — 74Philippines — 229 — 229Singapore — 183 — 183South Korea — 1,273 72 1,345Taiwan — 921 — 921Thailand 166 — — 166United Kingdom — 57 — 57
Total Common Stocks 467 8,205 72 8,744
RightsIndia — —(a) — —(a)
Structured InstrumentsIndia — 459 — 459
Total Investments in Securities $467 $8,664 $72* $9,203
* Level 3 investments that are valued by brokers and pricing services. At April 30, 2015, the value of these investments was approximately$72,000. The inputs for these investments are not readily available or cannot be reasonably estimated and are generally those inputs describedin Note 2.A.
APRIL 30, 2015 J.P. MORGAN COUNTRY/REGION FUNDS 51
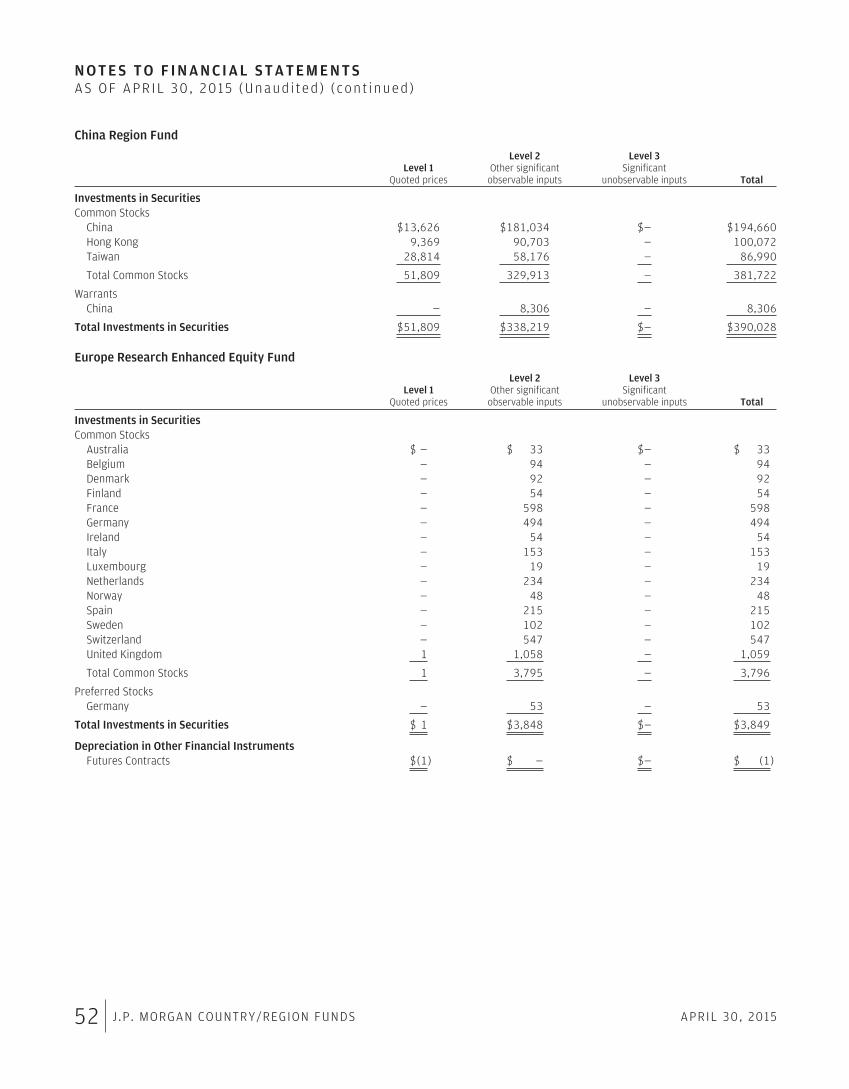
N O T E S T O F I N A N C I A L S T A T E M E N T SAS OF APR IL 30 , 2015 (Unaud i ted ) ( con t inued )
China Region Fund
Level 1Quoted prices
Level 2Other significant
observable inputs
Level 3Significant
unobservable inputs Total
Investments in SecuritiesCommon Stocks
China $13,626 $181,034 $— $194,660Hong Kong 9,369 90,703 — 100,072Taiwan 28,814 58,176 — 86,990
Total Common Stocks 51,809 329,913 — 381,722
WarrantsChina — 8,306 — 8,306
Total Investments in Securities $51,809 $338,219 $— $390,028
Europe Research Enhanced Equity Fund
Level 1Quoted prices
Level 2Other significant
observable inputs
Level 3Significant
unobservable inputs Total
Investments in SecuritiesCommon Stocks
Australia $ — $ 33 $— $ 33Belgium — 94 — 94Denmark — 92 — 92Finland — 54 — 54France — 598 — 598Germany — 494 — 494Ireland — 54 — 54Italy — 153 — 153Luxembourg — 19 — 19Netherlands — 234 — 234Norway — 48 — 48Spain — 215 — 215Sweden — 102 — 102Switzerland — 547 — 547United Kingdom 1 1,058 — 1,059
Total Common Stocks 1 3,795 — 3,796
Preferred StocksGermany — 53 — 53
Total Investments in Securities $ 1 $3,848 $— $3,849
Depreciation in Other Financial InstrumentsFutures Contracts $(1) $ — $— $ (1)
52 J.P. MORGAN COUNTRY/REGION FUNDS APRIL 30, 2015
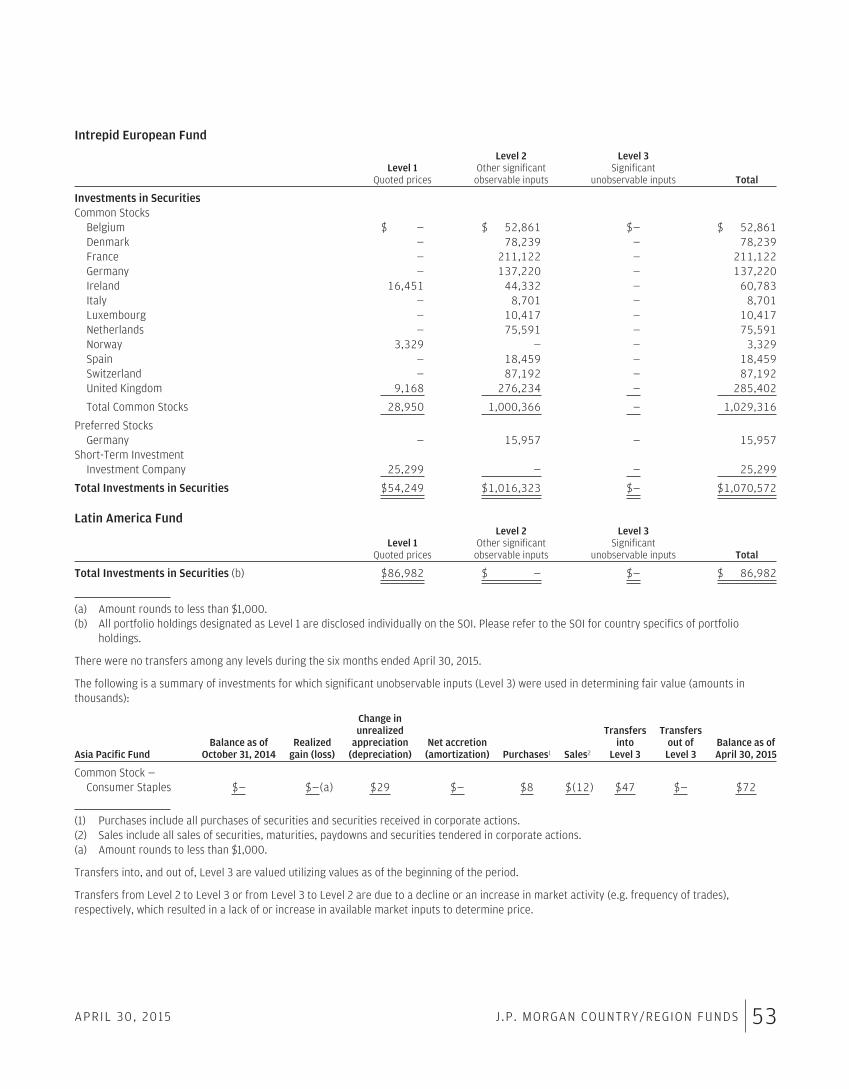
Intrepid European Fund
Level 1Quoted prices
Level 2Other significant
observable inputs
Level 3Significant
unobservable inputs Total
Investments in SecuritiesCommon Stocks
Belgium $ — $ 52,861 $— $ 52,861Denmark — 78,239 — 78,239France — 211,122 — 211,122Germany — 137,220 — 137,220Ireland 16,451 44,332 — 60,783Italy — 8,701 — 8,701Luxembourg — 10,417 — 10,417Netherlands — 75,591 — 75,591Norway 3,329 — — 3,329Spain — 18,459 — 18,459Switzerland — 87,192 — 87,192United Kingdom 9,168 276,234 — 285,402
Total Common Stocks 28,950 1,000,366 — 1,029,316
Preferred StocksGermany — 15,957 — 15,957
Short-Term InvestmentInvestment Company 25,299 — — 25,299
Total Investments in Securities $54,249 $1,016,323 $— $1,070,572
Latin America Fund
Level 1Quoted prices
Level 2Other significant
observable inputs
Level 3Significant
unobservable inputs Total
Total Investments in Securities (b) $86,982 $ — $— $ 86,982
(a) Amount rounds to less than $1,000.(b) All portfolio holdings designated as Level 1 are disclosed individually on the SOI. Please refer to the SOI for country specifics of portfolio
holdings.
There were no transfers among any levels during the six months ended April 30, 2015.
The following is a summary of investments for which significant unobservable inputs (Level 3) were used in determining fair value (amounts inthousands):
Asia Pacific FundBalance as of
October 31, 2014Realized
gain (loss)
Change inunrealized
appreciation(depreciation)
Net accretion(amortization) Purchases1 Sales2
Transfersinto
Level 3
Transfersout of
Level 3Balance as ofApril 30, 2015
Common Stock —Consumer Staples $— $—(a) $29 $— $8 $(12) $47 $— $72
(1) Purchases include all purchases of securities and securities received in corporate actions.(2) Sales include all sales of securities, maturities, paydowns and securities tendered in corporate actions.(a) Amount rounds to less than $1,000.
Transfers into, and out of, Level 3 are valued utilizing values as of the beginning of the period.
Transfers from Level 2 to Level 3 or from Level 3 to Level 2 are due to a decline or an increase in market activity (e.g. frequency of trades),respectively, which resulted in a lack of or increase in available market inputs to determine price.
APRIL 30, 2015 J.P. MORGAN COUNTRY/REGION FUNDS 53
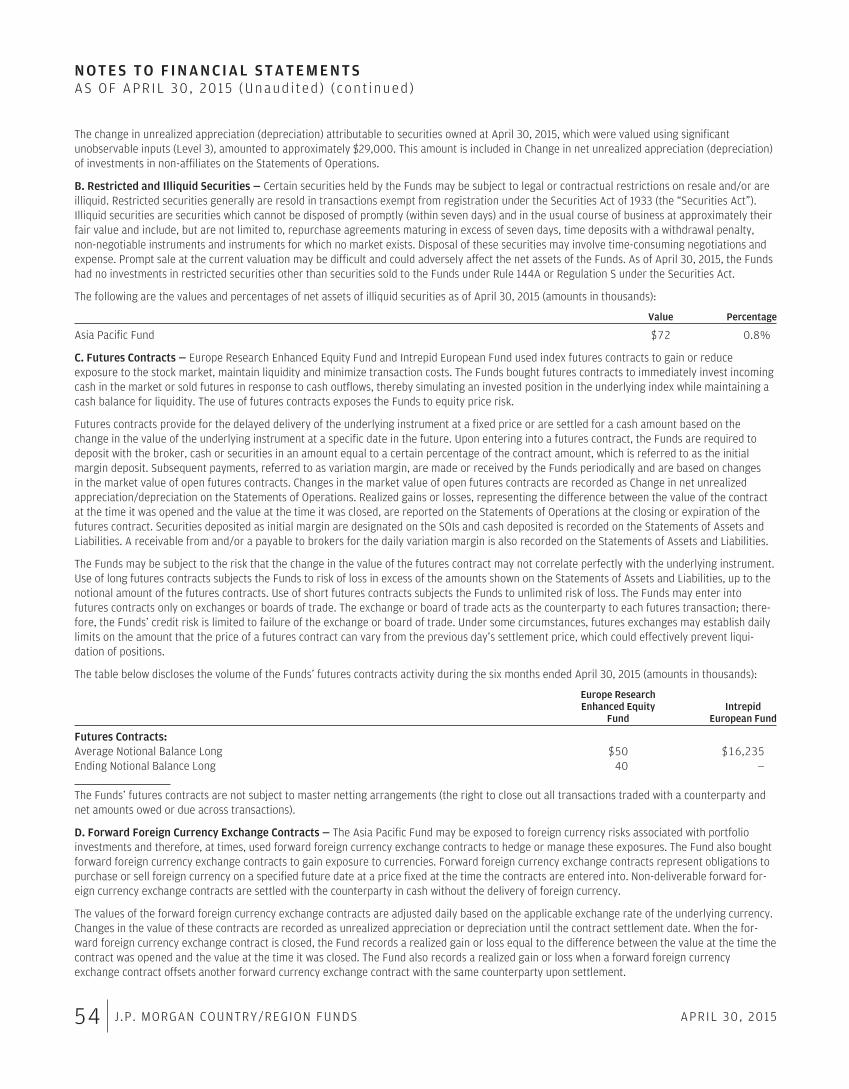
N O T E S T O F I N A N C I A L S T A T E M E N T SAS OF APR IL 30 , 2015 (Unaud i ted ) ( con t inued )
The change in unrealized appreciation (depreciation) attributable to securities owned at April 30, 2015, which were valued using significantunobservable inputs (Level 3), amounted to approximately $29,000. This amount is included in Change in net unrealized appreciation (depreciation)of investments in non-affiliates on the Statements of Operations.
B. Restricted and Illiquid Securities — Certain securities held by the Funds may be subject to legal or contractual restrictions on resale and/or areilliquid. Restricted securities generally are resold in transactions exempt from registration under the Securities Act of 1933 (the “Securities Act”).Illiquid securities are securities which cannot be disposed of promptly (within seven days) and in the usual course of business at approximately theirfair value and include, but are not limited to, repurchase agreements maturing in excess of seven days, time deposits with a withdrawal penalty,non-negotiable instruments and instruments for which no market exists. Disposal of these securities may involve time-consuming negotiations andexpense. Prompt sale at the current valuation may be difficult and could adversely affect the net assets of the Funds. As of April 30, 2015, the Fundshad no investments in restricted securities other than securities sold to the Funds under Rule 144A or Regulation S under the Securities Act.
The following are the values and percentages of net assets of illiquid securities as of April 30, 2015 (amounts in thousands):
Value Percentage
Asia Pacific Fund $72 0.8%
C. Futures Contracts — Europe Research Enhanced Equity Fund and Intrepid European Fund used index futures contracts to gain or reduceexposure to the stock market, maintain liquidity and minimize transaction costs. The Funds bought futures contracts to immediately invest incomingcash in the market or sold futures in response to cash outflows, thereby simulating an invested position in the underlying index while maintaining acash balance for liquidity. The use of futures contracts exposes the Funds to equity price risk.
Futures contracts provide for the delayed delivery of the underlying instrument at a fixed price or are settled for a cash amount based on thechange in the value of the underlying instrument at a specific date in the future. Upon entering into a futures contract, the Funds are required todeposit with the broker, cash or securities in an amount equal to a certain percentage of the contract amount, which is referred to as the initialmargin deposit. Subsequent payments, referred to as variation margin, are made or received by the Funds periodically and are based on changesin the market value of open futures contracts. Changes in the market value of open futures contracts are recorded as Change in net unrealizedappreciation/depreciation on the Statements of Operations. Realized gains or losses, representing the difference between the value of the contractat the time it was opened and the value at the time it was closed, are reported on the Statements of Operations at the closing or expiration of thefutures contract. Securities deposited as initial margin are designated on the SOIs and cash deposited is recorded on the Statements of Assets andLiabilities. A receivable from and/or a payable to brokers for the daily variation margin is also recorded on the Statements of Assets and Liabilities.
The Funds may be subject to the risk that the change in the value of the futures contract may not correlate perfectly with the underlying instrument.Use of long futures contracts subjects the Funds to risk of loss in excess of the amounts shown on the Statements of Assets and Liabilities, up to thenotional amount of the futures contracts. Use of short futures contracts subjects the Funds to unlimited risk of loss. The Funds may enter intofutures contracts only on exchanges or boards of trade. The exchange or board of trade acts as the counterparty to each futures transaction; there-fore, the Funds’ credit risk is limited to failure of the exchange or board of trade. Under some circumstances, futures exchanges may establish dailylimits on the amount that the price of a futures contract can vary from the previous day’s settlement price, which could effectively prevent liqui-dation of positions.
The table below discloses the volume of the Funds’ futures contracts activity during the six months ended April 30, 2015 (amounts in thousands):
Europe ResearchEnhanced Equity
FundIntrepid
European Fund
Futures Contracts:Average Notional Balance Long $50 $16,235Ending Notional Balance Long 40 —
The Funds’ futures contracts are not subject to master netting arrangements (the right to close out all transactions traded with a counterparty andnet amounts owed or due across transactions).
D. Forward Foreign Currency Exchange Contracts — The Asia Pacific Fund may be exposed to foreign currency risks associated with portfolioinvestments and therefore, at times, used forward foreign currency exchange contracts to hedge or manage these exposures. The Fund also boughtforward foreign currency exchange contracts to gain exposure to currencies. Forward foreign currency exchange contracts represent obligations topurchase or sell foreign currency on a specified future date at a price fixed at the time the contracts are entered into. Non-deliverable forward for-eign currency exchange contracts are settled with the counterparty in cash without the delivery of foreign currency.
The values of the forward foreign currency exchange contracts are adjusted daily based on the applicable exchange rate of the underlying currency.Changes in the value of these contracts are recorded as unrealized appreciation or depreciation until the contract settlement date. When the for-ward foreign currency exchange contract is closed, the Fund records a realized gain or loss equal to the difference between the value at the time thecontract was opened and the value at the time it was closed. The Fund also records a realized gain or loss when a forward foreign currencyexchange contract offsets another forward currency exchange contract with the same counterparty upon settlement.
54 J.P. MORGAN COUNTRY/REGION FUNDS APRIL 30, 2015

As of April 30, 2015, the Fund did not receive or post collateral for forward foreign currency exchange contracts.
The table below discloses the volume of the Fund’s forward foreign currency exchange contracts activity during the six months ended April 30, 2015(amounts in thousands):
Asia PacificFund
Forward Foreign Currency Exchange Contracts:Average Settlement Value Purchased $10(a)Ending Settlement Value Purchased —
(a) For the period January 1, 2015 through January 31, 2015.
E. Summary of Derivatives Information
The following table presents the value of derivatives held as of April 30, 2015, by their primary underlying risk exposure and respective location onthe Statements of Assets and Liabilities (amounts in thousands):
Europe Research Enhanced Index Fund
Derivative Contracts Statements of Assets and Liabilities LocationGross Liabilities: Futures Contracts (a)
Equity contracts Receivables, Net Assets — Unrealized Depreciation $(1)
(a) This amount represents the cumulative appreciation (depreciation) of futures contracts as reported on the SOIs. The Statements of Assets andLiabilities only reflect the current day variation margin receivable/payable from/to brokers.
The Funds are party to various derivative contracts governed by International Swaps and Derivatives Association master agreements (“ISDAagreements”). The Funds’ ISDA agreements, which are separately negotiated with each dealer counterparty, may contain provisions allowing, absentother considerations, a counterparty to exercise rights, to the extent not otherwise waived, against the Funds in the event the Funds’ net assetsdecline over time by a pre-determined percentage or fall below a pre-determined floor. The ISDA agreements may also contain provisions allowing,absent other conditions, the Funds to exercise rights, to the extent not otherwise waived, against the counterparty (i.e. decline in a counterparty’scredit rating below a specified level). Such rights for both the counterparty and Funds often include the ability to terminate (i.e. close out) opencontracts at prices which may favor the counterparty, which could have an adverse effect on the Funds. The ISDA agreements give the Funds andcounterparty the right, upon an event of default, to close out all transactions traded under such agreements and to net amounts owed or due acrossall transactions and offset such net payable or receivable with collateral posted to a segregated account by one party to the other.
The following tables present the effect of derivatives on the Statements of Operations for the six months ended April 30, 2015, by primary under-lying risk exposure (amounts in thousands):
Asia Pacific Fund
Amount of Realized Gain (Loss) on Derivatives Recognized on Statements of Operations
Derivative Contracts
Forward ForeignCurrency Exchange
Contracts
Foreign exchange contracts $—(a)
Amount of Change in Unrealized Appreciation (Depreciation) on Derivatives Recognized in Income
Derivative Contracts
Forward ForeignCurrency Exchange
Contracts
Foreign exchange contracts $—(a)
(a) Amount rounds to less than $1,000.
Europe Research Enhanced Index Fund
Amount of Realized Gain (Loss) on Derivatives Recognized on Statements of OperationsDerivative Contracts Futures Contracts
Equity contracts $18
APRIL 30, 2015 J.P. MORGAN COUNTRY/REGION FUNDS 55
N O T E S T O F I N A N C I A L S T A T E M E N T SAS OF APR IL 30 , 2015 (Unaud i ted ) ( con t inued )
Amount of Change in Unrealized Appreciation (Depreciation) on Derivatives Recognized in IncomeDerivative Contracts Futures Contracts
Equity contracts $1
The Funds’ derivatives contracts held at April 30, 2015 are not accounted for as hedging instruments under GAAP.
F. Structured Instruments — Asia Pacific Fund invests in structured instruments that have similar economic characteristics to equity securities.These instruments often seek to replicate the performance of an underlying reference asset such as an equity security or market (“reference asset”).The value of these instruments is generally derived from the price movements of the reference asset. On maturity date of each instrument, the Fundwill receive a payment from the instrument’s issuing entity based on the value of the reference asset and record a realized gain or loss. The instru-ment may receive dividends paid in connection with the reference asset which are reported as Net realized gain (loss) on investment transactions onthe Statements of Operations.
Structured instruments may be issued by banks, broker dealers or their affiliates and typically constitute unsecured contractual obligations of theissuing entity. In addition to credit risk, investments in structured instruments generally have the same risks associated with a direct investment inthe reference asset. However, there can be no assurance that structured instruments will trade at the same price or have the same value as thereference asset. In addition, structured instruments may be subject to transfer restrictions and a liquid market may not exist for these instruments.The lack of a liquid market may make it difficult to sell the structured instruments or accurately value them. Investments in structured instrumentssubject the Fund to counterparty risk.
G. Foreign Currency Translation — The books and records of the Funds are maintained in U.S. dollars. Foreign currency amounts are translatedinto U.S. dollars at the prevailing exchange rates of such currencies against the U.S. dollar. The market value of investment securities and otherassets and liabilities are translated at the exchange rate as of the valuation date. Purchases and sales of investment securities, income and expensesare translated at the exchange rate prevailing on the respective dates of such transactions.
Although the net assets of the Funds are presented at the foreign exchange rates and market values at the close of the period, the Funds do notisolate that portion of the results of operations arising as a result of changes in the foreign exchange rates from the fluctuations arising fromchanges in the market prices of securities held. Accordingly, such foreign currency gains (losses) are included on the reported Change in net unreal-ized appreciation/depreciation on investment transactions on the Statements of Operations.
Reported realized foreign currency gains and losses arise from the disposition of foreign currency, currency gains or losses realized between thetrade and settlement dates on securities transactions, and the difference between the amounts of dividends, interest and foreign withholding taxesrecorded on each Fund’s books on the transaction date and the U.S. dollar equivalent of the amounts actually received or paid. These reported real-ized foreign currency gains and losses are included in Net realized gain or loss on foreign currency transactions on the Statements of Operations.Unrealized foreign currency gains and losses arise from changes (due to changes in exchange rates) in the value of foreign currency and otherassets and liabilities denominated in foreign currencies, which are held at period end and are included in Change in net unrealized appreciation/depreciation on foreign currency translations on the Statements of Operations.
H. Offering and Organizational Costs — Total offering costs of approximately $48,000 paid in connection with the offering of shares of EuropeResearch Enhanced Equity Fund are amortized on a straight line basis over 12 months from the date the Fund commenced operations. Costs paid inconnection with the organization of the Fund, if any, were recorded as an expense at the time the Fund commenced operations. For the six monthsended April 30, 2015, total offering costs amortized were approximately $25,000.
I. Security Transactions and Investment Income — Investment transactions are accounted for on the trade date (the date the order to buy or sellis executed). Securities gains and losses are calculated on a specifically identified cost basis. Interest income is determined on the basis of couponinterest accrued using the effective interest method which adjusts for amortization of premiums and accretion of discounts. Dividend income net offoreign taxes withheld, if any, is recorded on the ex-dividend date or when a Fund first learns of the dividend.
J. Allocation of Income and Expenses — Expenses directly attributable to a fund are charged directly to that fund, while the expenses attributableto more than one fund of the Trust are allocated among the respective funds. In calculating the NAV of each class, investment income, realized andunrealized gains and losses and expenses, other than class specific expenses, are allocated daily to each class of shares based upon the proportionof net assets of each class at the beginning of each day.
56 J.P. MORGAN COUNTRY/REGION FUNDS APRIL 30, 2015
Sub-transfer agent fees are class-specific expenses. The amount of the Sub-transfer agent fees charged to each class of the Funds for the six monthsended April 30, 2015 are as follows (amounts in thousands):
Class A Class B Class C Institutional Class Select Class
Asia Pacific Fund $ 1 n/a $ —(a) n/a $ —(a)China Region Fund 3 n/a 1 n/a 2Intrepid European Fund 115 $ 3 33 $ 8 54Latin America Fund 15 n/a 2 n/a 3
(a) Amount rounds to less than $1,000.
K. Federal Income Taxes — Each Fund is treated as a separate taxable entity for Federal income tax purposes. Each Fund’s policy is to comply withthe provisions of the Internal Revenue Code of 1986, as amended (the “Code”), applicable to regulated investment companies and to distribute toshareholders all of its distributable net investment income and net realized capital gains on investments. Accordingly, no provision for Federalincome tax is necessary. Management has reviewed the Funds’ tax positions for all open tax years and has determined that as of April 30, 2015, noliability for income tax is required on the Funds’ financial statements for net unrecognized tax benefits. However, management’s conclusions may besubject to future review based on changes in, or the interpretation of, the accounting standards or tax laws and regulations. Each of the Funds’Federal tax returns for the prior three fiscal years, or since inception if shorter, remains subject to examination by the Internal Revenue Service.
L. Foreign Taxes — The Funds may be subject to foreign taxes on income, gains on investments or currency purchases/repatriation, a portion ofwhich may be recoverable. The Funds will accrue such taxes and recoveries as applicable, based upon their current interpretation of tax rules andregulations that exist in the markets in which they invest.
M. Distributions to Shareholders — Distributions from net investment income are generally declared and paid at least annually. Distributions aredeclared separately for each class. No class has preferential dividend rights; differences in per share rates are due to differences in separate classexpenses. Net realized capital gains, if any, are distributed by each Fund at least annually. The amount of distributions from net investment incomeand net realized capital gains is determined in accordance with Federal income tax regulations, which may differ from GAAP. To the extent these“book/tax” differences are permanent in nature (i.e., that they result from other than timing of recognition — “temporary differences”), suchamounts are reclassified within the capital accounts based on their Federal tax-basis treatment.
3. Fees and Other Transactions with AffiliatesA. Investment Advisory Fee — Pursuant to the Investment Advisory Agreement, J.P. Morgan Investment Management Inc. (the “Adviser” or“JPMIM”), an indirect, wholly-owned subsidiary of JPMorgan Chase & Co. (“JPMorgan”), supervises the investments of each Fund and for such serv-ices is paid a fee. The fee is accrued daily and paid monthly based on each Fund’s respective average daily net assets. The annual rate for each Fundis as follows:
Asia Pacific Fund 0.90%China Region Fund 1.25Europe Research Enhanced Equity Fund 0.20Intrepid European Fund 0.65Latin America Fund 1.00
The Adviser, on behalf of Asia Pacific Fund and China Region Fund, has entered into investment sub-advisory agreements with JF InternationalManagement, Inc. (“JFIMI”), a wholly-owned subsidiary of JPMorgan Asset Management (Asia) Inc., which is wholly-owned by J.P. Morgan AssetManagement Holdings Inc. For its services as sub-adviser, JFIMI receives a portion of the fees payable to the Adviser.
The fee is accrued daily and paid monthly based on each Fund’s respective average daily net assets. The annual rate for each Fund is as follows:
Asia Pacific Fund 0.40%China Region Fund 0.60
The Adviser waived Investment Advisory fees and/or reimbursed expenses as outlined in Note 3.F.
B. Administration Fee — Pursuant to an Administration Agreement, the Administrator, an indirect, wholly-owned subsidiary of JPMorgan, providescertain administration services to the Funds. In consideration of these services, the Administrator receives a fee accrued daily and paid monthly atan annual rate of 0.15% of the first $25 billion of the average daily net assets of all funds in the J.P. Morgan Funds Complex covered by the Admin-istration Agreement (excluding certain funds of funds and money market funds) and 0.075% of the average daily net assets in excess of $25 billionof all such funds. For the six months ended April 30, 2015, the effective annualized rate was 0.08% of each Fund’s average daily net assets, notwith-standing any fee waivers and/or expense reimbursements.
The Administrator waived Administration fees as outlined in Note 3.F.
APRIL 30, 2015 J.P. MORGAN COUNTRY/REGION FUNDS 57
N O T E S T O F I N A N C I A L S T A T E M E N T SAS OF APR IL 30 , 2015 (Unaud i ted ) ( con t inued )
JPMorgan Chase Bank, N.A. (“JPMCB”), a wholly-owned subsidiary of JPMorgan, serves as the Funds’ sub-administrator (the “Sub-administrator”).For its services as Sub-administrator, JPMCB receives a portion of the fees payable to the Administrator.
C. Distribution Fees — Pursuant to a Distribution Agreement, JPMorgan Distribution Services, Inc. (the “Distributor”), a wholly-owned subsidiary ofJPMorgan, serves as the Trust’s exclusive underwriter and promotes and arranges for the sale of each Fund’s shares.
The Board has adopted a Distribution Plan (the “Distribution Plan”) for Class A, Class B and Class C Shares of the Funds, as applicable, in accordancewith Rule 12b-1 under the 1940 Act. The Distribution Plan provides that each Fund shall pay distribution fees, including payments to the Distributor,at annual rates of the average daily net assets as shown in the table below:
Class A Class B Class C
Asia Pacific Fund 0.25% n/a 0.75%China Region Fund 0.25 n/a 0.75Europe Research Enhanced Equity Fund 0.25 n/a 0.75Intrepid European Fund 0.25 0.75% 0.75Latin America Fund 0.25 n/a 0.75
In addition, the Distributor is entitled to receive the front-end sales charges from purchases of Class A Shares and the CDSC from redemptions ofClass B and Class C Shares and certain Class A Shares for which front-end sales charges have been waived. For the six months ended April 30, 2015,the Distributor retained the following (amounts in thousands):
Front-EndSales Charge CDSC
Asia Pacific Fund $ —(a) $—China Region Fund 3 —Intrepid European Fund 62 3Latin America Fund 1 —(a)
(a) Amount rounds to less than $1,000.
D. Shareholder Servicing Fees — The Trust, on behalf of the Funds, has entered into a Shareholder Servicing Agreement with the Distributor underwhich the Distributor provides certain support services to the shareholders. For performing these services, the Distributor receives a fee that isaccrued daily and paid monthly equal to a percentage of the average daily net assets as shown in the table below:
Class A Class B Class C Institutional Class Select Class
Asia Pacific Fund 0.25% n/a 0.25% n/a 0.25%China Region Fund 0.25 n/a 0.25 n/a 0.25Europe Research Enhanced Equity Fund 0.25 n/a 0.25 n/a 0.25Intrepid European Fund 0.25 0.25% 0.25 0.10% 0.25Latin America Fund 0.25 n/a 0.25 n/a 0.25
The Distributor has entered into shareholder services contracts with affiliated and unaffiliated financial intermediaries who provide shareholderservices and other related services to their clients or customers who invest in the Funds under which the Distributor will pay all or a portion of suchfees earned to financial intermediaries for performing such services.
The Distributor waived Shareholder Servicing fees as outlined in Note 3.F.
E. Custodian and Accounting Fees — JPMCB provides portfolio custody and accounting services to the Funds. For these services, the Funds payJPMCB transaction and asset-based fees that vary according to the number of transactions and positions, plus out-of-pocket expenses. The amountspaid directly to JPMCB by the Funds for custody and accounting services are included in Custodian and accounting fees on the Statements ofOperations.
Interest income earned on cash balances at the custodian, if any, is included in Interest income from affiliates on the Statements of Operations.
Interest expense paid to the custodian related to cash overdrafts, if any, is included in Interest expense to affiliates on the Statements of Operations.
F. Waivers and Reimbursements — The Adviser, Administrator and Distributor have contractually agreed to waive fees and/or reimburse the Fundsto the extent that total annual operating expenses (excluding acquired fund fees and expenses, dividend expenses related to short sales, interest,
58 J.P. MORGAN COUNTRY/REGION FUNDS APRIL 30, 2015
taxes, expenses related to litigation and potential litigation, extraordinary expenses and expenses related to the Board’s deferred compensationplan) exceed the percentages of the Funds’ respective average daily net assets as shown in the table below:
Class A Class B Class C Institutional Class Select Class
Asia Pacific Fund 1.55% n/a 2.05% n/a 1.30%China Region Fund 1.85 n/a 2.35 n/a 1.60Europe Research Enhanced Equity Fund 0.60 n/a 1.10 n/a 0.35Intrepid European Fund 1.50 2.00% 2.00 1.00% 1.25Latin America Fund 1.70 n/a 2.20 n/a 1.45
The expense limitation agreements were in effect for the six months ended April 30, 2015. The contractual expense limitation percentages in thetable above are in place until at least February 29, 2016.
For the six months ended April 30, 2015, the Funds’ service providers waived fees and/or reimbursed expenses for each of the Funds as follows(amounts in thousands). None of these parties expect the Funds to repay any such waived fees and/or reimbursed expenses in future years.
Contractual Waivers
InvestmentAdvisory Administration
ShareholderServicing Total
ContractualReimbursements
Asia Pacific Fund $ 33 $ 3 $ 8 $ 44 $63China Region Fund 114 76 4 194 —Europe Research Enhanced Equity Fund 3 1 4 8 91Intrepid European Fund — — —(a) —(a) —Latin America Fund 54 33 16 103 —
(a) Amount rounds to less than $1,000.
Additionally, the Funds may invest in one or more money market funds advised by the Adviser or its affiliates. The Adviser, Administrator and Distrib-utor, as shareholder servicing agent, waive fees in an amount sufficient to offset the respective fees each charges to the affiliated money marketfund on the Funds’ investment in such affiliated money market fund. A portion of the waiver is voluntary.
The amounts of these waivers resulting from investments in these money market funds for the six months ended April 30, 2015 were as follows(amounts in thousands):
Intrepid European Fund $24Latin America Fund 1
G. Other — Certain officers of the Trust are affiliated with the Adviser, the Administrator and the Distributor. Such officers, with the exception of theChief Compliance Officer, receive no compensation from the Funds for serving in their respective roles.
The Board appointed a Chief Compliance Officer to the Funds in accordance with Federal securities regulations. Each Fund, along with other affili-ated funds, makes reimbursement payments, on a pro-rata basis, to the Administrator for a portion of the fees associated with the Office of theChief Compliance Officer. Such fees are included in Trustees’ and Chief Compliance Officer’s fees on the Statements of Operations.
The Trust adopted a Trustee Deferred Compensation Plan (the “Plan”) which allows the Independent Trustees to defer the receipt of all or a portionof compensation related to performance of their duties as Trustees. The deferred fees are invested in various J.P. Morgan Funds until distribution inaccordance with the Plan.
During the six months ended April 30, 2015, the Funds may have purchased securities from an underwriting syndicate in which the principal under-writer or members of the syndicate are affiliated with the Adviser.
The Funds may use related party broker-dealers. For the six months ended April 30, 2015, the Funds incurred brokerage commissions with broker-dealers affiliated with the Adviser as follows (amounts in thousands):
Europe Research Enhanced Equity Fund $ —(a)Intrepid European Fund 55Latin America Fund —(a)
(a) Amount rounds to less than $1,000.
The Securities and Exchange Commission (“SEC”) has granted an exemptive order permitting the Funds to engage in principal transactions withJ.P. Morgan Securities, Inc., an affiliated broker, involving taxable money market instruments, subject to certain conditions.
APRIL 30, 2015 J.P. MORGAN COUNTRY/REGION FUNDS 59
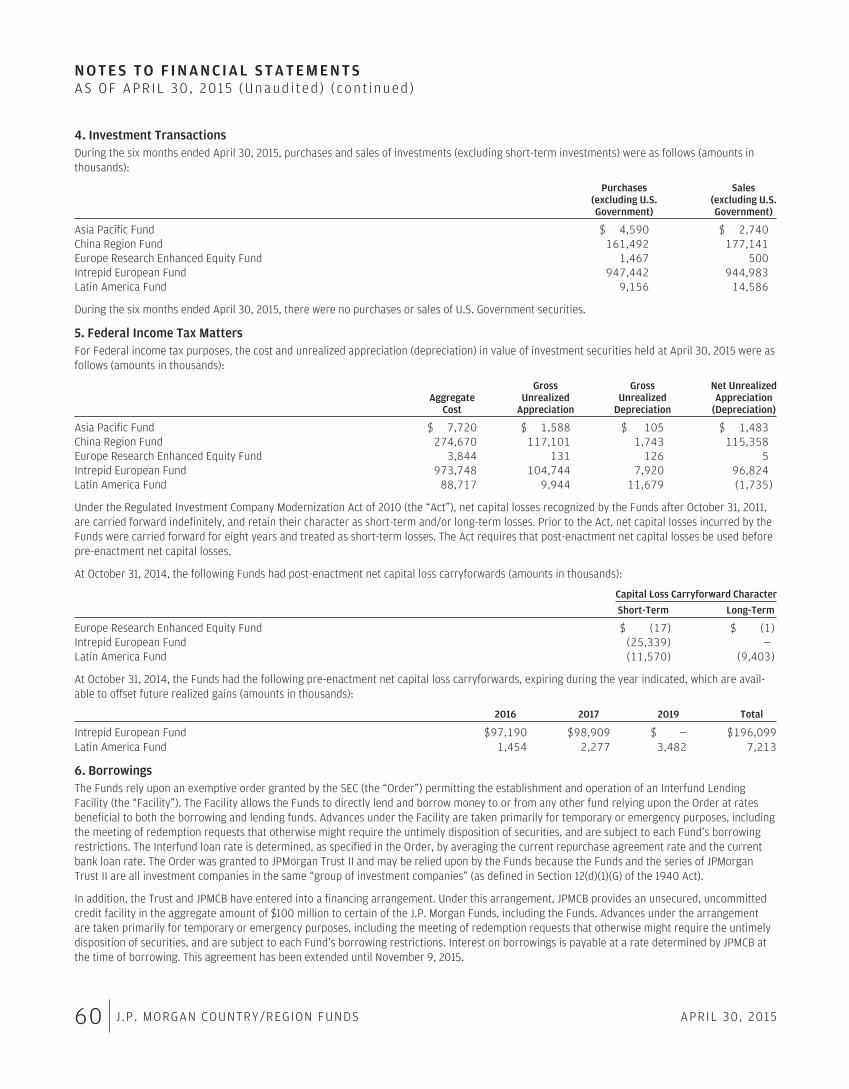
N O T E S T O F I N A N C I A L S T A T E M E N T SAS OF APR IL 30 , 2015 (Unaud i ted ) ( con t inued )
4. Investment TransactionsDuring the six months ended April 30, 2015, purchases and sales of investments (excluding short-term investments) were as follows (amounts inthousands):
Purchases(excluding U.S.Government)
Sales(excluding U.S.Government)
Asia Pacific Fund $ 4,590 $ 2,740China Region Fund 161,492 177,141Europe Research Enhanced Equity Fund 1,467 500Intrepid European Fund 947,442 944,983Latin America Fund 9,156 14,586
During the six months ended April 30, 2015, there were no purchases or sales of U.S. Government securities.
5. Federal Income Tax MattersFor Federal income tax purposes, the cost and unrealized appreciation (depreciation) in value of investment securities held at April 30, 2015 were asfollows (amounts in thousands):
AggregateCost
GrossUnrealized
Appreciation
GrossUnrealized
Depreciation
Net UnrealizedAppreciation
(Depreciation)
Asia Pacific Fund $ 7,720 $ 1,588 $ 105 $ 1,483China Region Fund 274,670 117,101 1,743 115,358Europe Research Enhanced Equity Fund 3,844 131 126 5Intrepid European Fund 973,748 104,744 7,920 96,824Latin America Fund 88,717 9,944 11,679 (1,735)
Under the Regulated Investment Company Modernization Act of 2010 (the “Act”), net capital losses recognized by the Funds after October 31, 2011,are carried forward indefinitely, and retain their character as short-term and/or long-term losses. Prior to the Act, net capital losses incurred by theFunds were carried forward for eight years and treated as short-term losses. The Act requires that post-enactment net capital losses be used beforepre-enactment net capital losses.
At October 31, 2014, the following Funds had post-enactment net capital loss carryforwards (amounts in thousands):
Capital Loss Carryforward Character
Short-Term Long-Term
Europe Research Enhanced Equity Fund $ (17) $ (1)Intrepid European Fund (25,339) —Latin America Fund (11,570) (9,403)
At October 31, 2014, the Funds had the following pre-enactment net capital loss carryforwards, expiring during the year indicated, which are avail-able to offset future realized gains (amounts in thousands):
2016 2017 2019 Total
Intrepid European Fund $97,190 $98,909 $ — $196,099Latin America Fund 1,454 2,277 3,482 7,213
6. BorrowingsThe Funds rely upon an exemptive order granted by the SEC (the “Order”) permitting the establishment and operation of an Interfund LendingFacility (the “Facility”). The Facility allows the Funds to directly lend and borrow money to or from any other fund relying upon the Order at ratesbeneficial to both the borrowing and lending funds. Advances under the Facility are taken primarily for temporary or emergency purposes, includingthe meeting of redemption requests that otherwise might require the untimely disposition of securities, and are subject to each Fund’s borrowingrestrictions. The Interfund loan rate is determined, as specified in the Order, by averaging the current repurchase agreement rate and the currentbank loan rate. The Order was granted to JPMorgan Trust II and may be relied upon by the Funds because the Funds and the series of JPMorganTrust II are all investment companies in the same “group of investment companies” (as defined in Section 12(d)(1)(G) of the 1940 Act).
In addition, the Trust and JPMCB have entered into a financing arrangement. Under this arrangement, JPMCB provides an unsecured, uncommittedcredit facility in the aggregate amount of $100 million to certain of the J.P. Morgan Funds, including the Funds. Advances under the arrangementare taken primarily for temporary or emergency purposes, including the meeting of redemption requests that otherwise might require the untimelydisposition of securities, and are subject to each Fund’s borrowing restrictions. Interest on borrowings is payable at a rate determined by JPMCB atthe time of borrowing. This agreement has been extended until November 9, 2015.
60 J.P. MORGAN COUNTRY/REGION FUNDS APRIL 30, 2015
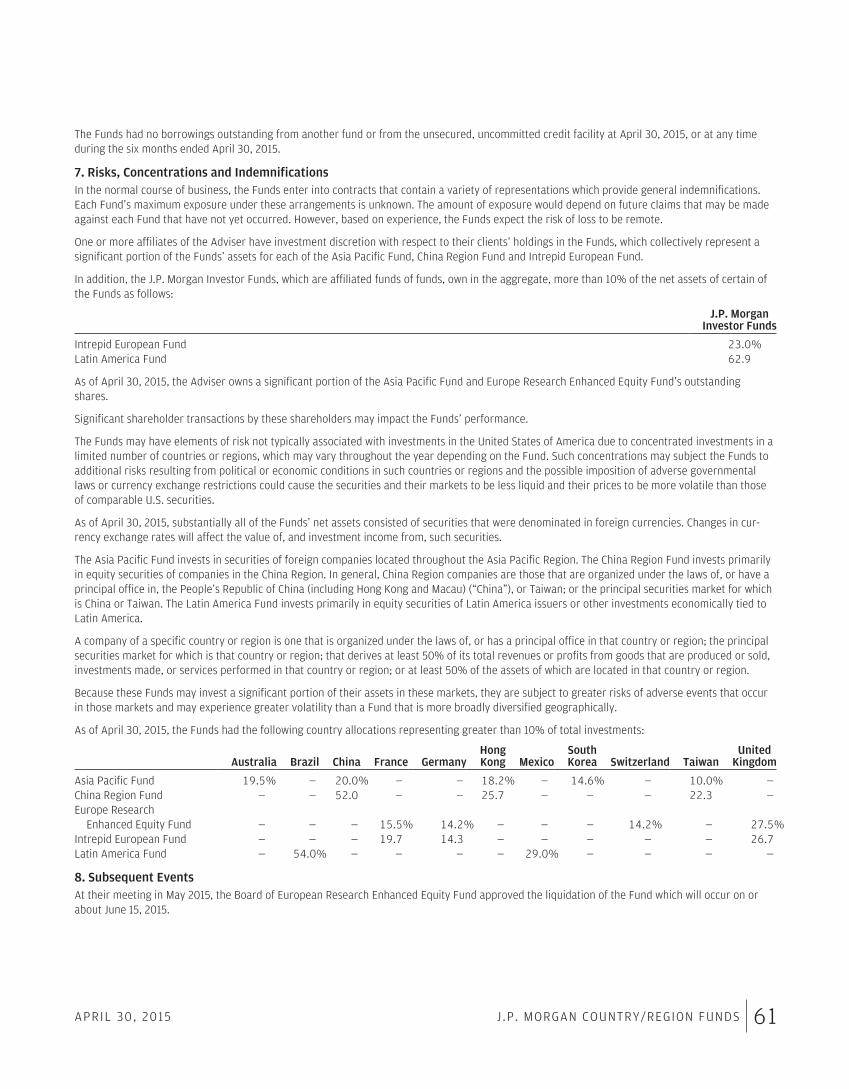
The Funds had no borrowings outstanding from another fund or from the unsecured, uncommitted credit facility at April 30, 2015, or at any timeduring the six months ended April 30, 2015.
7. Risks, Concentrations and IndemnificationsIn the normal course of business, the Funds enter into contracts that contain a variety of representations which provide general indemnifications.Each Fund’s maximum exposure under these arrangements is unknown. The amount of exposure would depend on future claims that may be madeagainst each Fund that have not yet occurred. However, based on experience, the Funds expect the risk of loss to be remote.
One or more affiliates of the Adviser have investment discretion with respect to their clients’ holdings in the Funds, which collectively represent asignificant portion of the Funds’ assets for each of the Asia Pacific Fund, China Region Fund and Intrepid European Fund.
In addition, the J.P. Morgan Investor Funds, which are affiliated funds of funds, own in the aggregate, more than 10% of the net assets of certain ofthe Funds as follows:
J.P. MorganInvestor Funds
Intrepid European Fund 23.0%Latin America Fund 62.9
As of April 30, 2015, the Adviser owns a significant portion of the Asia Pacific Fund and Europe Research Enhanced Equity Fund’s outstandingshares.
Significant shareholder transactions by these shareholders may impact the Funds’ performance.
The Funds may have elements of risk not typically associated with investments in the United States of America due to concentrated investments in alimited number of countries or regions, which may vary throughout the year depending on the Fund. Such concentrations may subject the Funds toadditional risks resulting from political or economic conditions in such countries or regions and the possible imposition of adverse governmentallaws or currency exchange restrictions could cause the securities and their markets to be less liquid and their prices to be more volatile than thoseof comparable U.S. securities.
As of April 30, 2015, substantially all of the Funds’ net assets consisted of securities that were denominated in foreign currencies. Changes in cur-rency exchange rates will affect the value of, and investment income from, such securities.
The Asia Pacific Fund invests in securities of foreign companies located throughout the Asia Pacific Region. The China Region Fund invests primarilyin equity securities of companies in the China Region. In general, China Region companies are those that are organized under the laws of, or have aprincipal office in, the People’s Republic of China (including Hong Kong and Macau) (“China”), or Taiwan; or the principal securities market for whichis China or Taiwan. The Latin America Fund invests primarily in equity securities of Latin America issuers or other investments economically tied toLatin America.
A company of a specific country or region is one that is organized under the laws of, or has a principal office in that country or region; the principalsecurities market for which is that country or region; that derives at least 50% of its total revenues or profits from goods that are produced or sold,investments made, or services performed in that country or region; or at least 50% of the assets of which are located in that country or region.
Because these Funds may invest a significant portion of their assets in these markets, they are subject to greater risks of adverse events that occurin those markets and may experience greater volatility than a Fund that is more broadly diversified geographically.
As of April 30, 2015, the Funds had the following country allocations representing greater than 10% of total investments:
Australia Brazil China France GermanyHongKong Mexico
SouthKorea Switzerland Taiwan
UnitedKingdom
Asia Pacific Fund 19.5% — 20.0% — — 18.2% — 14.6% — 10.0% —China Region Fund — — 52.0 — — 25.7 — — — 22.3 —Europe Research
Enhanced Equity Fund — — — 15.5% 14.2% — — — 14.2% — 27.5%Intrepid European Fund — — — 19.7 14.3 — — — — — 26.7Latin America Fund — 54.0% — — — — 29.0% — — — —
8. Subsequent EventsAt their meeting in May 2015, the Board of European Research Enhanced Equity Fund approved the liquidation of the Fund which will occur on orabout June 15, 2015.
APRIL 30, 2015 J.P. MORGAN COUNTRY/REGION FUNDS 61
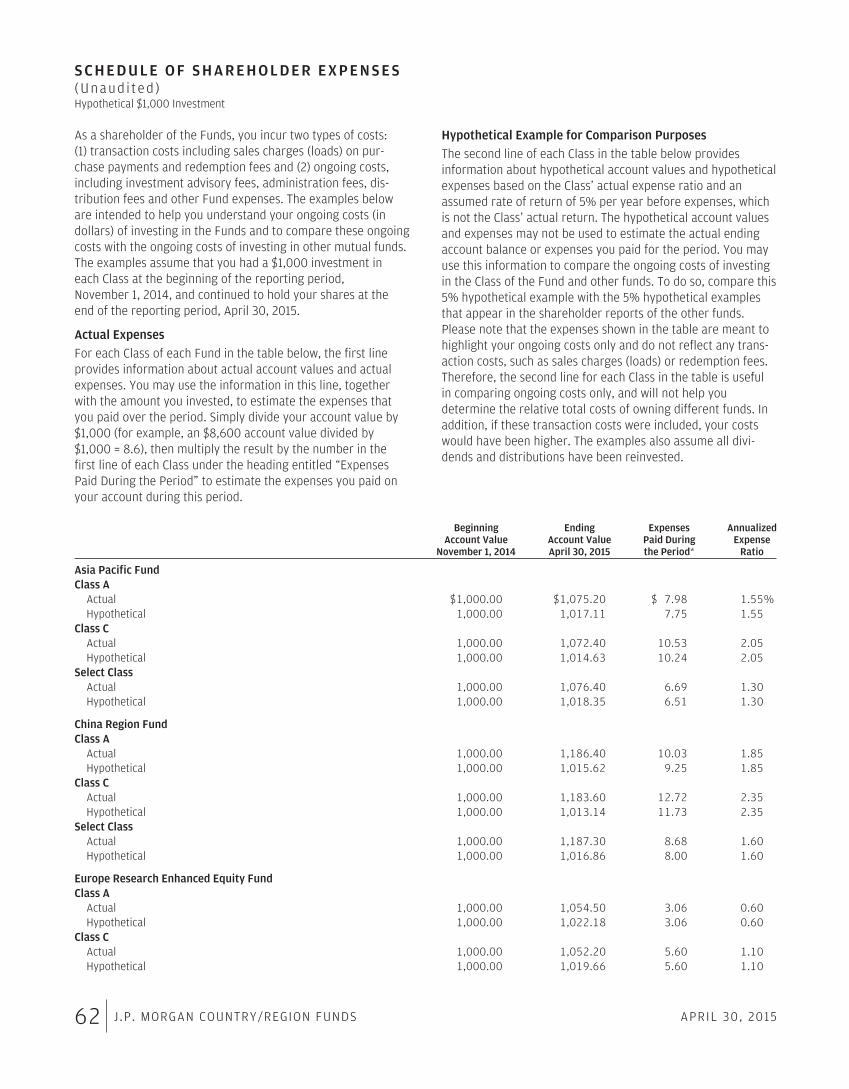
S C H E D U L E O F S H A R E H O L D E R E X P E N S E S(Unaud i ted )Hypothetical $1,000 Investment
As a shareholder of the Funds, you incur two types of costs:(1) transaction costs including sales charges (loads) on pur-chase payments and redemption fees and (2) ongoing costs,including investment advisory fees, administration fees, dis-tribution fees and other Fund expenses. The examples beloware intended to help you understand your ongoing costs (indollars) of investing in the Funds and to compare these ongoingcosts with the ongoing costs of investing in other mutual funds.The examples assume that you had a $1,000 investment ineach Class at the beginning of the reporting period,November 1, 2014, and continued to hold your shares at theend of the reporting period, April 30, 2015.
Actual ExpensesFor each Class of each Fund in the table below, the first lineprovides information about actual account values and actualexpenses. You may use the information in this line, togetherwith the amount you invested, to estimate the expenses thatyou paid over the period. Simply divide your account value by$1,000 (for example, an $8,600 account value divided by$1,000 = 8.6), then multiply the result by the number in thefirst line of each Class under the heading entitled “ExpensesPaid During the Period” to estimate the expenses you paid onyour account during this period.
Hypothetical Example for Comparison PurposesThe second line of each Class in the table below providesinformation about hypothetical account values and hypotheticalexpenses based on the Class’ actual expense ratio and anassumed rate of return of 5% per year before expenses, whichis not the Class’ actual return. The hypothetical account valuesand expenses may not be used to estimate the actual endingaccount balance or expenses you paid for the period. You mayuse this information to compare the ongoing costs of investingin the Class of the Fund and other funds. To do so, compare this5% hypothetical example with the 5% hypothetical examplesthat appear in the shareholder reports of the other funds.Please note that the expenses shown in the table are meant tohighlight your ongoing costs only and do not reflect any trans-action costs, such as sales charges (loads) or redemption fees.Therefore, the second line for each Class in the table is usefulin comparing ongoing costs only, and will not help youdetermine the relative total costs of owning different funds. Inaddition, if these transaction costs were included, your costswould have been higher. The examples also assume all divi-dends and distributions have been reinvested.
BeginningAccount Value
November 1, 2014
EndingAccount ValueApril 30, 2015
ExpensesPaid Duringthe Period*
AnnualizedExpense
Ratio
Asia Pacific FundClass A
Actual $1,000.00 $1,075.20 $ 7.98 1.55%Hypothetical 1,000.00 1,017.11 7.75 1.55
Class CActual 1,000.00 1,072.40 10.53 2.05Hypothetical 1,000.00 1,014.63 10.24 2.05
Select ClassActual 1,000.00 1,076.40 6.69 1.30Hypothetical 1,000.00 1,018.35 6.51 1.30
China Region FundClass A
Actual 1,000.00 1,186.40 10.03 1.85Hypothetical 1,000.00 1,015.62 9.25 1.85
Class CActual 1,000.00 1,183.60 12.72 2.35Hypothetical 1,000.00 1,013.14 11.73 2.35
Select ClassActual 1,000.00 1,187.30 8.68 1.60Hypothetical 1,000.00 1,016.86 8.00 1.60
Europe Research Enhanced Equity FundClass A
Actual 1,000.00 1,054.50 3.06 0.60Hypothetical 1,000.00 1,022.18 3.06 0.60
Class CActual 1,000.00 1,052.20 5.60 1.10Hypothetical 1,000.00 1,019.66 5.60 1.10
62 J.P. MORGAN COUNTRY/REGION FUNDS APRIL 30, 2015
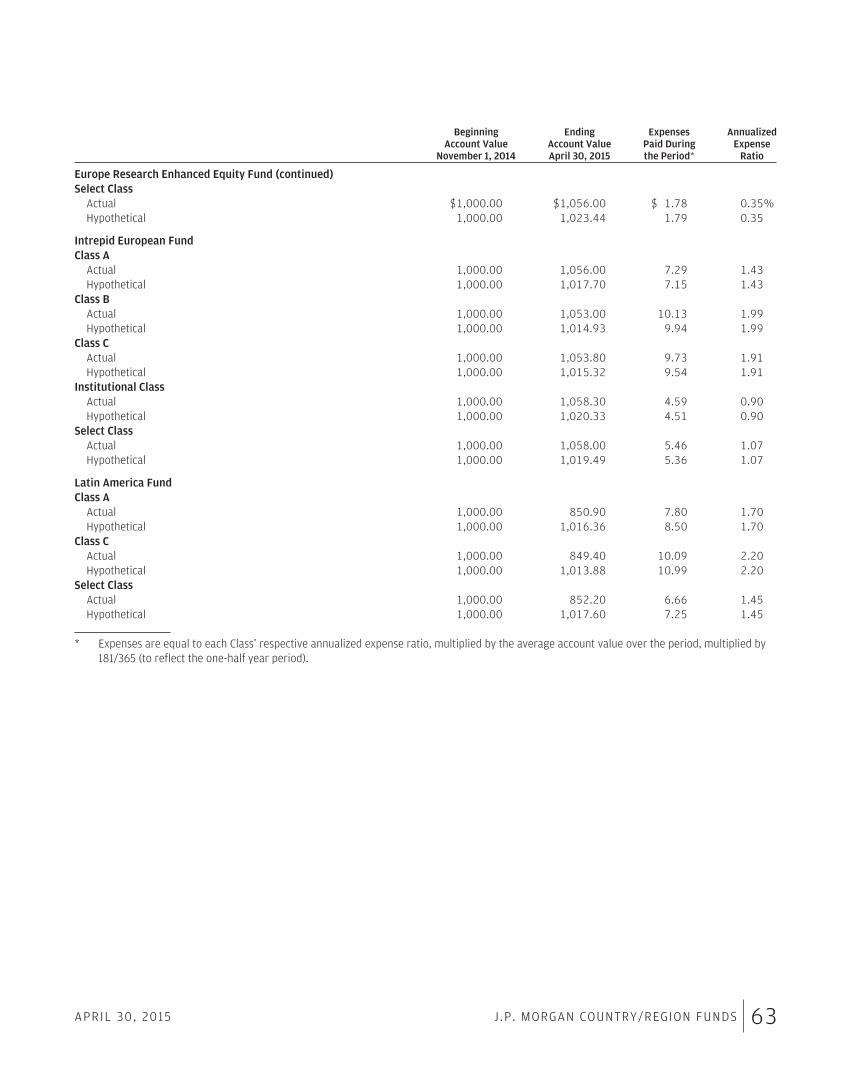
BeginningAccount Value
November 1, 2014
EndingAccount ValueApril 30, 2015
ExpensesPaid Duringthe Period*
AnnualizedExpense
Ratio
Europe Research Enhanced Equity Fund (continued)Select Class
Actual $1,000.00 $1,056.00 $ 1.78 0.35%Hypothetical 1,000.00 1,023.44 1.79 0.35
Intrepid European FundClass A
Actual 1,000.00 1,056.00 7.29 1.43Hypothetical 1,000.00 1,017.70 7.15 1.43
Class BActual 1,000.00 1,053.00 10.13 1.99Hypothetical 1,000.00 1,014.93 9.94 1.99
Class CActual 1,000.00 1,053.80 9.73 1.91Hypothetical 1,000.00 1,015.32 9.54 1.91
Institutional ClassActual 1,000.00 1,058.30 4.59 0.90Hypothetical 1,000.00 1,020.33 4.51 0.90
Select ClassActual 1,000.00 1,058.00 5.46 1.07Hypothetical 1,000.00 1,019.49 5.36 1.07
Latin America FundClass A
Actual 1,000.00 850.90 7.80 1.70Hypothetical 1,000.00 1,016.36 8.50 1.70
Class CActual 1,000.00 849.40 10.09 2.20Hypothetical 1,000.00 1,013.88 10.99 2.20
Select ClassActual 1,000.00 852.20 6.66 1.45Hypothetical 1,000.00 1,017.60 7.25 1.45
* Expenses are equal to each Class’ respective annualized expense ratio, multiplied by the average account value over the period, multiplied by181/365 (to reflect the one-half year period).
APRIL 30, 2015 J.P. MORGAN COUNTRY/REGION FUNDS 63
T A X L E T T E R(Unaud i ted )
Certain tax information for the J.P. Morgan Funds is required tobe provided to shareholders based upon the Funds’ income anddistributions for the taxable year ended October 31, 2014. Theinformation and distributions reported in this letter may differfrom the information and taxable distributions reported to theshareholders for the calendar year ending December 31, 2014.The information necessary to complete your income tax returnsfor the calendar year ending December 31, 2014 will be pro-vided under separate cover.
Foreign Source Income and Foreign Tax Credit Pass ThroughFor the fiscal year ended October 31, 2014, the Funds intend toelect to pass through to shareholders taxes paid to foreign
countries. Gross income and foreign tax expenses are as fol-lows or amounts as finally determined (amounts in thousands):
GrossIncome
Foreign TaxPass Through
Asia Pacific Fund $ 195 $ 13China Region Fund 9,112 850Europe Research Enhanced Equity Fund 3 1Intrepid European Fund 48,719 3,723Latin America Fund 2,615 83
The pass-through of the foreign tax credit will only affect thosepersons who are shareholders on the dividend record date inDecember 2014. These shareholders should refer to their 2014Form 1099-DIV for the foreign tax paid.
64 J.P. MORGAN COUNTRY/REGION FUNDS APRIL 30, 2015

THIS PAGE IS INTENTIONALLY LEFT BLANK

THIS PAGE IS INTENTIONALLY LEFT BLANK

THIS PAGE IS INTENTIONALLY LEFT BLANK

THIS PAGE IS INTENTIONALLY LEFT BLANK
J.P. Morgan Funds are distributed by JPMorgan Distribution Services, Inc., which is an affiliate of JPMorgan Chase & Co. Affiliatesof JPMorgan Chase & Co. receive fees for providing various services to the funds.
Contact JPMorgan Distribution Services, Inc. at 1-800-480-4111 for a fund prospectus. You can also visit us atwww.jpmorganfunds.com. Investors should carefully consider the investment objectives and risk as well as charges andexpenses of the mutual fund before investing. The prospectus contains this and other information about the mutual fund.Read the prospectus carefully before investing.
Investors may obtain information about the Securities Investor Protection Corporation (SIPC), including the SIPC brochure byvisiting www.sipc.org or by calling SIPC at 202-371-8300.
Each Fund files a complete schedule of its fund holdings for the first and third quarters of its fiscal year with the SEC on Form N-Q.The Funds’ Forms N-Q are available on the SEC’s website at http://www.sec.gov and may be reviewed and copied at the SEC’sPublic Reference Room in Washington, DC. Information on the operation of the SEC’s Public Reference Room may be obtained bycalling 1-800-SEC-0330. Shareholders may request the Form N-Q without charge by calling 1-800-480-4111 or by visiting theJ.P. Morgan Funds’ website at www.jpmorganfunds.com.
A description of each Fund’s policies and procedures with respect to the disclosure of each Fund’s holdings is available in theprospectus and Statement of Additional Information.
A copy of proxy policies and procedures is available without charge upon request by calling 1-800-480-4111 and on the Funds’website at www.jpmorganfunds.com. A description of such policies and procedures is on the SEC’s website at www.sec.gov. TheTrustees have delegated the authority to vote proxies for securities owned by the Funds to the Adviser. A copy of the Funds’voting record for the most recent 12-month period ended June 30 is available on the SEC’s website at www.sec.gov or at theFunds’ website at www.jpmorganfunds.com no later than August 31 of each year. The Funds’ proxy voting record will include,among other things, a brief description of the matter voted on for each fund security, and will state how each vote was cast, forexample, for or against the proposal.

Go green with J.P. Morgan FundsPaperless reports are a simple, safe and smart way to help the environment — and yourself.
Find out more information and enroll today at www.icsdelivery.com Option may not be available through all brokers or for all shareholders.
J.P. Morgan Asset Management is the marketing name for the asset management business of JPMorgan Chase & Co. Thosebusinesses include, but are not limited to, J.P. Morgan Investment Management Inc., Security Capital Research &Management Incorporated and J.P. Morgan Alternative Asset Management, Inc.
© JPMorgan Chase & Co., 2015. All rights reserved. April 2015. SAN-INTEQ-CO-415