JP Init Coverage 2003
44
http://mm.jpmorgan.com See last two pages for analyst certification and important disclosures, including investment banking relationships. JPMorgan does and seeks to do business with companies covered in its research reports. As a result, investors should be aware that the firm may have a conflict of interest that could affect the objectivity of this report. Investors should consider this report as only a single factor in making their investment decision. North American Equity Research New York 10 July 2003 Motorola Initiation Neutral Mind over Margins $10.25 9 July 03 • We are initiating coverage of Motorola Inc. with a Neutral rating and a positive bias as we believe the opportunity to expand margins and de-lever the balance sheet, coupled with a better outlook for 2H03, slightly outweigh the currently low margins, new competitive pressures, and recently weak track record on execution. • We believe strong free cash flow will add $7 billion in value to balance sheet over five years. In addition, we calculate EPS CAGR of 31% through 2008. • Thirty new handset mode ls, up from only six in 1H03, shoul d drive a second half PCS recovery. The dissipation of SARS and inventory worries in China should also help drive 6% top-line growth in PCS for 2004 following a 5% decline in 2003. • In 2004, the semis division should turn its first operating profit in four years. After shutting 19 of its 27 fabs over last three years, the SPS division sits just below breakeven for first time since 2000 and has close to 65% incremental net margin on new revenue. • New local competition and Nokia re-entering the CDMA market makes defense of share tougher for MOT, especially in China, where it generates 20% of its PCS revenue. • MOT’s valuation is below its peers. At $10.25, MOT trades at 1.0x EV to 2004E revenue and 8.3x 2004E EBITDA, compared with averages of 2.6x and 12.9x for peers Qualcomm, Nokia, Nortel, and Lucent. Data Networking & Telco Equipment Ehud A. Gelblum, Ph.D. (1-212) 622-6457 [email protected] Steven J. O’Brien (1-212) 622-6554 [email protected] Common Stock (NYSE: MOT) Ticker MOT EPS 2002A 2003E 2004E Price (9 July 03) $10.25 1Q (Mar) ($0.08) $0.01A $0.05 52-Wk.Range $7.30-15.45 2Q (Jun) $0.02 $0.00 $0.08 Mkt. Cap (MM) $23,832 3Q (Sep) $0.06 $0.05 $0.10 Fiscal Year Dec 4Q (Dec) $0.13 $0.15 $0.18 Shares O/S (MM) 2,325 FY $0.12 $0.21 $0.42 Dividend yield 1.6% P/E FY 83.8 49.9 24.5
-
Upload
jrwallace93 -
Category
Documents
-
view
233 -
download
0
Transcript of JP Init Coverage 2003

8/8/2019 JP Init Coverage 2003
http://slidepdf.com/reader/full/jp-init-coverage-2003 1/44
http://mm.jpmorgan.com
See last two pages for analyst certification and important disclosures, including investment banking
relationships. JPMorgan does and seeks to do business with companies covered in its research reports. As a
result, investors should be aware that the firm may have a conflict of interest that could affect the objectivity of
this report. Investors should consider this report as only a single factor in making their investment decision.
North American Equity ResearchNew York
10 July 2003
MotorolaInitiation
Neutral
Mind over Margins $10.259 July 03
• We are initiating coverage of Motorola Inc. with a Neutral rating
and a positive bias as we believe the opportunity to expand margins
and de-lever the balance sheet, coupled with a better outlook for
2H03, slightly outweigh the currently low margins, new competitive
pressures, and recently weak track record on execution.
• We believe strong free cash flow will add $7 billion in value to
balance sheet over five years. In addition, we calculate EPS CAGR
of 31% through 2008.
• Thirty new handset models, up from only six in 1H03, should
drive a second half PCS recovery. The dissipation of SARS and
inventory worries in China should also help drive 6% top-line
growth in PCS for 2004 following a 5% decline in 2003.
• In 2004, the semis division should turn its first operating profit
in four years. After shutting 19 of its 27 fabs over last three years,
the SPS division sits just below breakeven for first time since 2000and has close to 65% incremental net margin on new revenue.
• New local competition and Nokia re-entering the CDMA market
makes defense of share tougher for MOT, especially in China,
where it generates 20% of its PCS revenue.
• MOT’s valuation is below its peers. At $10.25, MOT trades at 1.0x
EV to 2004E revenue and 8.3x 2004E EBITDA, compared with
averages of 2.6x and 12.9x for peers Qualcomm, Nokia, Nortel, and
Lucent.
Data Networking & TelcoEquipment
Ehud A. Gelblum, Ph.D.(1-212) 622-6457
Steven J. O’Brien(1-212) 622-6554
Common Stock (NYSE: MOT)
Ticker MOT EPS 2002A 2003E 2004E Price (9 July 03) $10.25 1Q (Mar) ($0.08) $0.01A $0.0552-Wk.Range $7.30-15.45 2Q (Jun) $0.02 $0.00 $0.08Mkt. Cap (MM) $23,832 3Q (Sep) $0.06 $0.05 $0.10Fiscal Year Dec 4Q (Dec) $0.13 $0.15 $0.18Shares O/S (MM) 2,325 FY $0.12 $0.21 $0.42Dividend yield 1.6% P/E FY 83.8 49.9 24.5

8/8/2019 JP Init Coverage 2003
http://slidepdf.com/reader/full/jp-init-coverage-2003 2/44
Ehud A. Gelblum(1-212) [email protected]
North American Equity ResearchNew York10 July 2003
2
Investment Thesis
We are initiating coverage of Motorola Inc. with a Neutral rating, although our biasis toward the upside. We believe the opportunity to significantly expand margins and
de-lever the balance sheet, coupled with our better outlook for the second half of the
year, outweigh the currently low margins, new competitive pressures, and
management’s recently disappointing track record in meeting Street expectations.
The good news is that Motorola is still the number-two provider of cellular handsets
globally and the number one in North America and China, with global market share
of 16-18% depending on the quarter. While six new handset model launches in the
first half of the year were far fewer than expected, the company has prepared 30 new
models for the second half, including 17 in China and Asia, which we believe should
help drive top-line and margin expansion in both the PCS and SPS divisions. The bad
news is that Motorola is still trying to crack the code on margins, which remain
stubbornly below industry peers. For example, PCS operating income margin in 1Q
as 4.4%, down from 8.9% in 4Q, versus 22-24% for peers Nokia and Samsung.
Margins for Motorola’s SPS business were negative in 1Q versus 7% for peers Texas
Instruments and STMicroelectronics.
Key Investment Points
Strong Free Cash Flow Should Improve Net Debt Over Next Five Years
We are modeling MOT to generate between $1.5-2.1 billion in operating free cash
flow per year for the next five years. This should raise cash on the balance sheet from
$5.9 billion at the end of 2003 to $8.4 billion by 2008, as debt falls as maturities
come due, from $8.3 billion in 2003 to $3.9 billion in 2008. This translates into a
swing of more than $6.9 billion in net debt over the next five years, worth $3 per
share in value and savings of more than $280 million in annualized interest expense.
We note that this level of free cash flow represents only 5-6% of revenue in themid-term years of our model, well below Cisco’s 20-22% free cash flow margin and
even below Nortel’s 8-10%.
New Handsets in 2H03 and European Share Gain Should Drive PCS Growth
While the first half of the year was largely a disappointment for the PCS handset
division, Motorola is introducing 30 new models in the second half of the year and is
pushing a new strategy in Europe to customize and co-brand its handsets with the
major European wireless carriers. Motorola has already announced new handsets
designed specifically for Orange and we expect similar announcements with other
carriers should drive its market share in Europe from approximately 9% in 2003 to
12% in 2004. Together, we expect these events to drive 6% top-line growth in PCS
in 2004, up from a 5% decline in 2003. We also expect a second half resolution of
the excess inventory and SARS issues in China to help boost the top line.
SPS Should Turn Profitable in 2004 for First Time in Three Years
Over the last two years, Motorola has aggressively cut costs, shrinking its fab
capacity from 27 facilities down to eight, and is sitting just below the breakeven
point for the first time since 2000. The company’s existing fab capacity can still
handle 30% more revenue than it is currently generating and the operating leverage
on new business is substantial, as approximately 65 cents of every dollar of
incremental revenue falls directly to the bottom line. We estimate that operating
margins finally turn positive to 2% in 2004 up from a decline of 4% in 2003, and
gradually increase to 11% by 2008.

8/8/2019 JP Init Coverage 2003
http://slidepdf.com/reader/full/jp-init-coverage-2003 3/44
Ehud A. Gelblum(1-212) [email protected]
North American Equity ResearchNew York10 July 2003
3
From a top-line perspective, nearly 50% of the semis business is directly related to
the macroeconomic environment through autos and standard products, while another
27% comes from the wireless industry making any recovery in the U.S. economy.
Any success MOT generates in the PCS division automatically drives both top-linegrowth and margin expansion at SPS. On the cost side, recent conversations with
management have convinced us that it has its finger very close to the cost-cutting
button and would not wait long to reduce capacity and costs further if revenue
growth does not return quickly.
Valuation and Rating Analysis
We view MOT as a margin expansion story with a stabilizing balance sheet. In short,
we believe the company sits between a business model with powerful operating
leverage and a record of weak execution on the top line, hence our Neutral rating. At
the current stock price of $10.25, Motorola trades at a revenue multiple of 1.0x and
an EBITDA multiple of 8.3x on our 2004 estimate of $3.1 billion, well below peers
such as Nokia (2.2x and 9.9x, respectively); Qualcomm (7.4x and 16.0x,
respectively); Nortel (1.3x and 11.2x respectively); and Lucent (1.0x and 13.7x,respectively). On an earnings basis, Motorola trades closer to peers with a 2004E P/E
of 24.5 versus Nokia at 18.4, Qualcomm at 22.2, and Nortel at 26.3. Given our
concerns, we do not believe MOT will completely close the discount gap over the
next two quarters, although we can see it trading slightly closer to peer valuations.
If Motorola were to show evidence of greater traction with European carriers or
expanding margins that are closer to its peer group, we would consider upgrading our
rating. Conversely, if the company repeatedly missed its operating targets, we would
downgrade our rating accordingly.
Risks to Our Rating
New Entrants Threaten Handset Market Share
Local Chinese vendors such as TCL, Bird, and Haier are changing the competitivedynamic in the Chinese handset market, a place where MOT has dominated for years
and one that still provides 20-25% of PCS revenue. In addition, Nokia has re-entered
the CDMA market in the U.S. and is attacking China as well, while Korean players
Samsung and LG are gaining increasing traction in North America.
Highly Back-End-Loaded Earnings
Over the past two years, the linearity of Motorola’s earnings have become
increasingly more back-end-loaded, as the company earns over 80% of its annual
EPS in the second half of the year, a worrisome trend. This back-end-weighted trend
began in 2001 and has progressively become more pronounced in the two years
since. On a related note, Motorola has either missed or reduced consensus estimates
in both of the last two quarters, casting doubt on the company’s ability to accurately
forecast its own earnings potential.
Handset Channel Inventory Still High
Handset inventory levels in Asia, especially China, climbed to unusually high levels
in the first half of the year as local manufacturers flooded the market. While
Motorola’s inventory level remained roughly in line at seven weeks, total inventory
in the channel hit 11-12 weeks in Asia overall, and China was higher compared to a
normal range of 6-8 weeks. These levels have pressured average selling prices
(ASPs) across China and Asia and were a root cause of the company’s recent
guidance reduction on June 10.

8/8/2019 JP Init Coverage 2003
http://slidepdf.com/reader/full/jp-init-coverage-2003 4/44
Ehud A. Gelblum(1-212) [email protected]
North American Equity ResearchNew York10 July 2003
4
Company Description
Motorola Inc. is a leading global provider of integrated communications and
embedded electronic equipment. Founded in 1928, the company originally focusedon consumer radio communications. Over the years, Motorola has diversified both its
product and customer base and is a top player in every market in which it
participates. The company breaks down its operations into six segments: personal
communications (PCS), 38% of revenue and 52% of operating income;
semiconductor products (SPS), 17% of revenue and negative operating income;
global telecom solutions (GTSS), 16% of revenue and negative operating income;
commercial, government, and industrial solutions (CGISS), 13% of revenue and 24%
of operating income; broadband communications (BCS), 7% of revenue and 17% of
operating income; and integrated electronics systems (IESS), 8% of revenue and 7%
of operating income. Motorola serves a broad group of customers including
consumers, telecommunications carriers, enterprises, and government agencies.
Motorola’s Product Portfolio
Personal Communications Segment (PCS)
The PCS, or wireless handset, division makes and sells handsets globally in the
CDMA, TDMA, GSM, and iDEN formats. The phones are primarily sold through
wireless service providers, but are also sold through distributors, dealers, retailers,
and licensees. PCS’s largest single customer is Nextel, whose iDEN phones
accounted for roughly 12% of Motorola’s shipped handsets in 2002, and an even
larger proportion of total sales and operating profit given the higher than average
selling price of an iDEN handset (we estimate $175 versus the Motorola average of
$147 last quarter).
Strong Presence in North America and China
In the recent past, approximately 20% of MOT’s handset sales were into the Chinese
market for use primarily on China Mobile’s and China Unicom’s networks. Motorola
is currently the largest handset player in China and the U.S., and is second globally
only to Nokia due to Motorola’s relatively low 9% share in Western Europe (Nokia’s
share in Western Europe is approximately 50%). Motorola’s other top customers are
Verizon Wireless, AT&T Wireless, T-Mobile USA, ALLTEL, and Telcel Mexico.
Interestingly, although Verizon Wireless is a very substantial purchaser of Motorola
CDMA phones, Sprint PCS, the other major nationwide CDMA provider in the U.S.,
is not. We currently have no evidence to suggest that Motorola is gaining traction at
Sprint and we are not factoring any assumptions into our model. Any announcement
on that front would likely represent upside to our numbers.
PCS Gained Market Share in 2002
Motorola’s cumulative market share totals showed continued improvement over the
last three quarters of 2002, with the greatest surge in North America, where we
estimate Motorola’s share climbed from 29% in June 2002 to nearly 36% in
December 2002, led by the popularity of both Motorola’s CDMA and TDMA
products. The major exception was Asia, where we estimate Motorola’s share slipped
over the same period from 17% in June 2002 to 13% in December 2002, showing
signs that competition from domestic vendors is eroding the company’s share
position.

8/8/2019 JP Init Coverage 2003
http://slidepdf.com/reader/full/jp-init-coverage-2003 5/44
Ehud A. Gelblum(1-212) [email protected]
North American Equity ResearchNew York10 July 2003
5
Momentum Stalled in 2003
First quarter 2003 results showed further weakness in Asia as we estimate
Motorola’s Asia market share dropped another 300 bps to 10%. And on June 9,
Motorola lowered its 2Q03 guidance, citing difficulty in Asia due primarily to excessinventory issues, especially in China. However, comments from Motorola on its
investor conference call indicated that competitors are mainly taking share from the
lower-ASP end of the market, and that the inventory correction is industry-wide, not
company specific.
Semiconductor Products Segment (SPS)
Motorola’s semiconductor division, SPS, sell chips into four main markets—
Wireless Handsets, Network Infrastructure, Automotive, and Standard Products
(basically a catch-all category).
SPS Driven by Internal and Direct Sales
As one would expect, Motorola itself is the SPS group’s largest customer, accountingfor 24% of revenue in 2002 (up from 22% in 2001). Sales are made both through a
direct sales force (approximately 80%) and through an indirect channel of
distributors (20%). The direct/indirect breakdown corresponds to the end customer,
with Motorola selling its wireless, networking , and automotive products directly,
while using channel partners for distribution of most of the standard products. Top
end customers include Solectron, Delphi, Visteon, Siemens, Qualcomm, Bosch, and
Hewlett-Packard. Avnet, Arrow, and Future collectively account for 50% of all
distributor sales.
Lowering SPS Fixed Costs
Over the last 12 to 15 months, MOT has shifted to an asset-light, lower cost
operating model that includes outsourcing 27% of its fab and assembly requirements
and partnering on next-generation production facilities such as the company’s 90 nmCMOS production facility that it is co-developing in conjunction with ST Micro and
Philips. Motorola plans to outsource 45-50% of its fab requirements by 2006,
contingent on market growth. Despite the breadth of product line, the key driver of
SPS growth over the next three to five quarters will most likely be the take-up rate of
the wireless i.250 chipset both internally and outside the company.
Wireless Handsets
Motorola’s wireless handset division made up 27% of total 2002 SPS revenues, or
$1.35 billion, down from 24% and $1.38 billion in 2001, and makes chips for
TDMA, GSM, GPRS, CDMA, and 3G/WCDMA phones. Motorola’s own PCS
handset division is not bound to use these chips for its phones, but still accounts for
60-80% of the wireless business at SPS; external customers such as BenQ, TCL,
Siemens, and Alcotech account for the other 20-40%. Interestingly, Motorola haschosen to use QCOM chips for its CDMA2000 1X phones rather than develop its
own 1X chipset, but it did develop its own 3G/WCMDA chipset, which it is also
selling to Siemens.
Network Infrastructure
Networking and computing chips made up 25% of total 2002 SPS revenues, or
$1.25 billion, down from 28% and $1.43 billion in 2001 and 40% of total SPS
revenues at the peak. Chips fall mainly into two broad categories—those that go into
wireless infrastructure such as base stations and those that go into data networking
equipment such as IP routers and ATM or Ethernet switches. SPS revenues are split

8/8/2019 JP Init Coverage 2003
http://slidepdf.com/reader/full/jp-init-coverage-2003 6/44
Ehud A. Gelblum(1-212) [email protected]
North American Equity ResearchNew York10 July 2003
6
between wireless (approximately 35%) and data networking (65%), with the total
addressable global market for both categories on the order of $24 billion, according
to Gartner.
Automotive
Motorola’s automotive division made up 29% of total 2002 SPS revenues, or
$1.45 billion, down from 29% and $1.48 billion in 2001, and ships products like
engine management, navigation, and climate control systems to most of the major
U.S. and European auto manufacturers. MOT is by far the largest player in this
market with an approximately a 14-15% share of the roughly $10 billion global
market—nearly three times the next largest player—although nearly all of MOT’s
business is in North America and Europe. The company has been making some
progress of late in China but has almost no presence in Japan and the rest of Asia.
We estimate that approximately 40-50% of all cars globally contain Motorola engine
management systems. Due to the increasing number of uses for semis in autos and
the generally rising trend of new car sales, we expect the total automotive chip
market to grow at a 14% CAGR through 2006. Primary competitors in this divisioninclude Hitachi.
Standard Products
The Standard Products division, which is essentially a miscellaneous catch-all group,
makes chips that go into everything from refrigerators, electronic games, toys, and
musical instruments to industrial sensors and elevator control systems. These
products made up 19% of total 2002 SPS revenues or $950 million, down from 19%
and $970 billion in 2001, and should generally grow slightly faster than GDP as
chips in general find their way into more everyday products. MOT has thoroughly
revamped its product portfolio in the Standards Products group, introducing 160 new
products in 2003, up dramatically from 2002. MOT also launched its new HC08
family of super-low-cost, sub-$1 LVLP (Low Voltage, Low Power) microprocessors
in October that it hopes will help utilize micro-controller technology in more
everyday items. The new HC08 processors are used in everyday products such as TV
remote controls and home smoke detectors.
Global Telecom Solutions Segment (GTSS)
GTSS sells wireless infrastructure equipment such as base stations, base site
controllers, radio transmitters, and other associated equipment for all three major
wireless standards—TDMA, GS, and CDMA—as well as for the Nextel iDEN
standard. The division made up 17% of total company revenue in 2002, or $4.6
billion, falling slightly to 15.8% of total revenues in 1Q. Motorola also resells
third-party switches for its wireless systems primarily from Siemens and Nortel. We
believe Motorola has tried to sell its GTSS division in the past and would most likely
still entertain a reasonable offer, as the dynamics of the infrastructure business are far different than that of the wireless handset division that drives most of Motorola’s
profitability.
GTSS Revenue Dependent on New Network Rollouts
The primary drivers of wireless infrastructure spend has been new CDMA system
builds in Asia (both CDMA and GSM in India and China) and Latin America; the
2.5G GPRS/EDGE builds for the GSM providers, mainly in Europe; and eventually
the 3G/WCDMA overbuilds. Due to Motorola’s significant overall presence in
China, the company received the largest contract from China Unicom for its $1.2
billion phase II CDMA 1X system build, a large portion of which was received in

8/8/2019 JP Init Coverage 2003
http://slidepdf.com/reader/full/jp-init-coverage-2003 7/44
Ehud A. Gelblum(1-212) [email protected]
North American Equity ResearchNew York10 July 2003
7
1Q, helping push GTSS operating profit into the black. ALLTEL is also a major
GTSS customer.
Commercial, Government and Industrial Solutions Segment(CGISS)
CGISS essentially sells professional-grade walkie-talkie systems to a wide variety of
industrial users, including police and fire departments, utilities, the energy,
transportation and public safety industries, governments, and other similar
customers. The division made up 14% of total company revenue in 2002, or
$3.7 billion, remaining at 14% of total revenues in 1Q.
The Walkie-Talkie Leader
Motorola is by far the market share leader in two-way radio systems, with an
approximate 55% share of the roughly $7 billion market, more than two times that of
the next largest competitor. The heightened need for safety and security solutions
over the last two years has created new opportunities for CGISS. However, delays inHomeland Security funding have pushed out spending on statewide and nationwide
“mega systems” for security agencies.
Broadband Communications Segment (BCS)
BCS sells broadband video and data equipment for the cable television industry on
the network side as well as the consumer CPE box side. The division made up 8% of
total company revenue in 2002, or $2.1 billion, falling to 8% of total revenues in 1Q.
Number One in Cable Equipment
Products include set-top boxes for standard and digital cable television, cable
modems, cable modem termination systems (CMTS), IP telephony products, hybrid
fiber coaxial network transmission systems, digital satellite television systems,direct-to-home (DTH) satellite networks, private networks for business
communications, and digital broadcast products. Motorola is the number-one player
in the North American market for both networks and digital set-top boxes. Scientific
Atlanta is the next largest supplier and Motorola’s biggest competitor.
Integrated Electronic Systems Segment (IESS)
IESS is a hodge-podge division of random electronic products divided into three
broad categories: automotive communications and electronic systems (ACES),
energy systems group (ESG), and the Motorola Computer Group (MCG). The
division in total made up 8% of total company revenue in 2002, or $2.2 billion, and
grew to 9% of total revenues in 1Q.
ACES, in turn, consists of two businesses, powertrain chassis and systems group
(PCSG) and telematics communications group (TCG). PCSG designs and sells
custom electronic solutions to original equipment manufacturers (OEMs) including
foreign and domestic automobile, and heavy and farm vehicle manufacturers. TCG
provides embedded telematics control units, integrated wireless handsets, and
navigation and driver safety products. ESG provides portable energy systems for
wireless handsets, notebook computers, and other portable electronic products. MCG
provides embedded computing technology used in a variety of products, including
telecommunications infrastructure, CAT scanners and MRI equipment, flight
simulators, and semiconductor manufacturing equipment.

8/8/2019 JP Init Coverage 2003
http://slidepdf.com/reader/full/jp-init-coverage-2003 8/44
Ehud A. Gelblum(1-212) [email protected]
North American Equity ResearchNew York10 July 2003
8
Motorola Earnings Outlook
RevenueForecasting 6% revenue decline for 2003
For full year 2003, we expect Motorola revenue to decline 5.8% to $25.7 billion, an
improvement from the 8.9% decline in ‘02 as the rate of revenue decline for GTSS
and BCS should slow significantly, offsetting a weak year for PCS. We forecast
GTSS revenue declining just 14% in 2003 after falling 29% in 2002, and BCS
revenue falling 21% in 2003 after falling 28% in 2002. In 2003, we expect
Motorola’s two biggest revenue sources, PCS and SPS, to post 5% declines, driven
by excess inventory and ASP declines in Asia.
Table 1: Annual Revenue Contribution
$ in millions
2002A 2003E 2004E 2005E 2006E 2007E 2008EProduct Revenue Breakdown
Personal Communications 11,174 10,616 11,223 11,985 12,806 13,556 14,364
Semiconductor Products 5,000 4,748 5,139 5,527 5,968 6,443 6,955
Global Telecom Solutions 4,611 3,964 4,155 4,279 4,408 4,540 4,676
Comm., Gov., & Industrial 3,749 3,861 3,998 4,299 4,557 4,784 5,024
Broadband Communications 2,087 1,649 1,484 1,335 1,335 1,335 1,335
Integrated Electronic Systems 2,189 2,110 2,102 2,163 2,239 2,317 2,398
Other Products 486 408 421 421 421 421 421
Total Adjustments (2,017) (1,650) (1,799) (1,934) (2,089) (2,255) (2,434)
Total Motorola Sales 27,279 25,705 26,722 28,075 29,644 31,142 32,739
Year/Year GrowthPersonal Communications 3.8% (5.0)% 5.7% 6.8% 6.8% 5.9% 6.0%
Semiconductor Products (1.9)% (5.0)% 8.2% 7.5% 8.0% 8.0% 7.9%
Global Telecom Solutions (29.2)% (14.0)% 4.8% 3.0% 3.0% 3.0% 3.0%
Comm., Gov., & Industrial (3.0)% 3.0% 3.6% 7.5% 6.0% 5.0% 5.0%
Broadband Communications (27.7)% (21.0)% (10.0)% (10.0)% 0.0% 0.0% 0.0%
Integrated Electronic Systems (2.2)% (3.6)% (0.3)% 2.9% 3.5% 3.5% 3.5%
Other Products (26.1)% (16.1)% 3.2% 0.0% 0.0% 0.0% 0.0%
Total Motorola Sales (8.9)% (5.8)% 4.0% 5.1% 5.6% 5.1% 5.1%
Revenue Contribution
Personal Communications 41.0% 41.3% 42.0% 42.7% 43.2% 43.5% 43.9%
Semiconductor Products 18.3% 18.5% 19.2% 19.7% 20.1% 20.7% 21.2%
Global Telecom Solutions 16.9% 15.4% 15.5% 15.2% 14.9% 14.6% 14.3%
Comm., Gov., & Industrial 13.7% 15.0% 15.0% 15.3% 15.4% 15.4% 15.3%
Broadband Communications 7.7% 6.4% 5.6% 4.8% 4.5% 4.3% 4.1%
Integrated Electronic Systems 8.0% 8.2% 7.9% 7.7% 7.6% 7.4% 7.3%
Other Products 1.8% 1.6% 1.6% 1.5% 1.4% 1.4% 1.3%
Total Adjustments (7.4)% (6.4)% (6.7)% (6.9)% (7.0)% (7.2)% (7.4)%
Total Motorola Sales 100.0% 100.0% 100.0% 100.0% 100.0% 100.0% 100.0%
Source: Company reports and JPMorgan estimates.
Please refer to the full annualand quarterly income statementsfor Motorola which are found on
pages 34-35.

8/8/2019 JP Init Coverage 2003
http://slidepdf.com/reader/full/jp-init-coverage-2003 9/44
Ehud A. Gelblum(1-212) [email protected]
North American Equity ResearchNew York10 July 2003
9
Wireless to Drive Longer-Term Outlook
Looking out five years, we believe Motorola could post a five-year CAGR from
2003-2008 of 5%, driven by continued increases in global wireless penetration, share
gains in Europe, demand for handsets with new features, steady increases insemiconductor usage, stabilization in wireless and cable network spending, and
traditional stability from the company’s CGISS and IESS product sets. In addition to
industry growth, our expectation for PCS growth assumes ASPs decline 4%
annually, 1% better than the overall industry, as handsets in general pack more
features and Motorola makes more shipments into higher ASP markets such as
Europe versus lower ASP markets such as China.
Figure 1: Annual Revenue Contribution
2002A
P CS
38.1%
SP S
17.1%
GTSS
15.7%
CGISS
12.8%
BC S7.1%
Other
1.7%IESS
7.5%
2003E
SPS
17.4%
GTSS
14.5%
CGISS
14.1%
BCS
6.0%
IESS
7.7%
Other
1.5%
PCS
38.8%
2008E
SPS
19.8%
GTSS
13.3%
CGISS
14.3%
BCS3.8%
IESS
6.8%
PCS
40.8%
Other
1.2%
Source: Company reports and JPMorgan estimates.
PCS and SPS to Lead to a Second Quarter Revenue Decline
In the second quarter, we expect revenue to decline 1.4% sequentially to $6.0 billion,following the 21.5% decrease in the first quarter of 2003 and representing a
year-over-year decrease of 13.3%, down from the first quarter’s 2.2% decrease. In
the second quarter, we expect sequential declines in the PCS and SPS segments,
which are inconsistent with the normal seasonality of the business, where the first
quarter is normally the weakest.
The drivers of Motorola’s year-over-year revenue decrease in 2Q are weakness in
PCS, which we expect to decline 14.5% annually to $2.3 billion (down 6.2%
sequentially), and weakness in SPS, which we expect to decline 10.7% annually to
$1.12 billion (down 2.5% sequentially). These should be offset by strength in CGISS
and GTSS, which we expect to experience more typical seasonality in 2Q, growing
sequentially 6% and 4% respectively.

8/8/2019 JP Init Coverage 2003
http://slidepdf.com/reader/full/jp-init-coverage-2003 10/44
Ehud A. Gelblum(1-212) [email protected]
North American Equity ResearchNew York10 July 2003
10
Table 2: Quarterly Revenue Contribution
$ in millions
Q1-03A Q2-03E Q3-03E Q4-03E Q1-04E Q2-04E Q3-04E Q4-04E
Product Revenue Breakdown Personal Communications 2,447 2,295 2,709 3,165 2,557 2,601 2,822 3,242
Semiconductor Products 1,151 1,122 1,178 1,296 1,233 1,276 1,276 1,353
Global Telecom Solutions 952 990 941 1,082 998 1,038 986 1,134
Comm., Gov., & Industrial 863 915 906 1,177 883 980 970 1,164
Broadband Communications 405 405 413 425 365 365 372 383
Integrated Electronic Systems 521 521 516 552 508 523 518 554
Other Products 95 102 100 112 100 105 103 112
Total Adjustments (391) (393) (412) (454) (432) (447) (447) (474)
Total Motorola Sales 6,043 5,957 6,349 7,356 6,212 6,441 6,600 7,468
Quarter/Quarter Growth
Personal Communications (27.4)% (6.2)% 18.0% 16.9% (19.2)% 1.7% 8.5% 14.9%
Semiconductor Products (14.2)% (2.5)% 5.0% 10.0% (4.9)% 3.5% 0.0% 6.0%
Global Telecom Solutions (22.9)% 4.0% (5.0)% 15.0% (7.8)% 4.0% (5.0)% 15.0%
Comm., Gov., & Industrial (26.5)% 6.0% (1.0)% 30.0% (25.0)% 11.0% (1.0)% 20.0%
Broadband Communications (17.2)% 0.0% 2.0% 3.0% (14.3)% 0.0% 2.0% 3.0%
Integrated Electronic Systems (8.6)% 0.0% (1.0)% 7.0% (8.0)% 3.0% (1.0)% 7.0%
Other Products (26.9)% 7.0% (2.0)% 12.0% (10.0)% 5.0% (2.0)% 8.0%
Total Motorola Sales (21.5)% (1.4)% 6.6% 15.9% (15.5)% 3.7% 2.5% 13.2%
Year/Year Growth
Personal Communications 1.7% (14.5)% (0.2)% (6.0)% 4.5% 13.3% 4.2% 2.4%
Semiconductor Products 2.1% (10.7)% (7.6)% (3.4)% 7.1% 13.7% 8.3% 4.4%
Global Telecom Solutions (12.3)% (21.5)% (8.6)% (12.4)% 4.8% 4.8% 4.8% 4.8%
Comm., Gov., & Industrial 7.6% 2.9% 2.4% 0.3% 2.3% 7.1% 7.1% (1.1)%
Broadband Communications (22.9 )% (26.9)% (20.4)% (13.0)% (10.0)% (10.0 )% (10.0)% (10.0)%
Integrated Electronic Systems 2.4% (8.0)% (5.2)% (3.2)% (2.5)% 0.4% 0.4% 0.4%
Other Products (11.2)% (21.2)% (17.0)% (14.2)% 5.7% 3.7% 3.7% 0.0%
Total Motorola Sales (2.2)% (13.3)% (2.8)% (4.4)% 2.8% 8.1% 4.0% 1.5%
Source: Company reports and JPMorgan estimates.
Operating Income
Margins Poised for a Turnaround
Motorola’s margins have come a long way over the past two years when the
company’s 27 semiconductor fabs and high overhead (headcount was 147,000)
caused a quarterly operating loss of $274 million in June 2001. Today, those 27 fabs
have been squeezed down to just eight and semiconductor breakeven is down to
$5 billion per year from $7.5 billion at the end of 2000. Total company headcount is
down as well to 93,000, heading toward 90,000 by year-end. Despite the
improvements in cost structure, however, MOT continues to report some of the
lowest operating margins in the wireless handset, semiconductor, and telecom
equipment industries. Even historically, the semis group never broke the 10-11%
margin range in the late 1990s, a period when Texas Instruments and others were
reporting 20-24% margins. However, with all six divisions finally either at or near
breakeven, we believe the model has plenty of operating leverage as the economy
improves and the company drives incremental revenue.

8/8/2019 JP Init Coverage 2003
http://slidepdf.com/reader/full/jp-init-coverage-2003 11/44
Ehud A. Gelblum(1-212) [email protected]
North American Equity ResearchNew York10 July 2003
11
Further Cost Reductions Likely
Motorola is tailoring the company’s cost structure around the long-term goal of
mid-teens operating income margin from each of its segments, except GTSS (which
has a lower, high-single-digit margin goal due to higher competition and weaker long-term potential). Given recently reduced guidance, we expect Motorola to pursue
further cost reductions when it reports second quarter earnings next week. Our 2003
operating income forecast of $1.1 billion excludes a further $700 million in
restructuring charges in 2003, in line with company expectations. We are also
assuming a $136 million benefit to SG&A expense from an additional 4,000-person
reduction to headcount. Our long-term, five-year model has operating margin
expanding to 10% by 2008 based on 5% compound annual revenue growth and 34%
gross margins.
Table 3: Annual Operating Income Forecast
$ in millions
2002A 2003E 2004E 2005E 2006E 2007E 2008E
Operating Income
PCS 804 588 897 980 1,142 1,208 1,280
SPS (283) (174) 90 342 491 574 745
GTSS (11) 142 227 290 354 420 488
CGISS 361 446 479 528 572 612 655
BCS 257 138 127 114 114 114 114
IESS 115 123 126 129 134 138 143
Other, Adjustments, & General (415) (166) (130) (144) (132) (120) (108)
Total Motorola 828 1,096 1,817 2,239 2,673 2,946 3,318
Operating Margin
PCS 7.2% 5.5% 8.0% 8.2% 8.9% 8.9% 8.9%
SPS (5.7)% (3.7)% 1.8% 6.2% 8.2% 8.9% 10.7%GTSS (0.2)% 3.6% 5.5% 6.8% 8.0% 9.2% 10.4%
CGISS 9.6% 11.5% 12.0% 12.3% 12.5% 12.8% 13.0%
BCS 12.3% 8.4% 8.5% 8.5% 8.5% 8.5% 8.5%
IESS 5.3% 5.8% 6.0% 6.0% 6.0% 6.0% 6.0%
Total Motorola 3.0% 4.3% 6.8% 8.0% 9.0% 9.5% 10.1%
Source: Company reports and JPMorgan estimates.
Margin Improvement a Back Half of 2003 Story
We expect operating income in the second quarter of 2003 of $91 million for a 1.5%
margin, down $44 million from first quarter operating income of $135 million. In the
third and fourth quarter, we expect significant margin improvement to 4.3% and
8.1%, respectively (operating income of $275 million and $596 million). We believe
this improvement will be driven by the PCS and SPS divisions as the company works
through excess inventory in China and takes some incremental share of GSM handset
shipments in Europe.

8/8/2019 JP Init Coverage 2003
http://slidepdf.com/reader/full/jp-init-coverage-2003 12/44
Ehud A. Gelblum(1-212) [email protected]
North American Equity ResearchNew York10 July 2003
12
Table 4: Quarterly Operating Income Contribution
$ in millions
Q1-03A Q2-03E Q3-03E Q4-03E Q1-04E Q2-04E Q3-04E Q4-04E
Operating IncomePCS 108 50 176 253 128 187 248 334
SPS (74) (83) (47) 30 (11) 17 17 67
GTSS 23 33 8 78 36 56 30 104
CGISS 69 91 109 177 88 98 107 186
BCS 26 28 37 47 26 26 33 42
IESS 23 31 30 39 25 31 30 39
Other, Adjustments, & General (40) (60) (38) (28) (35) (37) (34) (24)
Total Motorola 135 91 275 596 258 379 432 748
Operating Margin
PCS 4.4% 2.2% 6.5% 8.0% 5.0% 7.2% 8.8% 10.3%
SPS (6.4)% (7.4)% (4.0)% 2.3% (0.9)% 1.3% 1.3% 4.9%
GTSS 2.4% 3.3% 0.8% 7.2% 3.6% 5.4% 3.1% 9.2%
CGISS 8.0% 10.0% 12.0% 15.0% 10.0% 10.0% 11.0% 16.0%
BCS 6.4% 6.9% 9.0% 11.0% 7.0% 7.0% 9.0% 11.0%
IESS 4.4% 6.0% 5.8% 7.0% 5.0% 6.0% 5.8% 7.0%
Total Motorola 2.2% 1.5% 4.3% 8.1% 4.1% 5.9% 6.5% 10.0%
Source: Company reports and JPMorgan estimates.
EPS
Annual EPS to Show Improvement Despite 2003 Revenue Decline
For the full year 2003, we are forecasting Motorola’s earnings to grow to $0.21 per
share from $0.12 in 2002 on a 6% decline in revenue. A slight improvement in grossmargin and $637 million in operating expense reductions should drive the earnings
growth. The company has stated that it will issue new and lower FY03 EPS guidance
on its July earnings call to update its previous guidance of $0.35-0.40, taking into
account the 2Q impact of SARS and high market inventories in China. Looking out
five years to 2008, we believe Motorola could grow earnings to $0.80 per share,
implying a compound annual growth rate of 31% from 2003.
2Q EPS Remains at Breakeven Level
We forecast 2Q 2003 earnings for Motorola of $0.00 per share, a decline from $0.02
in 2Q 2002 and a sequential decline from earnings of $0.01 in the first quarter. Our
2Q estimate is in line within company guidance of $0.00. The year-over-year decline
in our EPS estimate is driven by a 13% decrease in revenue, partially mitigated by a
$167 million reduction in operating expenses. The operating expense improvement is primarily attributable to the reduction in headcount to 93,000 from 102,000 one year
ago, which we forecast will lower SG&A expense by $190 million from 2Q02 to
$987 million for the quarter.

8/8/2019 JP Init Coverage 2003
http://slidepdf.com/reader/full/jp-init-coverage-2003 13/44
Ehud A. Gelblum(1-212) [email protected]
North American Equity ResearchNew York10 July 2003
13
Table 5: Annual Income Statement
$ in millions, except per share data
2002A 2003E 2004E 2005E 2006E 2007E 2008E
Total Net Sales 27,279 25,705 26,722 28,075 29,644 31,142 32,739Cost of Sales 18,251 17,046 17,703 18,599 19,639 20,631 21,689
Total Gross Profit 9,028 8,659 9,019 9,476 10,005 10,511 11,050
Gross Margin 33.1% 33.7% 33.8% 33.8% 33.8% 33.8% 33.8%
Selling, G&A 4,484 3,814 3,745 3,763 3,813 3,933 4,020
R & D expense 3,716 3,749 3,457 3,473 3,519 3,631 3,711
Total Op Expenses 8,200 7,563 7,202 7,236 7,332 7,564 7,732
Operating Income 828 1,096 1,817 2,239 2,673 2,946 3,318
Depreciation & Amort 2,108 1,603 1,317 1,126 1,081 1,056 1,047
EBITDA 2,936 2,699 3,133 3,366 3,754 4,002 4,365
EBITDA Margin 10.8% 10.5% 11.7% 12.0% 12.7% 12.9% 13.3%
Interest expense, net 356 328 273 229 132 73 (16)
Other income (expense) (22) (40) (15) (20) (48) (48) (48)
Earnings Before Taxes 450 729 1,529 1,990 2,493 2,825 3,286
Income Tax Provision 171 248 535 717 948 1,074 1,249
Effective Tax Rate 38.0% 34.1% 35.0% 36.0% 38.0% 38.0% 38.0%
Net Income 279 480 994 1,274 1,546 1,752 2,037
Diluted shares outstanding 2,282 2,339 2,377 2,415 2,454 2,493 2,533
Diluted EPS $0.12 $0.21 $0.42 $0.53 $0.63 $0.70 $0.80
Source: Company reports and JPMorgan estimates.

8/8/2019 JP Init Coverage 2003
http://slidepdf.com/reader/full/jp-init-coverage-2003 14/44
Ehud A. Gelblum(1-212) [email protected]
North American Equity ResearchNew York10 July 2003
14
Growth by Division
Personal Communication Systems (PCS)
PCS is the biggest driver of top-line growth at Motorola and we track it by both
geography and technology. We estimate that a 1% shift in global PCS market share
translates into $615 million of revenue on the top line and a $0.02-0.03 impact to
total company EPS. Therefore, at a market multiple of approximately 20 times P/E, a
two-percentage point gain in sustainable global handset market share would translate
into approximately $1.00 of extra equity value.
The Global Handset Market Continues to Grow
We are forecasting global handset market growth of 5.7% in 2003 to 437 million
units and another 6% growth in 2004 to 462 million units. We expect Motorola to
account for 17.0% of these global shipments in 2003, flat with 2002 but growing to17.7% in 2004, driven by share gains in Europe. We note that we estimated the 2002
total handset market at 414 million units, well above Motorola’s estimate of
395 million units worldwide.
Table 6: Industry ASP Expectations
Company Guidance
Motorola PREVIOUS GUIDANCE, down 5%
Sony-Ericsson Industry down <10%, Sony-Ericsson down <industry
Nokia Q2 ASPs to be down
Qualcomm (CDMA only) Down 10% in 2003
Source: Company reports.
Average Selling Price (ASP) Under Pressure
We expect Motorola’s ASPs to decrease over the rest of 2003 due to inventory
correction in Asia, offset somewhat by a mix shift in handset type as increased
European market penetration should come from higher-end handsets while share
losses in China and India come mainly from lower-end handsets. We are forecasting
an ASP of $143 for 2003, down from 1Q and down 10% from $155 in 2002, and
below previous company guidance of down 5%. Our ASP estimates are more in line
with Sony-Ericsson’s expectation for the industry as can be seen in Table 6. In 2004,
we expect continued reductions in ASP to $137 for the year, down 4% from 2003.
Our 2004 ASP forecast of a 4% decline assumes that Motorola’s share gains in
Europe will give the company a 1% cushion compared with the industry as a whole.

8/8/2019 JP Init Coverage 2003
http://slidepdf.com/reader/full/jp-init-coverage-2003 15/44
Ehud A. Gelblum(1-212) [email protected]
North American Equity ResearchNew York10 July 2003
15
Figure 2: Historical Quarterly ASPs
$ per unit
$100
$120
$140
$160
$180
$200
$220
Q1-01 A Q2- 01A Q3-01A Q4 -01A Q1- 02A Q2-0 2A Q3-02 A Q4 -02A
Motorola Sony - Ericcson Nokia
Qualcomm Samsung Siemens
Source: Company reports.
PCS Revenue by Geography
Balancing Gains in Europe with Defending Share in U.S. and China
Table 7 gives our forecasts for Motorola handsets by geographic region, showing the
company’s strong share in North America and weaker share in Europe and the
Middle East. We note that our forecasts reflect a slight rebalancing as Motorola picks
up additional share in Europe. The key point to watch in the PCS story is whether
Motorola can indeed gain some traction in Europe while defending its share in China
and the U.S. from Nokia, a revamped Sony-Ericsson, Korean players Samsung andLG, and the emerging set of new Chinese local manufacturers. We are modeling
MOT’s European handset share with higher ASP and margin since higher-end
phones tend to be sold into Europe compared to China. We believe MOT’s success in
penetrating Europe is key to its ability to sustain both ASP and margin.
In the paragraphs that follow, we detail our thought process on industry growth and
Motorola’s handset growth by geography.

8/8/2019 JP Init Coverage 2003
http://slidepdf.com/reader/full/jp-init-coverage-2003 16/44
Ehud A. Gelblum(1-212) [email protected]
North American Equity ResearchNew York10 July 2003
16
Table 7: PCS Geographic Forecast
handsets in millions
Mar-02 Jun-02 Sep-02 Dec-02 Mar-03 Jun-03 Sep-03 Dec-03 Mar-04 Jun-04 Sep-04 Dec-04
Q1-02A Q2-02A Q3-02A Q4-02A Q1-03A Q2-03E Q3-03E Q4-03E Q1-04E Q2-04E Q3-04E Q4-04EGlobal Market by Geography (JPM estimates)
North America 19.2 20.4 21.9 24.9 21.0 22.0 23.5 27.0 22.4 23.5 25.5 29.3
Latin America (plug) 6.7 7.1 7.6 8.6 6.4 7.2 7.2 7.3 6.1 6.4 6.9 7.9
EMEA 34.3 36.3 39.0 44.4 32.3 41.2 44.0 45.3 37.5 39.4 42.7 49.1
Asia Pacific 31.9 33.8 36.3 41.3 40.0 33.2 35.2 44.5 36.9 38.7 42.0 48.2
Total Handsets 92.1 97.5 104.7 119.2 99.7 103.6 109.9 124.1 102.8 107.9 117.1 134.5
Motorola Shipments by Geography
North America 5.0 5.9 6.8 8.9 8.4 8.7 9.4 10.8 8.4 8.8 9.5 10.9
Latin America 0.7 1.7 2.6 3.3 1.7 1.8 1.9 2.0 1.5 1.6 1.8 2.0
EMEA 3.6 3.3 2.6 4.4 2.5 3.2 4.1 5.1 4.5 4.8 5.2 5.9
Asia Pacific 5.0 5.9 5.1 5.6 4.2 2.4 3.6 4.3 3.7 3.9 4.2 4.9
Total MOT Handsets 14.2 16.7 17.0 22.2 16.7 16.2 19.1 22.3 18.2 19.1 20.7 23.8
% Market Share
North America 25.8% 28.8% 31.1% 35.7% 39.8% 39.7% 40.2% 40.0% 37.4% 37.4% 37.4% 37.4%
Latin America 10.6% 23.7% 33.6% 38.5% 26.1% 24.7% 26.5% 27.4% 25.5% 25.5% 25.5% 25.5%
EMEA 10.4% 9.2% 6.5% 10.0% 7.8% 7.8% 9.3% 11.3% 12.1% 12.1% 12.1% 12.1%
Asia Pacific 15.6% 17.3% 14.1% 13.4% 10.4% 7.3% 10.3% 9.8% 10.1% 10.1% 10.1% 10.1%
Total MOT share 15.4% 17.2% 16.2% 18.6% 16.8% 15.6% 17.4% 18.0% 17.7% 17.7% 17.7% 17.7%
% Contribution of Motorola Shipments
North America 35.0% 35.0% 40.0% 40.0% 50.0% 54.0% 49.5% 48.5% 46.0% 46.0% 46.0% 46.0%
Latin America 5.0% 10.0% 15.0% 15.0% 10.0% 11.0% 10.0% 9.0% 8.5% 8.5% 8.5% 8.5%
EMEA 25.0% 20.0% 15.0% 20.0% 15.0% 20.0% 21.5% 23.0% 25.0% 25.0% 25.0% 25.0%
Asia Pacific 35.0% 35.0% 30.0% 25.0% 25.0% 15.0% 19.0% 19.5% 20.5% 20.5% 20.5% 20.5%
Total contr ibution 100.0% 100.0% 100.0% 100.0% 100.0% 100.0% 100.0% 100.0% 100.0% 100.0% 100.0% 100.0%
Source: Company reports and JPMorgan estimates.
North America Should Continue to Be the Biggest Market for MOT
Through 2002, North America accounted for slightly less than 40% of Motorola’s
handset shipments on average, and we estimate North America should continue to be
Motorola’s largest market, contributing nearly 40% of shipments in 2003 and 2004.
The spike in North America over the last few quarters comes as high channel
inventories in China are depressing shipments into Asia, while the new European
strategy should take several more quarters to take hold. Motorola’s North Americanmarket share in 2003 should also be bolstered by shipments of GSM handsets to
T-Mobile, whose industry-low service plans should drive, we expect, a larger
percentage of GSM gross adds in 2003.
Working Through Inventory and Defending Share in Asia-Pacific
Asia-Pacific, where Motorola held the number-one share position in China
throughout 2002, contributes the next largest percentage of Motorola shipments,
having accounted for 31%, or 21.5 million, handsets last year. As MOT deliberately
pulls back on shipping into the region in an effort to stabilize the excess channel
inventory problems, we expect Asia to become a smaller part of the company’s
overall volume, dropping to 15% in 2Q before returning to a more normal 20% level

8/8/2019 JP Init Coverage 2003
http://slidepdf.com/reader/full/jp-init-coverage-2003 17/44
Ehud A. Gelblum(1-212) [email protected]
North American Equity ResearchNew York10 July 2003
17
in 2004. Overall, we forecast Asia to contribute just 14.6 million handsets in 2003,
down 32% from 21.5 million in 2002, before bouncing back up to 22.7 million in
2004. China accounts for the vast majority of Motorola’s Asia-Pacific shipments.
While the company benefits from long-standing distribution channels and carrier relationships in China, we believe new entrants, primarily Asian manufacturers such
as TCL and Bird, will continue to gain incremental share at the lower end.
Europe/EMEA the Key to Growth
Motorola has traditionally lagged its competitors, such as Nokia and Sony-Ericsson,
in EMEA, naturally dominated by Western Europe. EMEA accounted for 20% of the
company’s shipments in 2002, and we estimate the company captured just 9% of this
market, trailing Nokia (50% share) and Siemens (16% share) by a wide margin.
Despite the company’s weak performance in the past, we believe Motorola should be
able to gain ground in the latter part of 2003 and into 2004, with EMEA accounting
for more than 20% of MOT shipments in 2H03 and 25% of shipments in full year
2004, raising MOT’s European market share to 12% by the end of 2004.
Motorola could also see upside from Eastern Europe as the dominant handset
providers are not as entrenched in those markets. Motorola’s new strategy in Europe
for gaining share is to work closely with the service provider, introducing exclusive
and customized versions of its handsets.
PCS Revenue by Technology
On a technology basis, we do not expect any major shifts in the contribution of
handset shipments over the next two years. The most notable shift will be an increase
in Motorola’s percent contribution from W-CDMA handsets, from 0% in 2002 to
2.5% in 2004 as the company moves forward with next-generation operators in
Europe while sustaining new competition from Nokia in CDMA. Table 8 shows our
handset forecast broken down by technology.

8/8/2019 JP Init Coverage 2003
http://slidepdf.com/reader/full/jp-init-coverage-2003 18/44
Ehud A. Gelblum(1-212) [email protected]
North American Equity ResearchNew York10 July 2003
18
Table 8: PCS Technology Forecast
handsets in millions
Mar-02 Jun-02 Sep-02 Dec-02 Mar-03 Jun-03 Sep-03 Dec-03 Mar-04 Jun-04 Sep-04 Dec-04
Q1-02A Q2-02A Q3-02A Q4-02A Q1-03A Q2-03E Q3-03E Q4-03E Q1-04E Q2-04E Q3-04E Q4-04E
Global Market by Technology
(JPM estimates)
Analog 0.7 0.7 0.8 0.9 0.2 0.2 0.3 0.3 0.0 0.0 0.0
TDMA 5.8 6.1 6.6 7.5 4.6 4.7 5.0 5.7 3.3 3.5 3.8 4.4
GSM (including GPRS) 57.4 60.8 65.3 74.3 64.5 67.1 71.1 80.3 65.5 68.8 74.6 85.7
CDMA 19.4 20.5 22.0 25.1 21.7 22.6 24.0 27.0 22.4 23.5 25.4 29.2
W-CDMA 0.0 0.0 0.0 0.0 0.3 0.4 0.4 0.4 3.3 3.5 3.8 4.4
PDC 6.7 6.8 8.3 9.2 6.6 7.0 7.2 8.1 6.4 6.8 7.3 8.4
iDEN 2.1 2.5 1.7 2.2 1.7 1.7 2.0 2.3 1.8 1.9 2.1 2.4
Total Handsets 92.1 97.5 104.7 119.2 99.7 103.6 109.9 124.1 102.8 107.9 117.1 134.5
Motorola Shipmentsby Technology
Analog 0.0 0.0 0.0 0.0 0.0 0.0 0.0 0.0 0.0 0.0 0.0
TDMA 0.7 0.8 2.6 3.3 2.5 2.4 2.3 2.7 2.4 2.5 2.5 2.9
GSM (including GPRS) 9.2 9.2 8.5 11.1 8.3 8.0 10.0 11.7 9.1 9.5 10.4 11.9
CDMA 2.1 4.2 4.3 5.6 4.2 4.0 4.8 5.6 4.5 4.8 5.2 5.9
W-CDMA 0.0 0.0 0.0 0.0 0.0 0.0 0.0 0.1 0.4 0.4 0.6 0.7
PDC 0.0 0.0 0.0 0.0 0.0 0.0 0.0 0.0 0.0 0.0 0.0 0.0
iDEN 2.1 2.5 1.7 2.2 1.7 1.7 2.0 2.3 1.8 1.9 2.1 2.4
Total MOT Handsets 14.2 16.7 17.0 22.2 16.7 16.2 19.1 22.3 18.2 19.1 20.7 23.8
% Market Share
Analog 0.0% 0.0% 0.0% 0.0% 0.0% 0.0% 0.0% 0.0% NM NM NM
TDMA 12.3% 13.6% 38.8% 44.4% 54.9% 51.2% 45.5% 47.1% 70.8% 70.8% 65.4% 65.4%
GSM (including GPRS) 16.1% 15.1% 13.0% 14.9% 12.8% 11.9% 14.1% 14.6% 13.9% 13.9% 13.9% 13.9%
CDMA 11.0% 20.4% 19.3% 22.1% 19.2% 17.9% 19.9% 20.6% 20.3% 20.3% 20.3% 20.3%
W-CDMA 0.0% 0.0% 0.0% 0.0% 5.9% 8.2% 10.1% 15.7% 10.9% 10.9% 16.3% 16.3%
PDC 0.0% 0.0% 0.0% 0.0% 0.0% 0.0% 0.0% 0.0% 0.0% 0.0% 0.0% 0.0%
iDEN 100.0% 100.0% 100.0% 100.0% 100.0% 100.0% 100.0% 100.0% 100.0% 100.0% 100.0% 100.0%
Total MOT share 15.4% 17.2% 16.2% 18.6% 16.8% 15.6% 17.4% 18.0% 17.7% 17.7% 17.7% 17.7%
% Contribution of
Motorola Shipments
Analog 0.0% 0.0% 0.0% 0.0% 0.0% 0.0% 0.0% 0.0% 0.0% 0.0% 0.0%
TDMA 5.0% 5.0% 15.0% 15.0% 15.0% 15.0% 12.0% 12.0% 13.0% 13.0% 12.0% 12.0%
GSM (including GPRS) 65.0% 55.0% 50.0% 50.0% 49.5% 49.5% 52.5% 52.5% 50.0% 50.0% 50.0% 50.0%
CDMA 15.0% 25.0% 25.0% 25.0% 25.0% 25.0% 25.0% 25.0% 25.0% 25.0% 25.0% 25.0%
W-CDMA 0.0% 0.0% 0.0% 0.0% 0.1% 0.2% 0.2% 0.3% 2.0% 2.0% 3.0% 3.0%
PDC 0.0% 0.0% 0.0% 0.0% 0.0% 0.0% 0.0% 0.0% 0.0% 0.0% 0.0% 0.0%
iDEN 15.0% 15.0% 10.0% 10.0% 10.4% 10.3% 10.3% 10.2% 10.0% 10.0% 10.0% 10.0%
Total contr ibut ion 100.0% 100.0% 100.0% 100.0% 100.0% 100.0% 100.0% 100.0% 100.0% 100.0% 100.0% 100.0%
Source: Company reports and JPMorgan estimates.

8/8/2019 JP Init Coverage 2003
http://slidepdf.com/reader/full/jp-init-coverage-2003 19/44
Ehud A. Gelblum(1-212) [email protected]
North American Equity ResearchNew York10 July 2003
19
GSM Continues to Be the Most Important Market
The large contribution to Motorola’s total shipments from GSM is driven by the
company’s increased emphasis on penetrating EMEA and by the technology shift
away from legacy TDMA handsets in the United States. We are forecasting Motorolato capture 13.4% of the worldwide GSM market in 2003 and a greater 13.9% share in
2004, mainly the result of increased European emphasis.
New Opportunities and Competition in CDMA
We are forecasting CDMA handset contribution to grow in 2003 to 25%, and
maintain that level in 2004 as new CDMA markets in countries such as India and
China develop. These gains should be partially offset in 2004 by increased CDMA
competition from Nokia, which plans to introduce five new CDMA handsets in the
United States in the second half of 2003, and by new local competition in China from
companies such as TCL, Bird, ZTE, and Haier. These pressures result in our net
forecast of Motorola’s CDMA market share reaching 19.5% in 2003, and growing
modestly to 20.3% in 2004 from 18.5% in 2002.
WCDMA Could Become a Significant Factor in 2004
Motorola currently only supplies 3G handsets into 3’s (formerly Hutchison
Whampoa) wideband CDMA networks in the U.K. and Italy; Siemens is also
OEM’ing the MOT WCDMA phone. We are not modeling any significant
contribution from WCDMA in 2003, but are looking for WCDMA to contribute
roughly 2.5% of handset shipments for Motorola in 2004.
iDEN Remains a Cash Cow
We are currently forecasting iDEN handsets to contribute 10% of total shipments in
2003 and 2004, down from 12-15% in 2001 and 2002 as Nextel’s net and gross adds
have remained remarkably flat over the last two to three years while global
subscriber and handset additions have ramped up. Motorola is currently—and should
remain—the sole provider of handsets for Nextel’s iDEN network.
PDC/Other
The PDC/Other market category includes all unique wireless technologies such as
the PDC/PAS, Japan’s FOMA, and the other UMTS/WCDMA networks. Motorola
does not compete in these markets.
New Push-to-Talk Services Could Affect iDEN Sales
Several carriers such as Verizon Wireless, Sprint PCS, and ALLTEL should be
introducing “push-to-talk” functionality over their CDMA networks later this year
and could pose a threat to Nextel, negatively affecting gross adds and thereby iDEN
handset sales. Nextel is also rolling out nationwide push-to-talk, which should be
attractive to its core business-oriented customer base. It is unclear whether the newcompetitive services will have latency issues that make their product less attractive.
Overall, we expect iDEN shipments to be relatively flat over next two years at 2002
levels of roughly 2 million a quarter. We note that iDEN phones tend to have a
higher ASP and, therefore, contribute disproportionately to margin.
Looking to 2004 for PCS Profitability Improvements
In 2004, we forecast full year PCS margin of 8.0%, up from 5.5% for full year 2003
and 7.2% in 2002. Motorola’s product platform design strategy has reduced the cost
of handsets by reducing the number of parts used, increasing the commonality of
parts and software, lowering the number of unique handset designs, and improving
standardization. The net result was a $1.1 billion improvement in PCS operating

8/8/2019 JP Init Coverage 2003
http://slidepdf.com/reader/full/jp-init-coverage-2003 20/44
Ehud A. Gelblum(1-212) [email protected]
North American Equity ResearchNew York10 July 2003
20
income in 2002 from 2001, despite shipments growing just 12% and revenues
growing by $406 million.
Scale and In-House Components Could Drive PCS Margins Long TermWe forecast 16.9% compound annual growth in PCS operating income from 2003 to
2008, to $1.28 billion for the year. We expect this increase to come from scale
benefits as shipment volume increases, and cost benefits as Motorola enjoys
favorable in-house pricing on all chipsets for its 2.5G GSM/GPRS and 3G WCDMA
handsets.
Profitability to Dip in the Near Term
We forecast operating margin falling 220 basis points to 2.2% in 2Q from 4.4% in
prior quarter before rebounding to 10.3% by 4Q03, driven by seasonality-induced
revenue growth.
Table 9: PCS Operating Forecast
$ in millions; handsets in millions
Mar-02 Jun-02 Sep-02 Dec-02 Mar-03 Jun-03 Sep-03 Dec-03 Mar-04 Jun-04 Sep-04 Dec-04
Q1-02A Q2-02A Q3-02A Q4-02A Q1-03A Q2-03E Q3-03E Q4-03E Q1-04E Q2-04E Q3-04E Q4-04E
Global Handset Market (JPMestimates) 92.1 97.5 104.7 119.2 99.7 103.6 109.9 124.1 102.8 107.9 117.1 134.5
Q/Q growth (16.9)% 5.8% 7.4% 13.9% (16.4)% 3.9% 6.1% 12.9% (17.1)% 5.0% 8.5% 14.9%
Y/Y growth (4.5)% 6.6% 10.8% 7.6% 8.2% 6.2% 5.0% 4.1% 3.1% 4.2% 6.5% 8.4%
Total MOT Handsets shipped 14.2 16.7 17.0 22.2 16.7 16.2 19.1 22.3 18.2 19.1 20.7 23.8
Q/Q growth (18.9)% 17.8% 1.6% 30.5% (24.8)% (3.2)% 18.0% 16.9% (18.4)% 5.0% 8.5% 14.9%
Y/Y growth 12.7% 0.2% 7.6% 26.9% 17.6% (3.4)% 12.2% 0.4% 8.9% 18.1% 8.5% 6.7%
% market share 15.4% 17.2% 16.2% 18.6% 16.8% 15.6% 17.4% 18.0% 17.7% 17.7% 17.7% 17.7%
MOT ASP $169 $160 $160 $152 $147 $142 $142 $142 $141 $136 $136 $136
Q/Q growth (2.9)% (5.3)% (0.5)% (4.9)% (3.4)% (3.1)% 0.0% 0.0% (0.9)% (3.1)% 0.0% 0.0%
Y/Y growth (8.6)% 2.9% (9.1)% (13.0)% (13.5)% (11.5)% (11.1)% (6 .4)% (4 .0)% (4 .0)% (4 .0)% (4.0)%
Total PCS Revenue ($M) 2,406 2,684 2,715 3,369 2,447 2,295 2,709 3,165 2,557 2,601 2,822 3,242
Q/Q growth (21.2)% 11.6% 1.2% 24.1% (27.4)% (6.2)% 18.0% 16.9% (19.2)% 1.7% 8.5% 14.9%
Y/Y growth 3.0% 3.1% (2.2)% 10.4% 1.7% (14.5)% (0.2)% (6.0)% 4.5% 13.3% 4.2% 2.4%
PCS cost of sales and opex 2,299 2,512 2,491 3,068 2,339 2,244 2,533 2,912 2,429 2,414 2,574 2,908
Q/Q growth (19.2)% 9.3% (0.8)% 23.2% (23.8)% (4.1)% 12.8% 15.0% (16.6)% (0.6)% 6.6% 13.0%
Y/Y growth (15.4)% (10.3)% (8.6)% 7.8% 1.7% (10.7)% 1.7% (5.1)% 3.9% 7.6% 1.6% (0.1)%
Total PCS operating income 107 172 224 301 108 50 176 253 128 187 248 334Q/Q growth (48.6)% 60.7% 30.2% 34.4% (64.1)% (53.3)% 248.7% 43.8% (49.5)% 46.5% 32.6% 34.5%
Y/Y growth (128.0)% (188.2)% 339.2% 44.7% 0.9% (70.6)% (21.4)% (15.9)% 18.4% 271.0% 41.0% 31.9%
% margin 4.4% 6.4% 8.3% 8.9% 4.4% 2.2% 6.5% 8.0% 5.0% 7.2% 8.8% 10.3%
Total PCS orders 2,644 2,500 2,500 2,100 2,495
Q/Q growth 22.1% (5.4)% 0.0% (16.0)% 18.8%
Y/Y growth (11.0)% (11.0)% (16.0)% (3.0)% (5.6)%
Book to bill in period 1.10 0.93 0.92 0.62 1.02
Source: Company reports and JPMorgan estimates.

8/8/2019 JP Init Coverage 2003
http://slidepdf.com/reader/full/jp-init-coverage-2003 21/44
Ehud A. Gelblum(1-212) [email protected]
North American Equity ResearchNew York10 July 2003
21
Semiconductor Product Segment (SPS)
Handset Volumes Drive SPS
For 2003, we are forecasting a decline of 5% (previous guidance was for 5-10%
industry growth), driven by the wireless inventory correction in China and pressure
on ASPs. In wireless, we are forecasting Motorola’s wireless handset volume to
grow 6% year over year in 2003, in line with the market. The continued shift in 2003
from the CDMA One phones that used exclusively Motorola silicon toward
CDMA-1X phones that use Qualcomm chips should more than offset any growth
coming from PCS. We also believe the continued increasing usage of semiconductors
in cars—a factor that we estimate grows 10-15% per year—should help drive
revenue beyond 2003.
Motorola Still Growing Well Below Industry Trends
The Semiconductor Industry Association (SIA) data for April indicated that
three-month rolling average sales for the industry were up 9.7% year over year,
below our JPMorgan semiconductor analyst’s expectation of 10.9%. Our JPMorganexpectation for industry growth is 7% for 2003, but with Motorola’s 1Q revenue
falling 14% and our expectation of another sequential down quarter in 2Q, we do not
believe the company will be able to participate in industry growth until a correction
in Asian wireless handset inventory occurs. Beyond 2003, we believe Motorola
should be able to grow more in line with the semiconductor industry and are
forecasting revenue to grow at an 8% compound annual rate from 2003 to 2008.
Table 10: SPS Operating Forecast
$ in millions
Mar-02 Jun-02 Sep-02 Dec-02 Mar-03 Jun-03 Sep-03 Dec-03 Mar-04 Jun-04 Sep-04 Dec-04
Q1-02A Q2-02A Q3-02A Q4-02A Q1-03A Q2-03E Q3-03E Q4-03E Q1-04E Q2-04E Q3-04E Q4-04E
Total SPS Revenue 1,127 1,256 1,275 1,342 1,151 1,122 1,178 1,296 1,233 1,276 1,276 1,353
Q/Q growth (4.1)% 11.4% 1.5% 5.3% (14.2)% (2.5)% 5.0% 10.0% (4.9)% 3.5% 0.0% 6.0%
Y/Y growth (25.7)% (3.0)% 14.8% 14.2% 2.1% (10.7)% (7.6)% (3.4)% 7.1% 13.7% 8.3% 4.4%
SPS cost of sales and opex 1,353 1,335 1,262 1,333 1,225 1,205 1,225 1,266 1,244 1,259 1,259 1,286
Q/Q growth (7.3)% (1.3)% (5.5)% 5.6% (8.1)% (1.6)% 1.6% 3.4% (1.7)% 1.2% 0.0% 2.1%
Y/Y growth (16.1)% (16.8)% (11.3)% (8.6)% (9.5)% (9.7)% (2.9)% (5.0)% 1.6% 4.5% 2.8% 1.6%
Total SPS operating income (226) (79) 13 9 (74) (83) (47) 30 (11) 17 17 67
Q/Q growth NM NM NM (30.8)% NM NM NM NM NM NM 0.0% 290.1%
Y/Y growth NM NM (104.2)% (103.2)% NM NM NM 233.4% NM NM NM 123.1%
% margin NM NM 1.0% 0.7% NM NM NM 2.3% NM 1.3% 1.3% 4.9%
Total SPS orders 1,319 1,300 1,300 1,200 1,104Q/Q growth 29.7% (1.4)% 0.0% (7.7)% (8.0)%
Y/Y growth 18.0% 25.0% 14.0% 18.0% (16.3)%
Book to bill in period 1.17 1.04 1.02 0.89 0.96
Source: Company reports and JPMorgan estimates.

8/8/2019 JP Init Coverage 2003
http://slidepdf.com/reader/full/jp-init-coverage-2003 22/44
Ehud A. Gelblum(1-212) [email protected]
North American Equity ResearchNew York10 July 2003
22
Volume and Utilization Are the Keys to the Profitability Picture
The key variable to SPS profitability is capacity utilization of the company’s
fabrication facilities. We estimate MOT’s current 8 fabs and system of partnership
outsourcing agreements with TSMC can handle approximately $6.5 billion in salesversus the current revenue level of $4.8 billion. This implies that MOT has plenty of
room to grow its business while keeping utilization in the low but respectable
60-65% range. The company is targeting a long-term operating margin of 15-18%,
up from just above breakeven today. In our model, we are forecasting SPS operating
margin of 2% in 2004 on its way to 11% by 2008.
Breakeven Now Just $5 Billion
MOT has thoroughly revamped the SPS business model to an “asset-light” strategy
that has lowered the annual breakeven rate to $5 billion—just 8% above the 1Q
annualized revenue run-rate—down from $7.5 billion a little over two years ago.
Internal manufacturing is now focused solely on leading-edge and specialty
technologies, such as 90nm, while most other work has been farmed out. The risks
associated with bleeding-edge research has also been mitigated through a series of technology partnerships and IP licensing agreements, such as the company’s joint
90nm production effort with partners ST Micro and Philips.
Manufacturing Consolidation Is the Main Source of Cost Reduction
As of the current quarter, Motorola operates only 8 eight-wafer fabrication facilities
and two assembly sites, down from nine and three at year-end 2002, and 16 and six at
year-end 2000. While we believe outsourcing manufacturing may limit the potential
margin upside longer term, our projections for 2003 reflect strong profitability
improvements in the near term. See the Appendix for a detailed list of Motorola’s
eight semiconductor production facilities.
See the Appendix on page 39 for a detailed list of Motorola’sproduction facilities.

8/8/2019 JP Init Coverage 2003
http://slidepdf.com/reader/full/jp-init-coverage-2003 23/44
Ehud A. Gelblum(1-212) [email protected]
North American Equity ResearchNew York10 July 2003
23
Wireless Infrastructure (GTSS)
The Good Old Days Are Long Gone, But Revenue Declines Are Slowing
Despite hopes for a return to past wireless spending levels, we are forecasting a
continuing gradual year-over-year decline in revenue in 2003 and 2004. From 2003
to 2008, we believe GTSS revenue could grow at a 3.4% compounded annual growth
rate, reaching $4.7 billion in 2008. While this represents a reversal of trend, it is still
well below the boom-year revenue of $7.6 billion in 2000 and $6.5 billion in 2001.
Our forecasted growth is based on continued strong growth in minutes of use, new
CDMA builds at China Unicom, and the potential of new revenue sources from India
wireless network rollouts. In the second quarter we expect a modest stabilization in
trends, and we forecast revenue of $990 million, up 4% sequentially, but down
21.5% year over year.
MOT Has Done a Good Job Maintaining Profit in the Weak Market
Motorola lowered its breakeven rate in GTSS to $4 billion on an annual basis. We
expect the 18% GTSS headcount reduction in 2002 and the planned 5% reduction in2003 to help Motorola reduce operating expenses more quickly than its revenues
would decline. This would result in an above-breakeven operating income forecast
for 2003 (3.6% operating margin), followed by further improvements in profitability
in 2004, with operating margin of 5.5%. By 2008, assuming continued revenue
growth and breakeven revenue remained just below $4 billion, we forecast operating
margin to reach 10%.
Table 11: GTSS Operating Forecast
$ in millions
Mar-02 Jun-02 Sep-02 Dec-02 Mar-03 Jun-03 Sep-03 Dec-03 Mar-04 Jun-04 Sep-04 Dec-04
Q1-02A Q2-02A Q3-02A Q4-02A Q1-03A Q2-03E Q3-03E Q4-03E Q1-04E Q2-04E Q3-04E Q4-04E
Total GTSS Revenue 1,085 1,262 1,029 1,235 952 990 941 1,082 998 1,038 986 1,134
Q/Q growth (21.8)% 16.3% (18.5)% 20.0% (22.9)% 4.0% (5.0)% 15.0% (7.8)% 4.0% (5.0)% 15.0%
Y/Y growth (35.6)% (24.4)% (41.9)% (11.0)% (12.3)% (21.5)% (8.6)% (12.4)% 4.8% 4.8% 4.8% 4.8%
GTSS cost of sales and opex 1,136 1,230 1,024 1,232 929 958 933 1,003 961 981 955 1,029
Q/Q growth (24.1)% 8.3% (16.7)% 20.3% (24.6)% 3.1% (2.6)% 7.6% (4.2)% 2.1% (2.6)% 7.7%
Y/Y growth (30.9)% (23.0)% (41.3)% (17.7)% (18.2)% (22.2)% (8.9)% (18.6)% 3.5% 2.5% 2.4% 2.6%
Total GTSS operating income (51) 32 5 3 23 33 8 78 36 56 30 104
Q/Q growth NM NM (84.4)% (40.0)% 666.7% 41.5% (76.1)% NM (53.6)% 54.9% (46.1)% 243.5%
Y/Y growth NM (54.9)% (82.1)% (102.8)% NM 1.7% 55.8% NM 58.0% 73.0% 289.9% 33.1%
% margin NM 2.5% 0.5% 0.2% 2.4% 3.3% 0.8% 7.2% 3.6% 5.4% 3.1% 9.2%
Total GTSS orders 1,293 1,100 880 1,100 935Q/Q growth 14.0% (14.9 )% (20.0)% 25.0% (15.0)%
Y/Y growth (17.0)% (47.0)% (44.0)% (3.0)% (27.7)%
Book to bill in period 1.19 0.87 0.86 0.89 0.98
Source: Company reports and JPMorgan estimates.

8/8/2019 JP Init Coverage 2003
http://slidepdf.com/reader/full/jp-init-coverage-2003 24/44
Ehud A. Gelblum(1-212) [email protected]
North American Equity ResearchNew York10 July 2003
24
Two-Way Radio Systems (CGISS)
Homeland Security Could Improve CGISS Revenue Outlook
We believe Homeland Security spending could be a longer-term driver of CGISS
revenue as governments and municipalities extend the reach and functionality of
their two-way radio networks. However, we are cautious in the near term as the
economic environment has led to tighter budgets controls at the local and state levels
and slower appropriations by customers.
Our CGISS Forecast Reflects Cautious Optimism
For the full year 2003, we believe CGISS revenue could grow 3% for the year,
dependent on slightly increased government spending in the second half of the year.
Over the longer term, we believe municipal budgets should loosen, leading to a
5-year CAGR of 5.4% through 2008 as CGISS continues to be a stable source of
revenue for Motorola. In the second quarter, we are forecasting a pick-up in CGISS
revenue to $915 million for 6% sequential growth, after the first quarter’s 26.5%
decline.
Profitability Improving
We are forecasting steady improvements in operating margin throughout 2003 and
2004, driven by improvements to supply chain management and manufacturing
processes. We are forecasting operating margins of 11.5% in 2003 and 12.0% in
2004 following 2002’s 9.6%. CGISS should also begin to see the cost benefits from
the 10% headcount reduction since the end of 2001.
Table 12: CGISS Operating Forecast
$ in millions
Mar-02 Jun-02 Sep-02 Dec-02 Mar-03 Jun-03 Sep-03 Dec-03 Mar-04 Jun-04 Sep-04 Dec-04
Q1-02A Q2-02A Q3-02A Q4-02A Q1-03A Q2-03E Q3-03E Q4-03E Q1-04E Q2-04E Q3-04E Q4-04E
Total CGISS Revenue 802 889 884 1,174 863 915 906 1,177 883 980 970 1,164Q/Q growth (33.2)% 10.8% (0.6)% 32.8% (26.5)% 6.0% (1.0)% 30.0% (25.0)% 11.0% (1.0)% 20.0%
Y/Y growth (10.3)% 0.9% (0.7)% (2.2)% 7.6% 2.9% 2.4% 0.3% 2.3% 7.1% 7.1% (1.1)%
CGISS cost of sales and opex 751 826 807 1,004 794 823 797 1,001 795 882 864 978
Q/Q growth (26.4)% 10.0% (2.3)% 24.4% (20.9)% 3.7% (3.2)% 25.6% (20.6)% 11.0% (2.1)% 13.3%
Y/Y growth (11.8)% 0.6% (2.1)% (1.6)% 5.7% (0.3)% (1.2)% (0.3)% 0.1% 7.1% 8.4% (2.3)%
Total CGISS operating income 51 63 77 170 69 91 109 177 88 98 107 186
Q/Q growth (71.8)% 23.5% 22.2% 120.8% (59.4)% 32.6% 18.8% 62.5% (50.0)% 11.0% 8.9% 74.5%
Y/Y growth 18.6% 5.0% 16.7% (6.1)% 35.3% 45.2% 41.1% 3.9% 28.0% 7.1% (1.8)% 5.5%
% margin 6.4% 7.1% 8.7% 14.5% 8.0% 10.0% 12.0% 15.0% 10.0% 10.0% 11.0% 16.0%
Total CGISS orders 877 856 987 1,100 905
Q/Q growth (24.3)% (2.4)% 15.3% 11.4% (17.7)%
Y/Y growth (12.0)% (29.0)% (1.0)% (5.0)% 3.2%
Book to bill in period 1.09 0.96 1.12 0.94 1.05
Source: Company reports and JPMorgan estimates.

8/8/2019 JP Init Coverage 2003
http://slidepdf.com/reader/full/jp-init-coverage-2003 25/44
Ehud A. Gelblum(1-212) [email protected]
North American Equity ResearchNew York10 July 2003
25
Broadband (Cable) Communications Segment (BCS)
BCS Revenue Continues to Be Hurt by Cable Spending Cutbacks
BCS revenue has been adversely affected by the slowdown in spending by cable
providers as capex per subscriber has fallen from $292 in 2002 to an estimated $206
this year and $180 in 2004 according to JPMorgan cable analyst, Jason Bazinet. The
new Comcast (i.e., including AT&T Broadband) accounted for 40% of revenue in
2002 and has guided 2003 capex down 23% year over year. Since over 50% of BCS
revenue comes from set-top boxes, revenue growth is dependent on future cable
industry product cycles such as video on demand (VoD) and personal video recorders
(PVRs, e.g., TiVo) to follow up on the success of digital cable.
Trends Are Improving, But Only Slightly
With a slight sequential increase in revenue in the back half of the year, consistent
with the normal seasonality of MSO spending, we are projecting revenue of
$1.65 billion for 2003, down 21% from 2002. Longer term, we expect revenues to
fall at five-year CAGR of -4.1%, dropping in double digits for the next two years as
MSOs continue to reduce spending, followed by a flattening out period through2008. We are forecasting second quarter revenue from BCS to remain flat with the
first quarter (down 27% year over year).
Table 13: BCS Operating Forecast
$ in millions
Mar-02 Jun-02 Sep-02 Dec-02 Mar-03 Jun-03 Sep-03 Dec-03 Mar-04 Jun-04 Sep-04 Dec-04
Q1-02A Q2-02A Q3-02A Q4-02A Q1-03A Q2-03E Q3-03E Q4-03E Q1-04E Q2-04E Q3-04E Q4-04E
Total BCS Revenue 525 554 519 489 405 405 413 425 365 365 372 383
Q/Q growth (9.3)% 5.5% (6.3)% (5.8)% (17.2)% 0.0% 2.0% 3.0% (14.3)% 0.0% 2.0% 3.0%
Y/Y growth (35.8)% (34.9)% (18.5)% (15.5)% (22.9)% (26.9)% (20.4)% (13.0)% (10.0)% (10.0)% (10.0)% (10.0)%
BCS cost of sales and opex 469 493 444 424 379 377 376 379 339 339 338 341
Q/Q growth (6.4)% 5.1% (9.9)% (4.5)% (10.6)% (0.5)% (0.3)% 0.7% (10.5)% 0.0% (0.2)% 0.7%
Y/Y growth (33.0)% (30.6)% (15.3)% (15.4)% (19.2)% (23.5)% (15.3)% (10.7)% (10.6)% (10.1)% (10.0)% (10.0)%
Total BCS operating income 56 61 75 65 26 28 37 47 26 26 33 42
Q/Q growth (28.2)% 8.9% 23.0% (13.3)% (60.0)% 7.5% 33.0% 25.9% (45.5)% 0.0% 31.1% 25.9%
Y/Y growth (52.5)% (56.7 )% (33.6)% (16.7)% (53.6)% (54.2)% (50.4)% (28.0)% (1.9 )% (8 .7 )% (10.0)% (10.0)%
% margin 11.9% 12.4% 16.9% 15.3% 6.9% 6.9% 9.0% 11.0% 7.0% 7.0% 9.0% 11.0%
Total BCS orders 537 420 385 353 343
Q/Q growth 1.9% (21.8)% (8.3)% (8.3)% (2.8)%
Y/Y growth (41.0)% (45.0)% (40.0)% (33.0)% (36.1)%
Book to bill in period 1.02 0.76 0.74 0.72 0.85Source: Company reports and JPMorgan estimates.
Maintaining Profits in a Tough Market
Historically, with mid-teens operating margins, BCS has been a profitable group for
Motorola. We believe BCS should remain profitable, but with margins dipping to
8-9% in 2003 and 2004 as massive revenue declines are offset by expense reductions.
Our forecast assumes benefits from a 27% reduction in manufacturing headcount and
a 13% reduction in selling, general and administrative personnel in 2002, but we are
not modeling margin expansion at the present time given the declining state of
industry spending.

8/8/2019 JP Init Coverage 2003
http://slidepdf.com/reader/full/jp-init-coverage-2003 26/44
Ehud A. Gelblum(1-212) [email protected]
North American Equity ResearchNew York10 July 2003
26
Integrated Electronic Systems Segment (IESS)
Auto Production Slowdown Could Impact IESS Sales
We expect continued modest IESS revenue declines of 3.6% in 2003, slightly worse
than the 2% decline in 2002, but significantly better than the 22% decline in 2001.
ACES (autos) revenue was up in 2002 due to increases in North American
automotive production. North American production appears to be headed for a
weaker year in 2003, while first quarter production was up on a year-over-year basis,
Our Autos analyst, David Bradley, is forecasting weaker annual production totals for
the second quarter and the full year. Production in the latter half of 2003 could be
adversely affected potentially by an auto workers strike. Reductions in battery prices
and flat unit demand for wireless handsets led to declines in MCG and ESG revenue
in 2002, but our global handset shipment forecast of 437 million in 2003, up 6%,
should help slow down the rate of revenue decline.
Long-Term Revenue Outlook Is Stable
In 2004, we forecast a 0.3% decline in IESS revenue, continuing modestimprovement from 2003 that will be driven by growth in next-generation handsets
and continued increased utilization of electronic systems by vehicle OEMs, offset by
price reductions. Longer term, we believe Motorola could post modest growth from
IESS based on continued market growth and utilization of electronic systems. From
2003 to 2008, we forecast 2.6% compound annual revenue growth.
Table 14: IESS Operating Forecast
$ in millions
Mar-02 Jun-02 Sep-02 Dec-02 Mar-03 Jun-03 Sep-03 Dec-03 Mar-04 Jun-04 Sep-04 Dec-04
Q1-02A Q2-02A Q3-02A Q4-02A Q1-03A Q2-03E Q3-03E Q4-03E Q1-04E Q2-04E Q3-04E Q4-04E
Total IESS Revenue 509 566 544 570 521 521 516 552 508 523 518 554
Q/Q growth (5.7)% 11.2% (3.9)% 4.8% (8.6)% 0.0% (1.0)% 7.0% (8.0)% 3.0% (1.0)% 7.0%
Y/Y growth (20.1)% 3.1% 6.0% 5.6% 2.4% (8.0)% (5.2)% (3.2)% (2.5)% 0.4% 0.4% 0.4%
IESS cost of sales and opex 485 535 516 538 498 490 486 513 482 492 488 515
Q/Q growth (14.5)% 10.3% (3.6)% 4.3% (7.4)% (1.7)% (0.8)% 5.6% (6.0)% 1.9% (0.8)% 5.6%
Y/Y growth (21.1)% (1.8)% (1.5)% (5.1)% 2.7% (8.5)% (5.8)% (4.6)% (3.1)% 0.4% 0.4% 0.4%
Total IESS operating income 24 31 28 32 23 31 30 39 25 31 30 39
Q/Q growth (188.9)% 29.2% (9.7)% 14.3% (28.1)% 35.9% (4.3)% 29.1% (34.3)% 23.6% (4.3)% 29.1%
Y/Y growth 9.1% 675.0% (354.5)% (218.5)% (4.2)% 0.8% 6.8% 20.7% 10.4% 0.4% 0.4% 0.4%
% margin 4.7% 5.5% 5.1% 5.6% 4.4% 6.0% 5.8% 7.0% 5.0% 6.0% 5.8% 7.0%
Total IESS orders 570 562 562 558 529
Q/Q growth 17.5% (1.4)% 0.0% (0.7)% (5.2)%
Y/Y growth 11.0% 2.0% 3.0% 15.0% (7.2)%
Book to bill in period 1.12 0.99 1.03 0.98 1.02
Source: Company reports and JPMorgan estimates.

8/8/2019 JP Init Coverage 2003
http://slidepdf.com/reader/full/jp-init-coverage-2003 27/44
Ehud A. Gelblum(1-212) [email protected]
North American Equity ResearchNew York10 July 2003
27
Cost-Cutting and Consolidating to Improve Profitability Picture
We are forecasting modest year-over-year margin improvement in 2003, as IESS
benefits from restructuring at its manufacturing and administrative facilities.
Motorola is in the process of moving its auto body production facility from Elma, New York, to Nogales, Mexico, and is consolidating its IESS and ACES
headquarters in Illinois. Motorola also outsourced its Tempe, Arizona, manufacturing
activity in 2002. These restructurings led to a 5% employee headcount reduction in
2002. Longer term, the company is targeting mid-teens operating margins from
IESS, but we believe a turnaround in revenue trends will be necessary first.
Valuation
Sales and EBITDA Multiples Suggest Upside
Motorola trades in line with its peers on 2004 P/E, but at a steep discount in terms of
firm value to revenue and firm value to EBITDA. Hence, we believe Motorola value
expansion is contingent on improving operating leverage and expanding margins. At
the current stock price of $10.25, Motorola trades at a revenue multiple of 1.0x and
an EBITDA multiple of 8.3x on our 2004 estimate of $3.1 billion, well below peers
such as Nokia (2.2x and 9.9x respectively), Ericsson (1.4x and 13.6x respectively),
Qualcomm (7.4x and 16.0x respectively), Nortel (1.3x and 11.2x respectively), and
Lucent (1.0x and 13.7x respectively). On an earnings basis, Motorola trades closer to
peers with a 2004 P/E of 24.5x versus Nokia at 18.4, Qualcomm at 22.2, and Nortel
at 26.3. On a leverage basis, at a 28% debt to capitalization ratio, Motorola is much
more levered than peers Nokia (2%) and Qualcomm (2%), but more in line with
peers Nortel (25%), Lucent (38%), and Ericsson (29%).
Table 15: Comparable Trading Multiples
JPM 7/9/03 Market Firm Debt / FV / Revenue FV / EBITDA P/ETicker Rating Price Cap ($MM) Value ($MM) Cap. 2003E 2004E 2003E 2004E 2003E 2004E
Motorola MOT N $10.25 23,832 25,911 28% 1.0x 1.0x 9.6x 8.3x 49.9x 24.5x
Qualcomm QCOM NR $39.10 30,866 26,833 2% 8.7x 7.4x 14.2x 16.0x 29.0x 22.2x
Nokia NOK OW $18.17 87,016 75,814 2% 2.3x 2.2x 10.5x 9.9x 21.1x 18.4x
Ericsson ERICY N $11.16 17,655 16,818 29% 1.3x 1.4x 50.8x 13.6x NA 42.9x
Nortel NT OW $3.22 13,962 13,712 25% 1.4x 1.3x 14.5x 11.2x 49.3x 26.3x
Lucent LU UW $1.98 7,811 10,375 38% 1.1x 1.0x 22.0x 13.7x NA NA
Ave of peers 19% 3.0x 2.6x 22.4x 12.9x 33.1x
Wtd ave of peers 10% 3.2x 2.9x 17.1x 11.9x 25.9x 20.1x
Source: JPMorgan estimates for Motorola, Nokia, Ericsson, Nortel, and Lucent; First Call consensus estimates for Qualcomm.
Note: JPMorgan ratings: OW = Overweight, N = Neutral, UW = Underweight. P/E averages exclude Ericsson and Lucent.
Strong Upside Potential if MOT Can Execute
Looking at three scenarios and applying Motorola’s current one-year forward
multiples to our 2005 estimates, we calculate that Motorola could trade at a wide
range of values next year. In general, however, the bias appears toward the upside. If
Motorola’s results for 2003 and 2004 lead us to maintain our current projection for
2005, the potential upside to Motorola’s current price ranges from 7-26%. If
Motorola’s 2004 results cause us to lower our 2005 projections 10%, and Motorola
continues to trade at the same multiples, the potential change in the stock could be

8/8/2019 JP Init Coverage 2003
http://slidepdf.com/reader/full/jp-init-coverage-2003 28/44
Ehud A. Gelblum(1-212) [email protected]
North American Equity ResearchNew York10 July 2003
28
-4-14%. However, if 2004 results cause us to raise our 2005 projections 10%, the
stock could see 18-39% appreciation, based solely on relative peer valuations.
Table 16: Potential Future Valuation$ in millions except per share data
JPM
-10% forecast +10%
2005E revenue 25,267 28,075 30,882
x 2004E multiple 1.0x 1.0x 1.0x
Implied firm value 24,501 27,223 29,945
Implied share price $9.78 $10.93 $12.08
Discount/(premium) to current price (4.5)% 6.6% 17.8%
2005E EBITDA 3,029 3,366 3,702
x 2004E multiple 8.3x 8.3x 8.3x
Implied firm value 25,051 27,834 30,618
Implied share price $10.02 $11.19 $12.36
Discount/(premium) to current price (2.3)% 9.1% 20.6%
2005E EPS $0.47 $0.53 $0.58
x 2004E multiple 24.5x 24.5x 24.5x
Implied share price $11.64 $12.93 $14.22
Discount/(premium) to current price 13.5% 26.1% 38.8%
Assumptions:
Current stock price (7/9/03) $10.25
2004E shares outstanding (millions) 2,377
2004E net debt 1,245
Source: JPMorgan estimates.

8/8/2019 JP Init Coverage 2003
http://slidepdf.com/reader/full/jp-init-coverage-2003 29/44
Ehud A. Gelblum(1-212) [email protected]
North American Equity ResearchNew York10 July 2003
29
Motorola Balance Sheet Status
Heavy Debt Burden
Motorola has $8.4 billion in debt outstanding, the largest in our coverage universe,
down from $9.3 billion after paying down the $825 million of PURS derivative
securities in February. Debt to total capital stands at 28% and net debt (net of $6.4B
in cash and short term investments) to total cap stands at 7%. With our assumptions
of EBITDA of $2.7 billion in 2003 and $3.1 billion in 2004, and average annual free
cash flow before charges of $1.4 billion over these years, we estimate Motorola
should reach a net cash positive position in Q1 2006.
Table 17: Annual Balance Sheet Forecast
$ in millions
2002A 2003E 2004E 2005E 2006E 2007E 2008E
Assets
Cash & ST investments 6,566 5,941 6,524 7,307 7,289 7,296 8,499
Accounts Receivable 4,437 4,495 4,564 4,828 5,100 5,359 5,636
Inventories 2,869 2,795 2,838 3,002 3,172 3,333 3,504
Other Current Assets 3,262 3,258 3,258 3,258 3,258 3,258 3,258
Total Current Assets 17,134 16,489 17,184 18,396 18,819 19,246 20,897
Net Property & Equipment 6,104 5,263 4,802 4 ,574 4,442 4,383 4 ,384
Long-term Investments 2,053 2,053 2,053 2,053 2,053 2,053 2,053
Other Assets 5,861 5,861 5,861 5,861 5,861 5,861 5,861
Total Assets 31,152 29,666 29,900 30,884 31,175 31,543 33,195
Liabilities
N.P. & Current Portion of LT Debt 1,629 940 820 1,820 1,920 945 420
Accounts Payable 2,268 2,174 2,207 2,335 2,467 2,592 2,726
Accrued Liabilities 5,913 5,885 5,975 6,321 6,677 7,016 7,377
Total Current Liabilities 9,810 8,999 9,002 10,476 11,064 10,553 10,523
Long-term Debt 7,189 6,864 6,464 5,064 3,564 3,039 3,039
Other LT Liabilities 2,429 2,354 2,390 2,528 2,671 2,806 2,951
Total Liabilities 19,428 18,217 17,856 18,068 17,299 16,399 16,513
MEDS 485 485 485 485 485 485 485
Stockholders’ Equity
Total Stockholders’ Equity 11,239 10,964 11,559 12,330 13,391 14,659 16,197
Total Liabilities & Stockholder Equity 31,152 29,666 29,900 30,884 31,175 31,543 33,195
Net debt 2,737 2,349 1,245 62 (1,320) (2,826) (4,555)
Source: Company reports and JPMorgan estimates.
Short-Term Liquidity in OK Shape
In the U.S., Motorola has a $700 million 364-day revolving credit facility (expiring
in May 2004) and a $900 million facility (expiring in May 2005). Motorola also has
$2 billion in foreign credit facilities in place, for a total of approximately $3.6 billion
in available credit, versus total short-term debt of $775 million as of 1Q 2003
See pages 36-37 for our quarterly balance sheetprojection.

8/8/2019 JP Init Coverage 2003
http://slidepdf.com/reader/full/jp-init-coverage-2003 30/44
Ehud A. Gelblum(1-212) [email protected]
North American Equity ResearchNew York10 July 2003
30
(including $496 million of commercial paper). If Motorola were to fall below
investment grade, the U.S. facilities would place liens on inventories and receivables.
The current debt ratings are “BBB” with a “negative outlook” by S&P, and “Baa2”
with a “negative outlook” by Moody’s. The numerous foreign facilities are generallyused to conduct normal business operations in Europe, Asia, and Latin America and
have various expirations.
Figure 3: LTM EBITDA, Cash, and Total Debt Forecast
$ in billions
2
3
4
5
6
7
8
9
10
2 0 0 2 A
2 0 0 3 E
2 0 0 4 E
2 0 0 5
E
2 0 0 6 E
2 0 0 7
E
2 0 0 8 E
LTM EBITDA Cash Total Debt
Source: Company reports and JPMorgan estimates.
Unfunded Pension Liability Expected to Grow
At the end of 2002, Motorola had underfunded pension obligations of nearly$2.1 billion. Given the performance of both the equity and debt markets so far this
year, we would expect this underfunded status to have decreased, although declining
prevailing discount rates would serve to counteract this effect. Motorola is required
to make a $50 million contribution to its pension fund in 2003, but the company had
announced plans make a $150-200 million contribution after not making a
contribution in 2002. Compared to other technology companies with pension plans,
such as Lucent and Nortel, Motorola maintains slightly more aggressive assumptions
for its return on pension and post-retirement assets, with an 8.5% rate of return and a
6.75% discount rate. We believe Motorola may need to lower its aggressive
assumptions to better align its plans with current market conditions. Doing this
would likely increase the underfunded status of its plans, necessitating further cash
contributions.

8/8/2019 JP Init Coverage 2003
http://slidepdf.com/reader/full/jp-init-coverage-2003 31/44
Ehud A. Gelblum(1-212) [email protected]
North American Equity ResearchNew York10 July 2003
31
Table 18: Pension and Post-Retirement Plan Assumptions and Status
$ in millions
2002 2001 2000
MOT NT LU MOT NT LU MOT NT LUPension plan
Long term rate of return 8.5% 7.8% 8.8% 9.0% 7.8% 9.0% 9.0% 8.1% 9.0%
Discount rate 6.8% 6.3% 6.5% 7.3% 6.7% 7.0% 7.5% 7.0% 7.5%
Rate of compensation increase 4.0% 3.7% 3.5% 4.0% 4.6% 4.5% 4.5% 4.8% 4.5%
Unfunded status (1,519) (1,787) (1,714) (447) (1,040) 5,495 213 496 19,149
Post-retirement plan
Long term rate of return 8.5% 8.0% 7.9% 9.0% 8.0% 9.0% 9.0% 8.0% 9.0%
Discount rate 6.8% 6.8% 6.5% 7.3% 7.0% 7.0% 7.5% 7.5% 7.5%
Unfunded status (553) (527) (7,401) (302) (488) (5,958) (222) (433) (3 ,685)
Source: Company reports.
Note: Motorola’s unfunded status includes both the regular and officer plans.
Outstanding Lawsuits Not a Major Issue
Motorola has $4.2 billion in lawsuits filed against it related to Iridium, toward which
the company has $175 million of reserves. We believe the company has made
substantial progress in resolving its outstanding Iridium dealings highlighted by the
March 6 settlement where Motorola resolved all outstanding claims with Chase for a
cash payment of $12 million. Likewise, we believe the final settlements concerning
the outstanding litigation could be settled for a fraction of their announced values.
Small Possibility for Cash from Other Commitments
Motorola has $2.5 billion in impaired finance receivables, of which the company has
reserved $2.2 billion for expected losses, leaving approximately $300 million inunreserved receivables. Of the $2.2 billion in reserves, $2.0 billion relate to loans it
made to Telsim, a mobile operator in Turkey. In 2002, Motorola wrote off the
$2.0 billion in loans in their entirety (likewise, Nokia wrote off €669 million in loans
it made to Telsim). While litigation continues, and we believe there is a good chance
of a favorable ruling for Motorola, it appears unlikely that Motorola will actually
collect on any portion of the loan in the near future (see status below).
Motorola has pared back its guarantees of third-party debt. At the end of 1Q 2003,
the company had $51 million in outstanding drawn commitments, with no undrawn
commitments remaining.
The Telsim Proceeding Looks Positive, But Cash Windfall Unlikely
United States proceedings: In January 2002, Motorola, together with Nokia, filedsuit against Telsim and the Uzan family in the U.S. District Court of Southern New
York for injunctive relief and damages. Motorola and Nokia alleged: (1) fraud and
conspiracy under Illinois laws, (2) computer hacking under federal laws, (3) violation
of Illinois trade secret laws, and (4) violation of federal RICO (Racketeer Influenced
and Corrupt Organizations Act) statutes. They called for a lien on Uzan family assets
and made claims on Uzan family real estate and bank accounts in New York. In May
2002, the court ordered a preliminary injunction under which the Uzan family was
ordered to deposit pledged stock to Motorola, adjusting for the dilutive impacts of a
stock issuance, which had reduced Motorola’s interest from 66% to 22%. Later in
May 2002, the Uzans’ request for a stay was rejected, and they were found in

8/8/2019 JP Init Coverage 2003
http://slidepdf.com/reader/full/jp-init-coverage-2003 32/44
Ehud A. Gelblum(1-212) [email protected]
North American Equity ResearchNew York10 July 2003
32
contempt of court for not complying with the court’s order. In February 2003, the
case was tried to conclusion; no verdict has yet been reached.
In March 2003, an Appellate Court upheld the preliminary injunction supporting theIllinois fraud allegations. It also found RICO allegations premature pending
determination that remedies offered no realistic chance of property recovery. The
Appellate Court remanded back to the District Court the Uzans’ assertion that Swiss
arbitration was the proper jurisdiction for Motorola’s claims.
United Kingdom proceedings: In January 2002, Motorola filed an injunction to
freeze $50 million in Uzan family assets in the United Kingdom and freeze
$200 million in assets worldwide. The Uzans were ordered to disclose assets, but the
disclosures were deemed inadequate. Subsequently, the Uzans did not appear for
cross-examination and were found in contempt of court. They were ordered
imprisoned for a period up to 15 months. The Uzans later appealed this ruling and the
freezing of assets.
On June 12, 2003, the Court of Appeal of England and Wales dismissed a number of
appeals by the Uzans, upholding the Worldwide Freezing Orders. The Court’s
decision assured that $800 million of Uzan assets be preserved pending the
enforcement of the judgment by the District Court for the Southern District of New
York regarding the fraud claim against the Uzans. The Court also affirmed that the
sentences of incarceration for Cem Uzan and Aysegul Akay remain in place.
Switzerland proceedings: In February 2003, the Uzans filed for arbitration against
Motorola in the Zurich Chamber of Commerce. The Uzans acknowledged their debt
but claimed the Turkish economy prevented them from repaying loans. The Uzans
asked for a new repayment schedule. This arbitration is still proceeding. In June
2003, the Uzans filed another arbitration against Motorola. They have claimed
damages of $280.5 million for defective equipment. Hearings are scheduled for
November 2003 and January 2004.
Motorola Cash Flow
Generating Strong Cash Flow
In our view, Motorola should be able to significantly improve its liquidity and
leverage positions in the coming years. However, the company’s current large debt
load and declining credit ratings remain a concern. We expect Motorola to end 2003
with $5.9 billion in cash and short-term investments, down from $6.6 billion at the
end of 2002. The moderate decline in Motorola’s cash balance between 2002 and
2003 is driven by our expectation of $2.7 billion in EBITDA, $325 million in proceeds from the sale of Nextel shares (recognized in 1Q), $793 million in capital
expenditure (in line with company guidance), $904 million in maturites
($825 million having been paid already in 1Q with the redemption of the
$825 million of PURS), $700 million in restructuring charges, and a $180 million
contribution to the underfunded pension fund.
Cash Flow Could Drive Leverage Improvements
Beyond 2003, we expect annual improvement in the company’s cash balances to
$6.5 billion in 2004 and $7.3 billion in 2005, driven by $3.2 billion in annual
EBITDA and $1.5 billion in annual free cash flow. Our forecast assumes that
See page 38 for our quarterly
cash flow forecast.

8/8/2019 JP Init Coverage 2003
http://slidepdf.com/reader/full/jp-init-coverage-2003 33/44

8/8/2019 JP Init Coverage 2003
http://slidepdf.com/reader/full/jp-init-coverage-2003 34/44

8/8/2019 JP Init Coverage 2003
http://slidepdf.com/reader/full/jp-init-coverage-2003 35/44

8/8/2019 JP Init Coverage 2003
http://slidepdf.com/reader/full/jp-init-coverage-2003 36/44

8/8/2019 JP Init Coverage 2003
http://slidepdf.com/reader/full/jp-init-coverage-2003 37/44
Ehud A. Gelblum(1-212) [email protected]
North American Equity ResearchNew York10 July 2003
Table 21: Balance Sheet Forecast (Cont’d)
$ in millions, except per share data
Mar-01 Jun-01 Sep-01 Dec-01 Mar-02 Jun-02 Sep-02 Dec-02 Mar-03 Jun-03 Sep-03 Dec-03 Mar-04 Ju
Q1-01A Q2-01A Q3-01A Q4-01A Q1-02A Q2-02A Q3-02A Q4-02A Q1-03A Q2-03E Q3-03E Q4-03E Q1-04E Q2
Ratio AnalysisCash per share $2.00 $2.16 $2.55 $2.75 $2.66 $2.85 $2.76 $2.83 $2.74 $2.46 $2.52 $2.52 $2.85 $
Net cash per share ($3.51) ($2.96) ($1.88) ($1.59) ($1.56) ($1 .29) ($1 .31) ($1 .18) ($0 .89) ($1 .12) ($1 .01) ($1 .00) ($0.66) ($0
Quick Ratio 0.74 0.75 0.95 1.11 1.05 1.09 1.10 1.12 1.21 1.20 1.17 1.16 1.24
Current Ratio 1.37 1.51 1.67 1.77 1.70 1.69 1.74 1.75 1.92 1.94 1.87 1.83 1.90
Book Value Per Share $7.59 $7.62 $6.44 $6.12 $5.78 $4.85 $4.90 $4.84 $4.89 $4.94 $4.80 $4.66 $4.81 $
Return on Equity 6.9% 3.0% (1.6)% (4.8)% (4.8)% (3.2)% (0.9)% 2.4% 4.3% 3.9% 3.8% 4.3% 5.1% 6
Return on Assets 3.1% 1.3% (0.7)% (2.0)% (2.0)% (1.3)% (0.4)% 0.9% 1.6% 1.5% 1.5% 1.6% 2.0% 2
Fixed Asset Turnover 3.17 3.33 3.32 3.36 3.44 4.12 4.23 4.47 4.72 4.71 4.83 4.88 5.05
Debt/Total Capital 30.6% 29.1% 28.6% 29.1% 30.0% 31.3% 31.1% 29.9% 28.2% 29.2% 28.6% 27.9% 28.4% 27
Net Debt/Net Debt + Equity 30.2% 26.5% 20.5% 18.4% 18.9% 18.2% 18.3% 16.7% 12.3% 15.6% 14.4% 14.5% 8.6% 9
Total Debt/EBITDA 2.6 3.1 3.9 5.2 5.2 4.3 3.8 3.2 2.7 2.9 3.0 3.1 3.0
Equity Leverage 2.37 2.31 2.40 2.44 2.44 2.73 2.67 2.77 2.63 2.48 2.58 2.71 2.57
DSO’s 67 60 63 55 60 55 57 52 57 55 55 55 55
DPO’s 48 46 46 41 46 44 51 40 49 40 40 40 40
Inventory Turns 4.89 5.68 6.60 7.69 6.83 7.46 5.84 7.18 5.68 6.30 6.30 7.00 7.00
Source: Company reports and JPMorgan estimates.
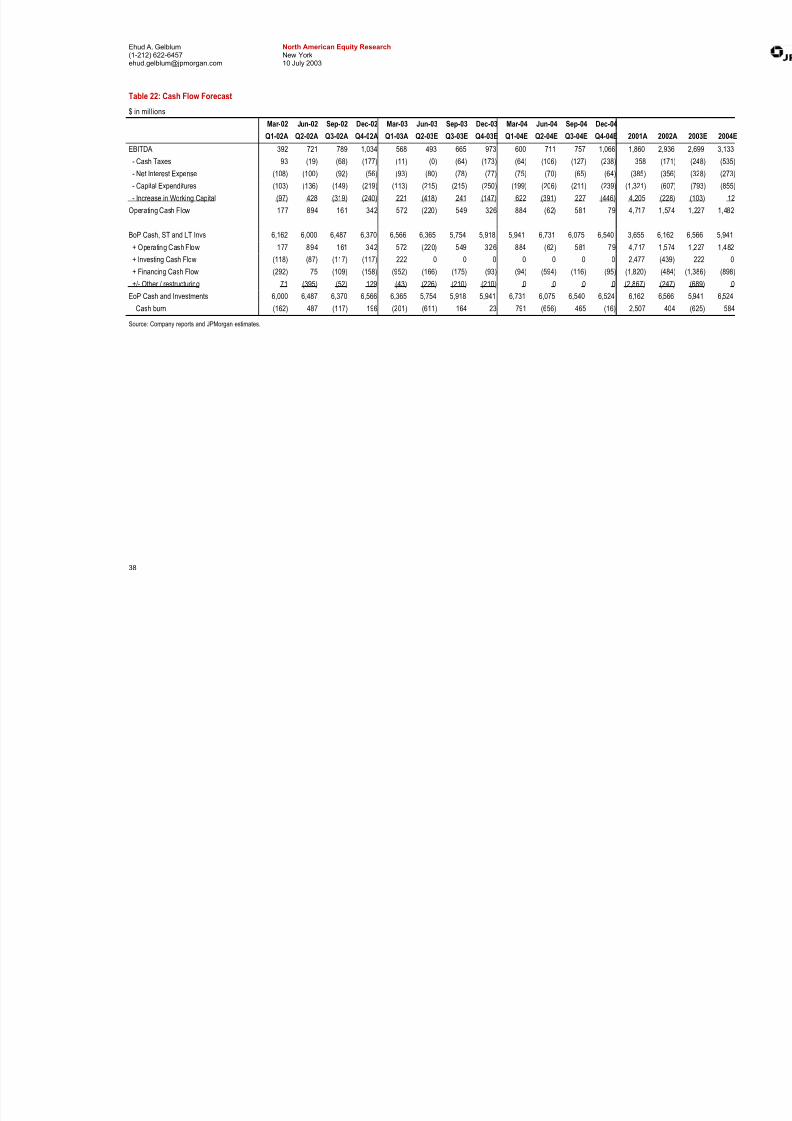
8/8/2019 JP Init Coverage 2003
http://slidepdf.com/reader/full/jp-init-coverage-2003 38/44
Ehud A. Gelblum(1-212) [email protected]
North American Equity ResearchNew York10 July 2003
38
Table 22: Cash Flow Forecast
$ in millions
Mar-02 Jun-02 Sep-02 Dec-02 Mar-03 Jun-03 Sep-03 Dec-03 Mar-04 Jun-04 Sep-04 Dec-04
Q1-02A Q2-02A Q3-02A Q4-02A Q1-03A Q2-03E Q3-03E Q4-03E Q1-04E Q2-04E Q3-04E Q4-04E 2001A 20
EBITDA 392 721 789 1,034 568 493 665 973 600 711 757 1,066 1,860 2- Cash Taxes 93 (19) (68) (177) (11) (0) (64) (173) (64) (106) (127) (238) 358 (
- Net Interest Expense (108) (100) (92) (56) (93) (80) (78) (77) (75) (70) (65) (64) (385) (
- Capital Expenditures (103) (136) (149) (219) (113) (215) (215) (250) (199) (206) (211) (239) (1,321) (
- Increase in Working Capital (97) 428 (319) (240) 221 (418) 241 (147) 622 (391) 227 (446) 4,205 (
Operating Cash Flow 177 894 161 342 572 (220) 549 326 884 (62) 581 79 4,717 1
BoP Cash, ST and LT Invs 6,162 6,000 6,487 6,370 6,566 6,365 5,754 5,918 5,941 6,731 6,075 6,540 3,655 6
+ Operating Cash Flow 177 894 161 342 572 (220) 549 326 884 (62) 581 79 4,717 1
+ Investing Cash Flow (118) (87) (117) (117) 222 0 0 0 0 0 0 0 2,477 (
+ Financing Cash Flow (292) 75 (109) (158) (952) (166) (175) (93) (94) (594) (116) (95) (1,820) (
+/- Other / restructuring 71 (395) (52) 129 (43) (226) (210) (210) 0 0 0 0 (2,867) (
EoP Cash and Investments 6,000 6,487 6,370 6,566 6,365 5,754 5,918 5,941 6,731 6,075 6,540 6,524 6,162 6
Cash burn (162) 487 (117) 196 (201) (611) 164 23 791 (656) 465 (16) 2,507
Source: Company reports and JPMorgan estimates.

8/8/2019 JP Init Coverage 2003
http://slidepdf.com/reader/full/jp-init-coverage-2003 39/44
Ehud A. Gelblum(1-212) [email protected]
North American Equity ResearchNew York10 July 2003
Appendix
Table 23: Motorola Semiconductor Facilities and Assembly Sites
Location Name Major Processes Products Wafer size Min. FeaturesProduction facilities
Tempe, Arizona CS-1 Gallium Arsenide RF ICs, MMICs, RF Power Modules,Digital ICs
150mm to 0.35 micron
Austin, Texas MOS 11 SRAM, CDR1,2, CDR RF BiCMOS, SiGe:C,SMOS7
SRAM, Logic, CDR RF BiCMOS 200mm 0.35-0.32 micron
Austin, Texas MOS 13 HCMOS 2-6 Layer Metal, HiP1-4, HiP5-7 RISC PowerPC, Hi-end MPU, Wireless 200mm 0.35-0.13 micron
Chandler, Arizona MOS 12 HCMOS; DLM, TLM, QLM; Flash, EEPROM,HiP,SMOS7, CRD3NVM
MCU, DSP, MOS Digital/Analog andIMOS for auto, comm. applications
200mm 0.27-0.25 micron; qual. In
Sendai, Japan TSC-6 Silicon Gate HCMOS, Multilayer Metal & Silicide, 0.5micron SGF, Sensors
ASIC, MCU, MPU, MOS Digital/analog 150mm 0.65 micron
Tianjin, China MOS 17 CDR2, SMOS7 Wireless 200mm TBD
East Kilbride, Scotland MOS 9 HCMOS with embedded non-volatile memory,SMOS5, SMOS5HVP, LDMOS and RFBiCMOS
MCU 150mm 0.55 micron
Toulouse, France MOS 20 SMOS 2.5, 3, 5, HDTMOS Automotive, Wireless, Industrial 150mm 1.4 micron
Location Name Major Processes Products Assembly packages Test platforms
High volume facilities
Tianjin, China BAT3 High Volume Assembly & Final Test Wireless, Automotive MAPBGA, SOIC,PDIP, QFN
Digital & Mixed Signal
Kuala Lumpur, Malaysia KLM High Volume Assembly & Final Test Automotive, Communication BGA, PLCC, QFP,RF, Flip Chip
Digital, Mixed Signal & Me
Source: Company reports.

8/8/2019 JP Init Coverage 2003
http://slidepdf.com/reader/full/jp-init-coverage-2003 40/44
Ehud A. Gelblum(1-212) [email protected]
North American Equity ResearchNew York10 July 2003
40
Management
Christopher B. Galvin, Chairman and Chief Executive OfficerChristopher B. Galvin, the grandson of Motorola founder Paul V. Galvin, has worked
at the company in various capacities for more than 30 years. He was elected
president and chief operating officer in December 1993, chief executive officer in
January 1997, and chairman of the board in June 1999.
Mike S. Zafirovski, President and Chief Operating Officer
Mike Zafirovski joined Motorola is 2000 as head of the PCS division. Prior to
joining Motorola, he worked at GE for 24 years. He was promoted to president and
chief operating officer in 2002, replacing Ed Breen who left to become chairman and
CEO of Tyco.
David W. Devonshire, Executive Vice President and Chief Financial Officer
David W. Devonshire joined Motorola as CFO in April 2002. Prior to joining
Motorola, he served as executive vice president and CFO of Ingersoll-Rand for five
years.
Table 24: Security Ownership of Management
shares in millions
Shares % of shares
Name Position owned outstanding
Christopher B. Galvin Chairman & CEO 18.097 0.78%
Mike S. Zafirovski President & COO 1.692 0.07%
David W. Devonshire Executive Vice President & CFO 0.12 0.01%
Source: Company reports.

8/8/2019 JP Init Coverage 2003
http://slidepdf.com/reader/full/jp-init-coverage-2003 41/44
Ehud A. Gelblum(1-212) [email protected]
North American Equity ResearchNew York10 July 2003
41

8/8/2019 JP Init Coverage 2003
http://slidepdf.com/reader/full/jp-init-coverage-2003 42/44
Ehud A. Gelblum(1-212) [email protected]
North American Equity ResearchNew York10 July 2003
42

8/8/2019 JP Init Coverage 2003
http://slidepdf.com/reader/full/jp-init-coverage-2003 43/44
Ehud A. Gelblum(1-212) [email protected]
North American Equity ResearchNew York10 July 2003
43
JPMorgan Equity Research Ratings DistributionOverweight Neutral Underweight
JPM Global
Equity ResearchCoverage
34% 41% 25%
IB clients* 26% 24% 22% Technology - N.America & Latin
22% 49% 29%
IB clients* 13% 18% 13% *Percentage of investment banking clients in each rating category.
For purposes of NASD/NYSE ratings distribution disclosure rules, our Overweight rating most closely corresponds to a buy rating; our
Neutral rating most closely corresponds to a hold rating; and our Underweight rating most closely corresponds to a sell rating.
Analyst Certification
The research analyst who is primarily responsible for this research and whose name
is listed first on the front cover certifies (or in a case where multiple analysts are
primarily responsible for this research, the analyst named first in each group on thefront cover or named within the document individually certifies, with respect to each
security or issuer that the analyst covered in this research) that: (1) all of the views
expressed in this research accurately reflect his or her personal views about any and
all of the subject securities or issuers; and (2) no part of any of the research analyst's
compensation was, is, or will be directly or indirectly related to the specific
recommendations or views expressed by the research analyst in this research.
Legal Disclosures
• Market Maker: JPMSI or its affiliates make a market in the stock of
Charter Communications, Inc., Comcast Corp, Insight Communications
Corp. and Mediacom Communications Corporation.• Lead or Co-manager: JPMSI and/or its affiliates acted as lead or co-
manager in a public offering of equity and/or debt securities for Cablevision
Systems Corp., Comcast Corp and Cox Communications within the past 12
months.
• Investment Banking (past 12 months): JPMSI and/or its affiliates received in
the past 12 months compensation for investment banking services from
Comcast Corp and Cox Communications.
• Investment Banking (next 3 months): JPMSI and/or its affiliates expect to
receive, or intend to seek compensation for investment banking in the next
three months from Cablevision Systems Corp., Comcast Corp and Cox
Communications.

8/8/2019 JP Init Coverage 2003
http://slidepdf.com/reader/full/jp-init-coverage-2003 44/44
Ehud A. Gelblum(1-212) [email protected]
North American Equity ResearchNew York10 July 2003
Copyright 2003 J.P. Morgan Chase & Co.—All rights reserved. Additional information available upon request.Legal Entities: JPMorgan is the marketing name used on global equity research issued by J.P. Morgan Securities Inc. (JPMSI) and/or its affiliatesworldwide. JPMSI is a member of NYSE, NASD and SIPC. The analysts who write global equity research are employees of JPMSI or its affiliatedcompanies worldwide, including the following companies. J.P. Morgan Securities Ltd. (JPMSL), J.P. Morgan plc (JPM) and J.P. Morgan Europe Limitedare authorised by the FSA. JPMSL is a member of the LSE. J.P. Morgan Equities Limited is a member of the Johannesburg Securities Exchange and isregulated by the FSB. J.P. Morgan Securities Asia Private Limited is regulated by the Monetary Authority of Singapore (MAS) and the Japan FinancialServices Agency (FSA). J.P. Morgan Securities (Asia Pacific) Limited (CE number AAJ321) and J.P. Morgan Securities (Far East) Limited (CE number AAB026) are regulated by the HKMA and the SFC in Hong Kong respectively. J.P. Morgan Securities Singapore Private Limited is a member of Singapore Exchange Securities Trading Limited and is regulated by the MAS. J.P. Morgan Malaysia Sdn. Bhd. (18146-X) is licensed as an investmentadvisor by the Securities Commission in Malaysia. J.P. Morgan Australia Limited (ABN 52 002 888 011) and J.P. Morgan Securities Australia Limited(ABN 61 003 245 234, a Participating Organisation with the ASX) are licensed securities dealers. J.P. Morgan Securities New Zealand Limited is amember of the New Zealand Stock Exchange. J.P. Morgan Securities (Taiwan) Limited is a participant of the Taiwan Stock Exchange (company-type) andregulated by the Taiwan Securities and Futures Commission. J.P. Morgan India Private Limited is a member of the National Stock Exchange of the IndiaLimited and The Stock Exchange, Mumbai and is regulated by the Securities and Exchange Board of India. J.P. Morgan Securities (Thailand) Limited is amember of the Stock Exchange of Thailand and is regulated by the Ministry of Finance and the Securities and Exchange Commission PT. J.P. MorganSecurities Indonesia is a member of the Jakarta Stock Exchange and Surabaya Stock Exchange and is regulated by the BAPEPAM. This report is
distributed in the Philippines by J.P. Morgan Securities Philippines, Inc.General: Information has been obtained from sources believed to be reliable but J.P. Morgan Chase & Co. or its affiliates and/or subsidiaries (collectivelyJPMorgan) do not warrant its completeness or accuracy except with respect to any disclosures relative to JPMSI and/or its affiliates and the analyst’sinvolvement with the issuer. Opinions and estimates constitute our judgement as of the date of this material and are subject to change without notice. Past
performance is not indicative of future results. This material is not intended as an offer or solicitation for the purchase or sale of any financial instrument.Securities, financial instruments or strategies mentioned herein may not be suitable for all investors. The opinions and recommendations herein do not takeinto account individual client circumstances, objectives, or needs and are not intended as recommendations of particular securities, financial instruments or strategies to particular clients. The recipient of this report must make its own independent decisions regarding any securities or financial instrumentsmentioned herein. JPMSI distributes in the U.S. research published by non-U.S. affiliates and accepts responsibility for its contents. Clients should contactanalysts and execute transactions through a JPMorgan subsidiary or affiliate in their home jurisdiction unless governing law permits otherwise.
Compendium reports (U.S.): Price charts are available for all companies under coverage by JPMSI for at least one year through the search function onJPMorgan's website http://mm.jpmorgan.com and accessible to JPMorgan's clients via password, or by calling MorganMarkets toll free number (1-800-477-0406).
Analysts’ Compensation: The equity research analysts responsible for the preparation of this report receive compensation based upon various factors,including the quality and accuracy of research, client feedback, competitive factors, and overall firm revenues. The firm's overall revenues includerevenues from, among other business units, Institutional Equities and Investment Banking.
Explanation of Ratings: JPMorgan uses the following rating system: Overweight [Over the next six to twelve months, we expect this stock willoutperform the average total return of the stocks in the analyst's (or the analyst's team's) coverage universe.] Neutral [Over the next six to twelve months,we expect this stock will perform in line with the average total return of the stocks in the analyst's (or the analyst's team's) coverage universe.]Underweight [Over the next six to twelve months, we expect this stock will under-perform the average total return of the stocks in the analyst's (or theanalyst's team's) coverage universe.]
Prior to September 25, 2002, our rating system was: Buy--we expect the stock to outperform the market by a minimum of 5% within an investmenthorizon of one year. Long-Term Buy--we believe the stock will outperform the market over the long run, but we lack the visibility of a catalyst for outperformance within a one- year investment horizon; Market Performer --the stock is expected to perform in line with the market; MarketUnderperformer--we expect the stock to underperform the market by a minimum of 5% within an investment horizon of one year.
U.K. and European Economic Area: Issued and approved for distribution in the U.K. and the European Economic Area (“EEA”) by JPMSL, JPM andJPMEL. All research issued to private clients in the U.K. is subject to the following: the investments and strategies discussed here may not be suitable for all investors; if you have any doubts you should consult your investment advisor. The investments discussed may fluctuate in price or value. Investorsmay get back less than they invested. Changes in rates of exchange may have an adverse effect on the value of investments.
Revised May 31, 2003
This material is distributed in Japan by J.P. Morgan Securities Asia Pte LimitedThis material is issued and distributed in Singapore by J.P. Morgan Securities Singapore Private Limited
[MITA (P) No. 213/05/2003]
This material is issued and distributed in Malaysia by J.P. Morgan Malaysia Sdn. Bhd. (18146-X)