
Journal of Volcanology and Geothermal Research - FCULwebpages.fc.ul.pt/~ecfont/publications/Dedzo et...
20
Magnetic fabrics of the Miocene ignimbrites from West-Cameroon: Implications for pyroclastic flow source and sedimentation M. Gountié Dedzo a, ⁎, A. Nédélec b , A. Nono a , T. Njanko a , E. Font c , P. Kamgang d , E. Njonfang e , P. Launeau f a LGE, Department of Earth Sciences, University of Dschang, B.P. 67 Dschang, Cameroon b UMR5563-LMTG-OMP, University of Toulouse-CNRS-IRD, 14 Av. Edouard-Belin, 31400 Toulouse, France c IDL-FUL, Instituto Dom Luis. Universidade de Lisboa, 1749-016 Lisboa, Portugal d Department of Earth Sciences, University of Yaoundé I, B.P. 812 Yaoundé, Cameroon e Laboratoire de Géologie, Ecole Normale Supérieure, Université de Yaoundé I, B.P. 47, Yaoundé, Cameroon f UMR-CNRS 6112, Laboratoire de Planétologie et Géodynamique, Université de Nantes, rue de la Houssinière, 44322 Nantes, France abstract article info Article history: Received 24 September 2010 Accepted 18 April 2011 Available online 5 May 2011 Keywords: AMS magnetic mineralogy Miocene ignimbrite caldera Western-Cameroon The Miocene ignimbrites of Mounts Bambouto and Bamenda located in the central part of Cameroon Volcanic Line are generally made of welded and non-welded massive lapilli tuff and lithic breccias. These discontinuous deposits cover a total area of 180 km 2 with thickness ranging from 25 to 200 m. The different facies contain several lithic fragments of mainly trachytic nature. The devitrified matrix of the welded ignimbrites is constituted by sanidine, anorthoclase, quartz, plagioclase, clinopyroxene, biotite, Fe–Ti oxides and devitrified fiammes. Anisotropy of magnetic susceptibility (AMS) is used to characterize magnetic fabrics and to provide an estimate of flow direction of each ignimbrite sheet. Magnetic mineralogy results from different flow units show that titanomagnetite, titanohematite, maghemite and goethite with grain size ranging from coarse MD to very fine SP are the main magnetic carriers of these ignimbrites. Inferred transport directions based on the AMS data and field indicators show that Bambouto caldera is the source of main pyroclastic deposits of Mount Bambouto. In southwestern Mount Bamenda, Santa-Mbu caldera or Bambouto caldera constituted the probable emission center of Mbengwi, Bamenda and Mbu ignimbrite sheets, whereas magnetic fabrics of Bambili, Sabga and Big Babanki ignimbrites demonstrate that these deposits were emitted from a northeastern source, namely Oku vent in Mount Oku. A small number of subvertical AMS fabrics correspond to rocks possibly modified by an elutriation process. © 2011 Elsevier B.V. All rights reserved. 1. Introduction The Cameroon Volcanic Line (CVL), a 1600 km long mega-shear zone in central Africa, shows a characteristic alignment of volcanoes, anorogenic complexes and grabens. This chain of Tertiary to recent generally alkaline volcanoes extends over more than 900 km across Cameroon from the Bui and Adamawa plateaux in the north to Mt Cameroon and Equatorial Guinea southwestwards (in the gulf of Guinea, Fig. 1a, b). These volcanoes are separated by plains, low areas corresponding to collapsed grabens, namely: Tombel, Mbo and Noun (Fitton, 1987; Deruelle et al., 1991, 2007; Nkouathio et al., 2002, 2008; Itiga et al., 2004; Fosso et al., 2005). It continues seawards for a further 700 km through the Atlantic Islands of Bioko, Principe, São Tomé and Pagalu. The volcanism along the CVL begun during the Eocene with the emplacement of the Bamoun plateau between 51.8 and 46.7 Ma (Moundi et al., 2007) and Mount Bangou between 44.7 and 43.1 Ma (Fosso et al., 2005), and is still active at Mount Cameroon (1999 and 2000 eruption). Most of the CVL volcanics are made up of mafic and felsic lavas. Ignimbritic flow deposits are scarce and mainly observed in the central part of the CVL, especially in Mounts Bambouto and Bamenda (Fig. 1c). Other small flow deposits are present in Nkogam massif and in Mount Oku. Pyroclastic flow deposits, ranging from non-welded to welded ignimbrites, form an important component of rock formations in the studied massifs of Mounts Bambouto and Bamenda. Some of our understanding of pyroclastic flow behavior has been gained by observations of recent pyroclastic eruptions; e.g. (i) 1998 and 2003 Soufriere Hills volcano eruptions in the Carrribean (Hart et al., 2004; Edmonds et al., 2006), (ii) 2006 and 2007 eruptions of Mt Etna in Italy (Behncke et al., 2008; Behncke, 2009) (iii) 2006 pyroclastic flows on Mt Merapi in Java, Indonesia (Charbonnier and Gertisser, 2008). On the other hand, most of our understanding of the mechanisms and flow dynamics of pyroclastic density currents comes from examination of the deposits they left behind. Detailed examination of the facies architecture Journal of Volcanology and Geothermal Research 203 (2011) 113–132 ⁎ Corresponding author. Tel.: + 237 75 08 85 86. E-mail address: [email protected] (M. Gountié Dedzo). 0377-0273/$ – see front matter © 2011 Elsevier B.V. All rights reserved. doi:10.1016/j.jvolgeores.2011.04.012 Contents lists available at ScienceDirect Journal of Volcanology and Geothermal Research journal homepage: www.elsevier.com/locate/jvolgeores
Transcript of Journal of Volcanology and Geothermal Research - FCULwebpages.fc.ul.pt/~ecfont/publications/Dedzo et...

Journal of Volcanology and Geothermal Research 203 (2011) 113–132
Contents lists available at ScienceDirect
Journal of Volcanology and Geothermal Research
j ourna l homepage: www.e lsev ie r.com/ locate / jvo lgeores
Magnetic fabrics of the Miocene ignimbrites from West-Cameroon: Implications forpyroclastic flow source and sedimentation
M. Gountié Dedzo a,⁎, A. Nédélec b, A. Nono a, T. Njanko a, E. Font c, P. Kamgang d, E. Njonfang e, P. Launeau f
a LGE, Department of Earth Sciences, University of Dschang, B.P. 67 Dschang, Cameroonb UMR5563-LMTG-OMP, University of Toulouse-CNRS-IRD, 14 Av. Edouard-Belin, 31400 Toulouse, Francec IDL-FUL, Instituto Dom Luis. Universidade de Lisboa, 1749-016 Lisboa, Portugald Department of Earth Sciences, University of Yaoundé I, B.P. 812 Yaoundé, Cameroone Laboratoire de Géologie, Ecole Normale Supérieure, Université de Yaoundé I, B.P. 47, Yaoundé, Cameroonf UMR-CNRS 6112, Laboratoire de Planétologie et Géodynamique, Université de Nantes, rue de la Houssinière, 44322 Nantes, France
⁎ Corresponding author. Tel.: +237 75 08 85 86.E-mail address: [email protected] (M. Gountié
0377-0273/$ – see front matter © 2011 Elsevier B.V. Aldoi:10.1016/j.jvolgeores.2011.04.012
a b s t r a c t
a r t i c l e i n f oArticle history:Received 24 September 2010Accepted 18 April 2011Available online 5 May 2011
Keywords:AMSmagnetic mineralogyMiocene ignimbritecalderaWestern-Cameroon
The Miocene ignimbrites of Mounts Bambouto and Bamenda located in the central part of Cameroon VolcanicLine are generally made of welded and non-weldedmassive lapilli tuff and lithic breccias. These discontinuousdeposits cover a total area of 180 km2 with thickness ranging from 25 to 200 m. The different facies containseveral lithic fragments of mainly trachytic nature. The devitrified matrix of the welded ignimbrites isconstituted by sanidine, anorthoclase, quartz, plagioclase, clinopyroxene, biotite, Fe–Ti oxides and devitrifiedfiammes. Anisotropy of magnetic susceptibility (AMS) is used to characterize magnetic fabrics and to providean estimate of flow direction of each ignimbrite sheet. Magnetic mineralogy results from different flow unitsshow that titanomagnetite, titanohematite, maghemite and goethite with grain size ranging from coarse MDto very fine SP are the main magnetic carriers of these ignimbrites. Inferred transport directions based on theAMS data and field indicators show that Bambouto caldera is the source of main pyroclastic deposits of MountBambouto. In southwestern Mount Bamenda, Santa-Mbu caldera or Bambouto caldera constituted theprobable emission center of Mbengwi, Bamenda and Mbu ignimbrite sheets, whereas magnetic fabrics ofBambili, Sabga and Big Babanki ignimbrites demonstrate that these deposits were emitted from anortheastern source, namely Oku vent in Mount Oku. A small number of subvertical AMS fabrics correspondto rocks possibly modified by an elutriation process.
Dedzo).
l rights reserved.
© 2011 Elsevier B.V. All rights reserved.
1. Introduction
The Cameroon Volcanic Line (CVL), a 1600 km long mega-shearzone in central Africa, shows a characteristic alignment of volcanoes,anorogenic complexes and grabens. This chain of Tertiary to recentgenerally alkaline volcanoes extends over more than 900 km acrossCameroon from the Bui and Adamawa plateaux in the north to MtCameroon and Equatorial Guinea southwestwards (in the gulf ofGuinea, Fig. 1a, b). These volcanoes are separated by plains, low areascorresponding to collapsed grabens, namely: Tombel, Mbo and Noun(Fitton, 1987; Deruelle et al., 1991, 2007; Nkouathio et al., 2002, 2008;Itiga et al., 2004; Fosso et al., 2005). It continues seawards for a further700 km through the Atlantic Islands of Bioko, Principe, São Tomé andPagalu.
The volcanism along the CVL begun during the Eocene with theemplacement of the Bamoun plateau between 51.8 and 46.7 Ma
(Moundi et al., 2007) and Mount Bangou between 44.7 and 43.1 Ma(Fosso et al., 2005), and is still active at Mount Cameroon (1999 and2000 eruption).
Most of the CVL volcanics are made up of mafic and felsic lavas.Ignimbritic flow deposits are scarce and mainly observed in thecentral part of the CVL, especially in Mounts Bambouto and Bamenda(Fig. 1c). Other small flow deposits are present in Nkogammassif andin Mount Oku. Pyroclastic flow deposits, ranging from non-welded towelded ignimbrites, form an important component of rock formationsin the studied massifs of Mounts Bambouto and Bamenda.
Some of our understanding of pyroclastic flow behavior has beengained by observations of recent pyroclastic eruptions; e.g. (i) 1998 and2003 Soufriere Hills volcano eruptions in the Carrribean (Hart et al.,2004; Edmonds et al., 2006), (ii) 2006 and 2007 eruptions of Mt Etna inItaly (Behncke et al., 2008; Behncke, 2009) (iii) 2006 pyroclastic flowson Mt Merapi in Java, Indonesia (Charbonnier and Gertisser, 2008). Onthe other hand, most of our understanding of themechanisms and flowdynamics of pyroclastic density currents comes fromexamination of thedeposits they left behind.Detailedexaminationof the facies architecture

Fig. 1. a) Location map of the Cameroon Volcanic Line (CVL); the main geologic features of Africa are indicated. b) The main volcanic centers of the Cameroon Volcanic Line. CentralCameroon Shear Zone according to Ngako et al. (2006); fracture zones following Lee et al. (1994) and Ballentine et al. (1997). c) Digital elevation model (DEM) of Mounts Bamboutoand Bamenda and the close surroundings; the different calderas are also indicated.
114 M. Gountié Dedzo et al. / Journal of Volcanology and Geothermal Research 203 (2011) 113–132
and particle fabric of pyroclastic flow deposits gives insight into theirtransport and deposition. Determination of flow directions in ignim-brites is often uneasy. In some cases, flow directions have beensuccessfully determined from textural indicators. These include theuse of imbricated logs (Froggatt et al., 1981), as well as orientation ofglass shards, crystals, pumice, and lithic fragments (Elston and Smith,1970; Suzuki and Ui, 1982, 1983, 1988; Potter and Oberthal, 1987; Ui etal., 1989; Buesch, 1992; Seaman and Williams, 1992). Imbrication ofpumice and other features indicate not only the flow direction but alsothe sense of motion (Kamata and Mimura, 1983; Suzuki and Ui, 1988).These methods, however, are time consuming and the features arecommonly absent in specific outcrops.
Anisotropy of magnetic susceptibility (AMS)measurements can beused for determining lineations and foliations in ignimbrites. Thismethod detects the alignment of magnetic minerals in the ignimbrite,and has been used in many studies to evaluate flow directions inpyroclastic deposits in order to determine vent location or, morerecently, to provide information about transport and depositionalprocess involved at different distances from the vent (Ellwood, 1982;Incoronato et al., 1983; Knight et al., 1986; Wolff et al., 1989;McDonald and Palmer, 1990; Hillhouse andWells, 1991; Palmer, et al.,1991; Fisher et al., 1993; Ort, 1993; Bear et al., 1997; Cagnoli andTarling, 1997; Le Pennec et al., 1998; MacDonald et al., 1998; Ort et al.,1999, 2003; Palmer and MacDonald, 1999; Le Pennec, 2000; Wang

115M. Gountié Dedzo et al. / Journal of Volcanology and Geothermal Research 203 (2011) 113–132
et al., 2001; Porreca et al., 2003; Alva-Valdivia et al., 2005; Giordanoet al., 2008; Petronis and Geissman, 2008).
1.1. Aim of study
Determination of flow directions in ignimbrites of Bambouto andBamenda massifs is difficult, because the fabric in these deposits isvisually nearly isotropic in most outcrops. In addition, the discontinuity
Fig. 2. Geologic sketch maps of a) Mounts Bambouto and b) Bamend
of outcrops due to their general re-covering by more recent basalticflows or due to their rapid erosion, makes difficult the determination ofthe corresponding emission centers. Therefore, systematic AMS deter-mination was the selected method, here used for the first time in theCVL. AMS results, combined tomagneticmineralogy and image analysisstudies, help to connect discontinuous Bambouto and Bamenda flowdeposits to their sources and to discuss magnetic fabric acquisition andemplacement mode of these ignimbrites.
a showing the sampled stations and locations of dated samples.

116 M. Gountié Dedzo et al. / Journal of Volcanology and Geothermal Research 203 (2011) 113–132
2. Geological setting
After Mounts Cameroon and Manengouba, Mount Bamboutoconstitutes the third most important volcano (in volume) of the CVLwith Mount Mélétan (2740 m) as its highest point (Figs. 1c, 2a). It ismade up of volcanic products dated from 21.12 Ma to 0.5 Ma, andcomprising basalts, trachytes, phonolites, rhyolite and ignimbriticdeposits constituted by various facies (Nono et al., 2003, 2004).Geochemical, mineralogical and crystallographic data (Marzoli et al.,2000; Saviulo et al., 2000; Njonfang and Nono, 2003) show geneticrelationships between different petrographic types. The Mount Bam-bouto caldera (Fig. 1c) is a dissymmetric roughly elliptic depression(13×8 km), which opens to the west of the volcano. On thesoutheastern side, it shows subvertical walls that rise 1300 m aboveits floor made of trachytic and phonolitic domes and dome-flows.
A synthetic revision of the volcanic story of Mount Bambouto isproposed as follows by Kagou Dongmo et al. (2010). The first stage, ca.21 Ma, corresponds to the building of the initial basaltic shieldvolcano. The second stage, from 18.5 to 15.3 Ma, is marked by thecollapse of the caldera linked to the pouring out of ignimbriticrhyolites and trachytes. The third stage, from 15 to 4.5 Ma, renewswith basaltic effusive activity, together with post-caldera extrusionsof trachytes and phonolites. The 0.5 Ma Totap basaltic effusive activitycould indicate the beginning of a fourth phase.
Mount Bamenda, the fourth more important volcano of the CVLappears as theNEprolongationofMounts Bamboutowithwhich there isno clear limit. Themassifs lay on a granitic Pan-African basement (Toteu
Fig. 3. Stratigraphic sections of the Mount Bambouto ignimbrites in some localities. The age2008.
et al., 2001; Nzolang et al., 2003). Mt Bamenda culminates at 2621m(Bambili Lake borders) and is characterized by two elliptic calderas(Fig. 1c): Santa-Mbu caldera (6 km×4 km) and Lefo caldera(4 km×3 km) (Gountié Dedzo et al., 2009), whose basements areessentially made of trachytic domes that are also abundant on theexternal versantof themassif. According toKamgang et al. (2007, 2008),felsic and intermediate lavas (27.40–18.98 Ma) aremade ofmugearites,benmoreites, trachytes, rhyolites. Mafic lavas (basanites, basalts, andhawaiites) are dated from 17.4 Ma to the present; rhyolitic ignimbriteflow deposits are inserted between the granito-gneissic basement attheir floor and the lateritized old basalts on top.
3. Field observations and petrography of ignimbrites
3.1. Ignimbrites of Mount Bambouto
Ignimbrites outcrops in Mount Bambouto are discontinuous andcover approximately 17% (≈135 km2) of themassif (Fig. 2a, 3) with 30to 120 m in thickness. The volume of these pyroclastic depositsestimated at 13.5 km3, is actuallymuch larger because these formationsare covered by generally lateritized basalts in the southern part of themassif. In the lower zone, they lay on ametamorphic basement, while inthe upper zone, they cover trachytic lavas. Welded and non weldedmassif lapilli tuff (Tlm) and massif lithic breccias (Brlm) (following theclassification of Branney and Kokelaar, 2002) are the two ignimbriticfacies cropping out in this massif.
s are from Gouhier et al. (1974), Tchoua (1973), Youmen et al. (2005), Nkouathio et al.,
117M. Gountié Dedzo et al. / Journal of Volcanology and Geothermal Research 203 (2011) 113–132
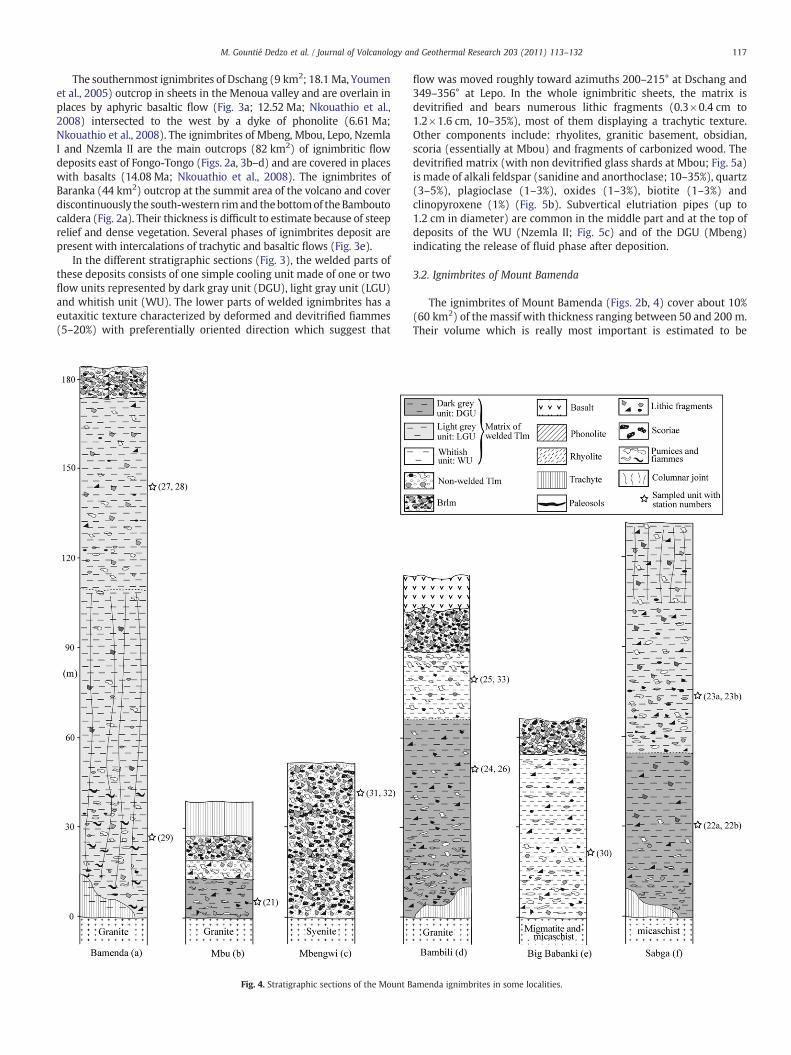
The southernmost ignimbrites of Dschang (9 km2; 18.1 Ma, Youmenet al., 2005) outcrop in sheets in the Menoua valley and are overlain inplaces by aphyric basaltic flow (Fig. 3a; 12.52 Ma; Nkouathio et al.,2008) intersected to the west by a dyke of phonolite (6.61 Ma;Nkouathio et al., 2008). The ignimbrites of Mbeng, Mbou, Lepo, NzemlaI and Nzemla II are the main outcrops (82 km2) of ignimbritic flowdeposits east of Fongo-Tongo (Figs. 2a, 3b–d) and are covered in placeswith basalts (14.08 Ma; Nkouathio et al., 2008). The ignimbrites ofBaranka (44 km2) outcrop at the summit area of the volcano and coverdiscontinuously the south-western rimand thebottomof the Bamboutocaldera (Fig. 2a). Their thickness is difficult to estimate because of steeprelief and dense vegetation. Several phases of ignimbrites deposit arepresent with intercalations of trachytic and basaltic flows (Fig. 3e).
In the different stratigraphic sections (Fig. 3), the welded parts ofthese deposits consists of one simple cooling unit made of one or twoflow units represented by dark gray unit (DGU), light gray unit (LGU)and whitish unit (WU). The lower parts of welded ignimbrites has aeutaxitic texture characterized by deformed and devitrified fiammes(5–20%) with preferentially oriented direction which suggest that
Fig. 4. Stratigraphic sections of the Mount B
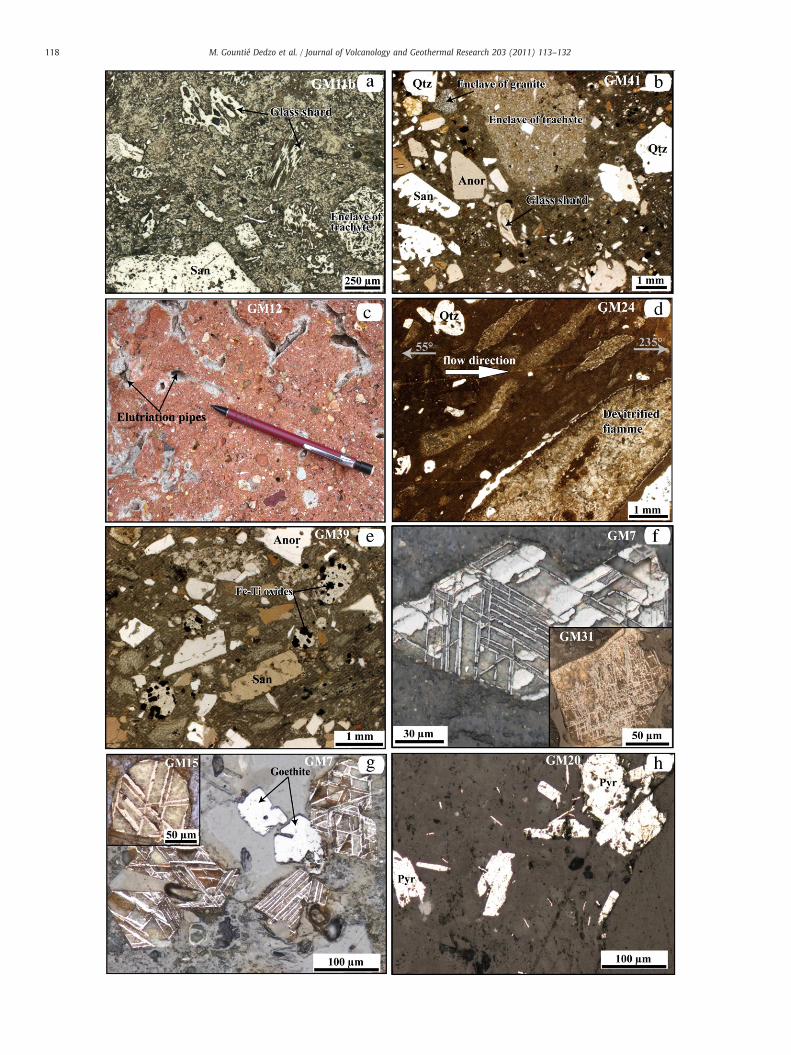
flow was moved roughly toward azimuths 200–215° at Dschang and349–356° at Lepo. In the whole ignimbritic sheets, the matrix isdevitrified and bears numerous lithic fragments (0.3×0.4 cm to1.2×1.6 cm, 10–35%), most of them displaying a trachytic texture.Other components include: rhyolites, granitic basement, obsidian,scoria (essentially at Mbou) and fragments of carbonized wood. Thedevitrified matrix (with non devitrified glass shards at Mbou; Fig. 5a)is made of alkali feldspar (sanidine and anorthoclase; 10–35%), quartz(3–5%), plagioclase (1–3%), oxides (1–3%), biotite (1–3%) andclinopyroxene (1%) (Fig. 5b). Subvertical elutriation pipes (up to1.2 cm in diameter) are common in the middle part and at the top ofdeposits of the WU (Nzemla II; Fig. 5c) and of the DGU (Mbeng)indicating the release of fluid phase after deposition.
3.2. Ignimbrites of Mount Bamenda
The ignimbrites of Mount Bamenda (Figs. 2b, 4) cover about 10%(60 km2) of the massif with thickness ranging between 50 and 200 m.Their volume which is really most important is estimated to be
amenda ignimbrites in some localities.
118 M. Gountié Dedzo et al. / Journal of Volcanology and Geothermal Research 203 (2011) 113–132

Fig. 6. Representative thermomagnetic curves (susceptibility versus low and high temperature) of Mounts Bambouto and Bamenda ignimbrites. The arrows indicate the heating andcooling curves.
119M. Gountié Dedzo et al. / Journal of Volcanology and Geothermal Research 203 (2011) 113–132
6.3 km3. As in the case of Mount Bambouto, the deposits arediscontinuous and lie on the basement rocks made of granite, syenite,micaschist and migmatite.
The ignimbrite sheets of Bamenda (6 km2), Mbu (3 km2) andMbengwi (13 km2) lie on granitic (Fig. 4a, b) and syenitic (Fig. 4c)basements in the SW of Mt Bamenda. The upper parts of the depositsin the two first localities and the entire unit of Mbengwi are made ofBrlm facies (only sampled in Mbengwi). A non-welded Tlm was alsorecognized at Mbu, but only the lowermost welded DGU (Tlm) wassampled in this sheet. In the NE of massif, the ignimbrites of Bambili
Fig. 5. Photomicrographs and photographs of Mounts Bambouto and Bamenda ignimbrites: aof trachyte and granite in the DGU of Nzemla I ignimbrites. c) Presence of multiple elutriatiod) Oriented thin section of Bambili ignimbrite (DGU) showing aligned fiammes which definewith several Fe–Ti oxides. f) Crystals of titanohematite with wide lens-shape exsolution (goethite and titanohematite in the DGU of Nzemla I ignimbrite. h) Crystals of pyrite in Baran
(3 km2) Sabga (6 km2) and Big Babanki (2 km2) lie on the basementrocksmade of granite, micaschist andmigmatite (Fig. 4d, e, f). TheWUof welded Tlm are cover with a Brlm facies (not sampled) in the twofirst localities.
The basal and middle parts of Bambili DGU are much consolidatedand display eutaxitic texture (Fig. 4d); they are characterized by blackand/or white preferentially oriented devitrified fiammes (10–30%)showing that transport direction of pyroclastic current was roughlydirected toward azimuth 235 (site GM24: Fig. 5d). At Bamenda (site GM28), field indicators represented by elongate imbricated pumice and
) Ignimbrites (WU) of Mbou showing ashy matrix and multiple glass shards. b) Enclaven pipes at the top of WU of Nzemla II ignimbrite; the reddish color is due to rubefaction.d flow direction along azimuth 235°. e) Devitrifiedmatrix of Nzemla II (WU) ignimbritesDGU, GM7) and thin exsolution lamellae of ilmenite (DGU, GM31). g) Association ofka ignimbrites. San: sanidine; Anor: anorthose; Pl: plagioclase; Qtz: quartz; Pyr: pyrite.

120 M. Gountié Dedzo et al. / Journal of Volcanology and Geothermal Research 203 (2011) 113–132
lithic fragments suggest that flow was directed toward azimuth 226°.The incipient zones of the welded WU of Bambili is characterized byvertical elutriation pipes (few millimeters to 1.5 cm in diameter) andmultiple pumice (40%). Rock enclaves (≤1.9×2.2 cm, 10–25%) aremainly trachytic with minor proportion of rhyolite, granite, ignimbriteand obsidian. In the breccificated zones, proportions of lithics (up to10×15 cmatBambili) rangebetween30and70%. Thedevitrifiedmatrixof Tlm in different units is made of alkali feldspar (sanidine andanortoclase; 5–10%), quartz (2–3%), plagioclase (b3%), oxides (1–3%),biotite (1–2%) and of clinopyroxene (1%).
4. Analytical methods
4.1. Magnetic mineral characterization
To ascertain the interpretation of the AMS results, standard rockmagnetic experiments were conducted with the principal goal of
Fig. 7. a) IRM acquisition curves for Mounts Bambouto and Bamenda ignimbrites: (i) presenccurves by cumulative log-Gaussian (Robertson and France, 1994) functions using the softw
identifying the mineral phases that contribute to the magneticproperties of the ignimbrites.
Low field versus high temperature susceptibility measurements(K-T curves) in air were carried out using a CS-3 apparatus coupled tothe KLY-2 bridge susceptometer. Selected samples were progressivelyheated, generally up to 700 °C at heating rate 18 °C/min and thensubsequently cooled to room temperature at the same rate. In somecases, low temperature (from −200 °C to room temperature)susceptibility was also recorded.
The characterization of ferromagnetic minerals and their respectiveconcentration was obtained by acquisition of isothermal remanentmagnetization (IRM) and anhysteretic remanent magnetization (ARM)on 10 representative samples. IRM curves were acquired in progres-sively increasing magnetizing field using a pulse magnetometerMMPM10 at fields up to 2T. For ARM measurements, samples werefirst demagnetized at 100 mT and then subjected to an alternating field(AF) peak of 100 mTplus aDCfield of 0.1 mT in an LDA-3A apparatus. In
e of one component; (ii) presence of two components. b) Examples of treatment of IRMare developed by Kruiver et al. (2001).

121M. Gountié Dedzo et al. / Journal of Volcanology and Geothermal Research 203 (2011) 113–132
all cases, magnetic remanence was measured with a JR5-Amagnetometer.
In order to characterize the mineral assemblages and textures ofignimbrites, optical studies using transmitted and reflected-lightmicroscope were undertaken on polished thin sections from repre-sentative samples. Nature of ferromagnetic minerals was investigatedby electron microprobe analyses on CAMECA SX50 apparatusoperating at the usual conditions.
4.2. Sampling methods and AMS measurements
The magnetic studies were performed on different flow units(Figs. 2–4). All measurements were made in LMTG (Laboratoire desMécanismes et Transferts en Géologie) at Paul Sabatier University inToulouse, France.
Sampling of the Bambouto (244 core samples) and Bamenda (115core samples) ignimbrites was performed on 41 stations (Fig. 2).Stations were distributed somewhat homogeneously over each ignim-brite sheet. At each site, a total of 6–10 oriented cores were collectedusing a portable, gasoline-powered drill-machine with a non-magneticdiamond-tipped drill bit in an area covering approximately 5 to 10 m2.Samples were oriented using magnetic compass. In order to avoidbreakage, the cores were collected in the welded part of the deposit. Inlaboratory, each core sample was cut into 2.2×2.5 cm cylinderspecimens, using a diamond tipped, non-magnetic saw blade. Up tofour specimens per sample were obtained, hence a total of 957specimens. AMS measurements were performed on a Kappabridgesusceptometer (KLY-3S, Agico, Czech Republic) operating at a lowalternating field (4×10⁻⁴ T at 920 Hz) with a sensitivity of about2×10−7 SI, allowing anisotropy discrimination below 0.2% over a widerange of susceptibility.
Theymeasure the orientation of themagnetic carriers in a rock. AMSmeasurement of one rock specimen results in an ellipsoid of magneticsusceptibility (K) defined by the length and orientation of its threeorthogonal axes, K1≥K2≥K3, which are the three eigenvectors of thesusceptibility tensor, representing the maximum, intermediate andminimum susceptibility directions respectively (Tarling and Hrouda,1993). The long axis K1 defines the magnetic lineation, meanwhile theshort axis K3, is the foliationpole, i.e. the normal to theplane ofmagneticfoliation. Themeanmagnetic susceptibility (Km) is the arithmeticmeanof the lengths of the principal axes (Km=[K1+K2+K3]/3). Thetechnique also quantifies the anisotropy percentage (P%=[(K1/K3)−1]×100). In addition, the linear (L%=[(K1/K2)−1]×100) and planar(F=[(K2/K3)−1]×100) anisotropies are also provided. The shape of
Table 1Results of the LAP–GAP–SAP treatment (Kruiver et al., 2001). SIRM (A/m) represents the valuthe dispersion parameter (DP). Values of the ARM/SIRM ratio at 100 mT are also indicated.
Samples LAP–GAP–SAP
Component Contribution(%)
SIRM(A/m)
B1/2
(mT)
GM2 1 100 28.5 201.7GM6 1 100 3.7 85.1GM7 1 35 0.95 18.2
2 65 1.77 149.1GM14 1 28 0.64 23
2 72 1.65 187.3GM15 1 100 24.5 125.9GM20 1 100 6.6 39.8GM21 1 52 0.53 13.2
2 48 0.49 220.6GM22 1 100 140 177.8GM23 1 100 12.5 95.5GM24 1 100 0.55 63.1
the susceptibility ellipsoid is characterized by the T parameterwith T=(2lnK2− lnK1− lnK3)/(lnK1− lnK3) (Jelinek, 1981) ranging from +1for oblate ellipsoid to −1 for prolate ellipsoid. Triaxial ellipsoids arecharacterized by values between −0.5 and +0.5.
4.3. Shape fabric determination by image analysis
Themagnetic fabric is supposed to be coaxial with themineral fabricof the magnetic carriers. This point is now well established in plutonicrocks (e.g. Grégoire et al., 1998) and even in basaltic flows (Canon-Tapiaet al., 1995). However, the peculiar emplacement modes of ignimbriteand some unexpected AMS orientations required that magnetic fabricwas comparedwith the fabrics of other elements (feldspars, quartz andfiammes). This determination was carried out on oriented thin sectionswhich were cut from three samples (GM7, GM29 and GM40) inhorizontal, NS and EW sections to build a shape preferred orientation(SPO) ellipsoid. The grain size and shape fabric data were extracted outof the digitized images by the SPO program of Launeau (2004) using theintercepts method by the Intercepts 2003 software of Launeau andRobin. All minerals and fiammes are digitized in gray levels. Interceptsare extracteddirectly fromthegray level image following the Launeauetal. (2010) algorithm fromeach boundary betweenwhite, gray and blackpixels. SPO ellipsoids are given by a combination of 3 mutuallyorthogonal sections (one horizontal and two vertical, namely NS andEW) following the procedure of Launeau and Robin (2005) and Robin(2002). These sections do not need to be chosen in relation with theAMS principal axes.
5. Results
5.1. Magnetic mineralogy
Petrographic determination and microprobe analysis were per-formed on opaque minerals with appropriate grain sizes. In order toidentify the magnetic carriers bearing the AMS signal we performedthermomagnetic analyses in low and high temperatures and acquisi-tion of Isothermal Remanent Magnetization (IRM) and ARM/IRMratios.
5.1.1. Opaque mineral textures and compositionsPetrographic analyses indicate that opaque minerals are in
proportions ranging from 1% to 3% of the bulk-rock composition.Transmitted and reflected-light observations enable the identificationof different types of opaque minerals: (i) fine- to medium-grained
e of IRM at saturation, B1/2 (mT) is the mean coercivity of the magnetic phase and DP is
ARM/SIRM ratio
DP ARMat 100 mT (A/m)
SIRMat 100 mT (A/m)
ARM/SIRMat 100 mT (%)
0.31 0.23 4.5 5.10.40 0.17 2.04 8.30.33 0.13 1.50 8.60.330.41 0.12 0.89 13.50.320.33 0.44 8.71 5.10.31 0.58 5.97 9.70.4 0.10 0.61 16.40.330.32 2.08 27.95 7.50.42 0.98 6.21 15.80.42 0.55 5.97 9.2
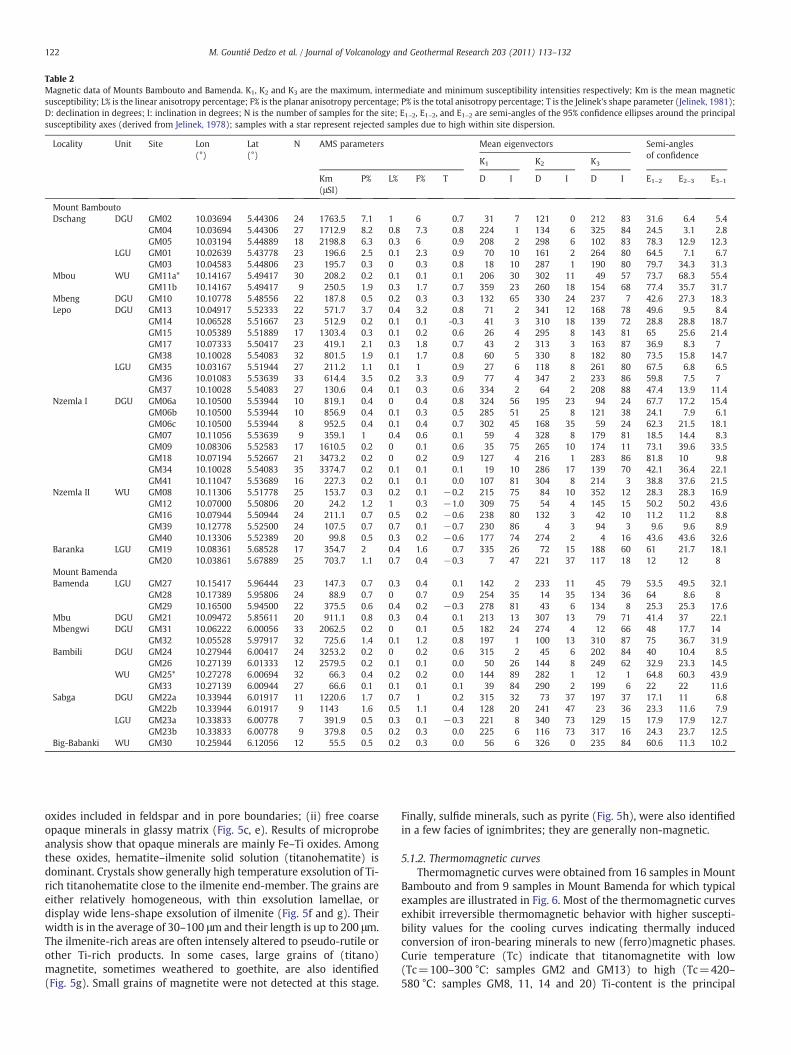
Table 2Magnetic data of Mounts Bambouto and Bamenda. K1, K2 and K3 are the maximum, intermediate and minimum susceptibility intensities respectively; Km is the mean magneticsusceptibility; L% is the linear anisotropy percentage; F% is the planar anisotropy percentage; P% is the total anisotropy percentage; T is the Jelinek's shape parameter (Jelinek, 1981);D: declination in degrees; I: inclination in degrees; N is the number of samples for the site; E1–2, E1–2, and E1–2 are semi-angles of the 95% confidence ellipses around the principalsusceptibility axes (derived from Jelinek, 1978); samples with a star represent rejected samples due to high within site dispersion.
Locality Unit Site Lon(°)
Lat(°)
N AMS parameters Mean eigenvectors Semi-anglesof confidence
K1 K2 K3
Km(μSI)
P% L% F% T D I D I D I E1–2 E2–3 E3–1
Mount BamboutoDschang DGU GM02 10.03694 5.44306 24 1763.5 7.1 1 6 0.7 31 7 121 0 212 83 31.6 6.4 5.4
GM04 10.03694 5.44306 27 1712.9 8.2 0.8 7.3 0.8 224 1 134 6 325 84 24.5 3.1 2.8GM05 10.03194 5.44889 18 2198.8 6.3 0.3 6 0.9 208 2 298 6 102 83 78.3 12.9 12.3
LGU GM01 10.02639 5.43778 23 196.6 2.5 0.1 2.3 0.9 70 10 161 2 264 80 64.5 7.1 6.7GM03 10.04583 5.44806 23 195.7 0.3 0 0.3 0.8 18 10 287 1 190 80 79.7 34.3 31.3
Mbou WU GM11a* 10.14167 5.49417 30 208.2 0.2 0.1 0.1 0.1 206 30 302 11 49 57 73.7 68.3 55.4GM11b 10.14167 5.49417 9 250.5 1.9 0.3 1.7 0.7 359 23 260 18 154 68 77.4 35.7 31.7
Mbeng DGU GM10 10.10778 5.48556 22 187.8 0.5 0.2 0.3 0.3 132 65 330 24 237 7 42.6 27.3 18.3Lepo DGU GM13 10.04917 5.52333 22 571.7 3.7 0.4 3.2 0.8 71 2 341 12 168 78 49.6 9.5 8.4
GM14 10.06528 5.51667 23 512.9 0.2 0.1 0.1 -0.3 41 3 310 18 139 72 28.8 28.8 18.7GM15 10.05389 5.51889 17 1303.4 0.3 0.1 0.2 0.6 26 4 295 8 143 81 65 25.6 21.4GM17 10.07333 5.50417 23 419.1 2.1 0.3 1.8 0.7 43 2 313 3 163 87 36.9 8.3 7GM38 10.10028 5.54083 32 801.5 1.9 0.1 1.7 0.8 60 5 330 8 182 80 73.5 15.8 14.7
LGU GM35 10.03167 5.51944 27 211.2 1.1 0.1 1 0.9 27 6 118 8 261 80 67.5 6.8 6.5GM36 10.01083 5.53639 33 614.4 3.5 0.2 3.3 0.9 77 4 347 2 233 86 59.8 7.5 7GM37 10.10028 5.54083 27 130.6 0.4 0.1 0.3 0.6 334 2 64 2 208 88 47.4 13.9 11.4
Nzemla I DGU GM06a 10.10500 5.53944 10 819.1 0.4 0 0.4 0.8 324 56 195 23 94 24 67.7 17.2 15.4GM06b 10.10500 5.53944 10 856.9 0.4 0.1 0.3 0.5 285 51 25 8 121 38 24.1 7.9 6.1GM06c 10.10500 5.53944 8 952.5 0.4 0.1 0.4 0.7 302 45 168 35 59 24 62.3 21.5 18.1GM07 10.11056 5.53639 9 359.1 1 0.4 0.6 0.1 59 4 328 8 179 81 18.5 14.4 8.3GM09 10.08306 5.52583 17 1610.5 0.2 0 0.1 0.6 35 75 265 10 174 11 73.1 39.6 33.5GM18 10.07194 5.52667 21 3473.2 0.2 0 0.2 0.9 127 4 216 1 283 86 81.8 10 9.8GM34 10.10028 5.54083 35 3374.7 0.2 0.1 0.1 0.1 19 10 286 17 139 70 42.1 36.4 22.1GM41 10.11047 5.53689 16 227.3 0.2 0.1 0.1 0.0 107 81 304 8 214 3 38.8 37.6 21.5
Nzemla II WU GM08 10.11306 5.51778 25 153.7 0.3 0.2 0.1 −0.2 215 75 84 10 352 12 28.3 28.3 16.9GM12 10.07000 5.50806 20 24.2 1.2 1 0.3 −1.0 309 75 54 4 145 15 50.2 50.2 43.6GM16 10.07944 5.50944 24 211.1 0.7 0.5 0.2 −0.6 238 80 132 3 42 10 11.2 11.2 8.8GM39 10.12778 5.52500 24 107.5 0.7 0.7 0.1 −0.7 230 86 4 3 94 3 9.6 9.6 8.9GM40 10.13306 5.52389 20 99.8 0.5 0.3 0.2 −0.6 177 74 274 2 4 16 43.6 43.6 32.6
Baranka LGU GM19 10.08361 5.68528 17 354.7 2 0.4 1.6 0.7 335 26 72 15 188 60 61 21.7 18.1GM20 10.03861 5.67889 25 703.7 1.1 0.7 0.4 −0.3 7 47 221 37 117 18 12 12 8
Mount BamendaBamenda LGU GM27 10.15417 5.96444 23 147.3 0.7 0.3 0.4 0.1 142 2 233 11 45 79 53.5 49.5 32.1
GM28 10.17389 5.95806 24 88.9 0.7 0 0.7 0.9 254 35 14 35 134 36 64 8.6 8GM29 10.16500 5.94500 22 375.5 0.6 0.4 0.2 −0.3 278 81 43 6 134 8 25.3 25.3 17.6
Mbu DGU GM21 10.09472 5.85611 20 911.1 0.8 0.3 0.4 0.1 213 13 307 13 79 71 41.4 37 22.1Mbengwi DGU GM31 10.06222 6.00056 33 2062.5 0.2 0 0.1 0.5 182 24 274 4 12 66 48 17.7 14
GM32 10.05528 5.97917 32 725.6 1.4 0.1 1.2 0.8 197 1 100 13 310 87 75 36.7 31.9Bambili DGU GM24 10.27944 6.00417 24 3253.2 0.2 0 0.2 0.6 315 2 45 6 202 84 40 10.4 8.5
GM26 10.27139 6.01333 12 2579.5 0.2 0.1 0.1 0.0 50 26 144 8 249 62 32.9 23.3 14.5WU GM25* 10.27278 6.00694 32 66.3 0.4 0.2 0.2 0.0 144 89 282 1 12 1 64.8 60.3 43.9
GM33 10.27139 6.00944 27 66.6 0.1 0.1 0.1 0.1 39 84 290 2 199 6 22 22 11.6Sabga DGU GM22a 10.33944 6.01917 11 1220.6 1.7 0.7 1 0.2 315 32 73 37 197 37 17.1 11 6.8
GM22b 10.33944 6.01917 9 1143 1.6 0.5 1.1 0.4 128 20 241 47 23 36 23.3 11.6 7.9LGU GM23a 10.33833 6.00778 7 391.9 0.5 0.3 0.1 −0.3 221 8 340 73 129 15 17.9 17.9 12.7
GM23b 10.33833 6.00778 9 379.8 0.5 0.2 0.3 0.0 225 6 116 73 317 16 24.3 23.7 12.5Big-Babanki WU GM30 10.25944 6.12056 12 55.5 0.5 0.2 0.3 0.0 56 6 326 0 235 84 60.6 11.3 10.2
122 M. Gountié Dedzo et al. / Journal of Volcanology and Geothermal Research 203 (2011) 113–132
oxides included in feldspar and in pore boundaries; (ii) free coarseopaque minerals in glassy matrix (Fig. 5c, e). Results of microprobeanalysis show that opaque minerals are mainly Fe–Ti oxides. Amongthese oxides, hematite–ilmenite solid solution (titanohematite) isdominant. Crystals show generally high temperature exsolution of Ti-rich titanohematite close to the ilmenite end-member. The grains areeither relatively homogeneous, with thin exsolution lamellae, ordisplay wide lens-shape exsolution of ilmenite (Fig. 5f and g). Theirwidth is in the average of 30–100 μm and their length is up to 200 μm.The ilmenite-rich areas are often intensely altered to pseudo-rutile orother Ti-rich products. In some cases, large grains of (titano)magnetite, sometimes weathered to goethite, are also identified(Fig. 5g). Small grains of magnetite were not detected at this stage.
Finally, sulfide minerals, such as pyrite (Fig. 5h), were also identifiedin a few facies of ignimbrites; they are generally non-magnetic.
5.1.2. Thermomagnetic curvesThermomagnetic curves were obtained from 16 samples in Mount
Bambouto and from 9 samples in Mount Bamenda for which typicalexamples are illustrated in Fig. 6. Most of the thermomagnetic curvesexhibit irreversible thermomagnetic behavior with higher suscepti-bility values for the cooling curves indicating thermally inducedconversion of iron-bearing minerals to new (ferro)magnetic phases.Curie temperature (Tc) indicate that titanomagnetite with low(Tc=100–300 °C: samples GM2 and GM13) to high (Tc=420–580 °C: samples GM8, 11, 14 and 20) Ti-content is the principal
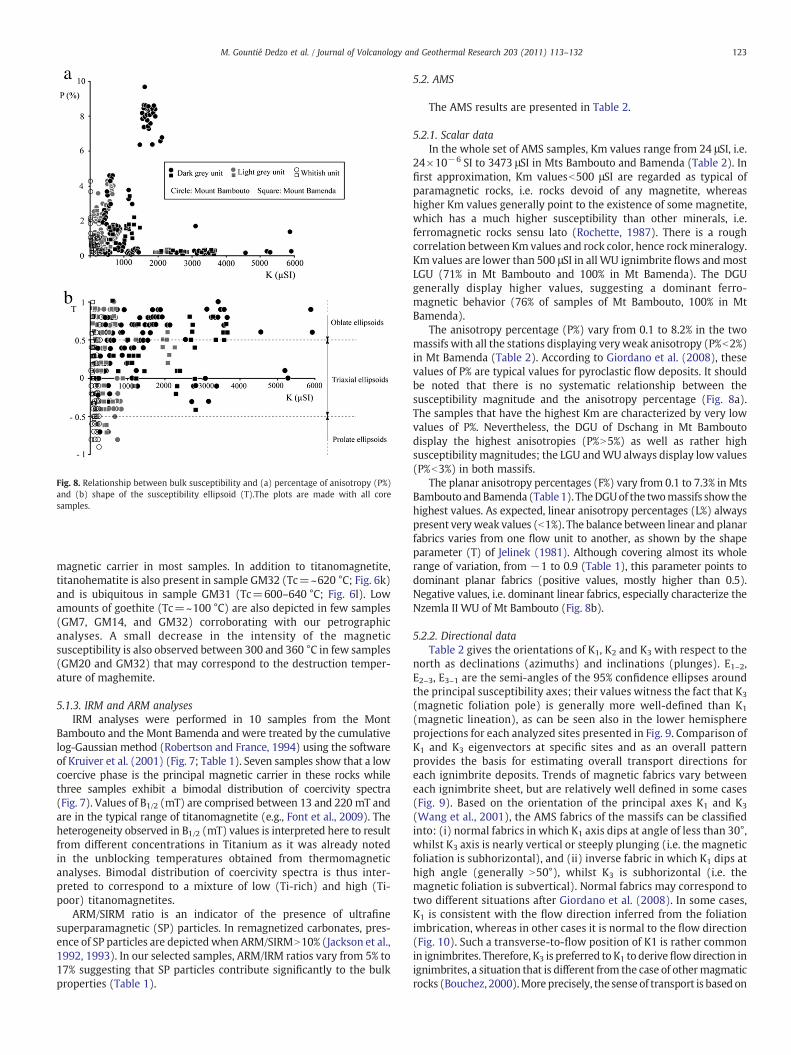
Fig. 8. Relationship between bulk susceptibility and (a) percentage of anisotropy (P%)and (b) shape of the susceptibility ellipsoid (T).The plots are made with all coresamples.
123M. Gountié Dedzo et al. / Journal of Volcanology and Geothermal Research 203 (2011) 113–132
magnetic carrier in most samples. In addition to titanomagnetite,titanohematite is also present in sample GM32 (Tc=~620 °C; Fig. 6k)and is ubiquitous in sample GM31 (Tc=600–640 °C; Fig. 6l). Lowamounts of goethite (Tc=~100 °C) are also depicted in few samples(GM7, GM14, and GM32) corroborating with our petrographicanalyses. A small decrease in the intensity of the magneticsusceptibility is also observed between 300 and 360 °C in few samples(GM20 and GM32) that may correspond to the destruction temper-ature of maghemite.
5.1.3. IRM and ARM analysesIRM analyses were performed in 10 samples from the Mont
Bambouto and the Mont Bamenda and were treated by the cumulativelog-Gaussian method (Robertson and France, 1994) using the softwareof Kruiver et al. (2001) (Fig. 7; Table 1). Seven samples show that a lowcoercive phase is the principal magnetic carrier in these rocks whilethree samples exhibit a bimodal distribution of coercivity spectra(Fig. 7). Values of B1/2 (mT) are comprised between 13 and 220 mT andare in the typical range of titanomagnetite (e.g., Font et al., 2009). Theheterogeneity observed in B1/2 (mT) values is interpreted here to resultfrom different concentrations in Titanium as it was already notedin the unblocking temperatures obtained from thermomagneticanalyses. Bimodal distribution of coercivity spectra is thus inter-preted to correspond to a mixture of low (Ti-rich) and high (Ti-poor) titanomagnetites.
ARM/SIRM ratio is an indicator of the presence of ultrafinesuperparamagnetic (SP) particles. In remagnetized carbonates, pres-ence of SP particles are depictedwhen ARM/SIRMN10% (Jackson et al.,1992, 1993). In our selected samples, ARM/IRM ratios vary from 5% to17% suggesting that SP particles contribute significantly to the bulkproperties (Table 1).
5.2. AMS
The AMS results are presented in Table 2.
5.2.1. Scalar dataIn the whole set of AMS samples, Km values range from 24 μSI, i.e.
24×10−6 SI to 3473 μSI in Mts Bambouto and Bamenda (Table 2). Infirst approximation, Km valuesb500 μSI are regarded as typical ofparamagnetic rocks, i.e. rocks devoid of any magnetite, whereashigher Km values generally point to the existence of some magnetite,which has a much higher susceptibility than other minerals, i.e.ferromagnetic rocks sensu lato (Rochette, 1987). There is a roughcorrelation between Km values and rock color, hence rockmineralogy.Km values are lower than 500 μSI in all WU ignimbrite flows andmostLGU (71% in Mt Bambouto and 100% in Mt Bamenda). The DGUgenerally display higher values, suggesting a dominant ferro-magnetic behavior (76% of samples of Mt Bambouto, 100% in MtBamenda).
The anisotropy percentage (P%) vary from 0.1 to 8.2% in the twomassifs with all the stations displaying very weak anisotropy (P%b2%)in Mt Bamenda (Table 2). According to Giordano et al. (2008), thesevalues of P% are typical values for pyroclastic flow deposits. It shouldbe noted that there is no systematic relationship between thesusceptibility magnitude and the anisotropy percentage (Fig. 8a).The samples that have the highest Km are characterized by very lowvalues of P%. Nevertheless, the DGU of Dschang in Mt Bamboutodisplay the highest anisotropies (P%N5%) as well as rather highsusceptibility magnitudes; the LGU andWU always display low values(P%b3%) in both massifs.
The planar anisotropy percentages (F%) vary from 0.1 to 7.3% in MtsBambouto andBamenda (Table 1). TheDGUof the twomassifs show thehighest values. As expected, linear anisotropy percentages (L%) alwayspresent veryweak values (b1%). The balance between linear and planarfabrics varies from one flow unit to another, as shown by the shapeparameter (T) of Jelinek (1981). Although covering almost its wholerange of variation, from −1 to 0.9 (Table 1), this parameter points todominant planar fabrics (positive values, mostly higher than 0.5).Negative values, i.e. dominant linear fabrics, especially characterize theNzemla II WU of Mt Bambouto (Fig. 8b).
5.2.2. Directional dataTable 2 gives the orientations of K1, K2 and K3 with respect to the
north as declinations (azimuths) and inclinations (plunges). E1–2,E2–3, E3–1 are the semi-angles of the 95% confidence ellipses aroundthe principal susceptibility axes; their values witness the fact that K3
(magnetic foliation pole) is generally more well-defined than K1
(magnetic lineation), as can be seen also in the lower hemisphereprojections for each analyzed sites presented in Fig. 9. Comparison ofK1 and K3 eigenvectors at specific sites and as an overall patternprovides the basis for estimating overall transport directions foreach ignimbrite deposits. Trends of magnetic fabrics vary betweeneach ignimbrite sheet, but are relatively well defined in some cases(Fig. 9). Based on the orientation of the principal axes K1 and K3
(Wang et al., 2001), the AMS fabrics of the massifs can be classifiedinto: (i) normal fabrics in which K1 axis dips at angle of less than 30°,whilst K3 axis is nearly vertical or steeply plunging (i.e. the magneticfoliation is subhorizontal), and (ii) inverse fabric in which K1 dips athigh angle (generally N50°), whilst K3 is subhorizontal (i.e. themagnetic foliation is subvertical). Normal fabrics may correspond totwo different situations after Giordano et al. (2008). In some cases,K1 is consistent with the flow direction inferred from the foliationimbrication, whereas in other cases it is normal to the flow direction(Fig. 10). Such a transverse-to-flow position of K1 is rather commonin ignimbrites. Therefore, K3 is preferred to K1 to derive flowdirection inignimbrites, a situation that is different from the case of othermagmaticrocks (Bouchez, 2000).More precisely, the sense of transport is based on
124 M. Gountié Dedzo et al. / Journal of Volcanology and Geothermal Research 203 (2011) 113–132

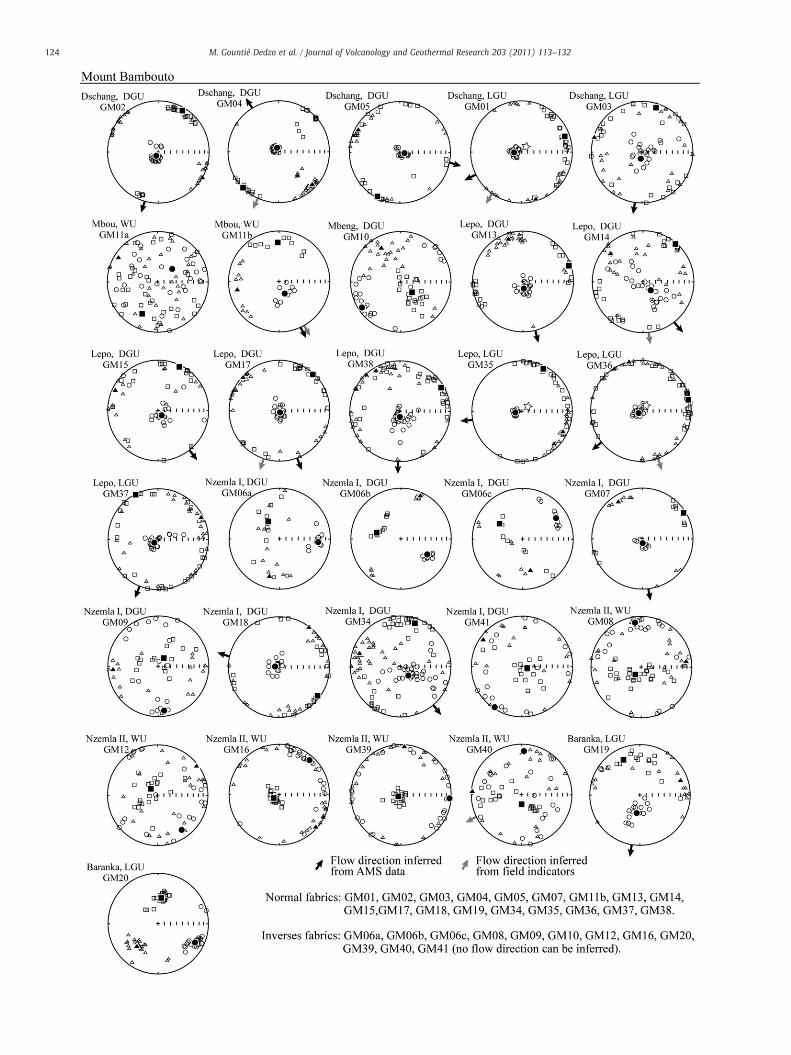
Fig. 9. Lower hemisphere projections of all AMS data encountered in Mounts Bambouto and Bamenda with inferred flow direction using imbrication of magnetic foliation (normalfabrics); squares, triangles and circles represent K1, K2 and K3 respectively; filled symbols represent means of K1, K2 and K3; stars represent the pole of the paleotopography. Sitelocations are shown in Fig. 2.
125M. Gountié Dedzo et al. / Journal of Volcanology and Geothermal Research 203 (2011) 113–132
the imbricated pattern of magnetic foliations, provided that thepaleotopography is either recognized in the field (sites GM1, GM31,GM35, and GM36) or assumedwith respect to the source. In the case ofinverse fabrics, no flow direction can be deduced from the magneticdata. Fig. 11 presents the AMS results at the formation level, with meansite data plotted on themaps and all sample data plotted in the lineationand foliation pole synthetic diagrams.
5.3. Mount Bambouto
In Mount Bambouto, 17 sites in the gray units and 1 site in whitishunit yield interpretable AMS directional data used to infer transportdirection. The magnetic lineations have mostly very low plunges (2° to10°) and magnetic foliation planes dip very gently (2 to 12°). For themajority of stations, K1 is approximately perpendicular to the flowdirection deduced fromK3 axis. In the remaining sites (3 atDschang and1 at Nzemla I), K1 is parallel to the transport directions. At Nzemla I,Mbeng and Baranka, for most sites, lineation tends to be subvertical (45to 81°) and K1–K2 planes have very high inclination (45 to 87°).
In Dschang, all stations present normal fabrics. Magnetic lineations(best line at 38/4; Fig. 11 a) have low plunges (1 to 10°) and generallydefine a NE–SW axis. Themagnetic foliations have a best pole at 248/88(Fig. 11a). For three of these sites (GM1, GM2, and GM3), magneticfoliation planes dip range from 7° to 10°NE with a magnetic lineationconsistent with the flow direction inferred from K3 (Fig. 9). For the
remaining two stations (GM4 and GM5), magnetic foliations dip verygently (6°SE and 7°SSE) with K1 perpendicular to the imbrication of K3
axes.AMS stations at Lepo show synthetic stereograms with a best pole
of magnetic foliation at 190/84 and a best line of magnetic lineation at43/3 (Fig. 11a). All stations present normal fabrics and yield readilyinterpretable AMS directional data. Three sites (GM36, GM37 andGM38) have magnetic foliation planes gently inclined (2–10°) to NE,while site GM35 display K3 axe inclined (10°) approximately to E. Thefour remaining sites (GM13, GM14, GM15, and GM17) are imbricatedto the NW (3–28°), as can be seen in Fig. 11a. Magnetic line-ations generally present a NE–SW direction with low plunges (2to 6°).
At Nzemla I, eight AMS sites display K1 and K3 axes somewhatdispersed with a general concentration respectively trending to theNW and SE (best pole of magnetic foliation at 154/77 and best line at23/9; Fig. 11a). In detail, 3 sites display normal fabrics with gentlyinclined magnetic foliation planes (best foliation poles at 283/86,179/81 and 139/70 for GM18, GM7 and GM34 respectively) andsubhorizontal lineations. These 3 stations suggest a poorly definedtransport direction toward a sector from the south-east to the west,consistent with field data indicating transport toward the south-westat site GM 7. The remaining 5 stations display inverse fabrics withsteeply dipping foliation planes (52–87°) and moderately to highlyplunging lineations (45–81°).

Fig. 10. Conceptual model for imbrication of magnetic foliation in two ideal cases. a) Magnetic foliation can be imbricated with Kmax axis oriented parallel and b) perpendicular tothe flow direction, and the related c), d) stereoplots of AMS axes. Note that the orientation of the magnetic foliation is parallel to the inferred flow direction in both cases (redrawnfrom Giordano et al., 2008).
126 M. Gountié Dedzo et al. / Journal of Volcanology and Geothermal Research 203 (2011) 113–132
At Mbeng locality, site GM10 shows inverse fabric with asubvertical foliation plane (83°) and a high plunge of lineation (65°).
In Mount Bambouto caldera where the ignimbrites of Barankaoutcrop, station GM20 displays a subvertical foliation with moderateplunge of magnetic lineation of 47° to the north. Station GM19 showsa moderately dipping magnetic foliation (pole at 188/60) and atransverse-to-flow magnetic lineation (trending at 335/26).
In the whitish units, only one AMS site at Mbou (GM11b with anormal fabric) was used to infer the flow pattern in this locality: themagnetic foliation pole points to the northwest, suggesting a NW to SEflow. The remainingfive sites at Nzemla II present nearly vertical fabrics(foliation dips vary from 75° to 87° and plunges of lineation from 51° to86°). Such fabrics where K3 and K1 appear to have been exchanged arecalled inverse fabrics (Rochette et al., 1999). However, it is worthnoticing that these sites also correspond to a prolate shape of their AMSellipsoids (Tb0). These data question the significance of magneticdirectional data in ignimbrites. In our cases, the so-called inverse fabricscorrespond to locations where abundant elutriation pipes wererecognized in the field (Fig. 5c). Therefore, it is suggested that thevertical AMS fabrics may be a consequence of the elutriation process.This point will be examined later in the light of the SPO data.
5.4. Mount Bamenda
In Mount Bamenda, 6 sites in the gray units yield interpretableAMS directional data that show a relatively consistent transportpattern inferred by magnetic foliation or direction of imbrication dip.These sites situated at Mbengwi, Bambili, Bamenda and Mbu displaywell defined magnetic fabrics; the magnetic lineations have mostlylow plunges (1 to 26°) and magnetic foliation planes are inclinedgently (3 to 24°). The remaining six sites at Sabga and Bamendapresent mostly highly plunging (20 to 81°) of magnetic lineations andsteeply dipping foliations (52 to 82°).
AMS stations at Mbengwi, Mbu and Bamenda show syntheticstereograms with two concentrations of their magnetic foliationpoles, one corresponding to mildly dipping foliations and the other tosteeply dipping foliations (Fig. 11b).
The two AMS sites of Mbengwi locality display normal fabrics. In thesite GM31, the result shows a well defined magnetic foliation plane
Fig. 11. Magnetic foliation and magnetic lineation map obtained for accepted AMS stationshemisphere, 2% contour intervals) for foliation poles and lineation are also shown; the plot
dipping 24° to the SSW; the magnetic lineation has approximately thesame direction, i.e. is parallel to flow. The magnetic foliation at the siteGM32 is also well defined and inclined slightly (3°) to the SE, whereasthe magnetic lineation seems transverse to the flow.
At Mbu, the site GM21 is characterized by a magnetic foliationplane imbricated (19°) to the WSW.
At Bamenda, two sites (GM28 and GM29) display inverse fabrics.Site GM27 exhibits normal fabric with magnetic foliation planeslightly inclined (11°) to NW. Themagnetic lineation for this locationis subperpendicular to the direction of imbrication of magneticfoliation, i.e. appears transverse to flow.
Further north, at Sabga (Fig. 11b), most magnetic foliation planesare steeply dipping (53–75°) in all sites.
At Bambili, the magnetic foliation in the dark gray units is welldefined and dips gently at 6° and 28° to the NE respectively for the sitesGM24 and GM26. Magnetic lineations have approximately the sameNEdirection for the site GM26; on the other hand, at site GM24, themagnetic lineation is subperpendicular to the direction of imbrication ofmagnetic foliation, i.e. transverse to flow. Station GM33 at Bambilidisplays an inverse fabric with subvertical foliation plane and lineation.At site GM30, themagnetic foliation dipsmoderately (6°) to the NE andthe magnetic lineation has the same NE trend.
5.5. Shape preferred orientation fabrics
Shape preferred orientation (SPO) fabrics were studied in threeselected samples and the results are presented in Fig. 12. Only one ofthese samples displays a normal AMS fabrics (GM 7 fromNzemla I darkgray ignimbrite). The two others display an inverse (or vertical) AMSfabric: GM 29 (Bamenda, light gray) displays a pronounced horizontalfoliation, easily identified with the naked eye and GM 40 (Nzemla II;whitish) displays a steeply dipping foliationwith field data pointing to atransport towards SW. SPO fabrics are provided for all objects (crystals,fiammes, etc.). Fig. 12 presents the orientations of the principal axes(ANBNC) of the SPO ellipsoids reconstructed from the 3 mutuallyorthogonal sections. All ellipsoids are oblate and well-defined (semi-angles of confidence ellipses b28° and incompatibility index √Fb10%).GM7 and GM29 provide especially good SPOs, despite the fact thatfoliationwas not easily recognizedwith the naked eye in GM7. The flow
from (a) Mounts Bambouto and (b) Bamenda ignimbrites. Projection diagrams (lowers are made with all specimens.

127M. Gountié Dedzo et al. / Journal of Volcanology and Geothermal Research 203 (2011) 113–132
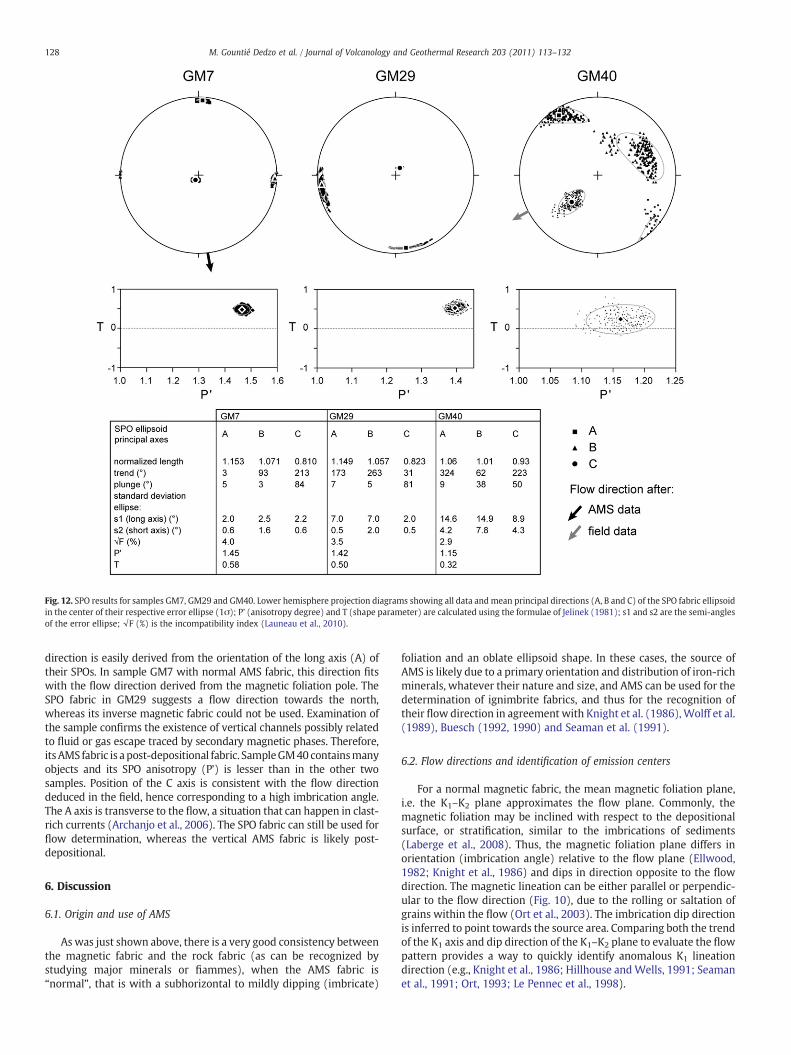
Fig. 12. SPO results for samples GM7, GM29 and GM40. Lower hemisphere projection diagrams showing all data andmean principal directions (A, B and C) of the SPO fabric ellipsoidin the center of their respective error ellipse (1σ); P’ (anisotropy degree) and T (shape parameter) are calculated using the formulae of Jelinek (1981); s1 and s2 are the semi-anglesof the error ellipse; √F (%) is the incompatibility index (Launeau et al., 2010).
128 M. Gountié Dedzo et al. / Journal of Volcanology and Geothermal Research 203 (2011) 113–132
direction is easily derived from the orientation of the long axis (A) oftheir SPOs. In sample GM7 with normal AMS fabric, this direction fitswith the flow direction derived from the magnetic foliation pole. TheSPO fabric in GM29 suggests a flow direction towards the north,whereas its inverse magnetic fabric could not be used. Examination ofthe sample confirms the existence of vertical channels possibly relatedto fluid or gas escape traced by secondary magnetic phases. Therefore,itsAMS fabric is a post-depositional fabric. SampleGM40 containsmanyobjects and its SPO anisotropy (P’) is lesser than in the other twosamples. Position of the C axis is consistent with the flow directiondeduced in the field, hence corresponding to a high imbrication angle.The A axis is transverse to the flow, a situation that can happen in clast-rich currents (Archanjo et al., 2006). The SPO fabric can still be used forflow determination, whereas the vertical AMS fabric is likely post-depositional.
6. Discussion
6.1. Origin and use of AMS
Aswas just shown above, there is a very good consistency betweenthe magnetic fabric and the rock fabric (as can be recognized bystudying major minerals or fiammes), when the AMS fabric is“normal”, that is with a subhorizontal to mildly dipping (imbricate)
foliation and an oblate ellipsoid shape. In these cases, the source ofAMS is likely due to a primary orientation and distribution of iron-richminerals, whatever their nature and size, and AMS can be used for thedetermination of ignimbrite fabrics, and thus for the recognition oftheir flow direction in agreement with Knight et al. (1986),Wolff et al.(1989), Buesch (1992, 1990) and Seaman et al. (1991).
6.2. Flow directions and identification of emission centers
For a normal magnetic fabric, the mean magnetic foliation plane,i.e. the K1–K2 plane approximates the flow plane. Commonly, themagnetic foliation may be inclined with respect to the depositionalsurface, or stratification, similar to the imbrications of sediments(Laberge et al., 2008). Thus, the magnetic foliation plane differs inorientation (imbrication angle) relative to the flow plane (Ellwood,1982; Knight et al., 1986) and dips in direction opposite to the flowdirection. The magnetic lineation can be either parallel or perpendic-ular to the flow direction (Fig. 10), due to the rolling or saltation ofgrains within the flow (Ort et al., 2003). The imbrication dip directionis inferred to point towards the source area. Comparing both the trendof the K1 axis and dip direction of the K1–K2 plane to evaluate the flowpattern provides a way to quickly identify anomalous K1 lineationdirection (e.g., Knight et al., 1986; Hillhouse andWells, 1991; Seamanet al., 1991; Ort, 1993; Le Pennec et al., 1998).
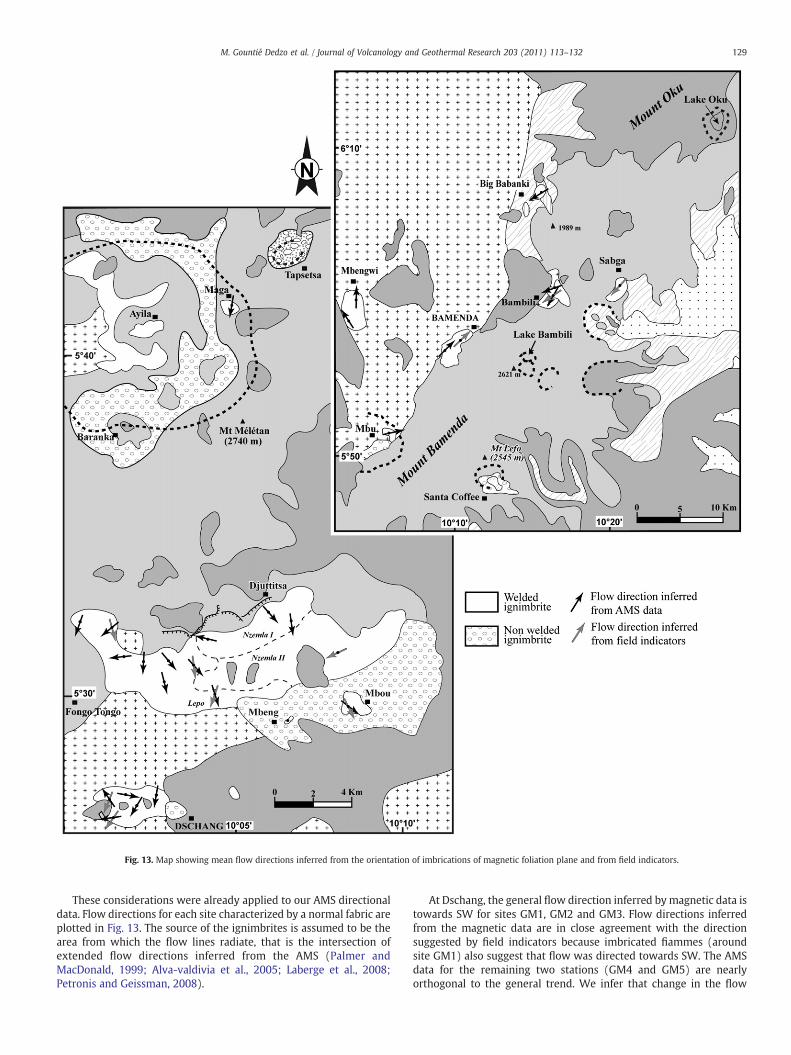
Fig. 13. Map showing mean flow directions inferred from the orientation of imbrications of magnetic foliation plane and from field indicators.
129M. Gountié Dedzo et al. / Journal of Volcanology and Geothermal Research 203 (2011) 113–132
These considerations were already applied to our AMS directionaldata. Flow directions for each site characterized by a normal fabric areplotted in Fig. 13. The source of the ignimbrites is assumed to be thearea from which the flow lines radiate, that is the intersection ofextended flow directions inferred from the AMS (Palmer andMacDonald, 1999; Alva-valdivia et al., 2005; Laberge et al., 2008;Petronis and Geissman, 2008).
At Dschang, the general flow direction inferred bymagnetic data istowards SW for sites GM1, GM2 and GM3. Flow directions inferredfrom the magnetic data are in close agreement with the directionsuggested by field indicators because imbricated fiammes (aroundsite GM1) also suggest that flow was directed towards SW. The AMSdata for the remaining two stations (GM4 and GM5) are nearlyorthogonal to the general trend. We infer that change in the flow

130 M. Gountié Dedzo et al. / Journal of Volcanology and Geothermal Research 203 (2011) 113–132
imbrications angle and K1 directions across the area reflect variationsin local slope which increases the overall dispersion of the transportdata. Indeed, the effect of subtle topography on AMS directional datahas been recognized in other ignimbrites (e.g., Buesch, 1992; Ort et al.,2003; Petronis and Geissman, 2008). Ignimbrite of Dschang is situatedin the NE–SW trending of Menoua valley, and a similar topographiceffect may have channeled the pyroclastic density current from thecaldera of Mounts Bambouto to this locality.
At Lepo, excepted site GM35 with approximately E–W flowdirection, AMS and field transport directions clearly show that theemission center of this pyroclastic flow is situated north of this area,which is the position of the Bambouto caldera.
At Nzemla I and Mbou, excepted site GM18 (with anomalous ESE–WNW transport direction, certainly also due to variation of localtopography), general flow direction inferred from AMS is to SE(Fig. 13), consistent with flow direction infer from field indicators(imbricated lithic fragments) around station GM11. Thus, magneticfabric and field indicators also evidently indicate Bambouto caldera assource area in the NE of these localities.
At Nzemla II and Mbeng, because of the vertical magnetic fabrics,no flow direction can be recognized. In addition, all stations display arelatively low magnetic anisotropy and susceptibility. Field indicatorsrepresented by elongate imbricated pumices and lithic fragments inone site (GM40) yield a flow azimuth toward 245°, confirmed by theSPO analysis, that may suggest eruption from a source located to theNE of this locality, possibly covered with younger basaltic flows.Unfortunately, there is no other evidence supporting this hypothesis.
At Mbengwi, Mbu and Bamenda the general flow direction variesfrom one locality to another but seems to radiate from the sameregion, namely the Mbu caldera as probable emission center. Thislocation is also revealed by field indicators around site GM28 whichindicated flow was towards azimuth 46° (NE).
At Sabga, Bambili and Big Babanki, flow direction is from NE to SW.The field indicators around site GM22 and GM24 are imbricatedfiammes indicating that flow pattern was approximately towardazimuth 222° and 235° respectively. The suspected emission center isthen localized to the NE of these localities. In Mount Oku the importantdepression (1.8×2.2 km) inwhichOku Lake is localized, is the probablesource of these ignimbrite sheets (or at least their welded Tlm parts).This unexpected result definitely strengthens the interest of AMSstudies to infer flow direction and emission center in ignimbrites.
6.3. Ignimbrite emplacement mode
The AMS data from the Mounts Bambouto and Bamendaignimbrites yield important information about the depositionalsystem of the pyroclastic flow. In most stations, magnetic foliationplanes (and sometimes K1 axes) consistently parallel downhilldirections, commonly with an upslope imbrication. Flow directionsinterpreted from these data indicate deposition from pyroclasticdensity currents that traveled downhill.
The current that transported the pyroclasts out from the vent musthave moved in a radial direction at Lepo (Mts Bambouto) and in MtsBamenda commonly around the probable emission center (Fig. 13).There were likely no major topographic obstacles to affect the currentin these cases.
At the other locations (Dschang), the depositional system wasstrongly affected by topography or channeled by valleys. This type ofignimbrite is generated by a dense pyroclastic flow current whichremains generally confined in the valley (Branney and Kokelaar, 2002).
6.4. Significance of vertical fabrics
The so-called inverse AMS fabrics, actually vertical (and generallyprolate) fabrics, are the most frequent fabrics in the WU of Nzemla IIignimbrite. Inverse fabrics have been attributed to secondary
processes (Rochette et al., 1999), such as hydrothermalism or postemplacement modification (tectonic effect), or to the presence of SDgrains in the rocks. In the samples consisting mainly of SD grains,inverse fabric can be produced by exchange of K1 and K3 positionscompared with those in which MD grains are predominant (Rochette,1988; Tarling and Hrouda, 1993; Dunlop and Ozdemir, 1997).
Taira and Scholle (1979) and Mimura (1984) demonstrated thatimbrications of paramagnetic minerals caused by grain collision canresult in higher plunges of K1 up to 30°, and even to over 50°. This mayhave occurred because of high percentages of crystals (35–45%) in theignimbrites which show inverse fabrics (Mbeng and Nzemla II).However, it may not be sufficient to explain actual nearly verticallineations and foliations.
The SPO fabric analysis has revealed that the vertical magneticfabrics are different from the SPO fabrics of all objects (Fig. 12). It isalso worth to notice that these vertical fabrics are generally tenuousand prolate. Subvertical elutriation pipes have been recognized in theupper part of incipiently welded ignimbrites of Bambili, Nzemla II(WU, GM12 and GM33) and Mbeng (DGU, GM10). Post-depositionalvertical structures were also observed in GM29. It is suggested thatthe elutriation process may have been responsible for the verticalfabrics. Tiny secondary oxide minerals may have crystallized or bedeposited in the pore boundaries produced from separation andupwards migration of dust-loaded vapor phases produced duringpost-emplacement of ignimbrites.
7. Conclusions
AMS data reported here for the Bambouto and Bamenda massifsindicate distinct transport directions of pyroclastic currents respon-sible for the ignimbritic deposits. More precisely, AMS can be usedwhen the AMS fabric has a so-called normal orientation, i.e. ischaracterized by a subhorizontal to mildly inclined imbricationfoliation. The Bambouto caldera seems to be the source of the mainignimbrite sheets of the Mount Bambouto. In Mounts Bamenda, flowpatterns indicate two different emission centers of ignimbrites. TheOku crater, located at the NE of Mount Bamenda, is the probablesource of Bambili, Sabga and Big Babanki ignimbrites, whereas Santa-Mbu caldera is the suspected source of Mbengwi, Bamenda and Mbuignimbrites.
Some sites display vertical AMS fabrics, different from the SPOfabrics of all objects (crystals, fiammes, etc.). These vertical andprolate fabrics are secondary fabrics attributed to a post-depositionalelutriation process also recognized in the field. In these cases, the clastand inclusion shape fabrics obtained by image analysis is the morereliable way to determine flow directions and sources.
Acknowledgments
Thiswork has been supported by the SCAC (Service de Coopérationet d'Action Culturelle de la France au Cameroun), EGIDE (Centrefrançais pour l'accueil et les échanges internationaux) and the FrenchGovernment. Field work was partially supported by the IRD-CORUS 2project of M. Jessell and J.L. Bouchez from LMTG (Toulouse). Technicalassistance by R. Siqueira, F. and de Parseval is warmly acknowledged.
References
Alva-Valdivia, L.M., Rosas-Elguera, J., Bravo-Medina, T., Urrutia-Fucugauchi, J., Henry, B.,Caballero, C., Rivas-Sanchez, M.L., Goguitchaichvili, A., López-Loera, H., 2005.Paleomagnetic and magnetic fabric studies of the San Gaspar ignimbrite, westernMexico: constraints on emplacement mode and source vents. J. Volcanol.Geotherm. Res. 147, 68–80.
Archanjo, C.J., Silva, M.G., Castro, J.C., Launeau, P., TRindade, R.I.F., Macedo, J.W.P., 2006.AMS and grain shape fabric of the Late Palaeozoic diamictites of the SoutheasternParaná Basin, Brazil. J. Geol. Soc. London 163, 95–106.
Ballentine, C.J., Lee, D.C., Halliday, A.N., 1997. Hafnium isotopic studies of the Cameroonline and new HIMU paradoxes. Chem. Geol. 139, 111–124.

131M. Gountié Dedzo et al. / Journal of Volcanology and Geothermal Research 203 (2011) 113–132
Bear, E.M., Fisher, R.V., Fuller, M., Valentine, G., 1997. Turbulent transport anddeposition of Ito pyroclastic flow: determinations using anisotropy of magneticsusceptibility. J. Geophys. Res. 102, 22565–22586.
Behncke, B., 2009. Hazards from pyroclastic density currents at Mt. Etna (Italy). J.Volcanol. Geotherm. Res. 180, 148–160.
Behncke, B., Calvari, S., Giammanco, S., Neri, M., Pinkerton, H., 2008. Pyroclastic densitycurrents resulting from the interaction of basaltic magma with hydrothermallyaltered rock: an example from the 2006 summit eruptions of Mount Etna. Italy.Bull. Volcanol. 70, 1249–1268. doi:10.1007/s00445-008-0200-7.
Bouchez, J.L., 2000. Anisotropie de susceptibilité magnétique et fabrique des granites.C.R. Acad. Sci. Paris 330, 1–14.
Branney, M.J., Kokelaar, P., 2002. Pyroclastic density currents and the sedimentation ofignimbrites. Geol. Soc. London Mem. 27, 152p.
Buesch, D.C., 1992. Incorporation and redistribution of locally-derived lithic fragmentswithin a pyroclastic flow. Geol. Soc. Am. Bull. 104, 1193–1207.
Cagnoli, B., Tarling, D.H., 1997. The reliability of anisotropy of magnetic susceptibility(AMS) data as flow direction indicators in friable base surge and ignimbritedeposits: Italian examples. J. Volcanol. Geotherm. Res. 75, 309–320.
Canon-Tapia, E., Walker, G.P.L., Herrero-Bervera, E., 1995. Magnetic fabric and flowdirection in basaltic pahoehoe lava of Xitle Volcano, Mexico. J. Volcanol. Geotherm.Res. 65, 249–263.
Charbonnier, S.J., Gertisser, R., 2008. Field observations and surface characteristics ofpristine block-and-ash flow deposits from the 2006 eruption of Merapi Volcano,Java, Indonesia. J. Volcanol. Geotherm. Res. 117, 971–982.
Deruelle, B., Moreau, C., Nkoumbou, C., Kambou, R., Lissom, J., Njonfang, E., Ghogomu,R.T., Nono, A., 1991. The Cameroon line: a review. In: Kampuzu, A.B., Lubala, R.T.(Eds.), Magmatism in Extensional Structural Settings. The Phanerozoic AfricanPlate. Springer-Verlag, Heidelbelg, pp. 237–274.
Déruelle, B., Ngounouno, I., Demaiffe, D., 2007. The “Cameroon Hot Line” (CHL): aunique example of active alkaline intraplate structure in both oceanic andcontinental lithospheres. C. R. Geosci. 339, 589–600.
Dunlop, D.P., Ozdemir, O., 1997. Rock magnetism: fundamentals and frontiers.Cambridge Univ. Press, Cambridge, UK. 573p.
Edmonds, M., Herd, R.A., Strutt, M.H., 2006. Tephra deposits associated with a large lavadome collapse, Soufriere Hills volcano, Montserrat, 12–15 July 2003. J. Volcanol.Geotherm Res. 153, 313–330.
Ellwood, B.B., 1982. Estimate of flow direction for calc-alkaline welded tuffs andpaleomagnetism data reliability from anisotropy of magnetic susceptibilitymeasurements: Central San Juan Mountains, southwest Colorado. Earth Planet.Sci. Lett. 59, 303–314.
Elston, W.E., Smith, E.I., 1970. Determination of flow direction of rhyolitic ash-flow tuffsfrom fluidal textures. Geol. Soc. Am. Bull. 81, 3393–3406.
Fisher, R.V., Orsi, G., Ort, M.H., Heiken, G., 1993. Mobility of a large-volume pyroclasticflow-emplacement of the Campanian Ignimbrite. Italy J. Volcanol. Geotherm. Res.56, 205–220.
Fitton, J.G., 1987. The Cameroon Line, West Africa: a comparison between oceanic andcontinental alkaline volcanism. In: Fitton, J.G., Upton, B.G.J. (Eds.), Alkaline IgneousRocks: Geol. Soc. Spec. Publ., 30, pp. 273–291.
Font, E., Ernesto, M., Silva, P.F., Correia, P.B., Nascimento, M.A.L., 2009. Palaeomagnetism,rock magnetism and AMS of the CaboMagmatic Province, NE Brazil, and the openingof South Atlantic. Geophys. J. Int.. doi:10.1111/j.1365-246X.2009.04333.x
Fosso, J., Menard, J.-J., Bardintzeff, J.-M., Wandji, P., Tchoua, F.M., Bellon, H., 2005. Leslaves du Mount Bangou: une première manifestation volcanique éocène, à affinitétransitionnelle, de la Ligne du Cameroun. C. R. Géosci. 337, 315–325.
Froggatt, P.C., Wilson, C.J.N., Walker, G.P.L., 1981. Orientation of logs in the Taupoignimbrite as an indicator of flow direction and vent position. Geology 9,109–111.
Giordano, G., Porreca, M., Musacchio, P., Mattei, M., 2008. The Holocene Secche diLazzaro phreatomagmatic succession (Stromboli, Italy): evidence of pyroclasticdensity current origin deduced by facies analysis and AMS flow directions. Bull.Volcanol. 70, 1221–1236.
Gouhier, J., Nougier, J., Nougier, D., 1974. Contribution à l'étude volcanologique duCameroun («Ligne du Cameroun»-Adamawa), 17. Ann. Fac. Sci. Univ, YaoundéCameroun, pp. 3–48.
Gountié Dedzo, M., Nono, A., Njonfang, E., Zangmo Tefogoum, G., Kagou Dongmo, A.,Nkouathio, D.G., 2009. Le volcanisme ignimbritique de la Ligne du Cameroun(Mounts Bambouto et Bamenda, Ouest-Cameroun): signification dans la genèsedes caldeiras. Int. Coll. 3MA Beni Mellal, April 23–24. Morocco, pp. 74–75.
Grégoire, V., Darrozes, J., Gaillot, P., Nédélec, A., Launeau, P., 1998. Magnetite grainshape fabric and distribution anisotropy versus rock magnetic fabric: a 3D-casestudy. J. Struct. Geol. 20, 937–944.
Hart, K., Carey, S., Sigurdsson, H., Sparks, R.S.J., Robertson, R.E.A., 2004. Discharge ofpyroclastic flows into the sea during the 1996–1998 eruptions of the Soufriere Hillsvolcano. Montserrat. Bull Volc. 66, 599–614.
Hillhouse, J.W., Wells, R.E., 1991. Magnetic fabric, flow directions, and source area of thelower Miocene Peach Springs Tuff in Arizona, California, and Nevada. J. Geophys.Res. 96, 12443–12460.
Incoronato, A., Addison, F.T., Tarling, D.H., Nardi, G., Pescatore, T., 1983. Magnetic fabricinvestigations of pyroclastic deposits from Phlegrean Fields, southern Italy. Nature306, 461–463.
Itiga, Z., Chakam Tagheu, P.J., Wotchoko, P., Wandji, P., Bardintzeff, J.M., Bellon, H., 2004.La Ligne du Cameroun: volcanologie et géochronologie de trois régions (MountManengouba, plaine du Noun et Tchabal Gangdaba). Géochronique 91, 13–16.
Jackson, M., Rochette, P., Filon, G., Banerjee, S., Marvin, J., 1993. Rock magnetism ofremagnetized Paleozoic carbonates: low-temperature behavior and susceptibilitycharacteristics. J. Geophys. Res. 98, 6217–6225.
Jackson, M., Sun, W.W., Craddock, J.P., 1992. The rock magnetic fingerprint of chemicalremagnetization in midcontinental paleozoic carbonates. Geophys. Res. Lett. 19,781–784.
Jelinek, V., 1981. Characterization of the magnetic fabric of rocks. Tectonophysics 79,563–567.
Jelinek, V., 1978. Statistical processing of anisotropy of magnetic susceptibilitymeasured on groups of specimens. Stud. Geophys. Geod. 22, 50–62.
Kagou Dongmo, A., Nkouathio, D.G., Pouclet, A., Bardintzeff, J.-M., Wandji, P., Nono, A.,Guillou, H., 2010. The discovery of Late Quaternary basalt on Mount Bambouto:implications for recent widespread volcanic activity in the southern CameroonLine. J. Afr. Earth. 57, 87–108.
Kamata, H., Mimura, K., 1983. Flow directions inferred from imbrication in the Handapyroclastic flow deposit in Japan. Bull. Volcanol. 46, 277–282.
Kamgang, P., Njonfang, E., Chazot, G., Tchoua, F.M., 2007. Géochimie et géochronologiedes laves felsiques des Mounts Bamenda (ligne volcanique du Cameroun). C. RGéoscience 339, 659–666.
Kamgang, P., Chazot, G., Njonfang, E., Tchoua, F.M., 2008. Geochemistry andgeochronology of mafic rocks from Bamenda Mountains (Cameroon): sourcecomposition and crustal contamination along the Cameroon Volcanic Line. C. RGéoscience 340, 850–857.
Knight, M.D., Walker, G.P.L., Ellwood, B.B., Diehl, J.F., 1986. Stratigraphy, paleomagne-tism and magnetic fabric of the Toba tuffs; constraints on the sources and eruptivestyle. J. Geophys. Res. B 91, 10355–10382.
Kruiver, P.P., Dekkers, M.J., Heslop, D., 2001. Quantification of magnetic coercivitycomponents by the analysis of acquisition curves of isothermal remanentmagnetization. Earth planet. Sci. Lett. 189, 269–276.
LaBerge, R.D., Porreca, M., Massimo Mattei, M., Giordano, G., Cas, R.A.F., 2008.Meandering flow of a pyroclastic density current documented by the anisotropyof magnetic susceptibility (AMS) in the quartz latite ignimbrite of the PleistoceneMounte Cimino volcanic centre (central Italy). Tectonophysics 466, 64–78.
Launeau, P., 2004. Evidence of magnetic flow by 2-D image analysis of 3-D shapepreferred orientation distributions. Bull. Soc. Géol. Fr. 175, 331–350.
Launeau, P., Robin, P.Y., 2005. Determination of fabric and strain ellipsoids frommeasured sectional ellipses—implementation and applications. J. Structural Geolog.27, 2223–2233.
Launeau, P., Archanjo, C.J., Picard, D., Arbaret, L., Robin, P.Y., 2010. Two- and three-dimensional shape fabric analysis by the intercept method in grey levels.Tectonophysics 492, 230–239.
Le Pennec, J.L., Chen, Y., Diot, H., Froger, J.L., Gourgaud, A., 1998. Interpretation ofanisotropy of magnetic susceptibility fabric of ignimbrites in terms of kinematicand sedimentological mechanisms: an Anatolian case-study. Earth Planet. Sci. Lett.157, 105–127.
Le Pennec, J.L., 2000. Identifying ash flow sources with directional data: an applica-tion to the Kizilkaya ignimbrite, central Anatolia. J. Geophys. Res. B 105,28427–28441.
Lee, D.C., Halliday, A.N., Fitton, J.G., Poli, G., 1994. Isotopic variations with distance andtime in the volcanic islands of the Cameroon Line: evidence for a mantle plumeorigin. Earth Planet Sci Lett. 123, 119–138.
MacDonald, W.D., Palmer, H.C., Hayatsu, A., 1998. Structural rotation and volcanicsource implications of magnetic data from Eocene volcanic rocks. SW Idaho. EarthPlanet Sci Lett. 156, 225–237.
Marzoli, A., Piccirillo, E.M., Renne, P.R., Bellieni, G., Iacumin, M., Nyobe, J.B., Tongwa,A.T., 2000. The Cameroon volcanic Line revisited: petrogenesis of continentalbasaltic magma from lithospheric and asthenospheric mantle source. J. Petrol.41, 87–109.
McDonald, W.D., Palmer, H.C., 1990. Flow directions in ash flow tuffs: a comparison ofgeological and magnetic susceptibility measurements. Tshirege member (upperBandelir Tuff) Valles caldera. New Mexico. USA. Bull. Volcanol. 53, 45–59.
Mimura, K., 1984. Imbrication, flow direction and possible source areas of the pumice-flow tuffs near Bend, Oregon. USA. J. Volcanol. Geotherm. Res. 21, 45–60.
Moundi, A., Wandji, P., Bardintzeff, J.-M., Ménard, J.-J., Okomo Atouba, L.C., FaroukMouncherou, O., Reusser, E., Bellon, H., Tchoua, F.M., 2007. Les basaltes Eocène àaffinité transitionnelle du plateau Bamoun, témoins d'un réservoir mantelliqueenrichi sous la ligne volcanique du Cameroun. C. R. Géosciences 339, 831–837.
Ngako, V., Njonfang, E., Tongwa Aka, F., Affaton, P., Metuk Nnange, J., 2006. The North–South Paleozoic to Quaternary trend of alkaline magmatism from Niger-Nigeria toCameroon: complex interaction between hotspots and Precambrian faults. J AfrEarth Sci 45, 241–256.
Njonfang, E., Nono, A., 2003. Clinopyroxene from some felsic alkaline rocks of theCameroon Line, Central Africa: petrological implications. Eur. J. Mineral. 15, 527–542.
Nkouathio, D.G., Ménard, J.-J., Wandji, P., Bardintzeff, J.-M., 2002. The Tombel graben(West Cameroon): a recent monogenetic volcanic field of the Cameroon Line. J. Afr.Earth Sci. 35, 285–300.
Nkouathio, D.G., Kagou Dongmo, A., Bardintzeff, J.-M., Wandji, P., Bellon, H., Pouclet, A.,2008. Evolution of volcanism in graben and horst structures along the CenozoicCameroon Line (Africa): implications for tectonic evolution and mantle sourcecomposition. . 94, 287–303.
Nono, A., Nkouathio, D.G., Gountié Dedzo, M., Njonfang, E., Kagou Dongmo, A., Tchoua,F.M., 2003. Zonal and vertical variations in welding rate and composition ofignimbrites in the Bambouto volcano (Cameroon Line, Central Africa): volcano-logical importance. Geophys. Res. Abstr. 5, 14541.
Nono, A., Njonfang, E., Kagou Dongmo, A., Nkouathio, D.G., Tchoua, F.M., 2004.Pyroclastic deposits of the Bambouto Volcano (Cameroon Line, Central Africa):evidence of a strombolian initial phase. J. Afr. Earth. Sci. 39, 409–414.
Nzolang, C., Kagami, H., Nzenti, P., Hotz, F., 2003. Geochemistry and preliminary Sr–Ndisotopic data on the Neoproterozoic granitoids from the Bantoum Area, West

132 M. Gountié Dedzo et al. / Journal of Volcanology and Geothermal Research 203 (2011) 113–132
Cameroon: evidence for a derivation from a Paleoproterozoic to Archean crust.Polar Geoscience 16, 196–226.
Ort, M.H., 1993. Eruptive processes of caldera formation in a nested downsag-collapsecaldera: Cerro Panizos, central Andes Mountains. J. Volcanol. Geotherm. Res. 56,221–252.
Ort, M.H., Orsi, G., Pappalardo, L., 2003. Anisotropy of magnetic susceptibility studies ofdepositional processes in the Campanian Ignimbrite. Italy. Bull. Volcanol. 65, 55–72.doi:10.1007/s00445-002-0241-2.
Ort, M.H., Rosi, M., Anderson, C.D., 1999. Correlation of deposits and vent locations ofthe proximal Campanian Ignimbrite deposits, Campi Flegrei, Itali, based on naturalremanent magnetization and anisotropy of magnetic susceptibility characteristics.J. Volcanol. Geotherm. Res. 91, 167–178.
Palmer, H.C., Macdonald, W.D., Hayatsu, A., 1991. Magnetic, structural and geochro-nologic evidence bearing on volcanic sources and Oligocene deformation of ashflow tuffs, northeast Nevada. J. Geophys. Res. 96, 2185–2202.
Palmer, H.C., MacDonald, W.D., 1999. Anisotropy of magnetic susceptibility in relationto source vents of ignimbrites: empirical observations. Tectonophysic 307,207–218.
Petronis, M.S., Geissman, J.W., 2008. Anisotropy of magnetic susceptibility data bearingon the transport direction of mid-tertiary regional ignimbrites, Candelaria Hillsarea, West-Central Nevada. Bull. Volcanol. 69, 930–951. doi:10.1007/s00445-008-0212-3.
Porreca, M., Mattei, M., Giordano, G., De Rita, D., Funiciello, R., 2003. Magnetic fabric andimplications for pyroclastic flow and lahar emplacement, Albano maar. Italy. J.Geophys. Res. B 108, 2264. doi:10.1029/2002JB002102.
Potter, D.B., Oberthal, C.M., 1987. Vent sites and flow directions of the Otowi ash flows(lower Bandelier Tuff), New Mexico. Geol. Soc. Amer. Bull. 98, 66–76.
Rochette, P., 1987. Magnetic susceptibility of the rock matrix related to magnetic fabricstudies. J. Struct. Geol. 9, 1015–1020.
Rochette, P., 1988. Inverse magnetic fabrics in carbonate-bearing rocks. Earth Planet.Sci. Lett. 90, 229–237.
Rochette, P., Aubourg, C., Perrin, M., 1999. Is this magnetic fabric normal? A review andcase studies in volcanic formations. Tectonophysics 307, 219–234.
Robertson, D.J., France, D.E., 1994. Discrimination of remanence-carrying minerals inmixtures, using isothermal remanent magnetization acquisition curves. Phys. Earthplanet. Inter. 82, 223–234.
Robin, P.Y., 2002. Determination of fabric and strain ellipsoids frommeasured sectionalellipses — theory. Journ. Struct. Geol. 24, 531–544.
Saviulo, G., Secco, L., Marzoli, A., Piccirillo, E.M., Nyobe, J.B., 2000. Ca-rich pyroxene frombasic and silicic volcanic rocks from the Cameroon Volcanic Line (West-Africa):crystal chemistry and petrological relationships. . 70, 73–88.
Seaman, S.J., McIntosh, W.C., Geissman, J.W., Williams, M.L., Elston, W.E., 1991.Magnetic fabrics of the Bloodgood Canyon and Shelley Peak Tuffs, southwesternNew Mexico: implications for emplacement and alteration processes. Bull.Volcanol. 53, 460–476.
Seaman, S.J., Williams, M.L., 1992. Center-to-center analysis and flow fabric character-ization in ash-flow tuffs. Bull. Volcanol. 54, 319–328.
Suzuki, K., Ui, T., 1982. Grain orientation and depositional ramps as flow directionindicators of large-scale pyroclastic flow deposits, Japan. Geology 10, 429–432.
Suzuki, K., Ui, T., 1983. Factors governing the flow lineation of a large-scale pyroclasticflow an example in the Ata pyroclastic flow deposit. Japan. Bull. Volcanol. 46, 71–81.
Suzuki, K., Ui, T., 1988. Depositional ramps: asymmetrical distribution structure in theAta pyroclastic flow deposit. Japan. Bull. Volcanol. 50, 26–34.
Taira, A., Scholle, P.A., 1979. Deposition of resedimented sandstone beds in the Picoformation, Ventura Basin, California, as interpreted from magnetic fabricsmeasurements. Geol. Soc. Am. Bull. 90, 952–962.
Tarling, D.H., Hrouda, F., 1993. The magnetic anisotropy of rocks. Capman and Hall,London. 217p.
Tchoua, F.M., 1973. Sur l'existence d'une phase initiale ignimbritique dans levolcanisme des Mounts Bambouto (Cameroun). C.R. Acad. Sci. Paris 276,2863–2866.
Toteu, S.F., Van Schmus, W.R., Penaye, J., Michard, A., 2001. New U–Pb and Sm–Nd datafrom north Cameroon and its bearing on the pre-Pan African history of centralAfrica. Precamb. Res. 108, 45–73.
Ui, T., Suzuki-Kamata, K., Matsusue, R., Fujita, K., Metsugi, H., Araki, M., 1989. Flowbehavior of large-scale flows. Evidence obtained from petrofabric analysis. Bull.Volcanol. 51, 115–122.
Wang, X., Roberts, J., Schmidt, P., 2001. Flow directions of carboniferous ignimbrites,southern New England Oregon, Australia, using anisotropy of magnetic suscepti-bility. J. Volcanol. Geotherm. Res. 110, 1–25.
Wolff, J.A., Ellwood, B.B., Sachs, S.D., 1989. Anisotropy of magnetic susceptibility inwelded tuffs: application to a welded-tuff dyke in the Tertiary Trans-Pecos Texasvolcanic province. USA. Bull. Volcanol. 51, 299–310.
Youmen, D., Schmincke, H.-U., Lissom, J., Etame, J., 2005. Données géochronologiques :mise en évidence des différentes phases volcaniques au Miocène dans les montsBambouto (Ligne du Cameroun). Sci. Technol. Dev. 11, 49–57.


![Transport properties of pyroclastic rocks from … · canmodifytheiroriginalpetrophysicalcharacteristics[Fisher, 1998; Flint, 2003; Flint and Selker, 2003]. ... samples, mainly pyroclastic](https://static.fdocuments.net/doc/165x107/5b7728a97f8b9ad2498c1d87/transport-properties-of-pyroclastic-rocks-from-canmodifytheiroriginalpetrophysicalcharacteristicsfisher.jpg)


