Molecular cloning of Erwinia chrysanthemi pectinase and cellulase
*Corresponding author, e-mail:[email protected]
Research Article GU J Sci 34(2): 335-353 (2021) DOI:10.35378/gujs.808326
Gazi University
Journal of Science
http://dergipark.gov.tr/gujs
Optimization of Endo-Pectinase and Pectin Lyase Production from Wheat
Bran by Bacillus pumilus using Response Surface Methodology
Ozlem TEPE* , Arzu Y. DURSUN
Fırat University, Faculty of Engineering, Department of Environmental Engineering, 23119, Elazig, Turkey
Highlights
• This paper focuses on pectin lyase and endo-pectinase synthesis from wheat bran by Bacillus pumilus.
• RSM was employed.
• Optimum conditions for enzyme production were obtained.
Article Info
Abstract
Wheat bran is one of the most used agricultural residues for enzyme synthesis. It has a high
organic content; thus, it causes environmental pollution. In this study, wheat bran was selected as
a carbon source and it was supplemented with yeast extract and ammonium sulphate. Endo-
pectinase and pectin lyase production by Bacillus pumilus was performed in a batch system. RSM
was applied to examine the effects of the wheat bran, yeast extract and ammonium sulphate
concentrations on the synthesis of enzymes and the dosages of these nutrients were optimized.
According to the model design, the optimum conditions were 4.74% w/v wheat bran, 0.12%
ammonium sulphate and 0.12% yeast extract. The high values of R2 and R2adj indicated that the
fitted model showed good agreement with the predicted and actual values. In conclusion, these
studies revealed that wheat bran can be used for the production of endo-pectinase and pectin lyase
enzymes based on high enzyme activities.
Received: 09 Oct 2020 Accepted: 30 Nov 2020
Keywords
Endo-pectinase
Optimization, Pectin lyase,
Response surface
methodology (RSM),
Wheat bran
1. INTRODUCTION
Pectic substances are complex polysaccharides of higher plants and are found mainly in the middle lamella
between cells in tissues [1]. Pectin, protopectin, pectinic acid and pectic acid are basic types of pectic
substances. Pectinases are clusters of enzymes that break down pectic substances by various mechanisms.
They are classified as protopectinases, esterases and depolymerases, according to the attack mechanism on
the galacturonan part of the pectin molecule. Protopectinases are involved in the degradation of insoluble
protopectin and provide the formation of highly polymerized soluble pectin. Esterases remove methoxy
esters by catalyzing the de-esterification of pectin. Depolymerases are the enzymes that act on pectic
substances by hydrolyzing the glycosidic linkages between galacturonic monomers or cleaving α-1,4-
glycosidic linkages by trans-elimination [2-4]. Pectinolytic enzymes are among the first enzymes that were
used in households. Their industrial usage began in 1930 with the production of fruit juice and wine [5].
Today, pectinolytic enzymes account for approximately 25% of the world’s manufacturing of food
enzymes. Pectinases have widespread usages in the textile, paper, food manufacturing, tea and coffee
fermentation, olive oil industries and in the treatment of pectic wastewater [6,7]. They are used as juice
yield and color enhancers, clarifies, and in fruit mash treatment in the fruit juice industry [8,9]. They are
also used in the clarification of wine [10]. Pectinases are also classified as alkaline pectinases and acidic
pectinases according to their usage area. Alkaline pectinase is synthesized efficiently by bacterial sources
and are primarily utilized in the textile industries and for pectic wastewater pretreatment occurring from
the fruit juice industry. Acidic pectinases produced by fungi are used in the fruit juice industry [4].
336 Ozlem TEPE, Arzu Y. DURSUN/ GU J Sci, 34(2): 335-353(2021)
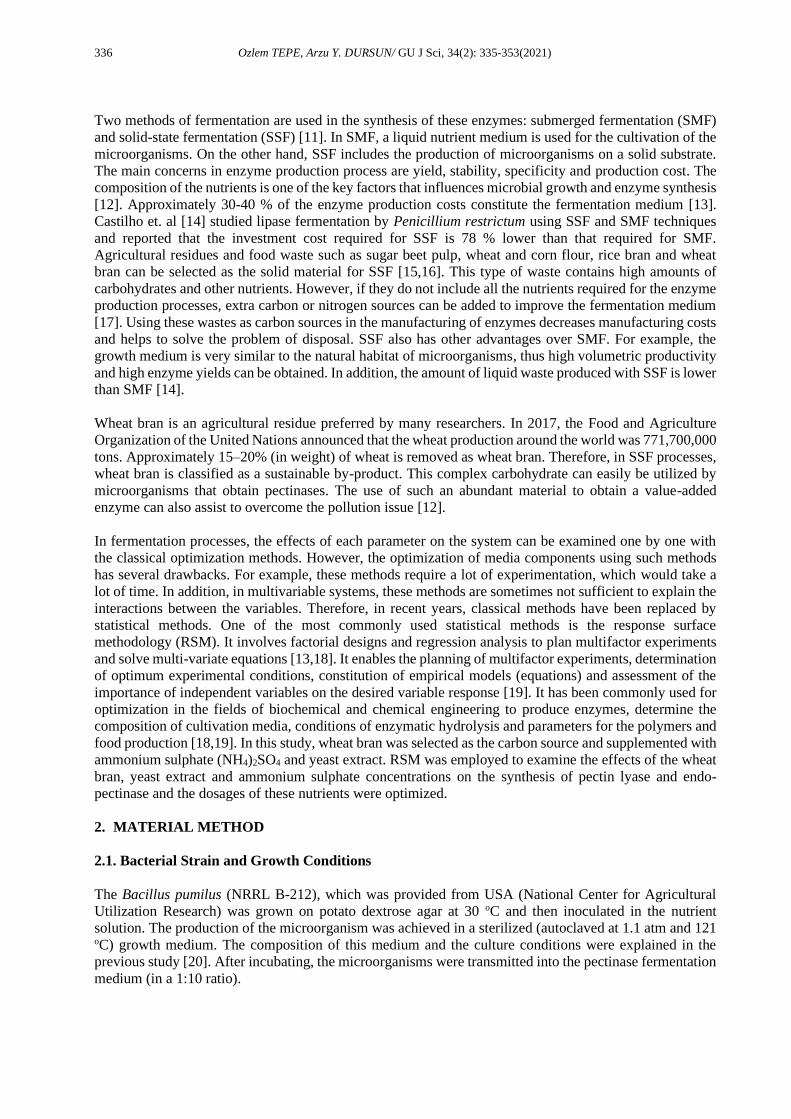
Two methods of fermentation are used in the synthesis of these enzymes: submerged fermentation (SMF)
and solid-state fermentation (SSF) [11]. In SMF, a liquid nutrient medium is used for the cultivation of the
microorganisms. On the other hand, SSF includes the production of microorganisms on a solid substrate.
The main concerns in enzyme production process are yield, stability, specificity and production cost. The
composition of the nutrients is one of the key factors that influences microbial growth and enzyme synthesis
[12]. Approximately 30-40 % of the enzyme production costs constitute the fermentation medium [13].
Castilho et. al [14] studied lipase fermentation by Penicillium restrictum using SSF and SMF techniques
and reported that the investment cost required for SSF is 78 % lower than that required for SMF.
Agricultural residues and food waste such as sugar beet pulp, wheat and corn flour, rice bran and wheat
bran can be selected as the solid material for SSF [15,16]. This type of waste contains high amounts of
carbohydrates and other nutrients. However, if they do not include all the nutrients required for the enzyme
production processes, extra carbon or nitrogen sources can be added to improve the fermentation medium
[17]. Using these wastes as carbon sources in the manufacturing of enzymes decreases manufacturing costs
and helps to solve the problem of disposal. SSF also has other advantages over SMF. For example, the
growth medium is very similar to the natural habitat of microorganisms, thus high volumetric productivity
and high enzyme yields can be obtained. In addition, the amount of liquid waste produced with SSF is lower
than SMF [14].
Wheat bran is an agricultural residue preferred by many researchers. In 2017, the Food and Agriculture
Organization of the United Nations announced that the wheat production around the world was 771,700,000
tons. Approximately 15–20% (in weight) of wheat is removed as wheat bran. Therefore, in SSF processes,
wheat bran is classified as a sustainable by-product. This complex carbohydrate can easily be utilized by
microorganisms that obtain pectinases. The use of such an abundant material to obtain a value-added
enzyme can also assist to overcome the pollution issue [12].
In fermentation processes, the effects of each parameter on the system can be examined one by one with
the classical optimization methods. However, the optimization of media components using such methods
has several drawbacks. For example, these methods require a lot of experimentation, which would take a
lot of time. In addition, in multivariable systems, these methods are sometimes not sufficient to explain the
interactions between the variables. Therefore, in recent years, classical methods have been replaced by
statistical methods. One of the most commonly used statistical methods is the response surface
methodology (RSM). It involves factorial designs and regression analysis to plan multifactor experiments
and solve multi-variate equations [13,18]. It enables the planning of multifactor experiments, determination
of optimum experimental conditions, constitution of empirical models (equations) and assessment of the
importance of independent variables on the desired variable response [19]. It has been commonly used for
optimization in the fields of biochemical and chemical engineering to produce enzymes, determine the
composition of cultivation media, conditions of enzymatic hydrolysis and parameters for the polymers and
food production [18,19]. In this study, wheat bran was selected as the carbon source and supplemented with
ammonium sulphate (NH4)2SO4 and yeast extract. RSM was employed to examine the effects of the wheat
bran, yeast extract and ammonium sulphate concentrations on the synthesis of pectin lyase and endo-
pectinase and the dosages of these nutrients were optimized.
2. MATERIAL METHOD
2.1. Bacterial Strain and Growth Conditions
The Bacillus pumilus (NRRL B-212), which was provided from USA (National Center for Agricultural
Utilization Research) was grown on potato dextrose agar at 30 oC and then inoculated in the nutrient
solution. The production of the microorganism was achieved in a sterilized (autoclaved at 1.1 atm and 121 oC) growth medium. The composition of this medium and the culture conditions were explained in the
previous study [20]. After incubating, the microorganisms were transmitted into the pectinase fermentation
medium (in a 1:10 ratio).

337 Ozlem TEPE, Arzu Y. DURSUN/ GU J Sci, 34(2): 335-353(2021)
2.2. Production of Endo- Pectinase and Pectin Lyase with Agricultural Wastes
Wheat bran used in the SSF studies was obtained locally. Firstly, it was washed then dried in an oven at 60 oC for 24 h. The dried materials were then milled and sized (20-100 mesh). The solid material was placed
Erlenmeyer flasks (250 mL) for enzyme production. The flasks were then sterilized for 15 minutes at a
temperature of 121 ◦C and cooled to room temperature. The tap water was used for hydrating the dried
materials. After inoculation with liquid culture (10%, v/v), enzyme production experiments were conducted
at 30 °C, pH 8 and 150 rpm. The enzyme activity measurements were performed for the samples centrifuged
at 5000 rpm for 5 minutes.
2.3. Determination of Pectin Lyase and Endo-Pectinase Activities
The thiobarbituric acid method defined by Nedjma et al. [21] was used for the assay of pectin lyase activity.
The method was explained in detail in our previous study [22].
Endo pectinase activity was measured viscosimetrically using a vibroviscometer (SV10, Sine Wave Vibro
Viscometer, A&D Engineering) [23]. The reaction mixtures consisted of 1 mL of enzyme solution and 19
mL of 0.5 % (w/v) apple pectin in a 0.05 M glycine-NaOH buffer (pH 10). This solution was heated at 30 oC for 15 min. After incubation, the reduction in viscosity was monitored by a vibroviscometer. Under these
conditions, the enzyme quantity reduced the initial solution viscosity by 50% per minute was determined
as one unit of endo pectinase activity.
2.4. Optimization of Enzyme Production Process Parameters
In the present study, the relationship between the substrates and enzyme production was investigated using
RSM. As a full factorial matrix, a central composite design (CCD) was applied to reveal the parameters
influencing enzyme activity. According to a full factorial design, the value of α is equal to (2k)1/4. In this
study, the values of k and α were equal to 3 and 1.68179, respectively. Concentrations of wheat bran,
(NH4)2SO4 and yeast extract were used as numeric factors. To obtain a second order response surface, their
quantities were changed at five different levels (-α, −1, 0, +1, +α) (Table 1). The maximum and minimum
values of the substrate concentrations were selected according to the results of the initial tests. A total of
20 experiments were planned using this full factorial matrix. These experiments contained six center points,
six axial points and eight factorial points with six replicates around center point (Table 2). Design Expert
software Ver 7.0 (Stat Ease Inc.) statistical package was used to calculate and analyze of the second-order
polynomial coefficients.
Table 1. Levels of the parameters in CCD
Independent variables
(concentration, w/v %)
Symbol
code
Range and levels
- 1.682(-) -1 0 +1 +1.682(+)
Wheat bran A 2.0 3.22 5.0 6.78 8.0
Ammonium sulphate B 0.0 0.12 0.3 0.48 0.6
Yeast extract C 0.0 0.12 0.3 0.48 0.6
3. RESULTS AND DISCUSSION
In this study, wheat bran was selected as the carbon source and supplemented with (NH4)2SO4 and yeast
extract. RSM was applied to examine the effects of the substrate concentrations on the synthesis of pectin
lyase and endo-pectinase and dosages of these nutrients were optimized. The concentrations of the
substrates were selected as the independent variables. Table 1 shows the levels and the range of these
variables, while Table 2 presents the coded values of the factors, design and results of the experiments. The
experimental findings showed that the pectin lyase and endo-pectinase activities matched to the second-
order quadratic equation, providing two numerical correlations to predict the enzyme activity responses.
The following model equations (Equations (1) and (2), in the coded factors) were proposed for the endo
pectinase and pectin lyase activities, respectively:

338 Ozlem TEPE, Arzu Y. DURSUN/ GU J Sci, 34(2): 335-353(2021)
Endo-pectinase activity = +174.50 + 0.29 A -9.20 B -22.25 C +0.32AB -3.56 AC +24.27 BC -34.07A2 -
5.27 B2 -24.49 C2 (1)
Pectin lyase activity = +26.26 -2.15 A -4.74 B -10.72 C -2.16 AB +2.30 AC +4.21BC -8.01A2 +0.26B2-1.0
C2. (2)
Table 2. CCD matrix, Response factor results
As can be seen from Equation (1), A, AB and BC had positive influences on the endo pectinase activity,
whereas the other parameters had adverse effects. Similarly, AC, BC and B2 also had positive influences on
the pectin lyase activity.
The significance of these seconder order equations was analyzed statistically using variance analysis. The
ANOVA results of models showed that they could be used to navigate the design field (Tables 3-6). The
very low P-value (˂0.0001) and the F-value (30.01) of model for the endo pectinase activity demonstrated
that it was highly significant within a 95% confidence interval. For the pectin lyase activity, the F-value of
model (4.85) indicated that the model was important. The probability of a large Model F-Value due to noise
was only 1.07%. A high correlation between the experimental and predicted activity values was indicated
by the value of the determination coefficient R2 for the endo-pectinase activity (0.9643). This showed that
the regression model explained the relationship between the endo pectinase activity and the wheat bran
amount, (NH4)2SO4 and yeast extract concentrations well. In addition, this indicated that 96.43% of the
variation for the endo-pectinase activity was explained by the wheat bran, (NH4)2SO4 and yeast extract
concentrations and it could not describe only 3.57% of the variation. The adjusted R2 of 0.9322 was too
high to indicate that the it had a high significance [24]. The adjusted R2 arranges the R2 values. If there are
a few variables in a model and the sample size is not very large, the R2 may be clearly higher than the
adjusted R2. The predicted R2 of 0.7382 and the adjusted R2 of 0.9322 were in reasonable agreement. It had
a partially high determination coefficient (R2 =0.8136) for the pectin lyase activity. When the R2 values are
less than 0.75, models generally show an inadequate definition of experimental data. The determination
coefficient for a good model fit should be at least 0.80 [25]. The coefficient of variation (CV=8.81%) for
the endo pectinase activity was relatively low. This revealed that the experiments were more accurate and
Runs
Variables Responses
Endo-pectinase activity
(U/mL) R1
Pectin lyase activity (U/mL)
R2
A B C Exp. Predic.
Exp. Predic.
1 -1 1 -1 90.61 95.27 29.67 25.90
2 +1.682 0 0 93.38 78.62 9.77 8.587E-004
3 0 0 0 167.31 174.50 23.90 26.26
4 1 1 1 85.44 100.55 6.20 4.25
5 0 +1.682 0 150.16 144.12 11.73 19.03
6 0 0 0 173.46 174.50 23.80 26.26
7 1 -1 -1 157.93 169.92 24.33 34.91
8 0 0 0 178.64 174.50 24.40 26.26
9 0 0 -1.682 144.98 142.65 49.07 41.47
10 1 -1 1 62.14 69.76 1.73 9.64
11 0 0 0 175.08 174.50 27.80 26.26
12 -1 1 1 106.15 106.44 14.73 8.29
13 1 1 -1 103.56 103.61 9.43 12.67
14 0 0 0 178.64 174.50 29.87 26.26
15 -1 -1 -1 165.70 162.87 33.40 39.49
16 -1.682 0 0 80.26 77.65 3.32 7.24
17 0 0 +1.682 82.85 67.81 3.65 5.40
18 -1 -1 1 64.72 76.95 4.13 5.02
19 0 -1.682 0 186.41 175.08 48.13 34.98
20 0 0 0 170.87 174.50 26.80 26.26
339 Ozlem TEPE, Arzu Y. DURSUN/ GU J Sci, 34(2): 335-353(2021)
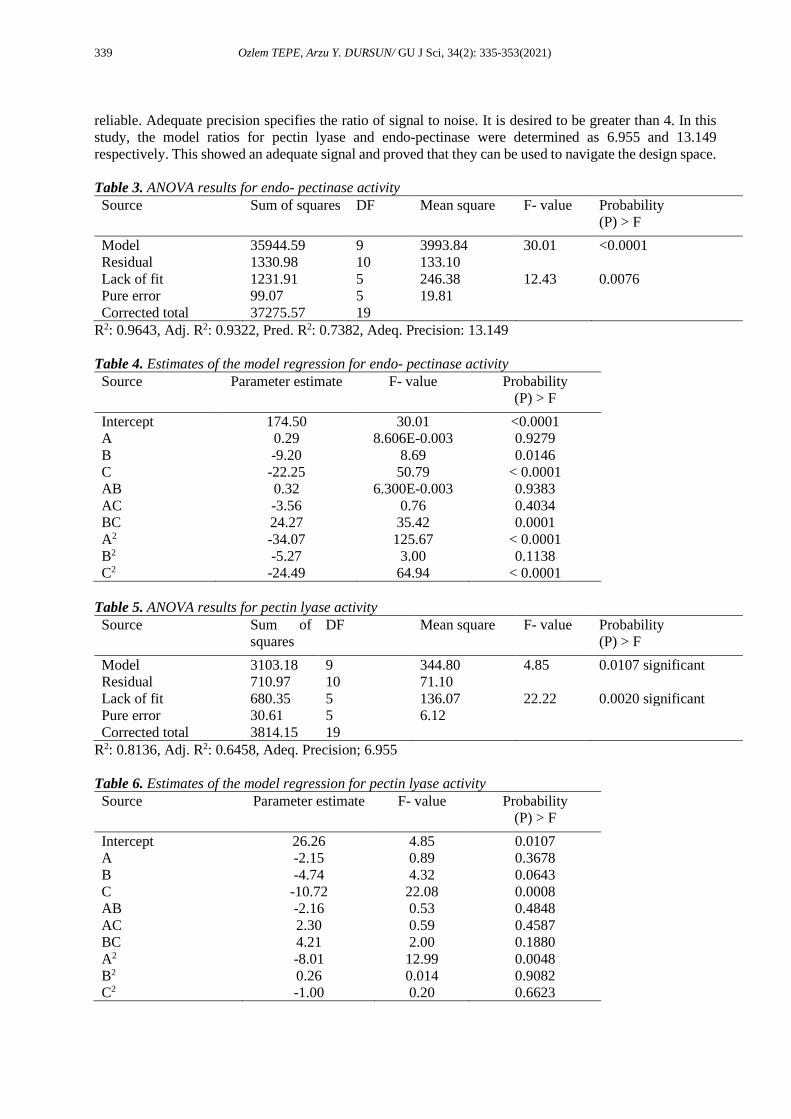
reliable. Adequate precision specifies the ratio of signal to noise. It is desired to be greater than 4. In this
study, the model ratios for pectin lyase and endo-pectinase were determined as 6.955 and 13.149
respectively. This showed an adequate signal and proved that they can be used to navigate the design space.
Table 3. ANOVA results for endo- pectinase activity
Source
Sum of squares DF Mean square F- value Probability
(P) > F
Model 35944.59 9 3993.84 30.01 <0.0001
Residual 1330.98 10 133.10
Lack of fit 1231.91 5 246.38 12.43 0.0076
Pure error 99.07 5 19.81
Corrected total 37275.57 19
R2: 0.9643, Adj. R2: 0.9322, Pred. R2: 0.7382, Adeq. Precision: 13.149
Table 4. Estimates of the model regression for endo- pectinase activity
Source
Parameter estimate F- value Probability
(P) > F
Intercept 174.50 30.01 <0.0001
A 0.29 8.606E-0.003 0.9279
B -9.20 8.69 0.0146
C -22.25 50.79 < 0.0001
AB 0.32 6.300E-0.003 0.9383
AC -3.56 0.76 0.4034
BC 24.27 35.42 0.0001
A2 -34.07 125.67 < 0.0001
B2 -5.27 3.00 0.1138
C2 -24.49 64.94 < 0.0001
Table 5. ANOVA results for pectin lyase activity
Source
Sum of
squares
DF Mean square F- value Probability
(P) > F
Model 3103.18 9 344.80 4.85 0.0107 significant
Residual 710.97 10 71.10
Lack of fit 680.35 5 136.07 22.22 0.0020 significant
Pure error 30.61 5 6.12
Corrected total 3814.15 19
R2: 0.8136, Adj. R2: 0.6458, Adeq. Precision; 6.955
Table 6. Estimates of the model regression for pectin lyase activity
Source
Parameter estimate F- value Probability
(P) > F
Intercept 26.26 4.85 0.0107
A -2.15 0.89 0.3678
B -4.74 4.32 0.0643
C -10.72 22.08 0.0008
AB -2.16 0.53 0.4848
AC 2.30 0.59 0.4587
BC 4.21 2.00 0.1880
A2 -8.01 12.99 0.0048
B2 0.26 0.014 0.9082
C2 -1.00 0.20 0.6623

340 Ozlem TEPE, Arzu Y. DURSUN/ GU J Sci, 34(2): 335-353(2021)
The significance of the model terms can be revealed by p-values [26]. Model terms with p-values less than
0.05 are important. In this situation, B, C, BC, A2 and C2 are important model terms for endo pectinase
activity. The linear and quadratic effects of the yeast extract concentration (C and C2) and the quadratic
effect of the wheat bran concentration (A2) (P<0.0001) were more significant than the other factors. The
effect of interaction between (NH4)2SO4 and the yeast extract concentration (BC) (probability coefficient
P= 0.0001) was highly important. The linear effect of (NH4)2SO4 concentration (B) (probability coefficient
P= 0.0146) was significant. The other terms had no significance. C and A2 were significant model terms in
the pectin lyase activity. The linear effect of yeast extract concentration (C) (P=0.0008) was an important
factor. In addition, the quadratic effect of wheat bran concentration (A2) (P=0.0048) was significant.
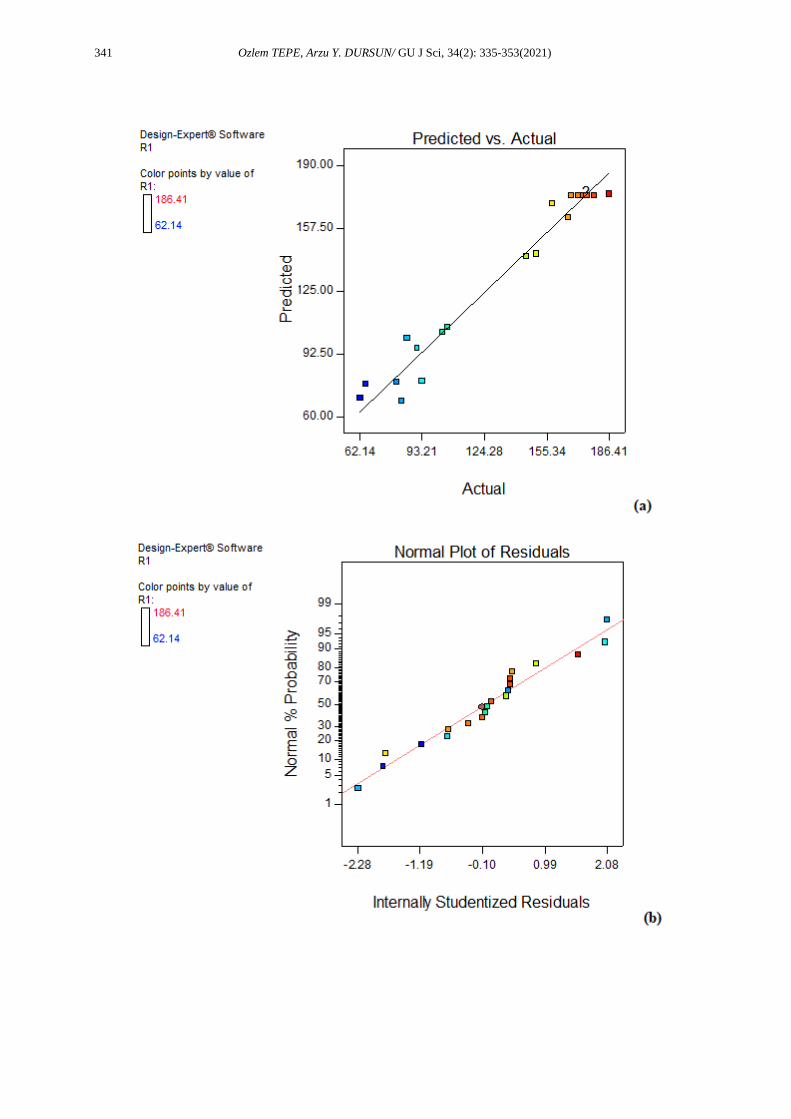
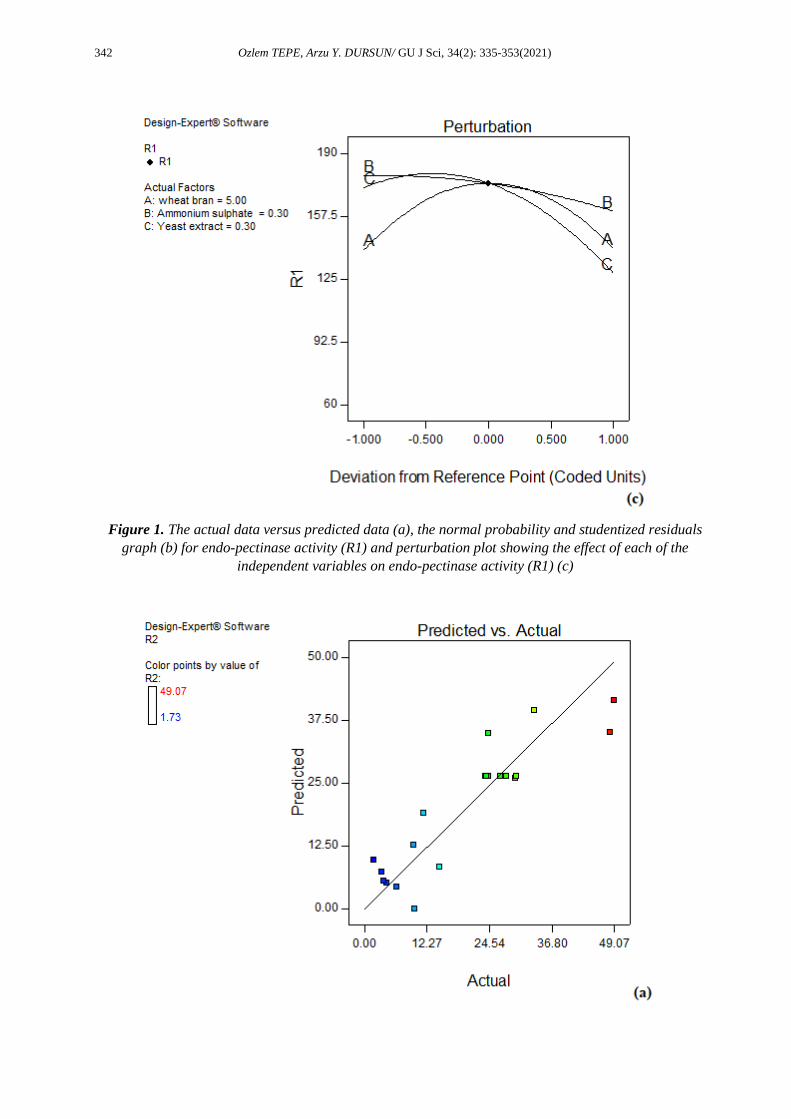
Generally, it is important to make sure that the chosen model provides an appropriate approach to the actual
system. The adequacy of a model can be judged using the diagnostic plots such as the predicted versus
actual value plot (Figures 1a and 2a) [27]. When Figures 1a and 2a are examined, it was understood that
there was a linear relationship between the predicted and actual values and models were adequate [25]. The
correlation coefficients between the actual and predicted values were 0.9820 and 0.9020 for the endo-
pectinase activity and pectin lyase activity, respectively. Higher values of the correlation coefficient justify
a perfect relation between the independent variables [24]. The R-value indicates good agreement between
the calculated and observed activities in the experimental range. The experimental activity values were in
close agreement with the activity values obtained using RSM. The residual plots were investigated using
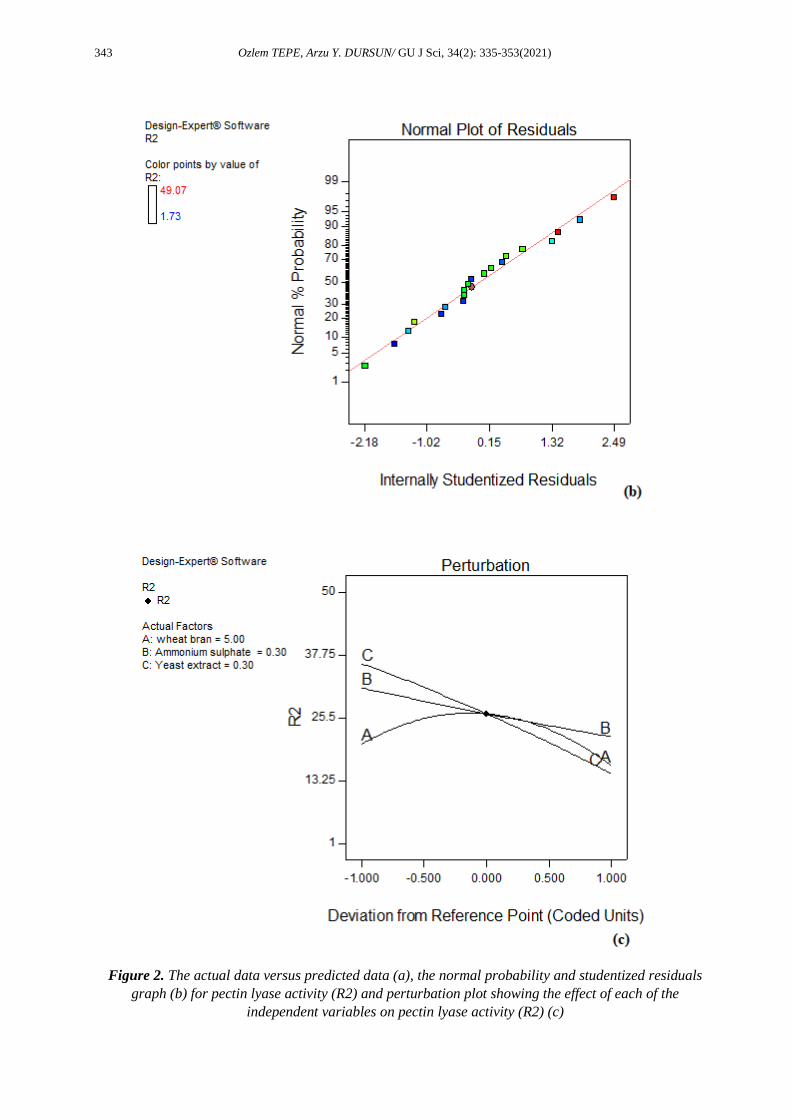
an approximate model. The normal probability and studentized residuals graphs are illustrated in Figures
1b and 2b. The normal probability graph shows whether the residuals follow a normal distribution and in
this case the points lie close to a straight line [28] describing the effectiveness of model [29]. As can be
seen from Figures 1b and 2b, s-shaped curve did not form. This shows that no response transformation was
required, and that there was no obvious issue with normality [28]. Figures 1c and 2c present the perturbation
plots that show the effect of each of the independent variables on the endo-pectinase activity (R1) and
pectin lyase activity (R2).
341 Ozlem TEPE, Arzu Y. DURSUN/ GU J Sci, 34(2): 335-353(2021)
342 Ozlem TEPE, Arzu Y. DURSUN/ GU J Sci, 34(2): 335-353(2021)
Figure 1. The actual data versus predicted data (a), the normal probability and studentized residuals
graph (b) for endo-pectinase activity (R1) and perturbation plot showing the effect of each of the
independent variables on endo-pectinase activity (R1) (c)
343 Ozlem TEPE, Arzu Y. DURSUN/ GU J Sci, 34(2): 335-353(2021)
Figure 2. The actual data versus predicted data (a), the normal probability and studentized residuals
graph (b) for pectin lyase activity (R2) and perturbation plot showing the effect of each of the
independent variables on pectin lyase activity (R2) (c)

344 Ozlem TEPE, Arzu Y. DURSUN/ GU J Sci, 34(2): 335-353(2021)
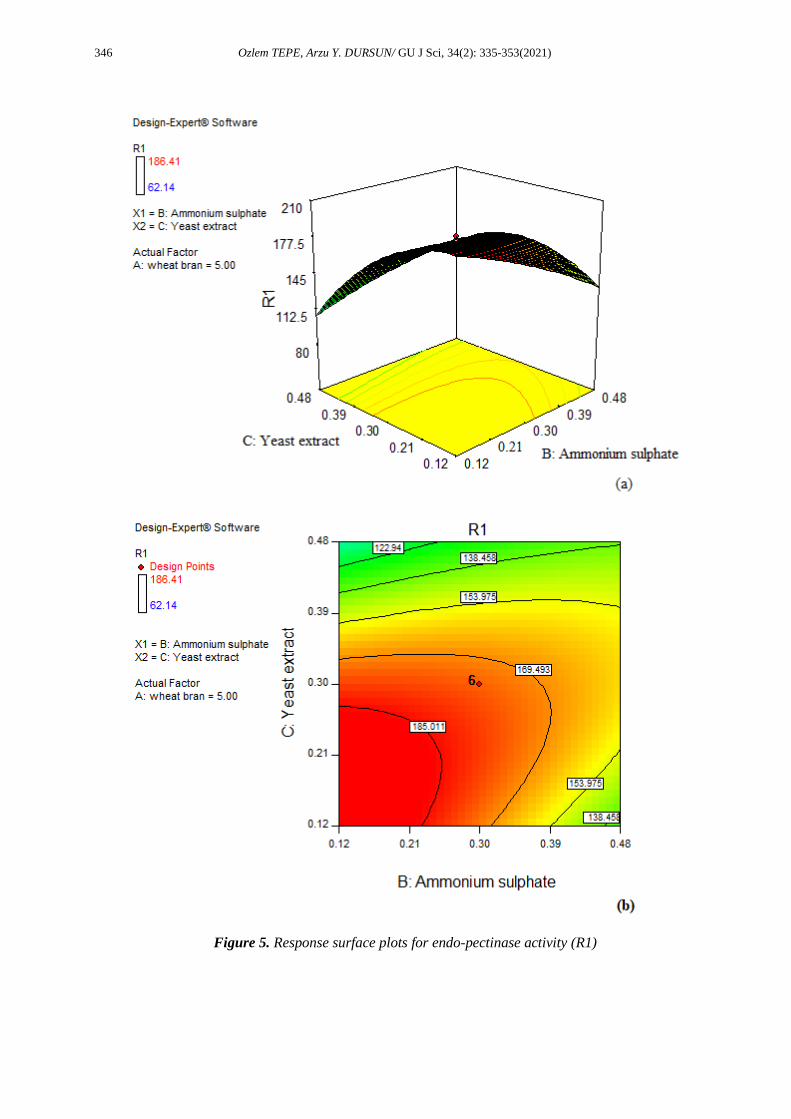
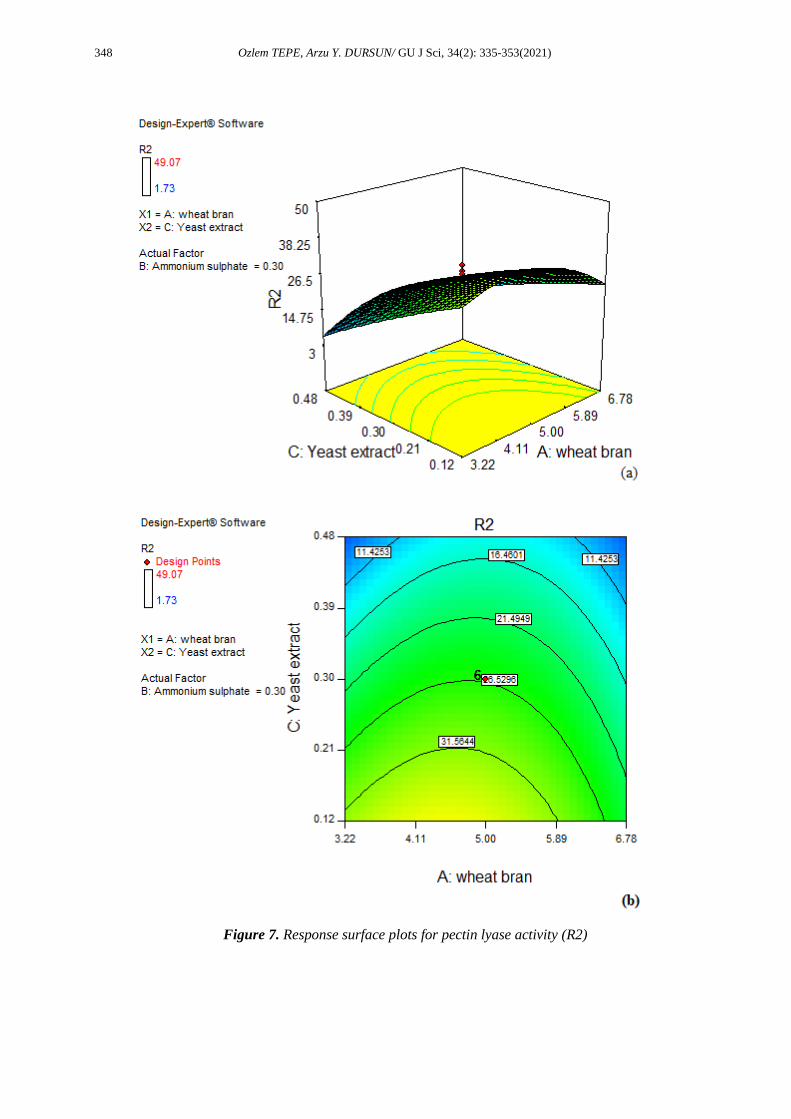
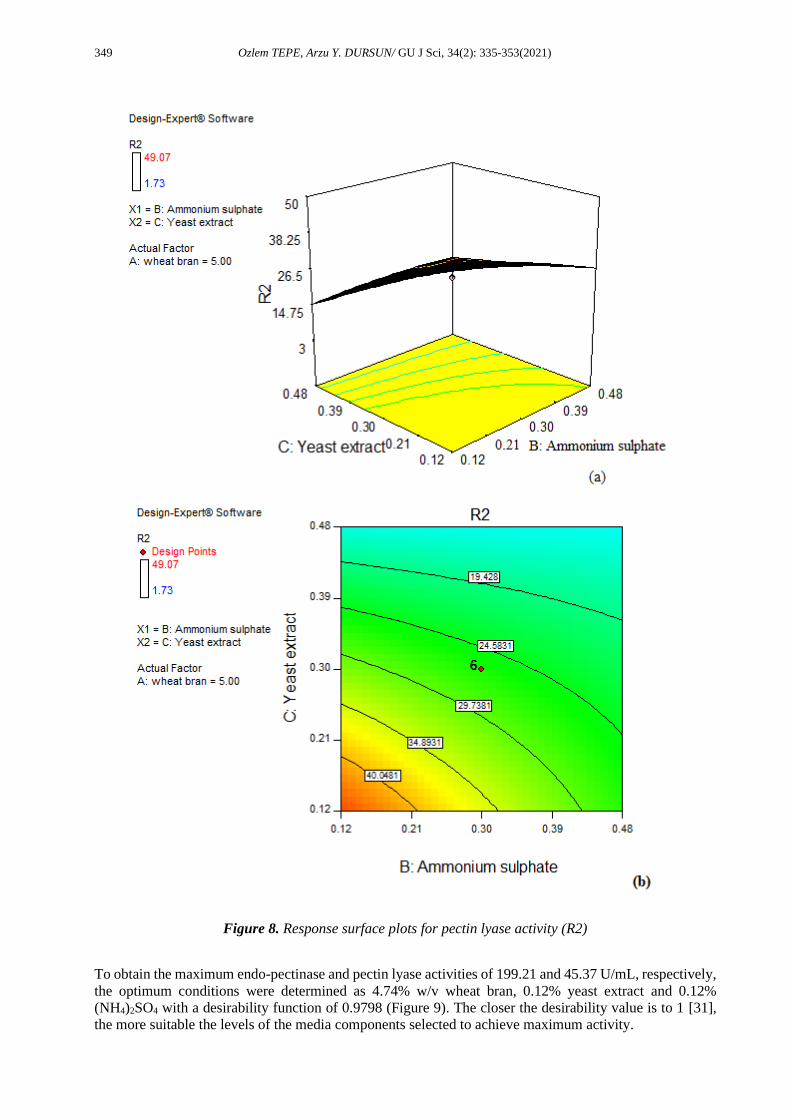
The regression formula obtained from the RSM analysis can be illustrated with 3-D and 2-D curves. These
curves are plotted using a statistically suitable model to reveal the optimum levels of each element required
for maximum enzyme synthesis and to comprehend the interaction of media elements [20]. Thus, with these
3-D and 2-D curves, finding the optimal variable concentrations is also very simple and convenient [30].
All plots are presented in Figures 3-8. In all plots, while a variable was maintained to zero (0) level, the
effect of the two factors was presented. The pectin lyase and endo-pectinase activities were found to
increase when low levels of B and C and a moderate level of A were used. The relatively circular nature of
the 2-D plots in Figures 3 and 4 is evidence that there was almost no interaction between A and B and A
and C. The 2-D curves in Figure 5 showed that there was a mutual interaction between B and C for the
endo-pectinase activity.
Figure 3. Response surface plots for endo-pectinase activity (R1)

345 Ozlem TEPE, Arzu Y. DURSUN/ GU J Sci, 34(2): 335-353(2021)
Figure 4. Response surface plots for endo-pectinase activity (R1)
346 Ozlem TEPE, Arzu Y. DURSUN/ GU J Sci, 34(2): 335-353(2021)
Figure 5. Response surface plots for endo-pectinase activity (R1)

347 Ozlem TEPE, Arzu Y. DURSUN/ GU J Sci, 34(2): 335-353(2021)
Figure 6. Response surface plots for pectin lyase activity (R2)
348 Ozlem TEPE, Arzu Y. DURSUN/ GU J Sci, 34(2): 335-353(2021)
Figure 7. Response surface plots for pectin lyase activity (R2)
349 Ozlem TEPE, Arzu Y. DURSUN/ GU J Sci, 34(2): 335-353(2021)
Figure 8. Response surface plots for pectin lyase activity (R2)
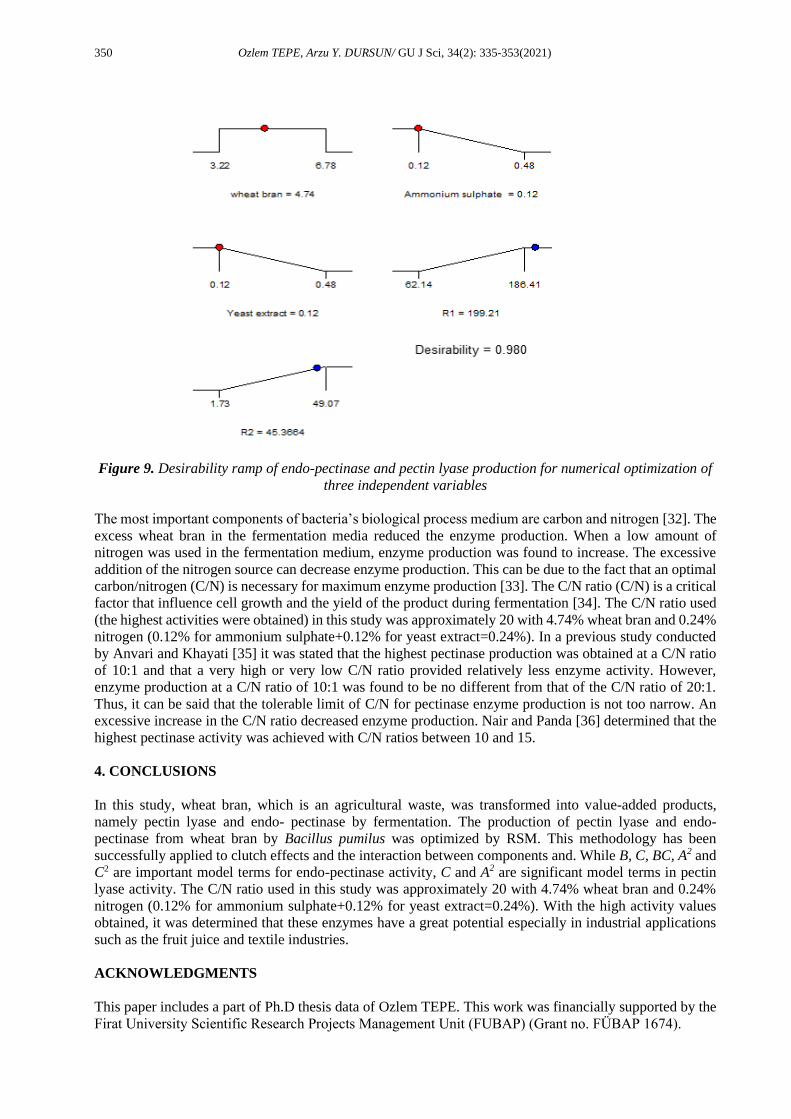
To obtain the maximum endo-pectinase and pectin lyase activities of 199.21 and 45.37 U/mL, respectively,
the optimum conditions were determined as 4.74% w/v wheat bran, 0.12% yeast extract and 0.12%
(NH4)2SO4 with a desirability function of 0.9798 (Figure 9). The closer the desirability value is to 1 [31],
the more suitable the levels of the media components selected to achieve maximum activity.
350 Ozlem TEPE, Arzu Y. DURSUN/ GU J Sci, 34(2): 335-353(2021)
Figure 9. Desirability ramp of endo-pectinase and pectin lyase production for numerical optimization of
three independent variables
The most important components of bacteria’s biological process medium are carbon and nitrogen [32]. The
excess wheat bran in the fermentation media reduced the enzyme production. When a low amount of
nitrogen was used in the fermentation medium, enzyme production was found to increase. The excessive
addition of the nitrogen source can decrease enzyme production. This can be due to the fact that an optimal
carbon/nitrogen (C/N) is necessary for maximum enzyme production [33]. The C/N ratio (C/N) is a critical
factor that influence cell growth and the yield of the product during fermentation [34]. The C/N ratio used
(the highest activities were obtained) in this study was approximately 20 with 4.74% wheat bran and 0.24%
nitrogen (0.12% for ammonium sulphate+0.12% for yeast extract=0.24%). In a previous study conducted
by Anvari and Khayati [35] it was stated that the highest pectinase production was obtained at a C/N ratio
of 10:1 and that a very high or very low C/N ratio provided relatively less enzyme activity. However,
enzyme production at a C/N ratio of 10:1 was found to be no different from that of the C/N ratio of 20:1.
Thus, it can be said that the tolerable limit of C/N for pectinase enzyme production is not too narrow. An
excessive increase in the C/N ratio decreased enzyme production. Nair and Panda [36] determined that the
highest pectinase activity was achieved with C/N ratios between 10 and 15.
4. CONCLUSIONS
In this study, wheat bran, which is an agricultural waste, was transformed into value-added products,
namely pectin lyase and endo- pectinase by fermentation. The production of pectin lyase and endo-
pectinase from wheat bran by Bacillus pumilus was optimized by RSM. This methodology has been
successfully applied to clutch effects and the interaction between components and. While B, C, BC, A2 and
C2 are important model terms for endo-pectinase activity, C and A2 are significant model terms in pectin
lyase activity. The C/N ratio used in this study was approximately 20 with 4.74% wheat bran and 0.24%
nitrogen (0.12% for ammonium sulphate+0.12% for yeast extract=0.24%). With the high activity values
obtained, it was determined that these enzymes have a great potential especially in industrial applications
such as the fruit juice and textile industries.
ACKNOWLEDGMENTS
This paper includes a part of Ph.D thesis data of Ozlem TEPE. This work was financially supported by the
Firat University Scientific Research Projects Management Unit (FUBAP) (Grant no. FÜBAP 1674).
351 Ozlem TEPE, Arzu Y. DURSUN/ GU J Sci, 34(2): 335-353(2021)
CONFLICTS OF INTEREST
No conflict of interest was declared by the authors.
REFERENCES
[1] Pedrolli, D.B., Monteiro, A.C., Gomes, E., Carmona, E.C., “Pectin and pectinases: production,
characterization and industrial application of microbial pectinolytic enzymes”. Open Biotechnol.
J., 3: 9–18, (2009).
[2] Jayani, R.S., Saxena, S., Gupta, R., “Microbial pectinolytic enzymes: A review”, Process
Biochem., 40: 2931–2944, (2005).
[3] Alkorta, I., Garbisu, C., Llama, M.J., Serra, J.L., “Industrial applications of pectic enzymes: a
review”, Process Biochem., 33: 21–28, (1998).
[4] Kashyap, D.R., Vohra, P.K., Chopra, S., Tewari, R., “Applications of pectinases in the commercial
sector: a review”, Bioresource Technol., 77(3): 215-227, (2001).
[5] Kertesz, Z., “A new method for enzymic clarification of unfermented apple juice. US patent no.
1.932.833”, New York State Agricultural Experimentation Station (Geneva) Bull. No. 689,
(1930).
[6] El-Sheekh, M.M., Ismail, A.-m.S., El-Abd, M.A., Hegazy, E.M., El-Diwany, A.I., “Effective
technological pectinases by Aspergillus carneus NRC1 utilizing the Egyptian orange juice
industry scraps”, Int. Biodeter. Biodegr., 63: 12–18, (2009).
[7] Baracat‐Pereira, M.C., Coelho, J.L.C., Silva, D.O., “Production of pectin lyase by Penicillium
griseoroseum cultured on sucrose and yeast extract for degumming of natural fibres”, Lett. Appl.
Microbiol., 18(3): 127-129, (1994).
[8] Prathyusha, K., Suneetha, V., “Bacterial pectinases and their potent biotechnological application
in fruit processing/juice production industry: a review”. J. Phytol., 3(6): 16-19, (2011).
[9] Mojsov, K., “The effects of different carbon sources on biosynthesis of pectinolytic enzymes by
Aspergillus niger”, ATI –Appl. Technol. Inno., 3(3): 23-29, (2010).
[10] Naidu, G.S.N., Panda, T., “Production of pectolytic enzymes -a review”, Bioprocess Eng., 19:
355-361, (1998).
[11] Oumer, O.J., Abate, D., “Comparative studies of pectinase production by Bacillus subtilis strain
Btk 27 in submerged and solid-state fermentations”, Biomed Res. Int., 2018: 1514795, (2018).
[12] Demir, H., Tarı, C., “Valorization of wheat bran for the production of polygalacturonase in SSF
of Aspergillus sojae”, Ind. Crop Prod., 54: 302–309, (2014).
[13] Fang, T.J., Liao, B.-C., Lee, S.-C., “Enhanced production of xylanase by Aspergillus carneus M34
in solid-state fermentation with agricultural waste using statistical approach”, New Biotechnol.,
27(1): 25-32, (2010).
[14] Castilho, L.R., Medronho, R.A., Alves, T.L.M., “Production and extraction of pectinases obtained
by solid-state fermentation of agroindustrial residues with Aspergillus niger”, Bioresource
Technol., 71(1): 45-50, (2000).

352 Ozlem TEPE, Arzu Y. DURSUN/ GU J Sci, 34(2): 335-353(2021)
[15] Pandey, A., Soccol, C.R., Mitchell, D., “New developments in solid state fermentation: I-
bioprocesses and products”, Process Biochem., 35: 1153–1169, (2000).
[16] Pandey, A., “Solid-state fermentation”, Biochem. Eng. J., 13: 81-84, (2003).
[17] Díaz, A.B., de Ory, I., Caro, I., Blandino, A., “Enhance hydrolytic enzymes production by
Aspergillus awamori on supplemented grape pomace”, Food Bioprod. Process, 90: 72–78, (2012).
[18] Kumar, R.S., Ananthan, G., Prabhu, A.S., “Optimization of medium composition for alkaline
protease production by Marinobacter sp. GA CAS9 using response surface methodology–A
statistical approach”, Biocatal. Agric. Biotechnol., 3: 191–197, (2014).
[19] Goncalves, D.B., Teixeira, J.A., Bazzolli, D.M.S., Queiroz, M.V., Araujo, E. F., “Use of response
surface methodology to optimize production of pectinases by recombinant Penicillium
griseoroseum T20”, Biocatal. Agric. Biotechnol., 1: 140–146, (2012).
[20] Tepe, O., Dursun, A.Y., “Exo-pectinase production by Bacillus pumilus using different
agricultural wastes and optimizing of medium components using response surface methodology”,
Environ. Sci. Pollut. Res., 21: 9911–9920, (2014).
[21] Nedjma, M., Hoffmann, N., Belarbi, A., “Selective and sensitive detection of pectin lyase activity
using a colorimetric test: application to the screening of microorganisms possessing pectin lyase
activity”, Anal. Biochem., 291: 290–296, (2001).
[22] Tepe, O., Dursun, A.Y., “Bioprocess parameters and oxygen transfer characteristics in pectin lyase
production by Bacillus pumilus”, Fresen. Environ. Bull., 26(8): 5082-5091, (2017).
[23] Tuttobello, R., Mill, P.J., “The pectic enzymes of Aspergillus niger 1. The production of active
mixtures of pectic enzymes”, Biochem. J., 79: 51-57, (1961).
[24] Elibol, M., “Response surface methodological approach for inclusion of perfluorocarbon in
actinorhodin fermentation medium”, Process Biochem., 38: 667-673, (2002).
[25] Manan, T.S.B.A., Khan, T., Sivapalan, S., Jusoh, H., Sapari, N., Sarwono, A., Ramli, R.M.,
Harimurti, S., Beddu, S., Sadon, S.N., Kamal, N.L.M., Malakahmad, A., “Application of response
surface methodology for the optimization of polycyclic aromatic hydrocarbons degradation from
potable water using photo-Fenton oxidation process”, Sci. Total Environ., 665: 196–212, (2019).
[26] Li, H., van den Driesche, S., Bunge, F., Yang, B., Vellekoop, M.J., “Optimization of on-chip
bacterial culture conditions using the Box-Behnken design response surface methodology for
faster drug susceptibility screening”, Talanta, 194: 627–633, (2019).
[27] Gönen, F., Aksu, Z., “Single and binary dye and heavy metal bioaccumulation properties of
Candida tropicalis: Use of response surface methodology (RSM) for the estimation of removal
yields”, J. Hazard. Mater., 172: 1512–1519, (2009).
[28] Tanyildizi, M.Ş., “Modeling of adsorption isotherms and kinetics of reactive dye from aqueous
solution by peanut hull”, Chem. Eng. J., 168: 1234–1240, (2011).
[29] Abdel Wahab, W.A., Ahmed, S.A., “Response surface methodology for production,
characterization and application of solvent, salt and alkali-tolerant alkaline protease from isolated
fungal strain Aspergillus niger WA 2017”, Int. J. Biol. Macromol., 115: 447–458, (2018).
353 Ozlem TEPE, Arzu Y. DURSUN/ GU J Sci, 34(2): 335-353(2021)
[30] Gönen, F., Aksu, Z., “Use of response surface methodology (RSM) in the evaluation of growth
and copper (II) bioaccumulation properties of Candida utilis in molasses medium”, J. Hazard.
Mater., 154: 731–738, (2008).
[31] Unuofin, J.O., Okoh, A.I., Nwodo, U.U., “Utilization of agroindustrial wastes for the production
of laccase by Achromobacter xylosoxidans HWN16 and Bordetella bronchiseptica HSO16”, J.
Environ. Manage., 231: 222–231, (2019).
[32] Ulhiza, T.A., Puad, N.I.M., Azmi, A.S., “Optimization of culture conditions for biohydrogen
production from sago wastewater by Enterobacter aerogenes using response surface
methodology”, Int. J. Hydrogen Energy, 43: 22148-22158, (2018).
[33] Panesar, P.S., Chavan, Y., Chopra, H.K., Kennedy, J.F., “Production of microbial cellulose:
Response surface methodology approach”, Carbohyd. Polym., 87: 930–934, (2012).
[34] Xiao, R., Li, X., Zheng, Y., “Enzyme production by a fungoid marine protist Thraustochytrium
striatum”, Eur. J. Protistol., 66: 136–148, (2018).
[35] Anvari, M., Khayati, G., “The effect of citrus pulp type on pectinase production in solid-state
fermentation: Process evaluation and optimization by Taguchi design of experimental (DOE)
methodology”, J. BioSci. Biotech., 3(3): 227-233, (2014).
[36] Nair, S.R., Panda, T., “Statistical optimization of medium components for improved synthesis of
pectinase by Aspergillus niger”, Bioprocess Eng., 16: 169-173, (1997).