Welcome. MTSS S ESSION 2 I MPLEMENTATION G UIDES Clare-Gladwin RESD January 9, 2014.


i
Academy Publishing CenterJournal of Renewable Energy and Sustainable Development (RESD)First edition 2015© All rights reserved Copyright 2015
No responsibility is assumed by the publisher for any injury and/or damage to persons or property as amatter of products liability, negligence or otherwise, or from any use or operation of any methods,products, instructions or ideas contained in the material herein.
Every effort has been made to trace the permission holders of figures and in obtaining permissionswhere necessary.
ISSN: 2356-8518 Print Version
ISSN: 2356-8569 Online Version
Permissions may be sought directly Academy Publishing Center,Arab Academy for Science, Technology, and Maritime Transport,Abu Kir Campus, Alexandria, EGYPTP.O. Box: Miami 1029Tel:(+203) 5622366/88 – EXT 1069 and (+203) 561 1818Fax: (+203) 561 1818Web Site: http://apc.aast.edu
Journal of Renewable Energy and Sustainable Development (RESD) Volume 4, Issue 1, June 2018 - ISSN 2356-8569
Volume 4, Issue 1, June 2018
RESD © 2018http://apc.aast.edu

ii
Journal of Renewable Energy andSustainable Development
RESD
Sustainable development is a multidisciplinary advancing to the center of energy research with the
declaration of UN millennium development goals for the first time in 2000, and continued to constitute a
challenge in energy technologies in the past decade. RESD is mainly interested in case studies of
sustainable development and its relation to transition economies in the Middle East, Africa, Asia and
Oceania.
RESD has an outstanding editorial board of eminent scientists, researchers and engineers who
contribute and enrich the journal with their vast experience in different fields of interest to the journal.
The journal is open-access with a liberal Creative Commons Attribution-Non Commercial-
4.0 International License. Which preserves the copyrights of published materials to the authors and
protects it from unauthorized commercial use or derivation. The journal is financially supported by Arab
Academy for Science, Technology and Maritime Transporting in order to maintain quality open-access
source of research papers on renewable energy and sustainable development.
Renewable Energy and Sustainable Development (RESD) is a biannual international peer-reviewed
journal which presents a global forum for dissemination of research articles, case studies and reviews
focusing on all aspects of renewable energy and its role in sustainable development. The topics of focal
interest to RESD include, but are not limited to, all aspects of wind energy, wave/tidal energy, solar
energy, as well as energy from biomass and biofuel. The integration of renewable energy technologies
in electrical power networks and smart grids is another topic of interest to RESD. Experimental,
computational and theoretical studies are all welcomed to RESD.
RESD © 2018http://apc.aast.edu
Journal of Renewable Energy and Sustainable Development (RESD) Volume 4, Issue 1, June 2018- ISSN 2356-8569

iii
Editor-in-Chief
Associate Editors
Rania El Sayed Abdel Galil, Ph.D.Associate Professor, Architectural Engineering and Environmental DesignArab Academy for Science and Technology and Maritime Transport(AASTMT) Abu Kir Campus, POBox: 1029 Miami,Alexandria, EGYPTEmail: [email protected]
Jingzheng Ren, Ph.D.Associate Professor, Chemical EngineeringUniversity of Southern Denmark,DENMARKEmail: [email protected]
Aly Ismail Shehata , Ph.D.Assistant Professor, Mechanical EngineeringArab Academy for Science and Technology and Maritime Transport(AASTMT) Abu Kir Campus, POBox: 1029 Miami,Alexandria, EGYPTEmail: [email protected]
Ahmed Aboushady, Ph.D.Assistant Professor, Electrical EngineeringRobert Gordon University,Aberdeen, United [email protected]
Editorial Board
Abdel Salam Hamdy Makhlouf, PhDProfessor, University of Texas – Pan American, USA
Adam Fenech, PhDAssociate Professor, University of Prince Albert Island, CANADA
Adel Al Taweel, PhDProfessor, Dalhousie University, CANADA
Ahmed Zobaa, PhDSenior Lecturer, Brunel University London, U.K
Aziz Naamane, PhDSenior Researcher, Laboratoire des Sciences de l’information et des Systèmes, FRANCE
Yasser Gaber Dessouky, Ph.DProfessor of Electrical Engineering and Renewable Energy TechnologiesArab Academy for Science and Technology and Maritime Transport(AASTMT) Abu Kir Campus, POBox: 1029 Miami,Alexandria, EGYPTE-mail: [email protected]
Editorial Committee
Journal of Renewable Energy and Sustainable Development (RESD) Volume 4, Issue 1, June 2018 - ISSN 2356-8569
RESD © 2018http://apc.aast.edu

Barry Wayne Williams, Ph.DProfessor, Strathclyde University, U.K
Chin-Hsiang Cheng, Ph.DProfessor, National Cheng Kung University, TAIWAN
Dieter Schramm, PhDProfessor, University of Duisburg-Essen, GERMANY
Ehab Fahmy El-Saadany, Ph.DProfessor, University of Waterloo, CANADA
Fei GAO, PhDAssociate Professor, University of Technology of Belfort-Montbéliard, FRANCE
Francesco Martinico, PhDProfessor, Università di Catania, ITALY
Frede Blaabjerg, PhDProfessor, Allborg University, DENMARK
Fouad H. Fouad, PhDProfessor, University of Alabama at Birmingham, U.S.A
Han-Seung Lee, PhDProfessor, Hanyang University, SOUTH KOREA
Hassan M.K. Abdel-Salam, PhDProfessor, Alexandria University, EGYPT
Hebatalla F. Abouelfadl, PhDAssociate Professor, Faculty of Fine Arts, Alexandria University, EGYPT
Jawad Faiz, Ph.DProfessor, University of Tehran, IRAN
Kouzou Abdellah, PhDAssociate Professor, Djelfa University, ALGERIA
Mohamed Youssef, PhDAssistant Professor, University of Ontario, Institute of Technology, CANADA
Mohamed Ismail, PhDProfessor, Hanyang University, SOUTH KOREA
Moustafa Abdel-Maksoud, Dr.-IngProfessor, Hamburg University of Technology, GERMANY
Nacer Msridi, PhDSenior Researcher, Laboratoire des Sciences de l’information et des Systèmes, FRANCE
Perter Breuhaus, PhDChief Scientist, International Research Institute Stavanger, NORWAY
Ping Zheng, PhDProfessor, Harbin Institute of Technology, CHINA
Robert F. Boehm, PhDProfessor, University of Nevada, Las Vegas, U.S.A
Robert W. Peters, Ph.DProfessor, University of Alabama, U.S.A
iv
Journal of Renewable Energy and Sustainable Development (RESD) Volume 4, Issue 1, June 2018 - ISSN 2356-8569
RESD © 2018http://apc.aast.edu

v
Sheldon Williamson, PhDAssociate Professor, University of Ontario, Institute of Technology, CANADA
Stephen Connelly, PhDSenior Lecturer, the University of Sheffield, U.K
Suk Won Cha, PhDProfessor, Seoul National University, SOUTH KOREA
Susan Roaf, PhDProfessor, Heriot Watt University, U.K
Waleed F. Faris, PhDProfessor, International Islamic University of Malaysia, MALAYSIA
Yi-Tung Chen, Ph.DProfessor, University of Nevada Las Vegas, U.S.A
Youcef Soufi, PhDProfessor, University of Tébessa, ALGERIA
Advisory Board
Abbas Abdel Halim Yehia, PhDProfessor, Architectural Engineering & Environmental Design, Arab Academy for Science & Technologyand Maritime Transport, Egypt
Abdel-Wahab Shalaby Kassem, PhDProfessor, Agricultural Engineering Department, Faculty of Agriculture, Alexandria University, Egypt
Adel Khalil, PhDProfessor, Mechanical Power Engineering Department Faculty of Engineering, Cairo University, Egypt
Ahmed Abu Saud, M.ScChief Executive Officer (CEO) Of Egyptian Environmental Affairs Agency (EEAA)
Ahmed Hossam El-Din, PhDProfessor, Electrical Engineering Department, Alexandria University, Egypt
Almoataz Y. Abdelaziz, PhDProfessor, Faculty of Engineering, Ain Shams University, EGYPT
Amr A. Amin, PhDProfessor, Electric Power And Machines Department, Faculty of Engineering, Helwan University,Egypt
Anhar Ibrahim Hegazi, PhDDirector, Energy Efficiency Unit, IDSC, Egyptian Cabinet of Ministers, Egypt
Fatma Ahmed Moustafa Ali, PhDChairman for The Executive Committee for The Regional Center for Renewable Energy and EnergyEfficiency (RCREEE), Egypt
Fatma El Zahraa Hanafi Ashour, PhDChairman, Chemical Engineering Department, Faculty of Engineering, Cairo University, Egypt
RESD © 2018http://apc.aast.edu
Journal of Renewable Energy and Sustainable Development (RESD) Volume 4, Issue 1, June 2018 - ISSN 2356-8569

vi
Fuad Ahmed Abulfotuh, PhDProfessor Emeritus, Alexandria University, Egypt
Galal Osman, PhDVice President, World Wind Energy Association (WWEA), Bonn, Germany
Hend Farouh, PhDExecutive Director of Central Unit For Sustainable Cities & Renewable Energy, New UrbanCommunities Authority, NUCA
Khaled El Zahaby, PhDChairman, Housing And Building National Research Center, HBRC, Cairo, Egypt
Mohamed Mostafa El-Khayat, PhDManaging Director of Technical Affairs Sector, New And Renewable Energy Authority, Egypt
Mohamed Orabi, PhDDirector, Aswan Power Electronics Applications Research Center (APEARC), Aswan University, Egypt
Radwan H. Abdel Hamid, PhDProfessor, Helwan University, Egypt
Mohamed El SobkiExecutive Director, New And Renewable Energy Authority, Egypt
Tareq Emtairah, PhDExecutive Director, Regional Center for Renewable Energy and Energy Efficiency (RCREEE), Egypt
RESD © 2018http://apc.aast.edu
Journal of Renewable Energy and Sustainable Development (RESD) Volume 4, Issue 1, June 2018 - ISSN 2356-8569

Peer Review Process
Peer review is an objective process at the heart of good scholarly publishing and is carried out on all
reputable scientific journals. Our referees therefore play a vital role in maintaining the high standards
of Renewable Energy and Sustainable Development (RESD) and all manuscripts are peer reviewed
following the procedure outlined below.
Overall process for publishing a paper will be taken approximately 4 months after initial submission.
Reviewing process will take about 2 months, and then publishing process will not exceed 2 months.
1. Initial manuscript evaluation
The Editor first evaluates all manuscripts. It is rare, but it is entirely feasible for an exceptional manuscript
to be accepted at this stage. Those rejected at this stage are insufficiently original, have serious scientific
flaws, have poor grammar or English language, or are outside the aims and scope of the journal. Those
that meet the minimum criteria are passed on to at least 2 experts for review.
Authors of manuscripts rejected at this stage will normally be informed within 2 to 3 weeks of receipt.
2. Type of Peer Review
This journal employs single blind reviewing, the author identity is disclosed to the referee, while the
referee remains anonymous throughout the process.
3. How the referee is selected
Referees are matched to the paper according to their expertise. Our database is constantly being
updated. RESD has a policy of using single blind refereeing (as detailed in the previous section), with
neither referee from the country of the submitting author. We welcome suggestions for referees from
the author though these recommendations may or may not be used.
4. Referee reports
Referees are asked to evaluate whether the manuscript support followings key points related to scientific
content, quality and presentation:
4.1. Technical
Scientific merit: notably scientific rigour, accuracy and correctness.
Clarity of expression; communication of ideas; readability and discussion of concepts.
Sufficient discussion of the context of the work, and suitable referencing.
4.2. Quality
Originality: Is the work relevant and novel?
Motivation: Does the problem considered have a sound motivation? All papers should clearly
demonstrate the scientific interest of the results.
Repetition: Have significant parts of the manuscript already been published?
Length: Is the content of the work of sufficient scientific interest to justify its length?
vii
Journal of Renewable Energy and Sustainable Development (RESD) Volume 4, Issue 1, June 2018 - ISSN 2356-8569
RESD © 2018
http://apc.aast.edu

4.3. Presentation
Title: Is it adequate and appropriate for the content of the article?
Abstract: Does it contain the essential information of the article? Is it complete? Is it suitable for
inclusion by itself in an abstracting service?
Diagrams, figures, tables and captions: Are they essential and clear?
Text and mathematics: Are they brief but still clear? If you recommend shortening, please suggest
what should be omitted.
Conclusion: Does the paper contain a carefully written conclusion, summarizing what has been
learned and why it is interesting and useful?
Referees are not expected to correct or copyedit manuscripts. Language correction is not part of the
peer review process.
5. How long does the review process take?
Typically the manuscript will be reviewed within 3 months. Should the referees’ reports contradict one
another or a report is unnecessarily delayed a further expert opinion will be sought. All our referees sign a
conflict of interest statement. Revised manuscripts are usually returned to the initial referees within 1 week.
Referees may request more than one revision of a manuscript.
6. Editorial decisions
After peer review and referee recommendation, the editor-in-chief, with the assistance of the associate
editor, will study the paper together with reviewer comments to make one of the following decisions.
Accept
Accept pending minor revision: no external review required
Reject/Resubmit: major revisions needed and a new peer-review required
Reject
Digital Object Identifier
The RESD is supported by Digital Object Identifier, DOI for each article from Cross Ref.
The Code of the DOI of each article consists of the following format:
10.21622/RESD.YYYY.VV.I.PPP
Where
10.21622 = Journal Identifier RESD = Journal name YYYY = Four digits for the year VV = Two digits for the Volume Number I = One digit for the Issue Number PPP = Three digits for the Number of the first page of the article To look for the paper on line, search for this link http://dx.doi.org/10.21622/RESD.YYYY.VV.I.PPP
viii
Journal of Renewable Energy and Sustainable Development (RESD) Volume4 , Issue 1, June 2018 - ISSN 2356-8569
RESD © 2018
http://apc.aast.edu

Journal of Renewable Energy and Sustainable Development (RESD) Volume 4, Issue 1, June 2018 - ISSN 2356-8569
Table of Contents
Editorials
Energy Efficiency and Renewable Energy: the key factors for a sustainable future
Wolfgang Streicher 1
Articles
State-of-the-art Charging Solutions for Electric Transportation and Autonomous E-mobility
Siddhartha A. Singh, Deepak Ronanki, A. V. J. S. Praneeth, Sheldon Williamson 2-13
A review of supercritical CO2 Brayton cycle using in renewable energy applications
Wenxiao Chu, Katrine Bennett, Jie Cheng, Yi-Tung Chen 14-20
A Proposal for Desert House Design in Egypt Using Passive Ground Cooling Techniques
Mohamed Medhat Dorra, Hend El-Sayed Farroh, Lubna Amer 21-41
Generating Electricity Using Geothermal Energy in Iran
Mohammad Vahedi Torshizi, Armin Ramezani, Arash Attari, Farhad Tabarsa 42-55
ix
RESD © 2018
http://apc.aast.edu

Energy Efficiency and Renewable Energy:
the key factors for a sustainable future
Wolfgang Streicher,
Dipl.-Ing. Dr. techn. (University professor)
Unit Energy Efficient Buildings,
Institute of Structural Engineering and Material Sciences;
University of Innsbruck, Austria
Email: [email protected]
Climate change is the current biggest challenge for humans. Without mitigation and adaptation in climate change
there will be billion of people migrating from one continent to others and within continents. This will probably
cause military conflicts and large human suffering. The migration will take place from places where it becomes
too hot and/or too dry to do agriculture and to feed the population and no other sources for trading are available
into regions with more productive climate. In the last UN Climate Change Conferences, therefore several
resolutions to keep the climate change within 1.5 to 2°C until 2050 have been taken. The resolution of COP21 in
Paris to keep the temperature increase well below 2°C is signed already by 172 of 197 parties
(http://unfccc.int/paris_agreement/items/9485.php).
One very important step to reach these goals is to develop new ideas and implement existing technologies for
energy efficiency and renewable energies in a broad range. This will also bring down the costs for the energy
system transformation. The limitation of renewable energies in regions with high population density will lead, on
the on the one hand, to large energy distribution networks causing new economic and political dependencies
between countries, and, on the other hand, to more efficient technologies and systems like energy efficient
buildings (for hot and cold climates), energy efficient transportation systems like more public transportation,
smaller and electric (or hydrogen) driven cars, and more efficient industrial processes.
Knowledge generation and distribution as done in the International Journal on Renewable Energy and
Sustainable Development plays an important role for this further development.
About Professor Wolfgang Streicher
Wolfgang Streicher is university professor of Energy Efficient Buildings and Renewable Energies at Innsbruck
University in Austria and currently ISES Europe president. He teaches Building Services Engineering, HVAC,
Heat Pumps, Tube Hydraulics, Modelling, Thermodynamics, Energy and Ecology.
His current research focus is on (i) development of cost and energy efficient systems solutions for HVAC systems
including renewables; (ii) energy demand of cities using GIS and bottom up approaches; (iii) hydraulics of
complex tube networks; (iv) energy efficient systems for cities (v) solar thermal systems.
He works in these fields since more than 30 years and has published numerous papers in reviewed international
journals and conferences. Moreover, he has coordinated and coordinates projects for Austrian institutions as well
as the European Commission and the International Energy Agency.
http://apc.aast.edu
1
RESD © 2018
Journal of Renewable Energy and Sustainable Development (RESD) Volume 4, Issue 1, June 2018 - ISSN 2356-8569
http://dx.doi.org/10.21622/RESD.2018.04.1.001

Journal of Renewable Energy and Sustainable Development (RESD) Volume 4, Issue 1, June 2018 - ISSN 2356-8569 http://dx.doi.org/10.21622/RESD.2018.04.1.002
2 RESD © 2018
http://apc.aast.edu
State-of-the-art Charging Solutions for Electric
Transportation and Autonomous E-mobility Siddhartha A. Singh, Deepak Ronanki, A. V. J. S. Praneeth, and Sheldon S. Williamson
Smart Transportation Electrification and Energy Research (STEER) Group Advanced Storage Systems and
Electric Transportation (ASSET) Laboratory UOIT-Automotive Center of Excellence (UOIT-ACE) Department of
Electrical, Computer, and Software Engineering Faculty of Engineering and Applied Science University of
Ontario-Institute of Technology ACE-2025, 2000 Simcoe Street North Oshawa, ON L1H 7K4, Canada
Tel: +1/(905) 721-8668, ext. 5744 Fax: +1(905) 721-3178
http://www.engineering.uoit.ca/; http://ace.uoit.ca/
Abstract - As regards moving towards electrification
of transportation, there is need to replace gas stations
with Electric Vehicle (EV) charging stations at equally
convenient locations and look at various energy
storage methods onboard an electric vehicle. There
are various charging methods which have been
discussed in the literature. This paper discusses some
new charging technology that can possibly have a
tremendous impact on the future of energy storage in
transportation electrification.
Keywords – electrification of transportation; Electric
Vehicle; Ev; Electric; Vehicle charging station; energy
storage; autonomous electric vehicle.
I. INTRODUCTION
Charging of an Electric vehicle can be universally
classified into Plug-in Charging Technique and
Wireless Charging Technique. Plug-in Charging can
be further classified into AC charging and DC
charging. Plug-in AC charging is achieved by
connecting the AC grid to the onboard battery
charging system through a connector. The on-board
battery charging system consists of the onboard
rectifier, the power factor correction stage and the
DC-DC converter/charger as shown in Fig 1 using a
block diagram. [1][2][3]
Fig.2, shows the typical architecture of an off-board
Plug-in DC charging station. All the power conversion
units are off-board the electric vehicle. The galvanic
isolation for safety is achieved either through a bulky
60Hz isolation transformer between the AC grid and
the rectifier or a High frequency (HF) isolation
transformer at the DC-DC conversion stage. DC
charging of an EV reduces the need of multiple power
conversion units on-board as well as off-board the
EV. The battery on-board the electric vehicle is
directly charged by the off-board converters. [4][5]
The Society of Automobile Engineers (SAE) has
included DC level I and level II charging in the J1772
standard [6].
Wireless charging of Electric vehicle batteries can
also be classified as an on-board charging technique.
The power transfer is achieved by contactless plates,
through capacitive power transfer (CPT), or
contactless coils or magnetic cores, through Inductive
Power Transfer (IPT). The overall structure of the
power conversion system remains the same for both
IPT and CPT as shown using a block diagram in
Fig.2.

Journal of Renewable Energy and Sustainable Development (RESD) Volume 4, Issue 1, June 2018 - ISSN 2356-8569 http://dx.doi.org/10.21622/RESD.2018.04.1.002
3 RESD © 2018
http://apc.aast.edu
Onboard Rectifier Power Factor
Correction Stage
Battery Charger
(Isolated/Non-
Isolated)
On-board EV
Battery
AC Grid
Fig.1. Block diagram of a typical on-board plug-in AC charging architecture
Fig.2. Block diagram of a typical off-board plug-in DC charging architecture
On-board an Electric
Vehicle
Off-board Rectifier Power Factor
Correction Stage
DC-DC Charger
(HF GALVANIC
ISOLATION*)
On-board EV Battery
Off-board
On-board Electric Vehicle
AC Grid
Journal of Renewable Energy and Sustainable Development (RESD) Volume 4, Issue 1, June 2018 - ISSN 2356-8569 http://dx.doi.org/10.21622/RESD.2018.04.1.002
4 RESD © 2018
http://apc.aast.edu
AC Grid
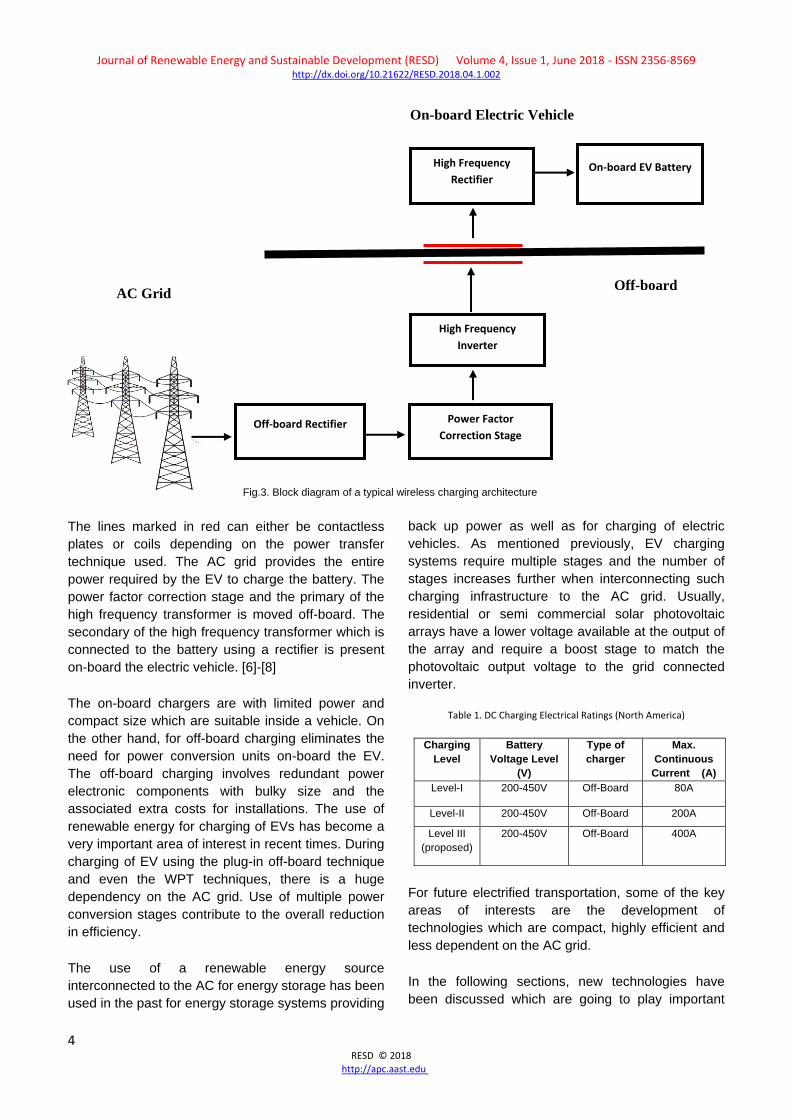
Fig.3. Block diagram of a typical wireless charging architecture
The lines marked in red can either be contactless
plates or coils depending on the power transfer
technique used. The AC grid provides the entire
power required by the EV to charge the battery. The
power factor correction stage and the primary of the
high frequency transformer is moved off-board. The
secondary of the high frequency transformer which is
connected to the battery using a rectifier is present
on-board the electric vehicle. [6]-[8]
The on-board chargers are with limited power and
compact size which are suitable inside a vehicle. On
the other hand, for off-board charging eliminates the
need for power conversion units on-board the EV.
The off-board charging involves redundant power
electronic components with bulky size and the
associated extra costs for installations. The use of
renewable energy for charging of EVs has become a
very important area of interest in recent times. During
charging of EV using the plug-in off-board technique
and even the WPT techniques, there is a huge
dependency on the AC grid. Use of multiple power
conversion stages contribute to the overall reduction
in efficiency.
The use of a renewable energy source
interconnected to the AC for energy storage has been
used in the past for energy storage systems providing
back up power as well as for charging of electric
vehicles. As mentioned previously, EV charging
systems require multiple stages and the number of
stages increases further when interconnecting such
charging infrastructure to the AC grid. Usually,
residential or semi commercial solar photovoltaic
arrays have a lower voltage available at the output of
the array and require a boost stage to match the
photovoltaic output voltage to the grid connected
inverter.
Table 1. DC Charging Electrical Ratings (North America)
Charging
Level
Battery
Voltage Level
(V)
Type of
charger
Max.
Continuous
Current (A)
Level-I 200-450V Off-Board 80A
Level-II 200-450V Off-Board 200A
Level III
(proposed)
200-450V Off-Board 400A
For future electrified transportation, some of the key
areas of interests are the development of
technologies which are compact, highly efficient and
less dependent on the AC grid.
In the following sections, new technologies have
been discussed which are going to play important
Off-board Rectifier Power Factor
Correction Stage
High Frequency
Inverter
High Frequency
Rectifier On-board EV Battery
On-board Electric Vehicle
Off-board

Journal of Renewable Energy and Sustainable Development (RESD) Volume 4, Issue 1, June 2018 - ISSN 2356-8569 http://dx.doi.org/10.21622/RESD.2018.04.1.002
5 RESD © 2018
http://apc.aast.edu
roles in the electrification of transportation as there is
a trend to move towards a greener planet. In section
III, a solar-grid interconnected single stage DC
charger has been discussed for residential and semi-
commercial applications providing level I and Level II
charge (DC) for EVs, section IV discusses an
onboard EV motor drive integrated energy storage
system and section V, on-board EV charging has
been discussed.
II. SOLAR-GRID INTERCONNECTED SINGLE
STAGE DC CHARGING FOR
RESIDENTIAL/SEMI-COMMERCIAL OFF-
BOARD CHARGING
Z-source inverters were first proposed in [10]. They
have a unique ability to buck or boost in a single
stage through two inductors and two capacitors in a
‘X’ shaped connection. A modified Z-source inverter
(M-ZSI) for DC charging, shown in Fig.4, was first
proposed in [11][12]. Each of the impedance network
capacitance in split into two capacitors, CHB.
Each of the two capacitors leg acts as a source to
split primary isolated half bridge converter. The
secondary of the high frequency transformer, T, is
connected to the EV battery, for simplicity, using a
battery internal resistance, rB and a battery voltage
VB. The switch S5, is used instead of a diode to
prevent unwanted turn on and off and maintain a
constant current for bidirectional power flow. The
diode bridge of the secondary side of the high
frequency transformer, T, is replaced by an active
bridge for bi-directional power flow operation.
The basic operation of this proposed topology is
based on the power balance equation given by,
Pcharge=PPV + PGrid
The various modes of operation are PV to GRID,
PV+GRID to EV battery and EV battery to GRID.
During the PV to Grid mode, the generated
photovoltaic power is directly fed into the grid in the
absence of an EV connected to the charger. In the
PV + Grid to EV mode, the grid and the PV provide
the required power for the battery. Any fluctuation in
the PV power is compensated by the grid. The
various power-efficiency curves for this topology is
shown in figure 5.
Fig.4. Proposed modified Z source converter based single stage topology
Fig.5. Efficiency curves for different modes of operation for a
MZSI charger [11]
From the curves, it can be seen that the efficiency of
the PV-BAT is the highest at 95.9%. For Grid to
Battery or Battery to Grid (V2G) it is almost the same
at 95%. The efficiency from PV to Grid is 93%. The
advantages of the proposed topology are: Reliability,
lesser number of power stages during different
modes of operation.

Journal of Renewable Energy and Sustainable Development (RESD) Volume 4, Issue 1, June 2018 - ISSN 2356-8569 http://dx.doi.org/10.21622/RESD.2018.04.1.002
6 RESD © 2018
http://apc.aast.edu
III. INTEGRATED MOTOR DRIVE AND ON-BOARD
BATTERY CHARGERS
The on-board chargers have restriction of power due
to their weight, space, cost constraints and isolation requirements [13]. To limit these constraints,
integration of charging task in the electric traction
system is a feasible solution as these operations are
not simultaneous. The basic idea of an integrated
charger is usage of motor windings as filter inductors
or an isolated transformer and the inverter functions
as a bi-directional AC–DC converter and these are
considered as the integrated motor drive and battery
chargers [14], [15]. This provides a major advantage
that levels 2 and 3 have a high power bidirectional
charger with unity power factor at low cost [16].
These chargers can be classified based on converter
configuration, motor type and construction, number of
motor phases and type of wheel drive. An integrated
motor drive and battery charger system were
commercially used in electric cars by AC Propulsion
Inc. [17] based on an induction machine and General
Motors Inc. [18], Ford company [19], Valeo Engine
and Electrical Systems [20] use split winding AC
motor topology without switch like a contactor [21].
These integrated chargers are already used in two
wheelers [22], fork lift trucks [23] and cars [24]. A few
advancements in motor topology modifications in
order to operate as a three phase PFC coupled boost
rectifier are split-phase induction motor [25], special
double winding machine [26], split-phase permanent
magnet synchronous motor [27], split-phase
permanent magnet assisted synchronous reluctance
motor [28], delta-star permanent magnet
synchronous motor [29], split-phase switched
reluctance motor [30] and multiphase machines [31],
[32]. Few examples of using topologies without.
without motor modifications are in four-wheel drive
system [33] and integrated charger with switched
reluctance motor (SRM) drive presented in [34] uses
embedded components of motor and converters with
voltage boosting feature and PFC charging and [35]
multilevel converter fed SRM.
In this section, main focus is on Modular Multilevel
Converter (MMC) which serves as an integrated
converter for onboard fast charger and motor drive
system. The MMC offers advantages such as
modular realization, inherent redundancy, low total
harmonic distortion, higher efficiency with standard
devices, filter less configuration, no capacitors at DC
bus, no filters at AC and DC side which are made to
use in EVs [36], [37]. MMC can be realized as a i)
power converter driving the motor ii) effective battery
management system by submodule control iii) AC
charging through arm inductances with sequence of
operation of submodules. In addition, MMC provides
fault tolerant capability, redundancy of modules and
elimination of large DC link capacitors.
Fig.6. Schematic of a 3 phase motor drive.

Journal of Renewable Energy and Sustainable Development (RESD) Volume 4, Issue 1, June 2018 - ISSN 2356-8569 http://dx.doi.org/10.21622/RESD.2018.04.1.002
7 RESD © 2018
http://apc.aast.edu
Fig.7. Schematic of a MMC based motor drive
However, these are associated with some problems
and can be summarized as [38]-[41]: i) It requires a
higher number of semiconductors, gate drivers and
corresponding control equipment. ii) Energy stored in
distributed capacitors is considerably higher than
conventional inverters. iii) It also requires a higher
number of sensors to monitor capacitor voltages and
arm currents. The major issue with MMC is that it
requires a capacitor balancing algorithm and
circulating current suppression control as it contains a
double frequency component, which increases the
stress and losses in power switching devices [40],
[41]. MMC with the use of wide gap power switching
devices can be a future solution for integrated fast on
board charger and motor drive system in autonomous
vehicles with features of high reliability, efficiency and
redundancy. This makes the easy and identical
modules manufacturing, hierarchical redundancy
capability and reduction in dimensions of the whole
converter for automotive manufacturers at the cost of
improved technology at submodule.
IV. ONBOARD-CHARGING
In all the autonomous and self-driven electric
vehicles, energy in the battery can be refilled with
battery chargers which must be highly efficient and
reliable, with high power density, low cost, and low
volume and weight. The charging time and battery life
are linked to the characteristics of the battery
charger. The most important criteria in selection of
on-board battery charger for a vehicle is based on the
available battery pack ratings (kWh) and limited
weight to space ratio to maintain average charging
time to a low value.
The power flow from the battery chargers can be
unidirectional or bidirectional. In Unidirectional
charging the power flow is from grid to the vehicle. So
it limits hardware requirements and simplifies
interconnection issues. In a bidirectional charging it
allows charging from the grid and battery energy
injection back to the grid (vehicle to grid).
Table 2. AC Charging Electrical Ratings (North America)
Charging Level Voltage Level Type of Charger Interface Equipment Power Level Charging Time
Level-I 120 V ac(US)
230 V ac(EU)
On-Board Type-I(J1772)
Upto-3.3KW 6-9hours
Level-II 240 V ac(US)
400 V ac(EU)
On-Board Type-II connector
7.7-43KW 1-4 hours
Level-III
Single phase and 3
phase
(proposed)
>20kW

Journal of Renewable Energy and Sustainable Development (RESD) Volume 4, Issue 1, June 2018 - ISSN 2356-8569 http://dx.doi.org/10.21622/RESD.2018.04.1.002
8 RESD © 2018
http://apc.aast.edu
This is the latest trend in the charging systems with
the automotive (CAR2HOME) to grid. It stabilizes the
power with adequate power conversion when it is
plugged to grid. The on-board charging through the
renewable generations (Solar) helps to minimize the
additional power stabilizing equipment in the vehicle.
The concept of sun2car shown in Fig: 1 is one of the
solutions for charging the vehicle through a PV used
by Toyota and Nissan. Fig: 2 shows the Tesla’s super
charger, which provides a huge research scope in
extracting the maximum energy from the sun and
utilize it for charging the EV battery pack. There are
various topologies involved in onboard charger for
charging the electric vehicle [3] [41]. Most of the
onboard chargers have the front-end topology as AC-
DC power conversion to maintain the power quality in
the system when the vehicle was connected to a grid
supply for charging [42]. The converted DC will
normally have a huge low frequency ripple which will
affect the life of the battery especially the li-ion
battery [43]. There should a two-stage power
conversion required in a li-ion battery pack to reduce
the low voltage ripple content and to make it easy to
implement the charger control algorithms [44]. There
are many topologies in PFC like interleaved,
bridgeless, semi-bridgeless, which can improve the
output ripple in capacitors and the heat management
problems in the converter. In this paper, the
researchers are interested in reducing the charge
time of the vehicle with high power quality. There are
different topologies in ac–dc converters with good
power quality and less harmonics discussed in [45] -
[46]. Proper selection of the PFC topology helps to
minimize the low frequency ripple, the power quality,
and the size of EMI filter and emissions.
Fig.8 Sun2Car concept
Fig. 9. Tesla Super Charger
To avoid the bulky capacitors at the PFC, [48]
provides a solution for sinusoidal charging that can
be implemented through using bidirectional
converters. There are different stages in the battery
charger, represented in the block diagram (Fig. 3).
The main motivation is to compact the size of the
charger and improve the efficiency at full load
conditions. There are many contributions to improve
the efficiency of the converters [45]-[47]. The
resonant converters at the DC/DC side have the
major role in deciding the efficiency of the whole
charger with isolation transformer and wide control
algorithms implementations for charging the battery
packs [49].
Fig. 10. Block diagram of on board charger stages

Journal of Renewable Energy and Sustainable Development (RESD) Volume 4, Issue 1, June 2018 - ISSN 2356-8569 http://dx.doi.org/10.21622/RESD.2018.04.1.002
9 RESD © 2018
http://apc.aast.edu
In the block diagram of Fig. 3, Stages II&I are the
same for both conductive and inductive power
chargers [49]. Stage II in the wireless charger is
separated with a magnetic coil of specified air gap
length and the corresponding compensations on
primary and on secondary. The EMI filter shown in
the charger is required to filter the common mode and
differential mode noise, surge protector and
harmonics suppressor. There are many challenges
in using the resonant converters for the charging
application to have a wide output voltage [51] - [52].
The overview of the paper is to design a charger with
minimized size and weight, universal output voltage
and faster rate of charge. An EV charger must ensure
that the utility current is drawn with low distortion to
minimize the power quality impact and at high power
factor to maximize the real power available from a
utility outlet. IEEE-1547, SAE-J2894, IEC1000-3-2,
ECR-10(Rev.4), CISPR-25, and the U.S. National
Electric Code (NEC) 690 standards limit the allowable
harmonic and dc current injection into the grid, and
EV chargers are usually designed to comply [53]-[59].
The overview of the stages is shown in Fig.4.
Fig.11. Overview of an isolated onboard charger [61]
The two-stage topology as shown in Fig.11 consists
of only AC-DC power conversion. To avoid the
additional DC-DC converter for the low voltage (LV)
modules the integrated on-board with AC-DC for
main Battery and DC-DC converter for auxiliary loads
operated with LV supply (12/24 V) as proposed in
[62]-[63].
V. CONCLUSIONS
This paper discusses some of the topologies in the
area of energy storage for electric vehicles. Various
charging technology for onboard electric vehicle
battery was discussed. Some possible state of the art
technologies have been presented in this paper.
Using solar grid tied inverter/chargers can be used for
charging at residential locations converting residential
houses into a charging station. MMC technology is an
attractive solution for onboard energy storage and AC
onboard charging directly from the grid is a
convenient way of charging directly from the AC
supply. The various standards for charging are also
presented for the discussed topologies.
REFERENCES
[1] J. Deng, S. Li, S. Hu, C. C. Mi and R. Ma.
“Design methodology of LLC resonant
converters for electric vehicle battery chargers,”
IEEE Transactions on Vehicular Technology, vol.
63, no. 4, pp. 1581-1592, May. 2014.
[2] D. S. Gautam, F. Musavi, W. Eberle and W. G.
Dunford. “A zero-voltage switching full-bridge
dc–dc converter with capacitive output filter for
plug-in hybrid electric vehicle battery charging,”
IEEE Transactions on Power Electronics, vol.
28, , no. 12, pp. 5728-5735, Dec. 2013.
[3] D. S. Gautam, F. Musavi, M. Edington, W.
Eberle and W. G. Dunford. “An automotive
onboard 3.3- kw battery charger for PHEV
application,” IEEE Transactions on Vehicular
Technology, vol. 61, no. 8, pp. 3466-3474, Oct.
2012.
[4] Y. Du, X. Zhou, S. Bai, S. Lukic and A. Huang.
“Review of non-isolated bi-directional dc-dc
converters for plugin hybrid electric vehicle
charge station application at municipal parking
decks,” Proc. Of Twenty-Fifth Annual IEEE
Applied Power Electronics Conference and
Exposition (APEC), 2010, pp.1145-1151.

Journal of Renewable Energy and Sustainable Development (RESD) Volume 4, Issue 1, June 2018 - ISSN 2356-8569 http://dx.doi.org/10.21622/RESD.2018.04.1.002
10 RESD © 2018
http://apc.aast.edu
[5] Y. Du, S. Lukic, B. Jacobson and A. Huang.
“Review of high power isolated bi-directional dc-
dc converters for phev/ev dc charging
infrastructure,” Proc. of IEEE Energy Conversion
Congress and Exposition, 2011, pp. 553-560. .
[6] SAE Electric Vehicle and Plug in Hybrid Electric
Vehicle Conductive Charge Coupler, SAE
International Surface Vehicle Recommended
Practice, J1772, Oct. 2012.
[7] S. Li and C. C. Mi. “Wireless power transfer for
electric vehicle applications,” IEEE Journal of
Emerging and Selected Topics in Power
Electronics, vol. 3, no. 1, pp. 4-17, March 2015.
[8] G. A. Covic and J. T. Boys. “Inductive Power
Transfer,” Proc. of the IEEE, vol. 101, no. 6,
2013, pp. 1276-1289. .
[9] D. Rozario, V. K. Pathipati, A. Ram, N. A. Azeez
and S. S. Williamson. “Modified resonant
converters for contactless capacitive power
transfer systems used in EV charging
applications,” Proc. of 42nd Annual Conference
of the IEEE Industrial Electronics Society,
Florence, 2016, pp. 4510-4517.
[10] F. Z. Peng. “Z-source inverter,” IEEE
Transactions on Industrial Electronics, vol. 39,
no. 2, pp. 504-510, 2003.
[11] G. Carli and S. S. Williamson. “Technical
considerations on power conversion for electric
and plug-in hybrid electric vehicle battery
charging in photovoltaic installations,” IEEE
Transactions on Power Electronics, vol. 28, no.
12, pp. 5784- 5792, 2013.
[12] S. A. Singh, G. Carli, N. A. Azeez and S. S.
Williamson. “A modified Z-source converter
based single phase PV/grid inter-connected DC
charging converter for future transportation
electrification,” Proc. of IEEE Energy Conversion
Congress and Exposition (ECCE), Milwaukee,
WI, 2016, pp. 1-6.
[13] W. E. Rippel and A. G. Cocconi. “Integrated
motor drive and recharge system,” U.S. Patent
5099186, Mar. 1992.
[14] G. Cocconi. “Combined motor drive and battery
charger system,” U.S. Patent 5 341 075, Aug.
1994.
[15] S. Haghbin, S. Lundmark, M. Alakula and O.
Carlson. “Grid-connected integrated battery
chargers in vehicle applications: Review and
new solution,” IEEE Transactions on Industrial
Electronics, vol. 60, no. 2, pp. 459-473, Feb.
2013.
[16] M. Yilmaz and P. T. Krein. “Review of battery
charger topologies, charging power levels, and
infrastructure for plug-in electric and hybrid
vehicles,” IEEE Transactions on Power
Electronics., vol. 28, no. 5, pp. 2151-2169, May
2013.
[17] AC Propulsion EV Drive System Specifications,
2008. AC Propulsion Inc. technical note;
[Online]. Available
http://www.acpropulsion.com.html.
[18] S. Lacroix, E. Laboure and M. Hilairet. “An
integrated fast battery charger for electric
vehicle,” Proc. IEEE Vehicle Power and
Propulsion Conference, Lille, France, 2010, pp.
1-6.
[19] L. De-Sousa and B. Bouchez. “Combined
electric device for powering and charging,” Int.
Patent WO 2010/057892 A1, 2010.
[20] G. Pellegrino, E. Armando and P.Guglielmi. “An
integral battery charger with power factor
correction for electric scooter,” IEEE
Transactions on Power Electronics, vol. 25, no.
3, pp. 751-759, Mar. 2010.
[21] F. Lacressonniere and B. Cassoret. “Converter
used as a battery charger and a motor speed
controller in an industrial truck,” Proc. European
Power Electronic conference, 2005, pp. 1-7.
[22] S. Haghbin, S. Lundmark, M. Alakula and O.
Carlson. “An isolated high-power integrated
charger in electrified vehicle applications,” IEEE
Transactions on Vehicle. Technology, vol. 60,
no. 9, pp. 4115–4126, Nov. 2011.
[23] S. Haghbin, K. Khan, S. Zhao, M. Alakula, S.
Lundmark and O. Carlson. “An integrated 20-kW
motor drive and isolated battery charger for plug-

Journal of Renewable Energy and Sustainable Development (RESD) Volume 4, Issue 1, June 2018 - ISSN 2356-8569 http://dx.doi.org/10.21622/RESD.2018.04.1.002
11 RESD © 2018
http://apc.aast.edu
in vehicles,” IEEE Transactions on Power
Electronics, vol. 28, no. 8, pp. 4013-4029, Aug.
2013.
[24] K. Khan, S. Haghbin, M. Leksell and
O.Wallmark. “Design and performance analysis
of a permanent-magnet assisted synchronous
reluctance machine for an integrated charger
application,” Proc. Int. Conf. Elect.Mach., 2010,
pp. 1-6.
[25] J. Liang, W. Li, Z. Song and Y. Shi. “An
integrated battery charger base on split-winding
switched reluctance motor drive,” Proc. IEEE
Transportation Electrification Conference and
Expo, Asia-Pacific (ITEC Asia-Pacific), Busan,
2016, pp. 106-111.
[26] I. Subotic, N. Bodo and E. Levi, “Single-phase
on-board integrated battery chargers for EVs
based on multiphase machines,” IEEE Trans.
Power Electron., vol. 31, no. 9, pp. 6511-6523,
Sept. 2016.
[27] M. S. Diab, A. A. Elserougi, A. S. Abdel-Khalik,
A. M. Massoud and S. Ahmed. “A nine-switch-
converter-based integrated motor drive and
battery charger system for EVs using
symmetrical six-phase machines,” IEEE
Transactions on Industrial Electronics, vol. 63,
no. 9, pp. 5326-5335, Sept. 2016.
[28] I. Subotic, M. Jones and E. Levi. “A fast on-
board integrated battery charger for four-motor
EVs,” Proc. IEEE Conference on Electrical
Machines (ICEM), Berlin, 2014, pp. 2066-2072.
[29] H. C. Chang and C. M. Liaw. “Development of a
compact switched-reluctance motor drive for EV
propulsion With voltage-boosting and PFC
charging capabilities,” IEEE Transactions on
Vehicle Technology, vol. 58, no. 7, pp. 3198-
3215, Sept. 2009.
[30] C. Gan, J. Wu, Y. Hu, S. Yang, W. Caoand J. M.
Guerrero. “New integrated multilevel converter
for switched reluctance motor drives in plug-in
hybrid electric vehicles with flexible energy
conversion," IEEE Transactions on Power
Electronics, vol. 32, no.99, pp.3754-3766.
[31] M. Quraan, T. Yeo and P. Tricoli. “Design and
control of modular multilevel converters for
battery electric vehicles,” IEEE Transactions on
Power Electronics, vol. 31, no. 1, pp. 507-517,
Jan. 2016.
[32] F. Helling, J. Glück, A. Singer and T. Weyh.
“Modular multilevel battery (M2B) for electric
vehicles,” Proc. European Conference on Power
Electronics and Applications (EPE'16 ECCE
Europe), Karlsruhe, 2016, pp. 1-9.
[33] N. Li, F. Gao, T. Yang, L. Zhang, Q. Zhang and
G. Ding. “An integrated electric vehicle power
conversion system using modular multilevel
converter,’ Proc. IEEE Energy Conversion
Congress and Exposition (ECCE), Montreal, QC,
2015, pp. 5044-5051.
[34] M. Tsirinomeny and A. Rufer. “Configurable
modular multilevel converter (CMMC) for flexible
EV,” Proc. of European Conference on Power
Electronics and Applications (EPE'15 ECCE-
Europe), Geneva, 2015, pp. 1-10.
[35] S. Rohner, S. Bernet, M. Hiller and R. Sommer.
“Modulation, losses, and semiconductor
requirements of modular multilevel converters,”
IEEE Transactions on Industrial Electronics, vol.
57, no. 8, pp. 2633-2642, Aug. 2010.
[36] S. Debnath, J. Qin, B. Bahrani, M. Saeedifard
and P. Barbosa. “Operation, control, and
applications of the modular multilevel converter:
A review,” IEEE Transactions on Power
Electronics, vol. 30, no. 1, pp. 37-53, Jan. 2015.
[37] Morrow, D. Karner and J. Francfort. “Plug-in
hybrid electric vehicle charging infrastructure
review,” U.S. Dept. Energy—Vehicle
Technologies Program, Washington, DC, INL-
EXT-08-15058, 2008.
[38] M. Yilmaz and P. T. Krein. “Review of battery
charger topologies, charging power levels, and
infrastructure for plug-in electric and hybrid
vehicles,” IEEE Transactions on Power
Electronics, vol. 28, no. 5, pp. 2151-2169, May
2013.
[39] M. A. Fasugba and P. T. Krein, “Gaining vehicle-
to-grid benefits with unidirectional electric and
Journal of Renewable Energy and Sustainable Development (RESD) Volume 4, Issue 1, June 2018 - ISSN 2356-8569 http://dx.doi.org/10.21622/RESD.2018.04.1.002
12 RESD © 2018
http://apc.aast.edu
plug-in hybrid vehicle chargers,” Proc. IEEE Veh.
Power and Propulsion Conf., Sep. 2011, pp. 1-6.
[40] X. Zhou, S. Lukic, S. Bhattacharya and A.
Huang. “Design and control of grid-connected
converter in Bi-directional battery charger for
plugin hybrid electric vehicle application,” Proc.
IEEE Vehicle Power and Propulsion Conf., Sep.
2009, pp. 1716-1721.
[41] Y. Lee, A. Khaligh and A. Emadi “Advanced
integrated bi-directional AC/DC and DC/DC
converter for plug-in hybrid electric vehicles,”
IEEE Transactions on Vehicle Technology, vol.
58, no. 3, pp. 3970-3980, Oct. 2009.
[42] K. Keun-Wan, K. Dong-Hee, W. Dong-Gyun and
L. Byoung-Kuk. “Topology comparison for 6.6
kW On board charger: Performance, efficiency,
and selection guideline,” Proc. IEEE VPPC,
2012, pp. 1520-1524.
[43] B. Singh, B. N. Singh, A. Chandra, K. Al-
Haddad, A. Pandey and D. P. Kothari. “A review
of single-phase improved power quality AC–DC
converters,” IEEE Transactions on Industrial
Electronics, vol. 50, no. 5, pp. 962-981, Oct.
2003.
[44] D. Xu, J. Zhang, W. Chen, J. Lin and F. C. Lee.
“Evaluation of output filter capacitor current
ripples in single phase PFC converters,” Proc.
PCC, Osaka, Japan, 2002, vol. 3, pp. 1226-
1231.
[45] L. Petersen and M. Andersen. “Two-stage power
factor corrected power supplies: The low
component-stress approach,” Proc. IEEE APEC,
vol. 2, 2002, pp. 1195-1201.
[46] B. Lu, R. Brown and M. Soldano. “Bridgeless
PFC implementation using one cycle control
technique,” Proc. IEEE Appl. Power Electron.
Conf. Expo., vol. 2, 2005, pp. 812-817.
[47] C. Petrea and M. Lucanu. “Bridgeless power
factor correction converter working at high load
variations,” in Proc. ISSCS, vol. 2, 2007,pp. 1-4.
[48] M. Kwon and S. Choi. “An electrolytic
capacitorless bidirectional EV charger for V2G
and V2H applications,” in IEEE Transactions on
Power Electronics, vol. 32, no. 9, pp. 6792-6799,
Sept. 2017.
[49] T. Nussbaumer, M. Baumann and J. W. Kolar.
“Comparative evaluation of modulation methods
of a three-phase buck + boost PWM rectifier.
Part II: Experimental verification,” Power
Electronics, IET, vol. 1, no. 2, pp. 268-274, Jun.
2008.
[50] T. Nussbaumer and J. W. Kolar. “Comparison of
3-phase wide output voltage range PWM
rectifiers,” IEEE Transactions on Industrial
Electronics, vol. 54, no. 6, pp. 3422-3425, Dec.
2007.
[51] M. Pahlevaninezhad, P. Das, J. Drobnik, P. K.
Jain and A. Bakhshai. “A ZVS interleaved boost
AC/DC converter used in plug-in electric
vehicles, ” IEEE Transactions on Power
Electronics, vol. 27, no. 8, pp. 3513-3529,Aug.
2012.
[52] A. Khaligh and S. Dusmez. “Comprehensive
topological analysis of conductive and inductive
charging solutions for plug-in electric vehicles,”
IEEE Transactions on Vehicle Technology, vol.
61, no. 8, pp. 3475-3489, Oct. 2012.
[53] F. Musavi, M. Craciun, D. S. Gautam,W. Eberle
andW. G. Dunford. “An LLC resonant DC-DC
converter for wide output voltage range battery
charging applications,” IEEE Transactions on
Power Electronics, vol. 28, no. 12, pp. 5437-
5445, Dec. 2013.
[54] F. Musavi, M. Craciun, M. Edington, W. Eberle
and W. G. Dunford. “Practical design
considerations for a LLC multi-resonant DC-DC
converter in battery charging applications,” Proc.
27th Annual IEEE APEC Expo., 2012, pp. 2596-
2602.
[55] IEEE Recommended Practices and
Requirements for Harmonic Control in Electrical
Power Systems, IEEE Std. 519-1992, 1992.
[56] Compliance Testing to the IEC 1000-3-2 (EN
61000-3-2) and IEC 1000- 3-3 (EN 61000-3-3)
Standards, Agilent Technology.
[57] T. S. Key and J.-S. Lai. “IEEE and international
harmonic standards impact on power electronic

Journal of Renewable Energy and Sustainable Development (RESD) Volume 4, Issue 1, June 2018 - ISSN 2356-8569 http://dx.doi.org/10.21622/RESD.2018.04.1.002
13 RESD © 2018
http://apc.aast.edu
equipment design,” in Proc. IECON, vol. 2,
1997,pp. 430-436.
[58] Fairchild document Design Consideration for
Battery Charger Using Green Mode Fairchild
Power Switch. (2007) [Online]. Available:
www.fairchildsemi.com.
[59] C. H. Lin, C. Y. Hsieh and K. H. Chen. “A Li-ion
battery charger with smooth control circuit and
built-in resistance compensator for achieving
stable and fast charging,” IEEE Transactions on
Circuits Systems I, Reg. Papers, vol. 57, no. 2,
pp. 506-517, Feb. 2010.
[60] S.- H. Yang, J. Liu, Y. H. Wu, D. S. Wang and C.
C. Wang. “A high voltage battery charger with
smooth charge mode transition in BCD process,”
Proc. IEEE Int. Symp. Circuits Syst., May 2011,
pp. 813-816.
[61] M. Yilmaz and P. T. Krein. “Review of battery
charger topologies, charging power levels, and
infrastructure for plug-in electric and hybrid
vehicles,” IEEE Trans. Power Electron., vol. 28,
no. 5, pp. 2151-2169, May 2013.
[62] D. H. Kim, M. J. Kim and B. K. Lee, “An
integrated battery charger with high power
density and efficiency for electric vehicles,” IEEE
Transactions on Power Electronics, vol. 32, no.
6, pp. 4553-4565, June 2017.
[63] R. Hou and A. Emadi. “A primary full-integrated
active filter auxiliary power module in electrified
vehicles with single-phase onboard chargers,”
IEEE Transactions on Power Electronics, vol.
32, no. 11, pp. 8393-8405, Nov. 2017.

Journal of Renewable Energy and Sustainable Development (RESD) Volume 4, Issue 1, June 2018 - ISSN 2356-8569 http://dx.doi.org/10.21622/RESD.2018.04.1.014
14 RESD © 2018 http://apc.aast.edu
A Review of Using Supercritical CO2 Brayton Cycle in
Renewable Energy Applications Wen-xiao Chu, Katrine Bennett, Jie Cheng and Yi-Tung Chen*
Department of Mechanical Engineering, University of Nevada, Las Vegas, NV 89154, USA
*Corresponding author: Tel: +1 (702)895-1202
Abstract - Supercritical carbon dioxide (sCO2), which
is an environmentally friendly working fluid, has very
good thermal physical properties. Many researchers
have studied the heat transfer mechanism and the
enhanced heat transfer method of the supercritical
CO2 Brayton cycle (sCO2-BC). The sCO2-BC has
many applications including the next generation of
Fast Cooling Reactor (FCR), solar power system,
extraction process and heat pump system. The sCO2-
BC provides high efficiency and high compactness,
which is important because system miniaturization is
vital to these developing technologies. The present
paper reviews the recent references on the research
progress of the sCO2-BC system. Furthermore, it
discusses the analysis of key components such as the
compressor, turbine and heat exchanger, which differ
from the devices used in the conventional steam
Rankine cycle due to the special thermal properties of
sCO2. Finally, the researchers propose some
recommendations towards the development of sCO2-
BC system for future work.
Keywords - Supercritical CO2 Brayton cycle;
Compressor; Turbine; Heat exchanger
I. INTRODUCTION
Carbon emissions are increasing rapidly due to the
increasing rate of energy consumption by human
beings. The utilizations of renewable energy
conversion systems, like nuclear and solar energies,
are imperative to slow or stop the environment
pollution and destruction caused by carbon
emissions. Carbon dioxide (CO2), which is an
environmentally friendly working fluid, has excellent
thermal properties when used in a supercritical state.
Supercritical CO2 (sCO2) is capable of performing
expansion working with a lower pressure residence
when compared with steam. For this reason, Feher [1]
proposed using sCO2 as a working fluid in the
Brayton cycle in 1967. The sCO2 Brayton cycle
(sCO2-BC) is an attractive working fluid for nuclear
reactor systems [2-4], solar power systems [5-7] and
other renewable systems [8-11], because of its high
overall efficiency due to special thermal properties [12].
The density of sCO2 is of the same order of
magnitude as water. However, the sCO2 viscosity is
similar to that of air. Fig. 1 illustrates the overall cycle
efficiency of the sCO2-BC evaluated from the turbine
inlet temperature in the reactor system compared with
other thermal cycles [3]. The sCO2-BC has a much
higher efficiency, than other cycles, when the turbine
inlet temperature is over 550oC. It is possible for the
overall efficiency of the sCO2-BC to exceed 50%. The
cycle efficiency of the sCO2-BC with the turbine inlet
temperature of 550oC is expected to be compared
with the helium cycle at 750oC, which means that the
cost of materials can significantly be decreased.
Thus, the sCO2-BC has great potential for industrial
applications [2].
Fig .1. Comparison of power cycle options [3]
Due to the excellent thermal properties of sCO2, the
sCO2-BC requires significant fewer turbine stages
than a cycle using helium or steam under the same
thermal power level. Additionally, the operating
pressure of sCO2-BC is always higher than 10 MPa,
which allows the compressor, turbine and heat
exchanger to be more compact [13]. On the other
hand, it is crucial to design and optimize such
components for a long-term operation under high
temperature and high-pressure conditions. Therefore,

Journal of Renewable Energy and Sustainable Development (RESD) Volume 4, Issue 1, June 2018 - ISSN 2356-8569 http://dx.doi.org/10.21622/RESD.2018.04.1.014
15 RESD © 2018
http://apc.aast.edu
the safety, stability and reliability of the operating
components in the system should be considered and
studied comprehensively [14,15].
In this paper, the performance evaluation, system
optimization and economic analysis studies of sCO2-
BC systems from the last five years are reviewed.
Other studies of related key components, such as the
compressor, turbine and heat exchanger, are
introduced briefly. Then, some recommendations are
proposed based on the latest studies.
II. STUDIES ON THE SCO2-BC SYSTEM
The original thermo-dynamic process of sCO2-BC is
shown in Fig. 2, with only some basic components
illustrated. In order to improve the overall efficiency of
sCO2-BC, some more complex system compositions
are developed. Wang et al. [16] summarize the six
typical layouts of sCO2-BC. These include the simple
recuperation cycle, recompression cycle,
precompression cycle, intercooling cycle, partial-
cooling cycle and split expansion cycle. The
derivative relationships between these six typical
layouts of sCO2-BC are shown in Fig. 3. It can be
seen that the systems are gradually improved as the
necessary components are added into the original
cycle to overcome the deficiencies.
Heat exchanger
Compressor
Turbine
Heat source
Cooler
1
2 3 4
56
1
2
3
4
5
6
Critical point
Fig .2. Original supercritical CO2 Brayton cycle (sCO2-BC)
The sCO2-BC can be used in the very high
temperature reactor (VHTR) and the fast cooled
reactor, which are proposed by the U.S. Department
of Energy’s Next Generation Nuclear Plant (NGNP) [17]. The simplified design and compact size of the
sCO2-BC may reduce the installation, maintenance
and operation cost [7]. Dostal et al. [2-4] created the
preliminary design for the compressor, turbine and
heat exchanger of the sCO2-BC in a 600 MW reactor
system including detailed volume and the cost
estimation. Furthermore, three typical direct cycle
designs were further investigated, in which the plant
layout and the control scheme design were also
included.
With the growing interest in renewable energy, the
sCO2-BC applicability in the field of solar energy is
investigated. The sCO2-BC configurations were
explored and optimized for use in a concentrating
solar power (CSP) application combined with a dry
cooling process, which might achieve the efficiency
with 50% or greater [5]. Ortega et al. [6] analyzed the
sCO2-BC in a solar receiver with the power of 0.3-0.5
MW using MATLAB, which can predict the thermal
performance of the receiving equipment coupling with
the radiation mechanisms. Moreover, it was proposed
that the transient nature of the solar resource is the
biggest challenge in the CSP system. Nami et al. [14]
proposed a standard for evaluating the compressor,
turbine, recuperator and cooler considering the
factors of energy, economic and environment.
Iverson et al. [18] studied the behavior of sCO2-BC in
response to a fluctuating thermal input. The
investigation was similar to short-term transient
environments and the results showed good
agreement with experimental data. Padilla et al. [19]
conducted a multi-objective optimization of the
compressor, turbine and recuperator on the thermal
performance of the sCO2-BC. It was determined that
the more compact characteristics of designing a
compressor and turbine operating with the
supercritical fluid must be overcome in order to
successfully bring the technology to the market.
These challenges include the fact that all the
components should be designed with a more
compact structure because of the miniaturization
characteristics of sCO2-BC. Recent studies focused
on optimizing the design of the key components, like
the compressor, turbine and heat exchanger, which is
described next.

Journal of Renewable Energy and Sustainable Development (RESD) Volume 4, Issue 1, June 2018 - ISSN 2356-8569 http://dx.doi.org/10.21622/RESD.2018.04.1.014
16 RESD © 2018 http://apc.aast.edu
Fig .3. Schematic of derivative relationships of six typical sCO2-
BC [16]
III. STUDIES OF SCO2-BC COMPONENTS
1. Supercritical CO2 Compressor and Turbine
The compressor increases the working fluid pressure
from a low to a very high pressure, which can be
seen in the Temperature-Entropy (T-S) diagram
shown in Fig. 2. Cardemil et al. [20] recognized that
CO2 has better comprehensive performance when
operated at supercritical conditions. The effect of the
compressor on the overall efficiency of the sCO2-BC
was studied by Dyreby [21]. The results indicated that
the overall efficiency could be improved by increasing
the compressor inlet pressure. However, it was found
that the increase of compressor outlet pressure never
affects the thermal efficiency. Ibsaine [22] presented a
new compressor design concept, which was
especially suited for sCO2 heat pump applications.
The compressor consists of an integrated thermal
system that consists of a thermal compressor and a
conventional vapor compression heat pump. The
computational model was verified by comparison with
experimental measurements from the thermal
compressor prototype. In Ibsaine’s study, the impacts
of the size of dead spaces and leaks between the
displacer and the cylinder wall were studied
parametrically. Pecnik [23] investigated a high-speed
centrifugal compressor operating with sCO2 and
compared the results with data from tests in the
Sandia sCO2 compression loop facility. Then, Lettieri
et al. [24] studied a multistage compressor operating
with supercritical CO2 by CFD method. The thermal
properties of supercritical CO2 was calculated with
the National Institute of Standards and Technology
real gas model [25]. In order to improve the stage
efficiency, a vaned diffuser was analyzed instead of
the standard vaneless diffuser in order to decrease
the meridional velocity and widen the gas path.
Rinaldi el al. [26] calculated the compressor map for
three different rotational speeds (45 krpm, 50 krpm
and 55 krpm) and the methodology and results were
validated against experimental data from the Sandia
National Laboratory. The comprehensive assessment
of sCO2 real gas effects is important for evaluating
the performance of compressor considering the high
variability of thermal properties of sCO2. Baltadjiev [27]
investigated the centrifugal compressors at different
thermodynamic conditions relative to the pseudo-
critical point of CO2. The results indicated that it has a
reduction of 9% in the choke margin of the stage due
to the thermal properties variations and the
condensation was not a concern at the investigated
operating conditions.
The turbine is the component used for power
generation, and as such, it can directly indicate the
system efficiency. The sCO2 turbine is far smaller
than the steam turbine due to its low pressure-ratio.
Furthermore, the sCO2 turbine is much simpler than
the steam one because it does not need to allow for
phase change and moisture separation. Kato et al. [28]
found that the sCO2 gas turbine reactor system, with
a partial pre-cooling cycle, attained the excellent
cycle efficiency of 45.8% at the temperature of
650oC. Chen [29] proposed the centrifugal prototype
turbine using the sCO2-BC and analyzed the
performance with experimental and numerical
methods. The shape and size of the nozzle of the
supercritical CO2 turbine was optimized and it was
found that choked flow did not occur when the
diameter of the nozzle was larger than 0.7 mm.
Additionally; the turbine output torques and the
electric power generation can be improved with the
increase of the nozzle inner diameter. The achievable
thermal cycle efficiencies of the steam turbine cycle,
helium turbine cycle and sCO2 turbine cycle were
studied and compared by Ishiyama [30]. These
efficiencies were found to be 40%, 34% and 42%,
respectively, when the heat source temperature is
480oC. Furthermore, the volume of a sCO2 turbine
was estimated to be only half that of a steam turbine
generating the same power.

Journal of Renewable Energy and Sustainable Development (RESD) Volume 4, Issue 1, June 2018 - ISSN 2356-8569 http://dx.doi.org/10.21622/RESD.2018.04.1.014
17 RESD © 2018
http://apc.aast.edu
2. Supercritical CO2 Heat Exchanger
In the sCO2-BC, the recuperator and cooler, which
play important roles in maintaining safe operations,
always have significant impacts on the efficiency of
the whole system. The shell-and-tube heat exchanger
(STHE), which has been used for nearly a hundred
years and has a mature manufacturing process, is
now in wide use in the high pressure and high
temperature systems [31]. However, the application of
the STHE is limitated by its required large volume
and high cost when systems require compactness
and miniaturization. In recent decades, the HEATRIC
Company has developed a new type of printed circuit
heat exchanger (PCHE) [32]. This new PCHE meets
compactness requirements and can reliably operate
for long term in extreme temperature and pressure
conditions. The PCHE has performed excellently
when used in the SCO2-BC system.
Mylavarapu et al. [33-36] at Ohio State University
investigated the PCHE in the high temperature
helium facility (HTHF) with experimental and
numerical methods. The straight fins of Alloy 617
plates were fabricated by photochemical etching and
assembled by diffusion bonding. The experimental
test data could be used to determine the design
operating conditions for the PCHE in the HTHF. Ma
et al. [37] also analyzed the thermal and hydraulic
performance of a PCHE with zigzag fins. It was found
that the flow could not be fully-developed at the high
temperature due to the significant variation of the
thermal physical properties of sCO2. Tsuzuki et al. [38-
40] developed a new PCHE with S-shaped fins. They
validated numerically that the PCHE with S-shape
fins had the same heat transfer performance as the
zigzag PCHE but with the benefit of one-fifth of the
pressure drop. With continued focus on fin structures,
the heat transfer performance of a PCHE with airfoil
shaped fins was proposed and analyzed by Kim et al. [41]. It can be seen that the PCHE with airfoil shaped
fin can obtain the same heat transfer performance as
the zigzag channel PCHE with only 1/12 the pressure
drop. This is due to the streamlined fin shape and the
increase of heat transfer area. Furthermore, Xu et al. [42] analyzed the airfoil fin structure parametrically and
proposed that it was necessary to reduce the flow
resistance along the flow direction in order to improve
the comprehensive thermal hydraulic performance of
the PCHE.
IV. CONCLUSIONS
The sCO2-BC is an efficient thermodynamic cycle
due to the excellent thermal properties of the sCO2,
which have significantly improved the systems overall
performance when compared with other conventional
cycles. Researchers have studied the sCO2-BC
system extensively, including performance evaluation
and component optimization.
The sCO2-BC has very high overall efficiency,
possibly above 50%. The sCO2-BC may be used
in the next generation reactor systems and solar
power systems, which can significantly reduce the
system volume.
It is a challenge to design the compressor and
turbine with sCO2 working fluid for stable system
operation. The sCO2 compressor and turbine are
far smaller than conventional ones due to the low
pressure ratio, which can definitely contribute to
the system miniaturization.
The PCHE is a compact heat exchanger with a
volume of 85% that of a comparable STHE.
Complex fin structures for the PCHE have been
developed; ranging from continuous zigzag shape
to discontinuous airfoil shape, which aim to
improve the comprehensive performance.
According to the investigation review above, some
recommendations for future work of the sCO2-BC
system are proposed. Firstly, the material problem is
now becoming the focus, due to system operating
temperatures and pressures exceeding 700oC and 20
MPa, respectively. Secondly, the behavior and the
performance of the compressor and turbine operating
close to the critical point, should be tested and
evaluated due to the high variability of sCO2 thermal
properties. Finally, the dynamic analysis of the entire
system should be studied with transient analysis in
cases of great fluctuation, to ensure the system
should operate near the stability point very well.
V. ACKNOWLEDGEMENTS
This material is based upon work financially
supported by the U.S. National Science Foundation
under Grant No. IIA-1301726.

Journal of Renewable Energy and Sustainable Development (RESD) Volume 4, Issue 1, June 2018 - ISSN 2356-8569 http://dx.doi.org/10.21622/RESD.2018.04.1.014
18 RESD © 2018 http://apc.aast.edu
REFERENCES
[1] E.G. Feher. "The supercritical thermodynamic
power cycle," Energy conversion, vol. 8, no. 2,
pp 85-90, 1968.
[2] V. Dostal, M.J. Driscoll and P. Hejzlar et al. "A
supercritical CO2 gas turbine power cycle for
next-generation nuclear reactors," American
Society of Mechanical Engineers, pp. 567-574,
2002.
[3] V. Dostal, M.J. Driscoll and P. Hejzlar et al. "A
supercritical CO2 cycle for fast gas-cooled
reactors," American Society of Mechanical
Engineers, pp. 683-692, 2004.
[4] V. Dostal. "A supercritical carbon dioxide cycle
for next generation nuclear reactors,"
Massachusetts Institute of Technology, 2004.
[5] M.A. Reyes-Belmonte, A. Sebastian and M.
Romero et al. "Optimization of a recompression
supercritical carbon dioxide cycle for an
innovative central receiver solar power plant,"
Energy, vol. 112, pp. 17-27, 2016.
[6] J. Ortega, S. Khivsara and J. Christian et al.
"Coupled modeling of a directly heated tubular
solar receiver for supercritical carbon dioxide
Brayton cycle: Optical and thermal-fluid
evaluation," Applied Thermal Engineering, vol.
109, pp. 970-978, 2016.
[7] C.S. Turchi, Z.W. Ma and T. W. Neises et al.
"Thermodynamic study of advanced supercritical
carbon dioxide power cycles for concentrating
solar power systems," ASME Journal of Solar
Energy Engineering-Transactions, vol. 135, no.
4, pp. 7, 2013.
[8] M. Chauvet, M. Sauceau and J. Fages.
"Extrusion assisted by supercritical CO2: A
review on its application to biopolymers," Journal
of Supercritical Fluids, vol. 120, pp. 408-420,
2017.
[9] S.M.S. Mahmoudi, A.D. Akbari and M.A. Rosen.
"Thermoeconomic analysis and optimization of a
new combined supercritical carbon dioxide
recompression Brayton/Kalina cycle,"
Sustainability, vol. 8 , no. 10, pp. 19, 2016.
[10] M. Mecheri and Y. Le Moullec. "Supercritical
CO2 Brayton cycles for coal-fired power plants,"
Energy, vol. 103, pp. 758-771, 2016.
[11] M. Mehrpooya, P. Bahramian and F. Pourfayaz
et al. "Introducing and analysis of a hybrid
molten carbonate fuel cell-supercritical carbon
dioxide Brayton cycle system," Sustainable
Energy Technologies and Assessments, vol. 18,
pp. 100-106, 2016.
[12] P. Kumar and K. Srinivasan. "Carbon dioxide
based power generation in renewable energy
systems," Applied Thermal Engineering, vol.
109, pp. 831-840, 2016.
[13] T. Ma, W.X. Chu and X.Y. Xu et al. "An
experimental study on heat transfer between
supercritical carbon dioxide and water near the
pseudo-critical temperature in a double pipe
heat exchanger," International Journal of Heat
and Mass Transfer, vol. 93, pp. 379-387, 2016.
[14] H. Nami, S.M.S. Mahmoudi and A. Nemati A.
"Exergy, economic and environmental impact
assessment and optimization of a novel
cogeneration system including a gas turbine, a
supercritical CO2 and an organic Rankine
cycle," Applied Thermal Engineering, vol. 110,
pp. 1315-1330, 2017.
[15] H. Zhao, Q.H. Deng and W.T. Huang et al.
"Thermodynamic and economic analysis and
multi-objective optimization of supercritical CO2
Brayton cycles," ASME Journal of Engineering
for Gas Turbines and Power-Transactions, vol.
138, no.8, pp. 9, 2016.
[16] K. Wang, Y.L. He and H.H. Zhu. Integration
between supercritical CO2 Brayton cycles and
molten salt solar power towers: A review and a
comprehensive comparison of different cycle
layouts," Applied Energy, vol. 195, pp. 819-836,
2017.
[17] R. Mizia, D. Clark and M. Glazoff et al. Progress
Report for Diffusion Welding of the NGNP
Process Application Heat Exchangers,
December, 2011.
[18] B.D. Iverson, T.M. Conboy and Pasch et al.
"Supercritical CO2 Brayton cycles for solar-
Journal of Renewable Energy and Sustainable Development (RESD) Volume 4, Issue 1, June 2018 - ISSN 2356-8569 http://dx.doi.org/10.21622/RESD.2018.04.1.014
19 RESD © 2018
http://apc.aast.edu
thermal energy," Applied Energy, vol. 111, pp.
957-970, 2013.
[19] R.V. Padilla, RV Y.C.S.Too YCS and R. Benito
R et al. "Thermodynamic feasibility of alternative
supercritical CO2 Brayton cycles integrated with
an ejector," Applied Energy, vol. 169, pp. 49-62,
2016.
[20] J.M. Cardemil and A.K. da Silva. "Parametrized
overview of CO2 power cycles for different
operation conditions and configurations - An
absolute and relative performance analysis,"
Applied Thermal Engineering, vol. 100, pp. 146-
154, 2016.
[21] J. Dyreby, S. Klein S and G. Nellis G et al.
"Design considerations for supercritical carbon
dioxide Brayton cycles with recompression,"
ASME Journal of Engineering for Gas Turbines
and Power-Transactions, vol. 136, no. 10, pp. 9,
2014.
[22] R. Ibsaine, J.M. Joffroy and P. Stouffs.
"Modelling of a new thermal compressor for
supercritical CO2 heat pump," Energy, vol. 117,
pp. 530-539, 2016.
[23] R. Pecnik, E. Rinaldi and P. Colonna.
"Computational fluid dynamics of a radial
compressor operating with supercritical CO2.
ASME Journal of Engineering for Gas Turbines
and Power-Transactions, vol. 134, no. 12, pp. 8,
2012.
[24] C. Lettieri, N. Baltadjiev and M. Casey M et al.
"Low-flow-coefficient centrifugal compressor
design for supercritical CO2. ASME Journal of
Turbomachinery-Transactions, vol. 136, no. 8,
pp. 9, 2014.
[25] NIST Web-Page, From. Available:
http://webbook.nist.gov/chemistry/fluid, July 31,
2009.
[26] E. Rinaldi, R. Pecnik and P. Colonna.
"Computational fluid dynamic simulation of a
supercritical CO2 compressor performance
map," ASME Journal of Engineering for Gas
Turbines and Power-Transactions, vol. 137, no.
7, pp. 7, 2015.
[27] N.D. Baltadjiev, C. Lettieri and Z.S. Spakovszky
. An investigation of real gas effects in
supercritical CO2 centrifugal compressors,"
ASME Journal of Turbomachinery-Transactions,
vol. 137, no. 9, pp. 13, 2015.
[28] Y. Kato, T. Nitawaki and Y. Muto. "Medium
temperature carbon dioxide gas turbine reactor,"
Nuclear Engineering and Design, vol. 230, no.1-
3, pp. 195-207, 2004.
[29] M.F. Chen, H. Yamaguchi and X.W. Zhang et al.
"Performance analyses of a particularly
designed turbine for a supercritical CO2-based
solar Rankine cycle system. International
Journal of Energy Research," vol. 39, no. 13, pp.
1819-1827, 2015.
[30] S. Ishiyama, Y. Muto and Y. Kato et al. "Study of
steam, helium and supercritical CO2 turbine
power generations in prototype fusion power
reactor," Progress in Nuclear Energy, vol. 50,
no. 2-6, pp. 325-332, 2008.
[31] Z.H. Li, Y.L. Zhai and K,Z. Li et al. "A
quantitative study on the interaction between
curvature and buoyancy effects in helically
coiled heat exchangers of supercritical CO2
Rankine cycles," Energy, vol. 116, pp. 661-676,
2016.
[32] Heatric. Compact diffusion-bonded heat
exchangers-The future of heat transfer
engineering. Heatric Division of Meggitt (UK)
Limited: Dorset, UK, 2011.
[33] S. Mylavarapu, X. Sun and J. Figley et al.
"Investigation of high-temperature printed circuit
heat exchangers for very high temperature
reactors," Journal of Engineering for Gas
Turbines and Power, vol. 131, no. 6, pp.
062905-7, 2009.
[34] S.K. Mylavarapu, X. Sun and R.N. Christensen
et al. "Fabrication and design aspects of high-
temperature compact diffusion bonded heat
exchangers," Nuclear Engineering and Design,
vol. 249, pp. 49-56, 2012.
[35] S.K. Mylavarapu, X.D. Sun and R.E. Glosup et
al. "Thermal hydraulic performance testing of

Journal of Renewable Energy and Sustainable Development (RESD) Volume 4, Issue 1, June 2018 - ISSN 2356-8569 http://dx.doi.org/10.21622/RESD.2018.04.1.014
20 RESD © 2018 http://apc.aast.edu
printed circuit heat exchangers in a high-
temperature helium test facility," Applied
Thermal Engineering, vol. 65, no. 1-2, pp. 605-
614, 2014.
[36] S.K. Mylavarapu, X.D. Sun and R.N.
Christensen. "Photofabrication and surface
roughness of flow channels for a compact high-
temperature heat exchanger," Transactions of
the American Nuclear Society, vol. 99, pp. 837-
839, 2008.
[37] T. Ma, L. Li and X.Y. Xu et al. "Study on local
thermal-hydraulic performance and optimization
of zigzag-type printed circuit heat exchanger at
high temperature," Energy Conversion and
Management, vol. 104, pp. 55-66, 2015.
[38] T.L. Ngo, Y. Kato and K. Nikitin et al. "New
printed circuit heat exchanger with S-shaped fins
for hot water supplier," Experimental Thermal
and Fluid Science, vol. 30, no. 8, pp. 811-819,
2006.
[39] N. Tsuzuki, Y. Kato and T. Ishiduka . "High
performance printed circuit heat exchanger,"
Applied Thermal Engineering, vol. 27, no. 10,
pp. 1702-1707, 2007.
[40] N. Tsuzuki, M. Utamura and T.L. Ngo . "Nusselt
number correlations for a microchannel heat
exchanger hot water supplier with S-shaped
fins," Applied Thermal Engineering, vol. 29, no.
16, pp. 3299-3308, 2009.
[41] D.E. Kim, M.H. Kim and J.E. Cha JE et al.
"Numerical investigation on thermal–hydraulic
performance of new printed circuit heat
exchanger model," Nuclear Engineering and
Design, vol. 238, no. 12, pp. 3269-3276, 2008.
[42] X. Xu, T. Ma and L. Li et al. "Optimization of fin
arrangement and channel configuration in an
airfoil fin PCHE for supercritical CO2 cycle,"
Applied Thermal Engineering, vol. 70, no. 1, pp.
867-875, 2014.

Journal of Renewable Energy and Sustainable Development (RESD) Volume 4, Issue 1, June 2018 - ISSN 2356-8569 http://dx.doi.org/10.21622/RESD.2018.04.1.021
21 RESD © 2018 http://apc.aast.edu
A PROPOSAL FOR DESERT HOUSE DESIGN IN EGYPT
USING PASSIVE GROUND COOLING TECHNIQUES Prof. Dr. Mohamed Medhat Dorra1, Assoc. Prof. Dr. Hend El-Sayed Farouh2 and Eng. Lubna A. Amer3
Department of Electrical Power and Machines Engineering, Tanta University, Tanta, Egypt
1Professor of Architecture, Faculty of Engineering, Cairo University, Giza, Egypt. 2Associate Prof. of Sustainable Architecture & Urban Development, Housing & Building National Research Center, Giza,
Egypt 3PhD candidate, Faculty of Engineering, Cairo University, Giza, Egypt
[email protected], [email protected]
Abstract - An area less than 5.5% of Egyptian
territory is where most of Egypt‘s population lives. A
narrow strip of land forms the Nile Valley and Delta
sector.
The National Project for Desert Hinterlands is one of
the urban projects targeting rehabilitation of the poor
in alternative villages in the near desert to stop urban
sprawl over agricultural land and decrease congestion
in the old habitats. Low cost energy efficient houses
are the aim of the architect in similar projects taking in
consideration the high electricity consumption of
Egypt’s residential sector.
Based on a literature review, this paper presents a
proposal for designing desert dwellings that
accommodate the hot dry climate by incorporating
passive elements and using stabilized earth blocks as
a local building material. Furthermore, simulation is
used to test alternative proposals. The results show
that an underground constructed house with a sunken
courtyard incorporating an Earth to Air Heat
Exchanger System (EAHE) can reduce between 42-
72% of energy consumption used to achieve thermal
comfort compared to contemporary desert housing
projects.
Keywords - Earth Sheltered Houses, Earth to air
heat Exchangers, Earth cooling Tubes, low cost
energy efficient desert house.
I. INTRODUCTION
The need has arisen to undertake extensive projects
for redistributing the population. The Desert
Hinterlands Villages is one of these projects to
establish low cost desert housing. These projects
should be low cost energy efficient to avoid the
increasing energy demand due to cooling needs.
Farouh and Amer [1] explored the main passive and
hybrid design techniques for low cost energy efficient
housing in hot arid climate. They highly
recommended using the technique of “cooling by
thermal earth inertia”. This was the starting point for
this research in which an approach - to implement
these techniques - was examined by computer
modeling using Design Builder Program
experimenting a proposed Earth sheltered Building
with a sunken courtyard and using Underground
Earth Tubes.
1. Aim of the Study
The authors constructed this work on implementing
passive ground cooling techniques as a proposal for
enhancing thermal performance of desert houses in
Egypt. The aim is to examine the ability of this
proposal in saving energy and achieving thermal
comfort in low cost desert housing in Egypt.
2. Egypt’s Background
A quick look at Egypt’s conditions related to our
study.
3. Egyptian electricity consumption
The Building Sector consumes most of the electricity
(See Fig.1) due to the increased consumption of the
air conditioning machines [2], [3].

Journal of Renewable Energy and Sustainable Development (RESD) Volume 4, Issue 1, June 2018 - ISSN 2356-8569 http://dx.doi.org/10.21622/RESD.2018.04.1.021
22 RESD © 2018 http://apc.aast.edu
Fig .1. Egyptian electricity consumption-
The most consuming areas are the
residential ones. The Egyptian Electricity
Holding Company Annual Report
2009/2010. Egyptian Electricity Holding
Company, Cairo, Egypt, 2010.
Fig .2. Classification of aquifer depth in
Egypt. M. Salim, Selection of
Groundwater Sites in Egypt. Journal of
Advanced Research, 2012
Fig .3. Earth’s energy budget diagram
showing the short-wave (a) and long-
wave (b) energy fluxes. Banks, David. An
Introduction to Thermogeology: Ground
Source: Heating and Cooling. Wiley-
Blackwell, 2012.
A. Groundwater levels
The ground water is found far below the ground
surface in most Egypt's desert area [4] (See Fig. 2).
Therefore, excavations are implemented easily
without the need for water proof materials.
B. Type of soil:
Most Egypt's desert land is a sandy soil and easy to
construct on. Thermal characteristics of soil affect the
underground temperatures, which is a major factor in
energy saving by earth inertia as will be explained
later.
II. LITERATURE REVIEW : PASSIVE GROUND
COOLING
The concept of ground cooling is based on heat
dissipation from a building to the ground which,
during the cooling season, has a temperature lower
than the outdoor air. This dissipation can be achieved
either by direct contact of a significant areas of the
building envelope with the ground (Earth shelters), or
by injecting air that has been previously circulated
underground into the building by means of earth-to-
air heat exchangers (EAHE).
Heat Storage Capacity of the Earth Subsurface
The rocks at the subsurface have high value of
volumetric heat capacity but low value of thermal
conductivity. Therefore, the heat is rather stored than
diffuses through the soil in the upstream [5].
When averaged globally and annually, about 49% of
the solar radiation striking the earth and its
atmosphere is absorbed at the surface [6] (See Fig.
3).
1. Earth Shelters
Researchers, including Anselm [6], found that earth
sheltered houses maintain heating energy
consumption lesser by up to 75% compared to
conventional above-ground house.
A. Definition
Earth shelters can be defined as structures built with
the use of earth mass against building walls as
external thermal mass [7].
B. Potential energy savings:
Based on several physical characteristics: [9]
• The reduction of heat loss due to conduction
through the building envelope.
• Less heat conduction into the house due to
reduced temperature differential.
• Building protection from the direct solar radiation.
• The reduction of air infiltration within the dwelling.
(a) One of the partially buried homes in Siwa
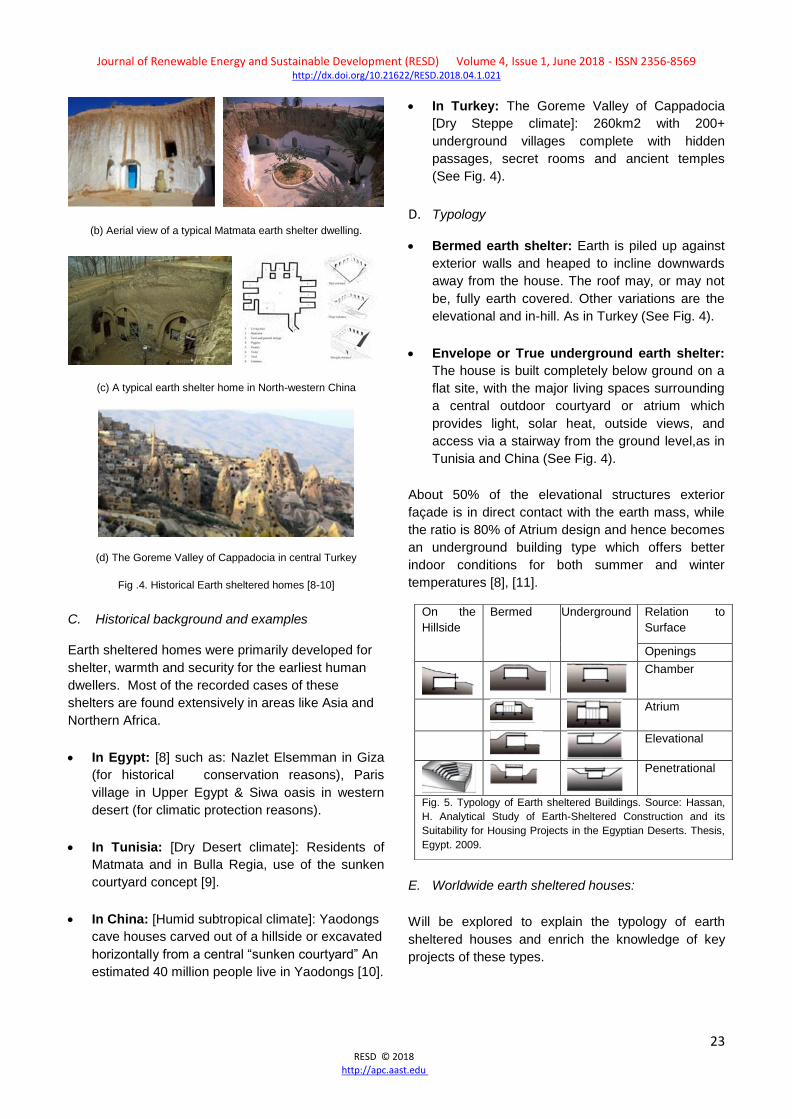
Journal of Renewable Energy and Sustainable Development (RESD) Volume 4, Issue 1, June 2018 - ISSN 2356-8569 http://dx.doi.org/10.21622/RESD.2018.04.1.021
23 RESD © 2018 http://apc.aast.edu
(b) Aerial view of a typical Matmata earth shelter dwelling.
(c) A typical earth shelter home in North-western China
(d) The Goreme Valley of Cappadocia in central Turkey
Fig .4. Historical Earth sheltered homes [8-10]
C. Historical background and examples
Earth sheltered homes were primarily developed for
shelter, warmth and security for the earliest human
dwellers. Most of the recorded cases of these
shelters are found extensively in areas like Asia and
Northern Africa.
• In Egypt: [8] such as: Nazlet Elsemman in Giza
(for historical conservation reasons), Paris
village in Upper Egypt & Siwa oasis in western
desert (for climatic protection reasons).
• In Tunisia: [Dry Desert climate]: Residents of
Matmata and in Bulla Regia, use of the sunken
courtyard concept [9].
• In China: [Humid subtropical climate]: Yaodongs
cave houses carved out of a hillside or excavated
horizontally from a central “sunken courtyard” An
estimated 40 million people live in Yaodongs [10].
• In Turkey: The Goreme Valley of Cappadocia
[Dry Steppe climate]: 260km2 with 200+
underground villages complete with hidden
passages, secret rooms and ancient temples
(See Fig. 4).
D. Typology
• Bermed earth shelter: Earth is piled up against
exterior walls and heaped to incline downwards
away from the house. The roof may, or may not
be, fully earth covered. Other variations are the
elevational and in-hill. As in Turkey (See Fig. 4).
• Envelope or True underground earth shelter:
The house is built completely below ground on a
flat site, with the major living spaces surrounding
a central outdoor courtyard or atrium which
provides light, solar heat, outside views, and
access via a stairway from the ground level,as in
Tunisia and China (See Fig. 4).
About 50% of the elevational structures exterior
façade is in direct contact with the earth mass, while
the ratio is 80% of Atrium design and hence becomes
an underground building type which offers better
indoor conditions for both summer and winter
temperatures [8], [11].
E. Worldwide earth sheltered houses:
Will be explored to explain the typology of earth
sheltered houses and enrich the knowledge of key
projects of these types.
On the
Hillside
Bermed Underground Relation to
Surface
Openings
Chamber
Atrium
Elevational
Penetrational
Fig. 5. Typology of Earth sheltered Buildings. Source: Hassan,
H. Analytical Study of Earth-Sheltered Construction and its
Suitability for Housing Projects in the Egyptian Deserts. Thesis,
Egypt. 2009.

Journal of Renewable Energy and Sustainable Development (RESD) Volume 4, Issue 1, June 2018 - ISSN 2356-8569 http://dx.doi.org/10.21622/RESD.2018.04.1.021
24 RESD © 2018 http://apc.aast.edu
Table 1 . Some Worldwide Earth Sheltered Housing Units
Project Ecology House
Marstons Milss, Massachusetts, USA,1972.
Architect John E. Barnard Jr.
Climate Hemiboreal
Type
Notes One-fifth normal heating cost, 25% lower building cost, privacy
from neighbors.
Project Underground-house-welsh-coase
Druidston, Pembrokeshire, UK, 1998.
Architect Future Systems
Climate Maritime temperature
Type
Notes The basic design is: one room inside, divided by prefabricated
colored pods.
Project A home built in a cave in Missouri, USA.
Architect Curt and Deborah Sleeper
Climate Hot Summer Continental
Type
Notes This house was made in an existing cave in the small town of
Festus, Missouri.
Project the Earth House Estate Lättenstrasse
Dietikon, Switzerland, 1993.
Architect Peter Vetsch
Climate Tundra
Type
Notes The organic construction consists of shotcrete, with a 25 cm layer
of polymer bitumen and recycled glass foam on top.

Journal of Renewable Energy and Sustainable Development (RESD) Volume 4, Issue 1, June 2018 - ISSN 2356-8569 http://dx.doi.org/10.21622/RESD.2018.04.1.021
25 RESD © 2018 http://apc.aast.edu
Project Underground-home. Located in the Swiss village of Vals.
Architect SeARCH and Christian Muller Architects
Climate Tundra
Type
Notes The introduction of a central patio into the steep incline creates a large façade with considerable potential for window openings.
Project Earthship Prototypes
Architect Michael Reynolds
Climate Implemented in many climates including hot desert and maritime
temperature of London.
Type
Notes Off- grid prototypes
•Constructed using cans, bottles and tires (reuse) with natural
adobe materials.
• Heat and cool themselves naturally via solar/thermal dynamics
• Collect their own power from the sun and wind
• Harvest their own water from rain and snow melt
• Contain and treat their own sewage on site (water is used and
reused at four cycles).
Project Spiritual house|
Sevilla, Spain, 1980.
Architect Emilio Ambasz
Climate Dry-summer subtropical
Type
Notes An underground "canopy" of fiberglass panels extends horizontally as a ten-foot cornice from the wall's top to keep water from soaking the ground around the house.

Journal of Renewable Energy and Sustainable Development (RESD) Volume 4, Issue 1, June 2018 - ISSN 2356-8569 http://dx.doi.org/10.21622/RESD.2018.04.1.021
26 RESD © 2018 http://apc.aast.edu
Project Earth House
Republic of Korea, 2009.
Architect Byoungsoo Cho, Yangpyeong-gun, Gyeonggi-do
Climate Hot Summer Continental
Type
Notes Used a geothermal cooling system with a radiant floor heating
system under the rammed clay, concrete floor.
Project Woodland Home London, UK.
Architect Reardon Smith Architects
Climate Maritime temperature
Type
Notes Skylight in roof lets in natural feeling light.
Project Aloni House Greece, 2008.
Architect decaArchitecture
Climate Dry-summer subtropical
Type
Notes The house's sides disappear into the ground, blending the
structure into the landscape. There are five internal courtyards,
which flood the rooms with light and shield windows and doors
from stormy rainwater.
Project Bolton Echo House- North West England, UK, 2009.
Architect Make Architects
Climate Maritime temperature
Type
Notes Designed to consume less energy than it uses; a ground source
heat pump, photovoltaic panels and a wind turbine will generate
on-site renewable energy.
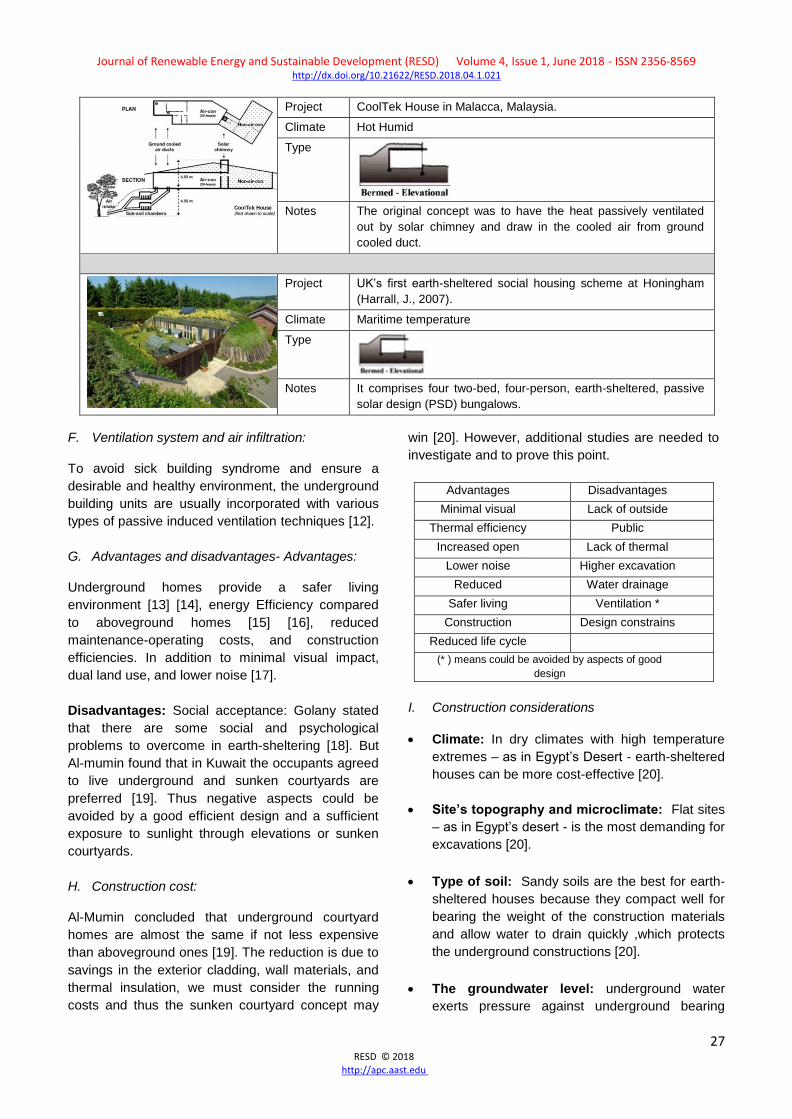
Journal of Renewable Energy and Sustainable Development (RESD) Volume 4, Issue 1, June 2018 - ISSN 2356-8569 http://dx.doi.org/10.21622/RESD.2018.04.1.021
27 RESD © 2018 http://apc.aast.edu
Project CoolTek House in Malacca, Malaysia.
Climate Hot Humid
Type
Notes The original concept was to have the heat passively ventilated
out by solar chimney and draw in the cooled air from ground
cooled duct.
Project UK’s first earth-sheltered social housing scheme at Honingham
(Harrall, J., 2007).
Climate Maritime temperature
Type
Notes It comprises four two-bed, four-person, earth-sheltered, passive
solar design (PSD) bungalows.
F. Ventilation system and air infiltration:
To avoid sick building syndrome and ensure a
desirable and healthy environment, the underground
building units are usually incorporated with various
types of passive induced ventilation techniques [12].
G. Advantages and disadvantages- Advantages:
Underground homes provide a safer living
environment [13] [14], energy Efficiency compared
to aboveground homes [15] [16], reduced
maintenance-operating costs, and construction
efficiencies. In addition to minimal visual impact,
dual land use, and lower noise [17].
Disadvantages: Social acceptance: Golany stated
that there are some social and psychological
problems to overcome in earth-sheltering [18]. But
Al-mumin found that in Kuwait the occupants agreed
to live underground and sunken courtyards are
preferred [19]. Thus negative aspects could be
avoided by a good efficient design and a sufficient
exposure to sunlight through elevations or sunken
courtyards.
H. Construction cost:
Al-Mumin concluded that underground courtyard
homes are almost the same if not less expensive
than aboveground ones [19]. The reduction is due to
savings in the exterior cladding, wall materials, and
thermal insulation, we must consider the running
costs and thus the sunken courtyard concept may
win [20]. However, additional studies are needed to
investigate and to prove this point.
Advantages Disadvantages
Minimal visual
impact
Lack of outside
views * Thermal efficiency Public
acceptance* Increased open
space & dual land
use
Lack of thermal
performance data Lower noise Higher excavation
and structural
costs Reduced
maintenance and
operating costs
Water drainage
Safer living
environment
Ventilation *
Construction
efficiencies
Design constrains
* Reduced life cycle
coasts
(* ) means could be avoided by aspects of good
design
I. Construction considerations
• Climate: In dry climates with high temperature
extremes – as in Egypt’s Desert - earth-sheltered
houses can be more cost-effective [20].
• Site’s topography and microclimate: Flat sites
– as in Egypt’s desert - is the most demanding for
excavations [20].
• Type of soil: Sandy soils are the best for earth-
sheltered houses because they compact well for
bearing the weight of the construction materials
and allow water to drain quickly ,which protects
the underground constructions [20].
• The groundwater level: underground water
exerts pressure against underground bearing

Journal of Renewable Energy and Sustainable Development (RESD) Volume 4, Issue 1, June 2018 - ISSN 2356-8569 http://dx.doi.org/10.21622/RESD.2018.04.1.021
28 RESD © 2018 http://apc.aast.edu
walls so it is important to build above the water
table [20].
J. Construction materials
Earth sheltered houses require heavy duty, more
enduring construction materials that can resist the
pressure and moisture of the surrounding ground
[due to their good waterproofing and insulation
properties]. Concrete, reinforced masonry, steel, and
wood can be suitable.
In developing countries, local materials have been
used widely for their advantages economically,
ecologically, and good energy performance.
Examples are cob, adobe, straw bale, brick, wood,
cordwood, and stone [21]. Here’s some recently
proposed materials for low cost housing in Egypt:
Rice-straw based cement brick: The rice-straw has
replaced part of the aggregates used in the normal
cement brick to generate a stable blend after which
mechanical and thermal experiments have been
conducted [22]. It showed promising energy savings
but this material is presented mainly as a solution for
recycling rice wastes and has not been widely
approached in Egypt.
“Rammed Earth” is constructed by using a
pneumatic tamper to ram a mix of earth and cement,
into wall forms to produce walls, foundations and
floors. The soil should have some silt and clay to act
as binders and allow soil compaction which are not
available in desert soils as the case in this research.
Also, rammed earth cannot be used for constructing
ceilings. Actually there is a lack of knowledge and
access to tools for using this material in Egypt [23].
The compressed stabilized earth block
Using a steel press to compress the moisturized soil -
raw or stabilized-producing CSEB blocks. Sandy soil
is more suitable than clayey one.
Cement is preferred as a stabilizer for sandy soils to
accelerate the strength. The ratio of cement should
be around 5%.
A finished m3 of CSEB masonry is always cheaper
than fired bricks: 19.4% less than country fired bricks
and 47.2 % less than wire cut bricks [24].
In addition to its advantages, stabilized earth blocks
also introduce a solution for reusing the excavated
soil from basement in underground courtyard homes
so the research recommends stabilized earth blocks
as a building material for earth sheltered houses in
Egypt’s desert.
Table 3. .Advantages of “CSEB”[24]
A local material Socially accepted
Flexible production
scale
A bio-degradable
material
An adapted material:
Produced locally
Cost efficiency
A transferable
technology
Energy efficiency and
eco friendliness: The
energy consumption in a
m3 can be from 5 to 15
times less than a m3 of
fired bricks. The pollution
emission will also be 2.4
to 7.8 times less than
fired bricks
A job creation
opportunity
Market opportunity:
Cheaper than fired
bricks
Reducing imports
K. Underground courtyard houses [Constructing
case studies]
The courtyard plan is best suited in flat terrain sites
that have permeable, dry or well- drained soils which
are far from a ground water source [27] With
reference to the traditional underground building
which is constructed in arid climatic regions. Some do
not even require any supporting walls because of the
land conditions [12]. This is the case in Egypt’s desert.
Underground courtyard type is represented in historic
underground homes and there are fewer examples of
contemporary ones.

Journal of Renewable Energy and Sustainable Development (RESD) Volume 4, Issue 1, June 2018 - ISSN 2356-8569 http://dx.doi.org/10.21622/RESD.2018.04.1.021
29 RESD © 2018 http://apc.aast.edu
In the next table 4, some underground courtyard
houses will be shown. They are classified according to
the courtyard number in each house and its
proportions.
Consequently, design guidelines will be deduced in
order to help in constructing research case studies
later.
Table 4. Sunken courtyard house examples and types
Project Plans and
Sections
sh
elte
red
Are
a m
2
Co
urt
ya
rd
Are
a m
2
Co
urt
ya
rd
Are
a
/
sh
elte
red
Are
a %
Co
urt
ya
rd
Wid
th
/
Le
ng
th %
Courtyard
Typology
Underground House,
Southern Tunisia
82 66 80% 1:1.25
Underground House,
Source: [9]
56%* 1:3.25*
Sunken Courtyard by:
Gestalten, Melbourne,
Australia
http://www.archdaily.co
m/259160/sunken-
courtyard-gestalten
73 30 240% 1:2.5
Underground House,
Source: [9]
132.5 52 40% 1:1.2
A Typical Earth
Sheltered Home ,
Northern Western China
170%* 1:1.25*
Earth House by BCHO
Architects, Seoul, Korea.
32.5 69.5 210% 1:1.15
Casa De Retiro
Espiritual
by Emilio Ambasz,
Spain
280 173 62% 1:1
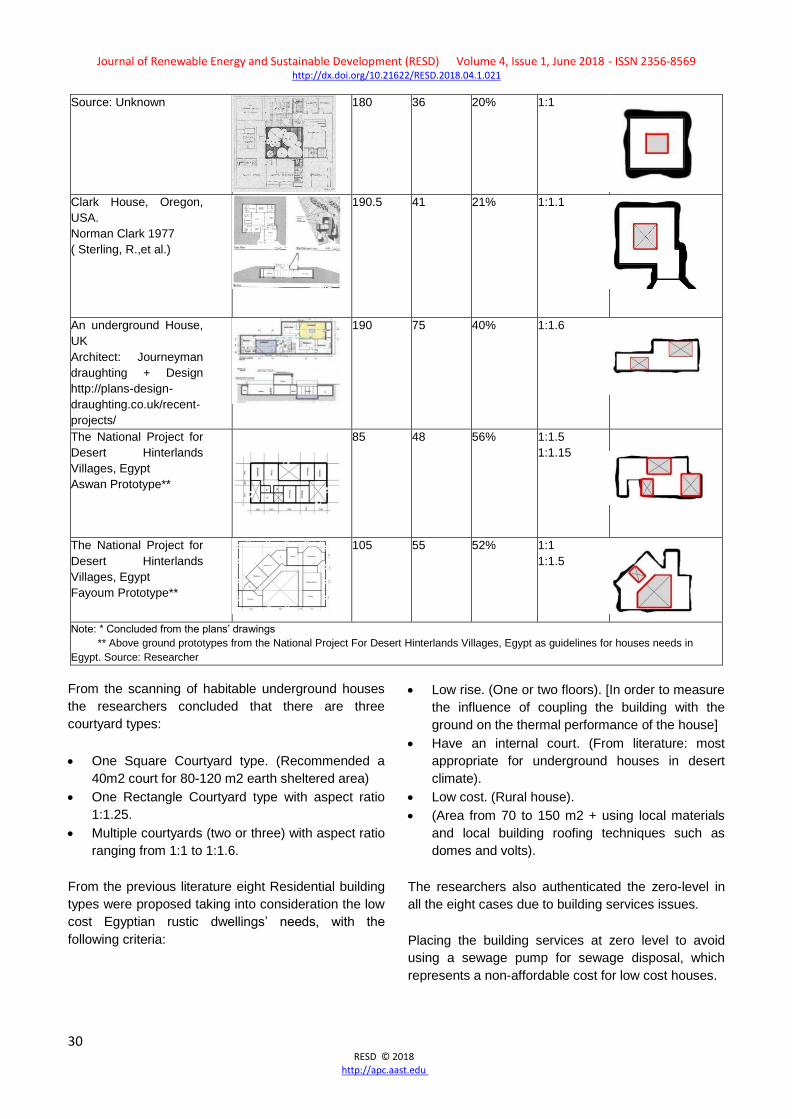
Journal of Renewable Energy and Sustainable Development (RESD) Volume 4, Issue 1, June 2018 - ISSN 2356-8569 http://dx.doi.org/10.21622/RESD.2018.04.1.021
30 RESD © 2018 http://apc.aast.edu
Source: Unknown
180 36 20% 1:1
Clark House, Oregon,
USA.
Norman Clark 1977
( Sterling, R.,et al.)
190.5 41 21% 1:1.1
An underground House,
UK
Architect: Journeyman
draughting + Design
http://plans-design-
draughting.co.uk/recent-
projects/
190 75 40% 1:1.6
The National Project for
Desert Hinterlands
Villages, Egypt
Aswan Prototype**
85 48 56% 1:1.5
1:1.15
The National Project for
Desert Hinterlands
Villages, Egypt
Fayoum Prototype**
105 55 52% 1:1
1:1.5
Note: * Concluded from the plans’ drawings
** Above ground prototypes from the National Project For Desert Hinterlands Villages, Egypt as guidelines for houses needs in
Egypt. Source: Researcher
From the scanning of habitable underground houses
the researchers concluded that there are three
courtyard types:
• One Square Courtyard type. (Recommended a
40m2 court for 80-120 m2 earth sheltered area)
• One Rectangle Courtyard type with aspect ratio
1:1.25.
• Multiple courtyards (two or three) with aspect ratio
ranging from 1:1 to 1:1.6.
From the previous literature eight Residential building
types were proposed taking into consideration the low
cost Egyptian rustic dwellings’ needs, with the following criteria:
• Low rise. (One or two floors). [In order to measure
the influence of coupling the building with the
ground on the thermal performance of the house]
• Have an internal court. (From literature: most
appropriate for underground houses in desert
climate).
• Low cost. (Rural house).
• (Area from 70 to 150 m2 + using local materials
and local building roofing techniques such as
domes and volts).
The researchers also authenticated the zero-level in
all the eight cases due to building services issues.
Placing the building services at zero level to avoid
using a sewage pump for sewage disposal, which
represents a non-affordable cost for low cost houses.

Journal of Renewable Energy and Sustainable Development (RESD) Volume 4, Issue 1, June 2018 - ISSN 2356-8569 http://dx.doi.org/10.21622/RESD.2018.04.1.021
31 RESD © 2018 http://apc.aast.edu
Fig. 6. Deduced eight types of courtyard houses which represent the case studies
Source: Researchers.
2. The principle of ground cooling by indirect
contact:
A long buried pipe – at a calculated depth for best
efficiency - that have an end for fresh outside air
intake and the other end for inside cooled air released
in the building, this is the main idea of The Earth Pipe
Cooling system. This system uses the ground as a
heat sink for cooling in warm countries where the
intake air, in the buried pipe, loses excess heat to the
earth by convection. Adequate air flow into the buried
pipe is a must to get cooled air for occupants’ thermal
comfort. A fan blower is needed at air intake if there is
deficiency in air flow
A. Factors that affect Earth Pipe Cooling
performance
As a conclusion from various published literature, the
performance of Earth Pipe Cooling are affected by
four main parameters and they are:
• Pipe length: A parametric study using different
pipe lengths : 10m, 30m, 50m,70m, 90m
concluded that the longer the pipe, the better the
performance of the earth tube [28], [29].
• Pipe radius or diameter: The smaller the radius
of the pipe the more decreased inlet temperature.
• Depth of the pipe inserted into the ground: As
the pipe depth increases, the inlet air temperature
decreases in all climate conditions [28].
• Air flow rate inside the pipe: as the air flow rate
increases, the inlet air temperature increases [28],
[31] and the coefficient of performance (COP)
reduces [32] (See Fig. 7).
Other factors that could affect the performance of
Earth Pipe Cooling system is
• The surface condition of the ground: Bare or
shaded.
• Soil type: sandy soil is much preferable than
other soil types [33].
• The choice of pipe materials: different pipe
materials have minor effects on the Earth Pipe
Cooling system performance [34].
B. Application of Earth Pipe Cooling
Models of Earth to Air Heat Exchanger System
(EAHE) made of low cost material like PVC pipes and
exhaust fans
- a duct system suitable for small houses
- have been examined. Models show [35] temperature
reduction of 10-15ºC than outside during summer.
This system can effectively reduce the energy
consumption between 50 % and 60 %, which is
consumed by building cooling (Air conditioning) and
warming systems.
COP is a term used in refrigeration and air
conditioning to describe the performance of a system.
Normally, heating and air conditioning systems have
average year-round COPs of about 2.0. The COPs of
the systems utilizing underground air tunnels are
much higher. For open and closed loop systems, the
COP can be as high as 10 [33].

Journal of Renewable Energy and Sustainable Development (RESD) Volume 4, Issue 1, June 2018 - ISSN 2356-8569 http://dx.doi.org/10.21622/RESD.2018.04.1.021
32 RESD © 2018 http://apc.aast.edu
The higher the COP, the higher the efficiency of the
equipment [29].
Table 5. Some Applications of Earth Pipe Cooling [29]
Researcher Location Buried Pipe Design Ambient T, °C Energy Saving
Goswami and Biseli (Summer, 1993)
Florida, USA 0.305m dia, 30.5m long pipe. 2.7m deep.
0.184kW fan blower and 2 ½ ton heat pump
Summer:23.9°C to 33.1°C
Open Loop COP= 12 COP (air-cond) = 1 to 4 With Heat Pump COP =
13
Pfafferott (2003) DB Netz AG COP = 88
Fraunhofer ISE COP = 29
Lamparter COP = 380
C. Limitations
The risk of condensation in the buried pipe: to avoid
his problem the pipe may be tilted slightly to allow the
water condensed to drain away through a tiny hole
[30], [37]. This is a preference to the arid climate of
Egypt.
D. Hybrid design for enhancement of ground cooling
system
Maerefat and Poshtiri introduced and investigated
integrated EAHE-SC system. They showed that the
solar chimney can be perfectly used to power the
underground cooling system during the daytime,
without any need for electricity [39].
The air is heated up in the SC by the solar energy,
and by natural convection mechanism the outside air
is sucked-in through the earth–air pipe.
Fig. 8: Schematic diagram of integrated earth to air heat
exchanger and solar chimney (Maerefat, M., Poshtiri, A., 2010)
Poshtiri, et al., [40] examined SC-EAHE system. The
results show that proper configurations could provide
good indoor condition even at poor solar intensity of
100 W/m2 and high ambient air temperature of 50oC.
Comparative survey shows the SC-EAHE system is
the best choice for buildings with poor insulation at
day time.
Hammadi and Mohammed investigated the Solar
Chimney (SC) together with earth to air heat
exchanger (EAHE) as a low-energy consuming
technique. A numerical program "FLUENT 6.3 code"
of an earth to air heat exchanger (EAHE) was used for
predicting the outlet air temperature and cooling
Inle
t T
emp.
Pipe length Pipe radius Depth of the pipe Air flow rate
Fig. 7. Factors that affect Earth Pipe Cooling performance [28]
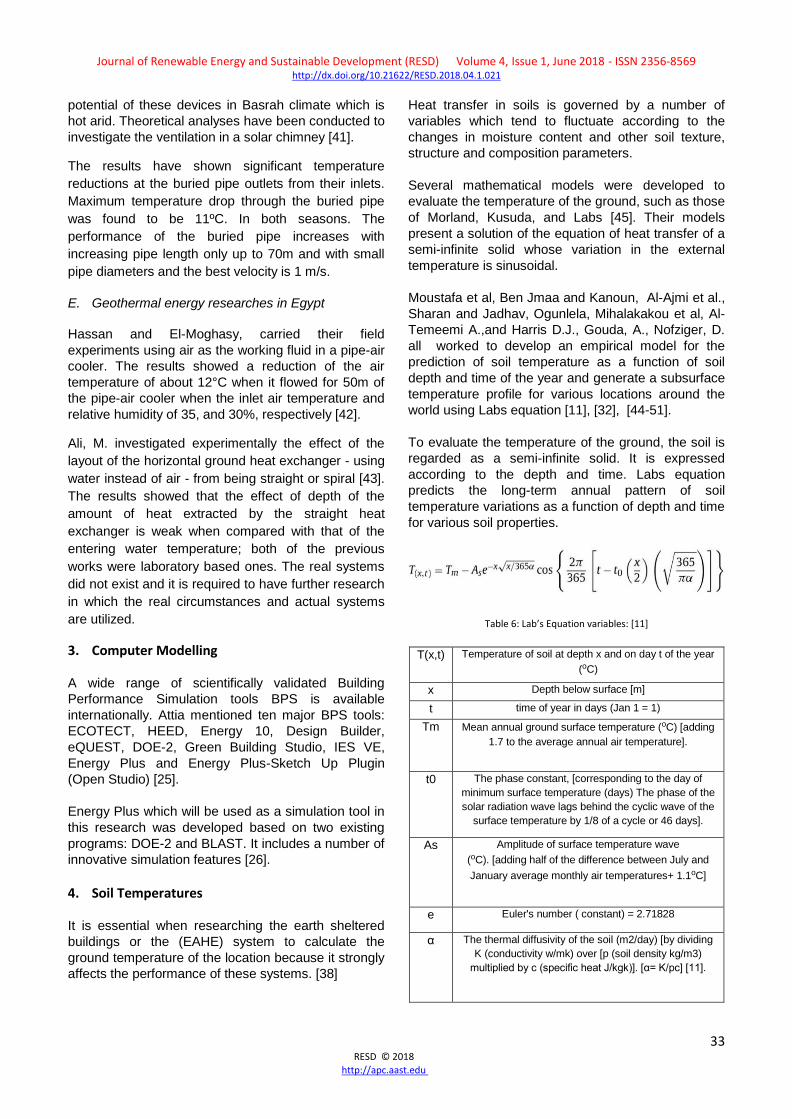
Journal of Renewable Energy and Sustainable Development (RESD) Volume 4, Issue 1, June 2018 - ISSN 2356-8569 http://dx.doi.org/10.21622/RESD.2018.04.1.021
33 RESD © 2018 http://apc.aast.edu
potential of these devices in Basrah climate which is
hot arid. Theoretical analyses have been conducted to
investigate the ventilation in a solar chimney [41].
The results have shown significant temperature
reductions at the buried pipe outlets from their inlets.
Maximum temperature drop through the buried pipe
was found to be 11ºC. In both seasons. The
performance of the buried pipe increases with
increasing pipe length only up to 70m and with small
pipe diameters and the best velocity is 1 m/s.
E. Geothermal energy researches in Egypt
Hassan and El-Moghasy, carried their field
experiments using air as the working fluid in a pipe-air
cooler. The results showed a reduction of the air
temperature of about 12°C when it flowed for 50m of
the pipe-air cooler when the inlet air temperature and
relative humidity of 35, and 30%, respectively [42].
Ali, M. investigated experimentally the effect of the
layout of the horizontal ground heat exchanger - using
water instead of air - from being straight or spiral [43].
The results showed that the effect of depth of the
amount of heat extracted by the straight heat
exchanger is weak when compared with that of the
entering water temperature; both of the previous
works were laboratory based ones. The real systems
did not exist and it is required to have further research
in which the real circumstances and actual systems
are utilized.
3. Computer Modelling
A wide range of scientifically validated Building
Performance Simulation tools BPS is available
internationally. Attia mentioned ten major BPS tools:
ECOTECT, HEED, Energy 10, Design Builder,
eQUEST, DOE-2, Green Building Studio, IES VE,
Energy Plus and Energy Plus-Sketch Up Plugin
(Open Studio) [25].
Energy Plus which will be used as a simulation tool in
this research was developed based on two existing
programs: DOE-2 and BLAST. It includes a number of
innovative simulation features [26].
4. Soil Temperatures
It is essential when researching the earth sheltered
buildings or the (EAHE) system to calculate the
ground temperature of the location because it strongly
affects the performance of these systems. [38]
Heat transfer in soils is governed by a number of
variables which tend to fluctuate according to the
changes in moisture content and other soil texture,
structure and composition parameters.
Several mathematical models were developed to
evaluate the temperature of the ground, such as those
of Morland, Kusuda, and Labs [45]. Their models
present a solution of the equation of heat transfer of a
semi-infinite solid whose variation in the external
temperature is sinusoidal.
Moustafa et al, Ben Jmaa and Kanoun, Al-Ajmi et al.,
Sharan and Jadhav, Ogunlela, Mihalakakou et al, Al-
Temeemi A.,and Harris D.J., Gouda, A., Nofziger, D.
all worked to develop an empirical model for the
prediction of soil temperature as a function of soil
depth and time of the year and generate a subsurface
temperature profile for various locations around the
world using Labs equation [11], [32], [44-51].
To evaluate the temperature of the ground, the soil is
regarded as a semi-infinite solid. It is expressed
according to the depth and time. Labs equation
predicts the long-term annual pattern of soil
temperature variations as a function of depth and time
for various soil properties.
Table 6: Lab’s Equation variables: [11]
T(x,t) Temperature of soil at depth x and on day t of the year
(oC)
x Depth below surface [m]
t time of year in days (Jan 1 = 1)
Tm Mean annual ground surface temperature (oC) [adding
1.7 to the average annual air temperature].
t0 The phase constant, [corresponding to the day of
minimum surface temperature (days) The phase of the
solar radiation wave lags behind the cyclic wave of the
surface temperature by 1/8 of a cycle or 46 days].
As Amplitude of surface temperature wave
(oC). [adding half of the difference between July and
January average monthly air temperatures+ 1.1oC]
e Euler's number ( constant) = 2.71828
α The thermal diffusivity of the soil (m2/day) [by dividing
K (conductivity w/mk) over [p (soil density kg/m3)
multiplied by c (specific heat J/kgk)]. [α= K/pc] [11].

Journal of Renewable Energy and Sustainable Development (RESD) Volume 4, Issue 1, June 2018 - ISSN 2356-8569 http://dx.doi.org/10.21622/RESD.2018.04.1.021
34 RESD © 2018 http://apc.aast.edu
III. METHODOLOGY
For the proposed eight residential types [R1-R2-
……R8] (See fig. 6), a one zone building [The house
can be considered as one zone due to assumed
sufficiently uniform thermal conditions, Source: ISO
52000-1:2017] will be simulated using Energy
plus/Design Building program to measure: yearly
discomfort hours for unconditioned cases and energy
consumption assumed condition cases, as follows:
1. Design Variables:
• Location template, two options of the cities’
weather files inputs (Aswan and Ismailia).
• Orientation: 0° – and 90°.
• Building level: with two options: Above ground or
underground.
• Earth Air Tubes: with two options: Yes or No.
For each specific building type and orientation there
are four plans or (arrangements):
1- (PO): Above ground.
2- PA): Aboveground + EAHE.
3- (PB): Underground with 0.50 m earth layer above it
4- (PC): Underground + EAHE.
2. Building Specifications:
Occupancy density (m2/pp.) 20m2/pp
Number of floors 1
Height per floor 3.5
Table 7: Openings & R values: (According to the Egyptian Energy
Efficiency Code for buildings)
Elevation WWR R value
North ≤30% 1.00
East & West ≤20% 1.3
South 20-30% 1.00
Table 8: Building Activity Options, assumed
Activity Domestic Lounge
Density 0.08 p/m2
Heating set point temp. 21
Heating setback temp. 12
Cooling set point temp. 25
Cooling setback temp. 28
Target Illuminance (Lux) 150
Computer & Cattering On
Table 9: Building Assemblies, assumed
Note: Bottom and vertical boundary conditions were
set at the edges of a domain 15 m under a slab and
next to the walls. It follows the hints of the European
Standard EN ISO 13370 “Thermal performance of
buildings – Heat transfer via the ground – Calculation
methods”.
Above Ground Walls
Cement plaster .025m
Brick burned 0.12m
Cement plaster .025m
U Value : 2.6 W/m2K
Underground Walls
Compressed cement stabilized Earth blocks (CSEB).5% cement.
0.12m
Bitumen pure 0.025m
Compressed cement stabilized Earth blocks (CSEB).5% cement.
0.05m
Cement plaster 0.025m
U Value : 0.76 W/m2K
Above Ground Building Floors
Concrete tiles 0.02m
Cement plaster 0.025m
Sand and gravel 0.05m
Reinforced concrete 0.12m
Gypsum plaster 0.025m
U Value : 3.13 W/m2K
Above Ground Building Roofs
Plaster ceiling tiles 0.02m
Sand and gravel 0.05m
Cast concrete 0.075m
Bitumine 0.02m
(CSEB).5% cement. 0.14m
Gypsum plaster 0.025m
U Value : 1.38 W/m2K
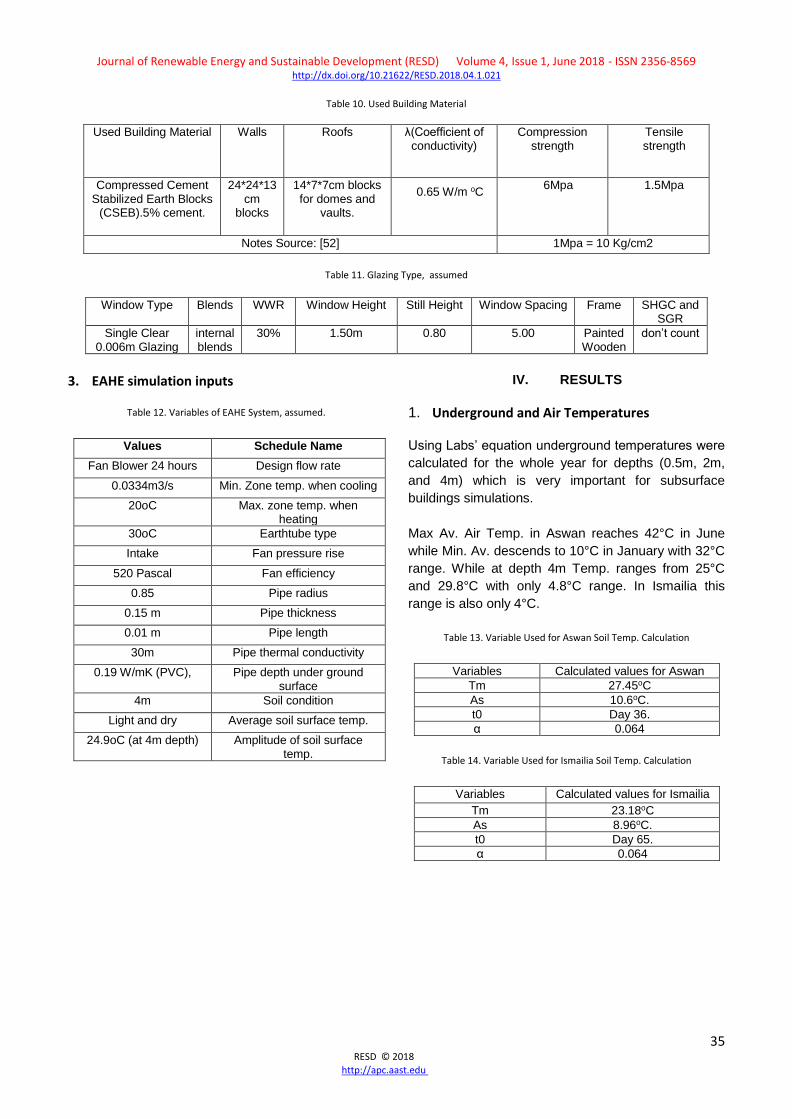
Journal of Renewable Energy and Sustainable Development (RESD) Volume 4, Issue 1, June 2018 - ISSN 2356-8569 http://dx.doi.org/10.21622/RESD.2018.04.1.021
35 RESD © 2018 http://apc.aast.edu
Table 10. Used Building Material
Used Building Material Walls Roofs λ(Coefficient of conductivity)
Compression strength
Tensile strength
Compressed Cement Stabilized Earth Blocks
(CSEB).5% cement.
24*24*13 cm
blocks
14*7*7cm blocks for domes and
vaults.
0.65 W/m oC
6Mpa
1.5Mpa
Notes Source: [52] 1Mpa = 10 Kg/cm2
Table 11. Glazing Type, assumed
Window Type Blends WWR Window Height Still Height Window Spacing Frame SHGC and SGR
Single Clear 0.006m Glazing
internal blends
30% 1.50m 0.80 5.00 Painted Wooden
don’t count
3. EAHE simulation inputs
Table 12. Variables of EAHE System, assumed.
Values Schedule Name
Fan Blower 24 hours Design flow rate
0.0334m3/s Min. Zone temp. when cooling
20oC Max. zone temp. when heating
30oC Earthtube type
Intake Fan pressure rise
520 Pascal Fan efficiency
0.85 Pipe radius
0.15 m Pipe thickness
0.01 m Pipe length
30m Pipe thermal conductivity
0.19 W/mK (PVC), Pipe depth under ground surface
4m Soil condition
Light and dry Average soil surface temp.
24.9oC (at 4m depth) Amplitude of soil surface temp.
IV. RESULTS
1. Underground and Air Temperatures
Using Labs’ equation underground temperatures were
calculated for the whole year for depths (0.5m, 2m,
and 4m) which is very important for subsurface
buildings simulations.
Max Av. Air Temp. in Aswan reaches 42°C in June
while Min. Av. descends to 10°C in January with 32°C
range. While at depth 4m Temp. ranges from 25°C
and 29.8°C with only 4.8°C range. In Ismailia this
range is also only 4°C.
Table 13. Variable Used for Aswan Soil Temp. Calculation
Variables Calculated values for Aswan
Tm 27.45oC
As 10.6oC.
t0 Day 36.
α 0.064
Table 14. Variable Used for Ismailia Soil Temp. Calculation
Variables Calculated values for Ismailia
Tm 23.18oC
As 8.96oC.
t0 Day 65.
α 0.064

Journal of Renewable Energy and Sustainable Development (RESD) Volume 4, Issue 1, June 2018 - ISSN 2356-8569 http://dx.doi.org/10.21622/RESD.2018.04.1.021
36 RESD © 2018 http://apc.aast.edu
Fig.10. Average monthly temp. compared to calculated soil temp.in Aswan
Source : Researchers
Fig. 11: Average monthly temp. compared to calculated soil temp.in Ismailia
Source : Researchers
2. Thermal Comfort Analysis and Comparisons
Thermal comfort was monitored in simulated eight
types (R1….R8) - two orientations each - per each of
the four plans or (arrangements): PO, PA, PB, PC by
calculating yearly discomfort hours as an indication for
thermal comfort as there is counter relation between
discomfort hours and thermal comfort.
Yearly Discomfort Hours reached 2193h in above
building base case in Aswan [plan (PO) for Type R6]
and Min. of 1291h in [plan (PC) for Type 3] which is
an underground building with a EAHE. In Ismailia
Yearly Discomfort Hours reached 2351h in plan (PB)
(underground building for type R6) and Min. of 850h in
[plan (PC) for (Type3)], which is an underground
building with an EAHE.
In both Aswan and Ismailia: the average readings
point out that above ground (PO) are the highest
discomfort hours, while underground with EAHE are
the least. Meanwhile underground (PB) in Ismailia
showed rise in discomfort hours due the time lag
which needs further research and simulation (See fig.
12).
Fig. 12. Yearly discomfort hours [ Measured for the four plans(arrangements): (O-A-B-C)] Source: Researchers

Journal of Renewable Energy and Sustainable Development (RESD) Volume 4, Issue 1, June 2018 - ISSN 2356-8569 http://dx.doi.org/10.21622/RESD.2018.04.1.021
37 RESD © 2018 http://apc.aast.edu
3. Energy Consumption
Was monitored in simulated eight types (R1….R8) -
two orientations each - per two plans or
(arrangements): Plan PO [aboveground building with
common building specification in new urban
settlements in Egypt] and plan PB [Underground
building with proposed (CSEB).5% cement
construction], both plans were assumed to be full
conditioned in order to be able to calculate energy
consumption to reach comfort conditions.
Energy consumption reached 343 KWh/m2 in the
above building base case (R6 type-d2) in Aswan and
Min. of 104 KWh/m2 in plan (PB) (R3 type-d2). In
Ismailia Yearly Energy Consumption 187.5 KWh/m2
in above building base case (R6 type-d2) and reached
42 KWh/m2 in plan (PB) (R3 type-d2).
Note: All calculations were made for both building
directions 0 & 90 for each eight building types for each
city climate with a total of 96 readings.
Fig. 13. Energy consumption to reach thermal comfort [Measured for the two plans:
[P (O- B)]. Source: Researchers
V. DISCUSSION AND CONCLUSION
- As mentioned before, calculated underground
temperatures for both Aswan & Ismailia showed a
sinusoidal behavior and the cyclical temperature wave
that becomes more flat with the increases in depth.
Ismailia has more time lag (65 days) than Aswan (36
days).
- For all eight types R1-R8, and two building
orientations D1& D2 the researchers can conclude
that:
• In Aswan Discomfort hours decrease between
28% and 34% in the above ground building plan
(PO) compared to the underground building with
an EAHE plan (PC), while energy consumption
decreases between 42% and 53% for the
previous comparison.
• In Ismailia Discomfort hours decrease between
24% and 29% between the above ground building
plan (PO) and the underground building with a
EAHE plan (PC), while energy consumption
decreases between 57% and 72% for the
previous comparison.
In plan [arrangement (PB) (underground without
EAHE)], it is noticed that discomfort hours are the
highest although there is less energy needed to
achieve thermal comfort (See. Fig. 13). This may be
due to long time lag, which indicates that the earth
keeps and loses the heat delayed 65 days than
aboveground ambient air, which causes more
discomfort hours while the standard deviation in
temperature differentiation between aboveground and
underground is small so that energy needed to
achieve comfort is still low. (So further investigations
on other climate regions within Egypt are needed to
prove these assumptions).
VI. CONCLUSION
• The research concludes that earth-sheltered
courtyard house constructed using CSEB and
combined with an EAHE system is one of the
promising passive solutions for saving energy in
desert houses in Egypt.
• Energy consumption in Ismailia is more than in
Aswan due to the higher time lag between ground
temperature and air temperature.

Journal of Renewable Energy and Sustainable Development (RESD) Volume 4, Issue 1, June 2018 - ISSN 2356-8569 http://dx.doi.org/10.21622/RESD.2018.04.1.021
38 RESD © 2018 http://apc.aast.edu
• Best case for Aswan with maximum decrease in
both discomfort hours and energy consumption
is R3/D2, which is the max in the compacted
plan.
• Ismailia’s best case is R6/D1, which has the
max. area contact with earth.
Fig. 14: % Decrease in energy consumption (% Difference between plan PO& PB) for the two directions of the eight types. Source:
Researchers
VII. RESEARCH RECOMMENDATIONS
Taking into account the arid climate, the dry soil, the
deep ground water levels of Egypt’s desert and the
need for low cost energy efficient housing; a design
proposal is presented according to the research:
• Locating the building underground level with 0.50
m earth layer above it, (This protects the roof from
direct solar radiation while decreasing the dead
loads on the roof).
• Using sunken courtyard about 40 m2 with buried
area 80-120 m2 to provide ventilation, light, solar
heat, outside views, and access via a stairway
from the ground level.
• The research recommends stabilized earth blocks
as a sustainable low cost material that also helps
to reuse the excavated soil resulted from
basements with dome and vaults for roofing.
• Locating the service area above ground level can
avoid using pumps for sewage.
• Using an (EAHE) system with cheap irrigation
tubes placed in the building foundations or on the
underground bearing walls will be cost effective
because the digging cost will be avoided as the
basement was already dug.
• The soil surface to be shaded or vegetated to
obtain cooler soil temperature for better energy
performance.
• Calculating ground temperatures - using Labs'
equation- is essential when modeling the
efficiency of the underground house.
• Compact underground building is more effective
in Aswan, while more building earth contacted
areas is more efficient in Ismailia.
• Future detailed studies for more cities with
different weathers in Egypt are recommended.
• Further structural, economical, architectural
refinements and users’ acceptance studies for the
suggested building types are recommended.
• The researchers recommend further studies on
integrating SC with EAHE system in earth
sheltered homes.
REFERENCES
[1] H. Farrouh, H. and A Lubna. “Passive and
hybrid techniques for low cost energy efficient
housing in hot dry climate,” Azhar University
Magazine, Egypt, vol. 11, no. 41, pp. 1265-1274,
2016.
[2] The Egyptian Electricity Holding Company
Annual Report 2009/2010, Egyptian Electricity
Holding Company, Cairo, Egypt, 2010, pp. 1-48.
[3] M. Ali . “Modelling the performance of horizontal
heat exchanger of ground-coupled heat pump

Journal of Renewable Energy and Sustainable Development (RESD) Volume 4, Issue 1, June 2018 - ISSN 2356-8569 http://dx.doi.org/10.21622/RESD.2018.04.1.021
39 RESD © 2018 http://apc.aast.edu
systems with Egyptian conditions,” University Of
Manchester, 2013.
[4] M.G. Salim. “Selection of groundwater sites in
Egypt, using geographic information systems,
for desalination by solar energy in order to
reduce greenhouse gases,” Journal of Advanced
Research, vol. 3, no. 1, pp. 11–19, 2012
[5] D. Banks. An Introduction to Thermogeology:
Ground Source Heating and Cooling. Wiley-
Blackwell, 2012.
[6] A.J. Anselm. “Passive annual heat storage
principles in earth sheltered housing, a
supplementary energy saving system in
residential housing,” Energy and Buildings, vol.
40, no. 7 pp. 1214–1219, 2008.
[7] B. Hoyle. Low Energy Building Engineering. 1st
ed., The English Press, 2011, pp. 114-125.
[8] B. Rudofsky. Architecture Without Architects.
Doubleday & Company, 1964.
[9] A. Jideofor, . “Earth shelters; A review of energy
conservation properties in Earth sheltered
housing,” Energy Conservation, pp.127, 2012
[10] C. von Dronkelaar. Underground Buildings.
Thesis / University Of Technology Eindhoven,
2013.
[11] A.A. Al-Temeemi, and D.J Harris. “The
generation of subsurface temperature profiles
for Kuwait,” Energy and Buildings, vol. 33, no. 8,
pp. 837–841, 2001
[12] A.S. Alkaff, et al. “A review of underground
building towards thermal energy efficiency and
sustainable development,” Renewable and
Sustainable Energy Reviews, vol. 60, pp. 692–
713, 2016.
[13] S. Baggs , at al. “Australian earth-covered
building,” NSW University Press, 1991,
Kensington.
[14] A.A. Al-Temeemi and D.J. Harris. “A guideline
for assessing the suitability of earth-sheltered
mass-housing in hot-arid climates,” Energy and
Buildings, vol. 36, no. 3, pp. 251–260, 2004.
[15] R. A. Behr. Suitable Thin Shell Structural
Configurations for Earth Sheltered Housing.
PhD. Thesis, Texas Tech University, 1982.
[16] P. Carpenter. “‘Sod It’: an introduction to earth
sheltered development in England and Wales,”
British Earth Sheltering Association, "Sod It": an
Introduction to Earth Sheltered Development in
England and Wales, 1994.
[17] T.A. Bligh. “Comparison of energy consumption
in earth covered vs. non-earth covered
buildings,” in Proceedings of the Conference on
Alternatives in Energy Conservation, National
Science Foundation, 1975.
[18] G. Golany. Earth-Sheltered Habitat: History,
Architecture and Urban Design. Van Nostrand,
1983.
[19] A.A. Al-Mumin. “Suitability of sunken courtyards
in the desert climate of Kuwait,” Energy and
Buildings, vol. 33, no. 2, pp. 103–111, 2001.
[20] National Renewable Energy Laboratory (Nrel).
“Earth-sheltered houses,” Energy Efficiency and
Renewable Energy Clearinghouse, 1997.
[21] H. Wallbaum, et al. “Indicator based
sustainability assessment tool for affordable
housing construction technologies,” Ecological
Indicators, vol. 18, pp. 353–364, 2012.
[22] T. Akmal, , et al. “Rice-straw based cement brick
microclimatic thermal impact assessment in
Cairo, Egypt,” Proceedings of the World
Renewable Energy Congress â Sweden, 8â 13
May, 2011, LinköPing, Sweden, 2011.
[23] M. El-Kabbany. Alternative Building Materials
and Components for Affordable Housing in
Egypt: Towards Improved Competitiveness of
Modern Earth Construction, MSc. Thesis, Ain
Shams University, Egypt, 2013.
[24] A.M. Bauchard, ed. "Compressed stabilized
earth blocks,” Auroville Earth Institute
Newsletter, pp.3 2012.
[25] S. Attia, et al. “Architect friendly: A comparison
of ten different building performance simulation
tools," 11th IBPSA Building Simulation
Conference. Glasgow, Scotland, 2009.

Journal of Renewable Energy and Sustainable Development (RESD) Volume 4, Issue 1, June 2018 - ISSN 2356-8569 http://dx.doi.org/10.21622/RESD.2018.04.1.021
40 RESD © 2018 http://apc.aast.edu
[26] D.B. Crawley, et al. “Energy plus: Creating a
new-generation building energy simulation
program,” Energy and Buildings, vol. 33, no. 4,
pp. 319–331, 2001.
[27] A.A. Al-Temeemi and D.J. Harris. “The effect of
earth-contact on heat transfer through a wall in
Kuwait,” Energy and Buildings, vol. 35, no. 4,
pp. 399–404, 2003.
[28] K.H. Lee and R. Strand. ”Implementation of an
earth tube system into energy plus program,”
Energy and Buildings, vol. 40, 2006.
[29] A. Sansui. “Low energy ground cooling system
for buildings in hot and humid Malaysia,” De
Montfort University, Malaysia, 2012.
[30] M. Santamouris, et al. “Use of buried pipes for
energy conservation in cooling of agricultural
greenhouses,” Solar Energy, vol. 55, no. 2, pp.
111–124, 1995.
[31] V. Bansal and J. Mathur “Performance
enhancement of earth air tunnel heat exchanger
using evaporative cooling,” International Journal
of Low-Carbon Technologies, vol. 4, pp 150-
158, 2009.
[32] G. Mihalakakou, et al. “Parametric prediction of
the buried pipes cooling potential for passive
cooling applications,” Solar Energy, vol. 55, pp.
151-234, 1995.
[33] A.K. Misra, et al. “Design and performance
evaluation of low cost earth to air heat
exchanger model suitable for small buildings in
arid and semi-arid regions,” KSCE Journal of
Civil Engineering, vol. 19, no. 4, pp. 853–856,
2014.
[34] D.Y. Goswami and K.M. Biseli. Use of
Underground Air Tunnels for Heating and
Cooling Agricultural and Residential Buildings.
Fact Sheet EES 78, pp. 1-4., Florida Energy
Extension Service, University Of Florida, 1993.
infohouse.p2ric.org/ref/08/07683.pdf&p=DevEx,
5066.1.
[35] T. Choudhury and A.K. Misra. “Minimizing
changing climate impact on buildings using
easily and economically feasible earth to air heat
exchanger technique,” Mitigation and Adaptation
Strategies for Global Change, vol. 19, no. 7, pp.
947–954, 2013.
[36] J. Pfafferott. “Evaluation of earth-to-air heat
exchangers with a standardised method to
calculate energy efficiency,” Energy and
Buildings, vol. 35, no. 10, pp. 971–983, 2003.
[37] N.M. Thanu, et al. “An experimental study of the
thermal performance of an earth-air-pipe system
in single pass mode,” Solar Energy, vol. 71, no.
6, pp. 353–364, 2001.
[38] M.D. Paepe and A. Janssens. “Thermo-
hydraulic design of earth-air heat exchangers,”
Energy and Buildings, vol. 35, no. 4, pp. 389–
397, 2003.
[39] M. Maerefat and A.P. Haghighi. “Passive cooling
of buildings by using integrated earth to air heat
exchanger and solar chimney,” Renewable
Energy, vol. 35, no. 10, pp. 2316–2324, 2010.
[40] A.H. Poshtiri, et al. “Feasibility study on using
solar chimney and earth-to-air heat exchanger
for natural heating of buildings,” Proceedings of
the World Renewable Energy Congress â
Sweden, 8â13 May, 2011, LinkÃPing, Sweden,
2011.
[41] H. Hammadi, and A. Mohammed. “Application
of earth tube heat exchanger and solar chimney
for natural cooling system in Basrah City,”
Journal for Engineering Sciences, pp. 23–32,
2014.
[42] M.S. Hassan and I.M. El-Moghasy. “Space
conditioning by pipe-air cooler buried in earth,”
First Conference of the Egyptian Combustion
Society, 1989.
[43] M.O. Ali. “Development of design factors for
spiral ground heat exchanger in heat pump
applications,” Al-Minia University, Al-Minia
University, 2005, p. 29.
[44] S. Moustafa, et al. “Arid soil temperature
model,” Solar Energy, vol. 27, no. 1, pp. 83–88,
1981.
[45] M. Derradji and M. Aiche. “Modeling the soil
surface temperature for natural cooling of
buildings in hot climates,” Procedia Computer
Science, vol. 32, pp. 615-621, 2014.

Journal of Renewable Energy and Sustainable Development (RESD) Volume 4, Issue 1, June 2018 - ISSN 2356-8569 http://dx.doi.org/10.21622/RESD.2018.04.1.021
41 RESD © 2018 http://apc.aast.edu
[46] H.B.J. Derbel and O. Kanoun. “Investigation of
the ground thermal potential in Tunisia focused
towards heating and cooling applications,”
Applied Thermal Engineering, vol. 30, no. 10,
pp. 1091–1100, 2010.
[47] F. Al-Ajmi, et al. “The cooling potential of
Earth†air heat exchangers for domestic
buildings in a desert climate,” Building and
Environment, vol. 41, no. 3, pp. 235–244, 2006.
[48] Sharan, et al. “Soil Temperatures Regime at
Ahmedabad.” EconPapers, 2 Nov. 2002,
econpapers.repec.org/RePEc:iim:iimawp:wp000
50.
[49] A.O. Ogunlela. “Modeling soil temperature
variations,” Journal of Agricultural Research and
Development, vol. 2, no. 1, pp. 100-109, 2009.
[50] A. Gouda. “Using of geothermal energy in
heating and cooling of agricultural structures,”
Benha University, 2010.
[51] D.L. Nofzigerd. “Soil temperature changes with
time and depth theory.”
Http://Soilphysics.Okstate.Edu/Software/Soiltem
perature/Document.Pdf, 2003.
[52] Editor in chief: A.M. Bauchard. “Compressed
stabilized earth blocks,” Auroville Earth Institute,
India, 2012.
• List of Figures
Fig.1: Egyptian electricity consumption (most
consuming) is the residential. The Egyptian Electricity
Holding Company Annual Report 2009/2010.
Egyptian Electricity Holding Company, Cairo, Egypt,
2010.
Fig.2: Classification of aquifer depth in Egypt. Source:
M. Salim, Selection of Groundwater Sites in Egypt.
Journal of Advanced Research, 2012.
Fig.3: Earth’s energy budget diagram showing the
short-wave (a) and long-wave (b) energy fluxes.
Source: Banks, David. An Introduction to
Thermogeology: Ground Source Heating and Cooling.
Wiley-Blackwell, 2012.
Fig.4: Historical earth sheltered homes. Source:
- B. Rudofsky. Architecture without Architects.
Doubleday & Company, 1964.
- A. Jideofor. “Earth shelters; A review of energy
conservation properties in earth sheltered housing,”
Energy Conservation, pp.127, 2012.
- C. von Dronkelaar. Underground Buildings. Thesis /
University Of Technology Eindhoven, 2013.
Fig.5: Typology of earth sheltered buildings. Source:
H. Hassan. Analytical Study of Earth-Sheltered
Construction and its Suitability for Housing Projects in
the Egyptian Deserts. Thesis, Egypt. 2009.
Fig.6: Deduced eight types of courtyard houses which
represent the case studies
Source: Reasearchers.
Fig.7: Factors that affect earth pipe cooling
performance. Source: K.H. Lee and R. Strand.
”Implementation of an earth tube system into energy
plus program,” Energy and Buildings, vol.40, 2006.
Fig.8: Schematic diagram of integrated earth to air
heat exchanger and solar chimney. Source: M.
Maerefat and A. Poshtiri, 2010.
Fig.9: a.R1 Model in Energy Plus Program, b. R1-R8
house types Source: Researchers.
Fig.10: Average monthly temp. compared to
calculated soil temp. in Aswan. Source: Researchers.
Fig.11. Average monthly temperatures compared to
calculated soil temp.in Ismailia. Source: Researchers.
Fig.12: Yearly discomfort hours [Measured for the four
plans (O-A-B-C)] Source: Researchers.
Fig.13. Energy consumption to reach thermal comfort
[Measured for the two plans, P (O- B)]. Source:
Researchers.
Fig.14: % Decrease in energy consumption (%
Difference between Plan PO& PB) for the two
directions of the eight types. Source: Researchers.

Journal of Renewable Energy and Sustainable Development (RESD) Volume 4, Issue 1, June 2018 - ISSN 2356-8569 http://dx.doi.org/10.21622/RESD.2018.04.1.042
42 RESD © 2018 http://apc.aast.edu
Generating Electricity Using Geothermal Energy in Iran
Abstract - Given that fossil fuels will end one day and
that these types of fuels produce a lot of pollution,
each country should look for new ways to generate
energy that is needed for its people in proportion to its
energy resources. Given that Iran is geographically
located in an appropriate region of the earth, it has a
great potential for using renewable energy. In this
study, sources and uses of Iranians’ geothermal
energy have been studied, all of which indicate that
Iran has a very good potential for electricity production
using geothermal energy. According to the
information gathered, Iran has one geothermal energy
plant in Meshkin shahr city and this plant power with a
capacity of 100 megawatts is an active power plant in
Iran. Also, the potential of geothermal power
generation was verified in Khoy located in Azarbaijan
Gharbi province, Sabalan Ardebil province, Sahand in
Azarbaijan Sharghi and Damavand in Tehran province
Examination verified that around 8.8% of total land in
Iran is capable of geothermal energy production.
Keywords - Iran, Geothermal Energy, fossil fuels,
renewable energy.
I. INTRODUCTION
Iran (Islamic Republic of Iran) is located in the West
Asia, surrounded by Caspian Sea, Azerbaijan,
Turkmenistan, Armenia, Pakistan, Afghanistan, Iraq,
Persian Gulf, Oman Gulf and Turkey [1]. Total area of
this country is 1.65 million km2, and its population is
about 80 million people including 49.6% females and
50.6% males. Iran has a warm and dry climate by long
summers and short, cold winters[2] [3]. The same
climate and the four seasons have led to a special
look at using renewable energy in sustainable
development in different fields. Statistics showed that
Iran has the fourth largest crude oil reserves, the
second largest natural gas reserves in the world [4],
and a very high potential in renewable energy sectors,
such as solar, wind, geothermal, etc. which can be
used exclusively in any of the cities in Iran [5].
On the one hand, energy plays a significant role in the
economic and social activities of the humans and the
country and the growth of energy and its use and
productivity will also lead to the welfare of people.
Hence, over the past years, great attention has been
paid to energy production in a variety of ways [6]. On
the other hand, fossil fuels have been used
extensively in the past two decades and fossil
resources are limited and one day they will end. So
any country should know the energy available in it and
also lookto create new ways to produce energy[7].
Also Iran has a lot of fossil resources, which could be
easily used for many years, but the point to consider
is, how long can these fuels be used? Figure 1 shows
the use of renewable energy in seven countries, which
is the largest amount of wind power use for china and
the largest use of solar energy in Germany [8].
Armin Ramezani, Mohammad Vahedi Torshizi, Arash Attari and Farhad Tabarsa
Department of Bio-System Mechanical Engineering, Gorgan University of Agricultural Sciences and Natural
Resources, Gorgan, Iran.

Journal of Renewable Energy and Sustainable Development (RESD) Volume 4, Issue 1, June 2018 - ISSN 2356-8569 http://dx.doi.org/10.21622/RESD.2018.04.1.042
43 RESD © 2018 http://apc.aast.edu
Fig.1. Renewable power capacities in the word, eu-28, brics, and top seven countries
In recent years, the consumption of fossil fuels in Iran
and the world has multiplied [9]. In addition, the rising
cost of fossil fuels and their damaging environmental
impacts, such as pollution, rising ground
temperatures, and ozone depletion, have increased
the desire to use renewable energies [10][11].
The large oil and gas producers Iran is the world´s 7th
largest emitters of CO2 from Fossil Fuels. The
diagrams below show the per capita CO2 emissions
from Fossil Fuels (without bunkers) and cement,
annually since 2000. The green bars show the free
emission level – the exceedance is the basis for
calculating the national Climate Debt. Iran was
responsible for 1.9% of global emissions in 2015.
Also Iran has the highest share of 36.15 % of
greenhouse gas emissions in the Middle East, and
next to Iran are Saudi Arabia and United Arab
emirates which are also ranked 24.29% and 14.9%,
respectively. The use of energy carriers, with the
production of pollutant and greenhouse gases in the
conversion process and causing more warming of
ground and climates in the destruction of the ozone
layer, put the environment seriously in the face of the
threat [12] [13]. Figure 2 shows the contribution of
different sectors to greenhouse gas emissions [14].
Fig. 2. Green House Gas Emissions by Sector

Journal of Renewable Energy and Sustainable Development (RESD) Volume 4, Issue 1, June 2018 - ISSN 2356-8569 http://dx.doi.org/10.21622/RESD.2018.04.1.042
44 RESD © 2018 http://apc.aast.edu
Today, the challenge of energy policies is to reduce
fossil fuel production and environmental costs. Since
the expansion of access to energy (heat, light, etc.) is
very important in developing countries [15] and
various political and other measures have been taken
to reduce energy consumption, renewable energy is
introduced to solve this problem and high productivity
of renewable energy and the transfer of clean
technologies are considered in different countries,.
Given the fact that in the last century there has been
a significant growth of energy consumption in the
world, meeting the energy needs of humans has
been considered as well as the major role fossil fuels
play in supplying this energy [16] [17].
Also Iran has abundant resources in fossil fuels.
Proven oil reserves include gas liquids of more than
137 billion barrels, accounting for 11 percent of the
world's resources while natural gas resources are
more than 26.7 trillion cubic meters or 15% of the
world's total resources [18]. Figure 3 shows the
production of fossil fuels for Iran [19] .
Fig. 3. Production of fossil fuels in Iran
It is a well-known fact that Iran's economy is a mixed
economy where the government companies own oil
and the other large companies agriculture and
investment services. Given the diversity of the Iranian
economy, Iran's economy is still heavily dependent
on oil exports. At present, oil exports account for 80%
of total exports which accounts for nearly 50 percent
of the government's budget and is 23 percent of the
gross domestic product. With growing demand for
energy, increased environmental pollution, and
depleting energy sources, human society today faces
multiple challenges of transition towards sustainable
development and poverty eradication [20] .In 2005,
2713.4 million tons of carbon dioxide emissions from
burning of combustible fuels have been released in
the world. The 1671.7 million tons equivalent to
greenhouse gas (CO2) emissions in the Middle East
region have been released and 1,238.1 million tons of
this gas were due to the burning of combustible fuels
[21].
the total new global investments in renewable energy
increased from $40 billion in 2004 to $244 billion in
2012 [22]. According to the International Energy
Agency, utilization of renewable energy will triple
between 2008 and 2035. Also, it is anticipated that
the share in renewable electricity production in the
middle eastern regions, the heart of the world's fossil
fuel reserve, will amount to 16% in 2035 [6].

Journal of Renewable Energy and Sustainable Development (RESD) Volume 4, Issue 1, June 2018 - ISSN 2356-8569 http://dx.doi.org/10.21622/RESD.2018.04.1.042
45 RESD © 2018 http://apc.aast.edu
Table 1. Lists of Power Plants with Fossil Fuels in Different Parts of the Country
Rating Province name Power plants with a capacity of more
than 1 MW
Power plants with capacity of 1 MW
And less
Number Capacity (MW) Number Capacity (MW)
1 Khorasan razavi 8 43.1 110 662.2
2 Kohkeloye va boyer ahmad 5 16.85 ----- -----
3 Esfehan 4 14.46 21 317
4 Zanjan 4 102.52 ----- -----
5 Tehran 6 9.843 5 32.84
6 Markazi 5 19.61 1 100
7 Kerman 3 11.2 ----- -----
8 Fars 4 13.975 2 66
9 Khuzestan 3 18.66 ----- -----
10 Gilan 2 53.78 ----- -----
11 Kerman ----- ----- 18 169
12 Yazd 1 4 4 160
13 Azarbayjan sharghi 4 3.96 ----- -----
14 Khorasan jonobi ----- ----- 12 155
15 Mazandaran 1 1 1 1.2
16 Kermanshah 1 10 ----- -----
17 Azarbayjan gharbi 1 6 ----- -----
18 Kordestan 1 10 ----- -----
19 Chaharmah bakhtiyari 1 5 ----- -----
20 Hamedan 1 2.8 ----- -----
21 Ghazvin ----- ----- 7 50
22 Semnan ----- ----- 3 15
23 Lorestan 2 1.6 ----- -----
24 Sistan va balochestan 1 0.66 ----- -----
25 Boohsher ----- ----- 1 2.5
26 Hormozgan ----- ----- 1 5
Geothermal energy is one of the renewable energy
resources witnessing increasing interest. It can
supply energy demand in two different forms. It could
be used indirectly for geothermal power generation or
be utilized directly for heating purposes such as
greenhouses, district heating, fish farming and others
[23].
82 countries around the world have reported installing
direct use of geothermal applications. Some of these
countries have a long history in the research and
development of direct geothermal energy use.
Amongst these countries are: the US, Iceland, and
New Zealand. In the case of the US, the direct
utilization of geothermal energy includes heating of
swimming pools and spas, aquaculture and
greenhouses, district heating, industrial applications
and ground-source heat pumps. The largest
application is ground-source heat pumps accounting
for 88% of the annual energy use. In summary, when
considering direct-use without geothermal heat
pumps, the distribution of annual energy use is as
follows: 34% for fish farming, 28% for bathing and
swimming, 15% of individual space heating, 9% for
greenhouse heating, 9% for district heating, and the
rest is for agricultural drying, industrial process
heating, cooling, and snow melting. The current
installed capacity and annual energy use for district
heating is 81.55 MW/th and 839.6 TJ/yr [23] [24].
Iran has a high geothermal energy potential. The
country geothermal gradient range varies from
2°C/100m in the Zagros belt to 13°C/100m around
the Damavand volcano in the north. Most geothermal
energy studies in Iran have focused on electricity
production, while, research on the direct use of
geothermal energy have received less attention [25]
[26].
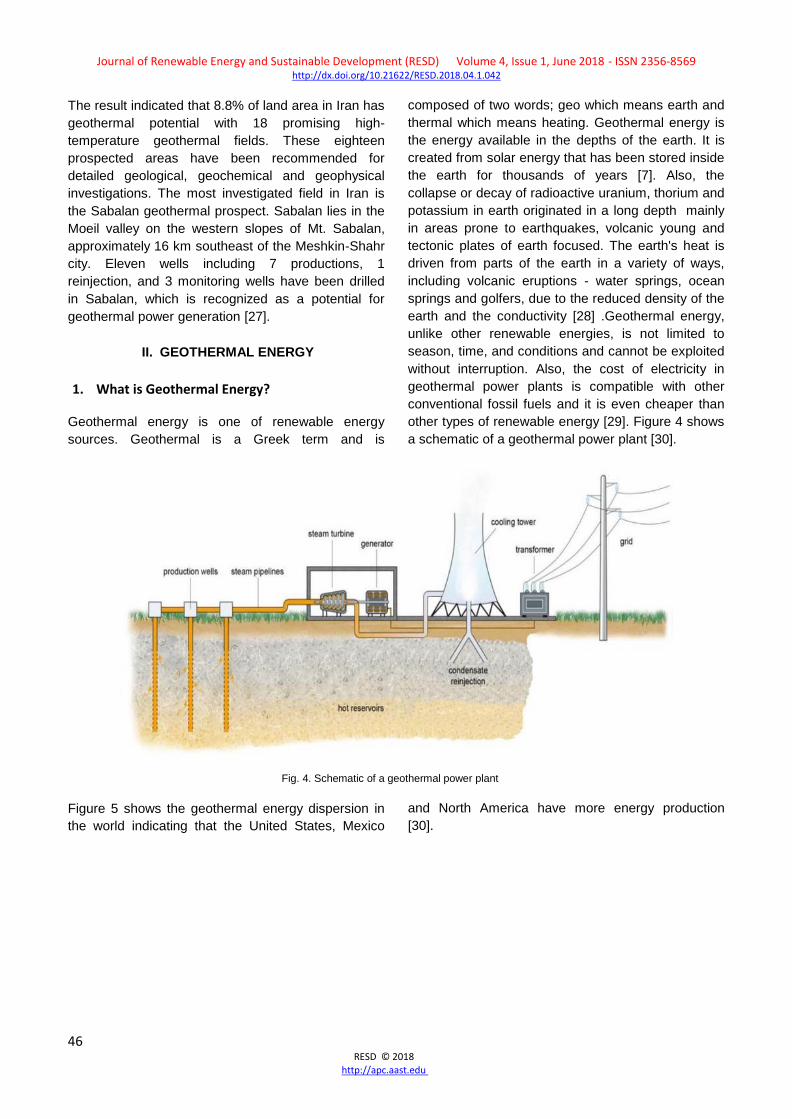
Journal of Renewable Energy and Sustainable Development (RESD) Volume 4, Issue 1, June 2018 - ISSN 2356-8569 http://dx.doi.org/10.21622/RESD.2018.04.1.042
46 RESD © 2018 http://apc.aast.edu
The result indicated that 8.8% of land area in Iran has
geothermal potential with 18 promising high-
temperature geothermal fields. These eighteen
prospected areas have been recommended for
detailed geological, geochemical and geophysical
investigations. The most investigated field in Iran is
the Sabalan geothermal prospect. Sabalan lies in the
Moeil valley on the western slopes of Mt. Sabalan,
approximately 16 km southeast of the Meshkin-Shahr
city. Eleven wells including 7 productions, 1
reinjection, and 3 monitoring wells have been drilled
in Sabalan, which is recognized as a potential for
geothermal power generation [27].
II. GEOTHERMAL ENERGY
1. What is Geothermal Energy?
Geothermal energy is one of renewable energy
sources. Geothermal is a Greek term and is
composed of two words; geo which means earth and
thermal which means heating. Geothermal energy is
the energy available in the depths of the earth. It is
created from solar energy that has been stored inside
the earth for thousands of years [7]. Also, the
collapse or decay of radioactive uranium, thorium and
potassium in earth originated in a long depth mainly
in areas prone to earthquakes, volcanic young and
tectonic plates of earth focused. The earth's heat is
driven from parts of the earth in a variety of ways,
including volcanic eruptions - water springs, ocean
springs and golfers, due to the reduced density of the
earth and the conductivity [28] .Geothermal energy,
unlike other renewable energies, is not limited to
season, time, and conditions and cannot be exploited
without interruption. Also, the cost of electricity in
geothermal power plants is compatible with other
conventional fossil fuels and it is even cheaper than
other types of renewable energy [29]. Figure 4 shows
a schematic of a geothermal power plant [30].
Fig. 4. Schematic of a geothermal power plant
Figure 5 shows the geothermal energy dispersion in
the world indicating that the United States, Mexico
and North America have more energy production
[30].
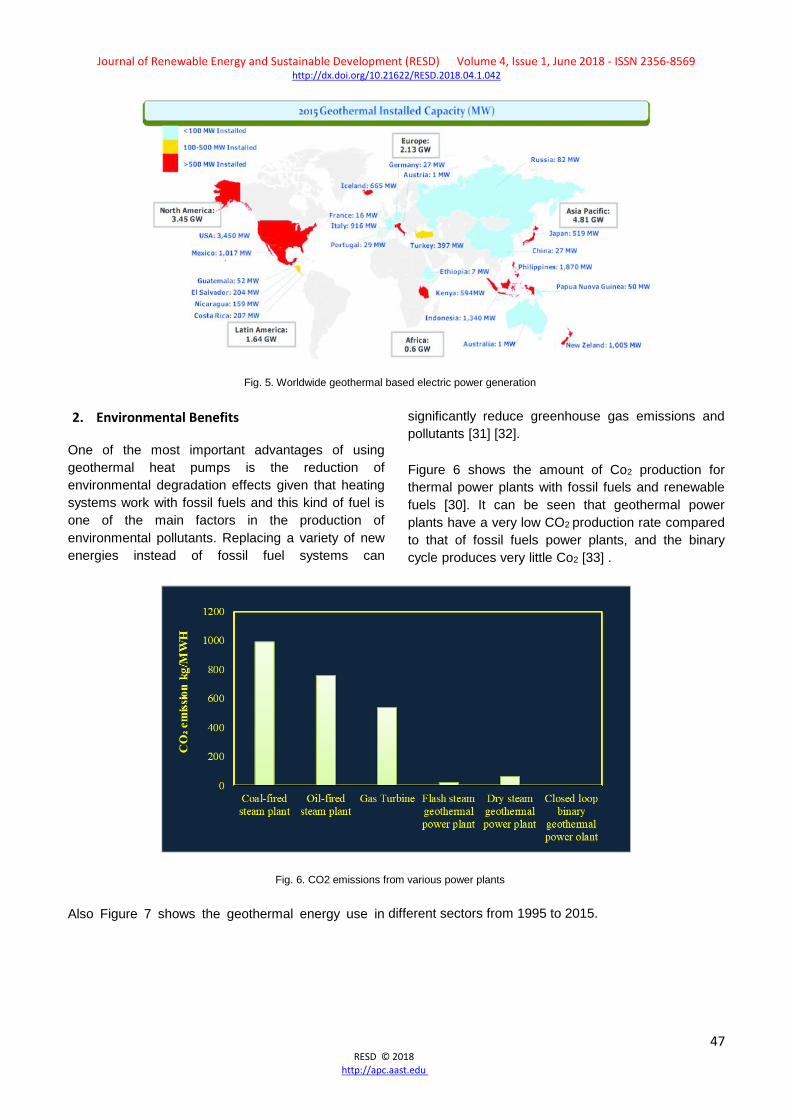
Journal of Renewable Energy and Sustainable Development (RESD) Volume 4, Issue 1, June 2018 - ISSN 2356-8569 http://dx.doi.org/10.21622/RESD.2018.04.1.042
47 RESD © 2018 http://apc.aast.edu
Fig. 5. Worldwide geothermal based electric power generation
2. Environmental Benefits
One of the most important advantages of using
geothermal heat pumps is the reduction of
environmental degradation effects given that heating
systems work with fossil fuels and this kind of fuel is
one of the main factors in the production of
environmental pollutants. Replacing a variety of new
energies instead of fossil fuel systems can
significantly reduce greenhouse gas emissions and
pollutants [31] [32].
Figure 6 shows the amount of Co2 production for
thermal power plants with fossil fuels and renewable
fuels [30]. It can be seen that geothermal power
plants have a very low CO2 production rate compared
to that of fossil fuels power plants, and the binary
cycle produces very little Co2 [33] .
Fig. 6. CO2 emissions from various power plants
Also Figure 7 shows the geothermal energy use in different sectors from 1995 to 2015.

Journal of Renewable Energy and Sustainable Development (RESD) Volume 4, Issue 1, June 2018 - ISSN 2356-8569 http://dx.doi.org/10.21622/RESD.2018.04.1.042
48 RESD © 2018 http://apc.aast.edu
Fig. 7. Amount of geothermal energy used in different sectors from 1995 to 2015
In Figure 8, the amount of electricity generated by
geothermal energy in the ten countries has been
investigated and it has been proved that United
States is the highest in using this energy [34]
Fig. 8. Geothermal energy capacity in ten countries
3. Geothermal Energy Capacities and History in
Iran
In Iran, since 1975, extensive studies have been
initiated in order to identify the geothermal energy
source potential of the Ministry of Energy in
cooperation with ENEL Consulting Engineers in the
north and northwest regions of Iran in an area of
260,000 square kilometers. The result of this
research revealed that Sabalan, Damavand, Khoy,
Mako and Sahand areas, with an area of more than
31,000 square kilometers, are suitable for further
studies and geothermal energy utilization. In this
regard, the exploration program, including
geological, geophysical and geochemical studies,
was planned. In the year 1982, with the completion
of preliminary exploratory studies in each of the
areas mentioned, the areas susceptible are more
precisely identified and as a result, in the Sabalan
area: Meshkin shahr, Sarein and Busheli areas, in
the Damavand area of the district: Neunal, in the
Maku- Khoy regions: Black and Dasht and in the
Sahand area, five smaller regions were selected to
focus on the activities of the exploratory phase. After

Journal of Renewable Energy and Sustainable Development (RESD) Volume 4, Issue 1, June 2018 - ISSN 2356-8569 http://dx.doi.org/10.21622/RESD.2018.04.1.042
49 RESD © 2018 http://apc.aast.edu
a relatively long interruption and with the aim of
reactivating the plan, existing reports were revisited
by UNDP experts in 1991 and the Meshkin Shahr
geothermal region was introduced as the first priority
for further exploratory studies [35].
Following the mentioned studies, exploration,
injection and descriptive drilling projects were
defined in order to identify more potential in the
Sarein area of Meshkin Shahr in 2002 that drilling
operations are the first geothermal wells in the same
year began. The first phase of this project was
completed in 2004. In total, three exploratory wells
and two injection well bars were drilled at this stage
and two-loop test of three exploratory wells was
successfully carried out, which was the most
important achievement of this phase of the project to
acquire the know-how in geothermal wells. The
second phase of the project began in 2005. In Figure
9, areas with geothermal energy are shown.
Fig. 9. Geothermal potential areas in Iran
In the project for the development of the geothermal
field and the construction of Meshkin Shahr Power
Plant, the drilling of wells, the operation of wells
during the test period and the manufacture of test
equipment in the country have been completely
indigenous and were done by local experts.
Also, in the field of using geothermal heat pumps, t so
far, the technology of installing earth coils has been
completely and 100% native in Iran n. [36] Figure 10
shows the distribution of geothermal energy in Iran,
according to the figure, it can be stated that
geothermal energy can be used in three parts of the
northwest, center of Iran and south of Iran. Of course,
in the northwest of Iran due to the presence of
volcanoes and in the center of Iran due to the
presence of the desert, and in southern Iran, the use
of this energy can be very useful due to the Persian
Gulf Sea.
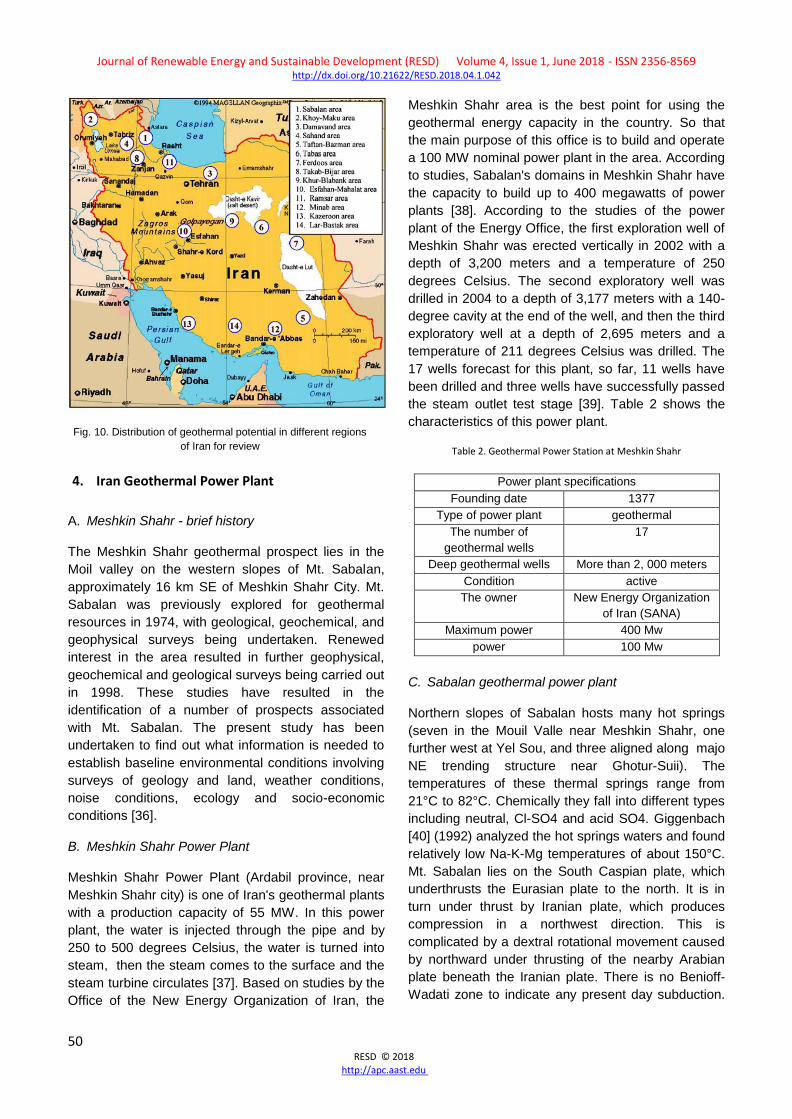
Journal of Renewable Energy and Sustainable Development (RESD) Volume 4, Issue 1, June 2018 - ISSN 2356-8569 http://dx.doi.org/10.21622/RESD.2018.04.1.042
50 RESD © 2018 http://apc.aast.edu
Fig. 10. Distribution of geothermal potential in different regions
of Iran for review
4. Iran Geothermal Power Plant
A. Meshkin Shahr - brief history
The Meshkin Shahr geothermal prospect lies in the
Moil valley on the western slopes of Mt. Sabalan,
approximately 16 km SE of Meshkin Shahr City. Mt.
Sabalan was previously explored for geothermal
resources in 1974, with geological, geochemical, and
geophysical surveys being undertaken. Renewed
interest in the area resulted in further geophysical,
geochemical and geological surveys being carried out
in 1998. These studies have resulted in the
identification of a number of prospects associated
with Mt. Sabalan. The present study has been
undertaken to find out what information is needed to
establish baseline environmental conditions involving
surveys of geology and land, weather conditions,
noise conditions, ecology and socio-economic
conditions [36].
B. Meshkin Shahr Power Plant
Meshkin Shahr Power Plant (Ardabil province, near
Meshkin Shahr city) is one of Iran's geothermal plants
with a production capacity of 55 MW. In this power
plant, the water is injected through the pipe and by
250 to 500 degrees Celsius, the water is turned into
steam, then the steam comes to the surface and the
steam turbine circulates [37]. Based on studies by the
Office of the New Energy Organization of Iran, the
Meshkin Shahr area is the best point for using the
geothermal energy capacity in the country. So that
the main purpose of this office is to build and operate
a 100 MW nominal power plant in the area. According
to studies, Sabalan's domains in Meshkin Shahr have
the capacity to build up to 400 megawatts of power
plants [38]. According to the studies of the power
plant of the Energy Office, the first exploration well of
Meshkin Shahr was erected vertically in 2002 with a
depth of 3,200 meters and a temperature of 250
degrees Celsius. The second exploratory well was
drilled in 2004 to a depth of 3,177 meters with a 140-
degree cavity at the end of the well, and then the third
exploratory well at a depth of 2,695 meters and a
temperature of 211 degrees Celsius was drilled. The
17 wells forecast for this plant, so far, 11 wells have
been drilled and three wells have successfully passed
the steam outlet test stage [39]. Table 2 shows the
characteristics of this power plant.
Table 2. Geothermal Power Station at Meshkin Shahr
Power plant specifications
Founding date 1377
Type of power plant geothermal
The number of
geothermal wells
17
Deep geothermal wells More than 2, 000 meters
Condition active
The owner New Energy Organization
of Iran (SANA)
Maximum power 400 Mw
power 100 Mw
C. Sabalan geothermal power plant
Northern slopes of Sabalan hosts many hot springs
(seven in the Mouil Valle near Meshkin Shahr, one
further west at Yel Sou, and three aligned along majo
NE trending structure near Ghotur-Suii). The
temperatures of these thermal springs range from
21°C to 82°C. Chemically they fall into different types
including neutral, Cl-SO4 and acid SO4. Giggenbach
[40] (1992) analyzed the hot springs waters and found
relatively low Na-K-Mg temperatures of about 150°C.
Mt. Sabalan lies on the South Caspian plate, which
underthrusts the Eurasian plate to the north. It is in
turn under thrust by Iranian plate, which produces
compression in a northwest direction. This is
complicated by a dextral rotational movement caused
by northward under thrusting of the nearby Arabian
plate beneath the Iranian plate. There is no Benioff-
Wadati zone to indicate any present day subduction.

Journal of Renewable Energy and Sustainable Development (RESD) Volume 4, Issue 1, June 2018 - ISSN 2356-8569 http://dx.doi.org/10.21622/RESD.2018.04.1.042
51 RESD © 2018 http://apc.aast.edu
Mt. Sabalan is a Quaternary volcanic complex that
rises to a height of 4811 m, some 3800 m above the
Ahar Chai valley to the north. Volcanism within the
Sabalan caldera has formed three major volcanic
peaks which rise to elevations of around 4700 m[41] .
Analysis of the single–flash geothermal power plant
was conducted using energy and exergy concepts for
Sabalan, Iran. Reservoir fluid enthalpy and mass flow
rate are 1000 kJ/kg and 500 kg/s respectively. EES
software was used to model the plant. Optimization
was done to maximize the net power output of the
plant. Optimum pressure value for separation is 5.5
bar. With these optimum pressure values the net
power output of the plant is calculated to be 36594
KWe. Pumps and compressor will use 843 KWe and
3350 KWe, respectively. Table 2 illustrates important
parameters at major stages of power plant at optimal
pressure. The overall first and second law efficiencies
of the power plant are 7.32% and 32.73%,
respectively. The reference conditions for exergy
analysis are 15ºC and atmospheric pressure. Figure
11 shows exergy destruction at different stages of the
plant. 1.38% of the total exergy destruction is due to
transmission from the reservoir to wellhead. 1.09% of
the exergy is destroyed at the separation step. 4.91%
is lost at the steam expansion unit. 23.35% are
destroyed in the condenser. 13.19% and 41.44% are
the waste brine from condensing steam and
separator, respectively. Finally, the remainder is
32.73%, which is the fraction of the initial exergy that
the plant turns to power [42] .
Fig. 11. Grassman presentation of the overall exergy flow
5. Resources and Geothermal Maps in Iran
The position of Iran in the tectonic boundaries shows
the enormous power of the country's framework [43].
The continental plate of Saudi Arabia and the Indian
Ocean plate have, on the other hand, caused major
deformations in Iran and Zagros region Wrinkle is the
evidence of the huge surface of these forces. Being
placed in a volcanic belt has made Iran's geopolitical
area very active and high potential of geothermal
energy and the presence of volcanic activity and
abundant hot water sources are evidence of this
claim. There is eothermal energy potential in the
country, according to studies conducted in more than
10 areas that have been identified based on tectonic
activity, hot springs, surface emergencies and other
geological evidence. According to studies conducted
in 1377, these areas are as follows:
District of Sabalan, Meshkin Shahr, Sarein and
Busheli - Damavand Region, Nandul Area - Maku
Region, Black Area of Fountain - Khoy Region, Dorsal
Region - Sahand Region - Taftan District, Bessman -
Nayband Region - Birjand Area, Ferdos - Takab
Region, Hashtrood - Region Khor, Bayabanak -
Isfahan District, Localities - Ramsar District - Bandar
Abbas Region, Minab - Boushehr District, Kazeroon
and Lar Bastak Area.
According to the world classifications, Iran is in the
group of countries with potential reserves for the
production of heat from geothermal energy using
cyclic evaporation and binaries (for a period of 30
years) and the ability to generate electricity from
geothermal energy with a capacity of more than 200
megawatts.

Journal of Renewable Energy and Sustainable Development (RESD) Volume 4, Issue 1, June 2018 - ISSN 2356-8569 http://dx.doi.org/10.21622/RESD.2018.04.1.042
52 RESD © 2018 http://apc.aast.edu
Table 3. Geothermal Energy Potentiometric Estimation (KJ) in Iranian Provinces
III. SUMMARY AND CONCLUSIONS
Iran has more than 200 fossil fuel power plants which
produce about 26,000 megawatts of electricity.
According to the results, geothermal energy can
generate about 100 megawatts of electricity. Also,
with the introduction of different regions of Iran and
using these energies, electricity production can be
increased. Given that fossil fuel consumption in Iran is
very high, Pollution in Iran is higher than the global
level. However, with the use of geothermal energy,
these contaminations can be reduced. Also, surveys
on geothermal energy in 18 regions of Iran have
suggested the largest areas of Tabas, Mahallat and
Sabalan for the use of geothermal energy.
R province name The approximate
number of hot springs
Number of possible
geothermal areas
thermal energy(KJ)
1 Azarbayjan sharghi 15 7 58×1016
2 Azarbayjan gharbi 41 10 74×1016
3 Ardebil 50 6 44.4×10¹⁶
4 Esfehan 6 4 29.6×10¹⁶
5 Ilam 2 1 7.4×10¹⁶
6 Bosher 3 3 22.2×10¹⁶
7 Tehran -------- -------- --------
8 Chaharmahl va bakhtiyari 1 1 7.4×10¹⁶
9 Khorasan jonobi 1 1 7.4×10¹⁶
10 Khorasan razavi 3 3 22.2×10¹⁶
11 Khorasan shomali 3 3 22.2×10¹⁶
12 Khuzestan -------- -------- --------
13 Zanjan 3 3 22.2×10¹⁶
14 Semnan 1 1 7.4×10¹⁶
15 Sistan va balochestan 10 5 37×1016
16 Fars 3 3 22.2×10¹⁶
17 Ghazvin 4 4 29.6×10¹⁶
18 Ghom -------- -------- --------
19 Kordestan -------- -------- --------
20 Kerman 9 8 59.2×10¹⁶
21 Kermanshah 2 2 14.8×10¹⁶
22 Kohkeloye va boyer ahmad 1 1 7.4×10¹⁶
23 Golestan 1 1 7.4×10¹⁶
24 Gilan 2 2 14.8×10¹⁶
25 Lorestan 2 2 14.8×10¹⁶
26 Mazandaran 5 5 37×1016
27 Markazi 6 1 7.4×10¹⁶
28 Hormozgan 16 14 103.6×10¹⁶
29 Hamedan -------- -------- --------
30 Yazd 1 1 7.4×10¹⁶
31 Alborz -------- -------- --------
Total 191 147 1.087×10¹⁹
Table 3 shows the geothermal energy potential (kJ) in the Iranian provinces, which is the highest value for
West Azarbaijan.

Journal of Renewable Energy and Sustainable Development (RESD) Volume 4, Issue 1, June 2018 - ISSN 2356-8569 http://dx.doi.org/10.21622/RESD.2018.04.1.042
53 RESD © 2018 http://apc.aast.edu
REFERENCES
[1] M. Abedi , A. Afshar , V. Ardestani , G. Norouzi
and C. Lucas ."Application of various methods
for 2D inverse modeling of residual gravity
anomalies." Acta Geophysica, vol. 58, pp. 317-
336 2010, doi:10.2478/s11600-009-0053-2.
[2] A. Mollahosseini, S.A. Hosseini, M. Jabbari , A.
Figoliand A. Rahimpour. "Renewable energy
management and market in Iran: A holistic
review on current state and future demands."
Renewable and Sustainable Energy Reviews,
vol. 80, pp. 774–88, 2017,
doi:10.1016/j.rser.2017.05.236.
[3] A.A. Soltaniehand M. Rezaeian. "Nuclear and
renewable energy in Iran: Nuclear challenges
and opportunities." International Journal of
Hydrogen Energy, pp.2–6, 2016,
doi:10.1016/j.ijhydene.2017.02.075.
[4] S. Fathi and A.M. Lavasani. "A Review of
Renewable and Sustainable Energy Potential
and Assessment of Solar Projects in Iran."
Journal of Clean Energy Technologies,vol. 5,
pp.126–30, 2017,
doi:10.18178/JOCET.2017.5.2.356.
[5] A.H. Ghorashi and A. Rahimi. "Renewable and
non-renewable energy status in Iran: Art of
know-how and technology-gaps." Renewable
and Sustainable Energy Reviews, vol. 15, pp.
729–36, 2011, doi:10.1016/j.rser.2010.09.037.
[6] M.K. Dehkordi, H. Kohestani, H. Yadavar, R.
Roshandel and M. Karbasioun. Implementing
Conceptual Model Using Renewable Energies in
Rural Area of Iran. Information Processing in
Agriculture, vol. 4 , pp. 228-240. 2017,
doi:10.1016/j.inpa.2017.02.003.
[7] D. Khojasteh, D. Khojasteh, R. Kamali, A.
Beyene and G. Iglesias. "Assessment of
renewable energy resources in Iran with a focus
on wave and tidal energy." Renewable and
Sustainable Energy Reviews, vol,??, pp. 0-1,
2017, doi:10.1016/j.rser.2017.06.110.
[8] U. B. Akuru, I.E. Onukwube , I.O. Okoro and
E.S. Obe. "Towards 100% renewable energy in
Nigeria." Renewable and Sustainable Energy
Reviews , vol. 71, pp. 943-53, 2017,
doi:10.1016/j.rser.2016.12.123.
[9] G. Wynn. "Fossil fuel subsidies to fall further."
Available:http://energyandcarbon.com/cuts-
fossil-fuel-subsid [date, 2015].
[11] H. Kariminiya and F. Farhadi. "Simulation and
technical review of absorption chiller system
Single effect of lithium bromide water with solar
energy." Journal of Chemistry and Chemical
Engineering of Iran, vol. 33 pp. 53-64, 2014.
[12] M. Saki pour, A.K. Nejadian, S. Jou and S.A.A.
Jafarymosavy??. "Potential of solar energy use
and reducing greenhouse gases emissions in
Ahvaz." Jundishapur Journal of Health Sciences,
vol. 4, pp. 1-10, 2012.
[13] A. Mohammadi, S. Rafiee, A. Jafari, A. Keyhani ,
S.H. Mousavi-Avval and S. Nonhebel . "Energy
use efficiency and greenhouse gas emissions of
farming systems in north Iran." Renewable and
Sustainable Energy Reviews,vol. 30, pp. 724–33,
2014, doi:10.1016/j.rser.2013.11.012.
[14] Climate Disruption & Adaptation. Available
http://www.sustainablesanmateo.org/home/indica
tors/climate-disruption-adaptation/ ; [date, 2016].
[15] S. Mirmohamadsadeghi, K. Karimi, A. Zamani,
H. Amiri and I.S. Horváth . "Enhanced solid-state
biogas production from lignocellulosic biomass
by organosolv pretreatment." BioMed Research
International, vol. 2014, article ID 350414, 6
pages; doi:10.1155/2014/350414.
[16] Z. Farahani, S. Ahmadi and S. Dehyouri.
"Factors affecting the use of solar energy
technology in agriculture from the perspective of
Iranian agricultural experts." Journal title, vol.
10,pp. 581–5, 2015
[17] Iran. Available :https://energy.fanack.com/iran
[date, 2017].
"The application of solar energy in agricultural
systems." Renewable Energy and Sustainable
Development, vol. 3, pp. 234-40, 2017, doi:10.21622/resd.2017.03.2.234.
[10] M. Vahedi Torshizi and A. Hoseini Mighani.

Journal of Renewable Energy and Sustainable Development (RESD) Volume 4, Issue 1, June 2018 - ISSN 2356-8569 http://dx.doi.org/10.21622/RESD.2018.04.1.042
54 RESD © 2018 http://apc.aast.edu
[18] H.S. Fami , J. Ghasemi, R. Malekipoor, P.
Rashidi, S. Nazari and A. Mirzaee A.
"Renewable energy use in smallholder farming
systems: A case study in tafresh township of
Iran." Sustainability, vol. 2,pp. 702–16, 2010,
doi:10.3390/su2030702.
[19] A. Mostafaeipour and H. Abarghooei.
"Harnessing wind energy at Manjil area located
in north of Iran." Renewable and Sustainable
Energy Reviews, vol. 12, pp. 1758–66, 2008,
doi:10.1016/j.rser.2007.01.029.
[20] S.H. Kulkarni, T.R. Anil and R.D. Gowdar . Wind
Energy Development in India and a Methodology
for Evaluating Performance of Wind Farm
Clusters. Journal of Renewable Energy, vol. 201,
pp1-11, 2016.
[21] E. Bonamente, L. Pelliccia, M.C. Merico , S.
Rinaldi, A. Petrozzi and C. Centro . The
Multifunctional Environmental Energy Tower:
Carbon Footprint and Land Use Analysis of an
Integrated Renewable Energy Plant,
Sustainability, vol. 7, pp. 13564–84, 2015,
doi:10.3390/su71013564.
[22] N. Afsharzade, A. Papzan, M. Ashjaee, S.
Delangizan, S. van Passel and H. Azadi .
"Renewable energy development in rural areas
of Iran." Renewable and Sustainable Energy
Reviews, vol. 65, pp. 743–55, 2016,
doi:10.1016/j.rser.2016.07.042.
[23] J.W. Lundand T.L. Boyd. "Direct utilization of
geothermal energy 2015 worldwide review."
Geothermics, vol. 60, pp.66–93. 2016,
doi:10.1016/j.geothermics.2015.11.004.
[24] A. Ragnarsson. "Geothermal development in
Iceland," in Proceedings World Geothermal
Congress 2015, pp.19–25.
[25] Y. Noorollahi, H. Yousefi, R. Itoiand S. Ehara.
"Geothermal energy resources and development
in Iran." Renewable and Sustainable Energy
Reviews, vol. 13, pp.1127–32,
doi:10.1016/j.rser.2008.05.004.
[26] S. Porkhial and P. Yousefi. "Geothermal energy
in Iran Soheil." in World Geothermal Congress,
2015, pp. 25–9.
[27] Y. Noorollahi Y, R. Itoi, H. Fujii and T. Tanaka T.
Geothermal Resources Exploration and Wellsite
Selection with Environmental Consideration
Using GIS in Sablan Geothermal Area.
PROCEEDINGS, Thirty-Second Workshop on
Geothermal Reservoir Engineering, 2007.
[28] S. Björnsson. Geothermal development and
research in Iceland. place of publication,
publisher, 2012.
[29] I.B. Fridleifsson. "Geothermal energy for the
bene t of the people." Renewable and
Sustainable Energy Reviews, vol. 5, pp. 299–
312, 2001.
[30] U. Younas, B. Khan, S.M. Ali, C.M. Arshad, U.
Farid and K. Zeb, et al. "Pakistan geothermal
renewable energy potential for electric power
generation: A survey." Renewable and
Sustainable Energy Reviews, vol. 63, pp. 398–
413, 2016, doi:10.1016/j.rser.2016.04.038.
[31] P. Bayer, L. Rybach, P. Blum and R. Brauchler.
"Review on life cycle environmental effects of
geothermal power generation." Renewable and
Sustainable Energy Reviews, vol. 26, pp. 446–
63, 2013, doi:10.1016/j.rser.2013.05.039.
[32] R.S. Atlasonand R. Unnthorsson. "Calculations
of environmental benefits from using geothermal
energy must include the rebound effect."
Geothermics, vo. 66, pp. 151–5, 2017,
doi:10.1016/j.geothermics.2016.12.002.
[33] H. Ganjehsarabi, I. Dincerand A. Gungor .
"Exergy analysis and environmental impact
assessment of a geothermal power plant," in
Causes, Impacts and Solutions to Global
Warming, book section 2013, pp. 825–837,
doi:10.1007/978-1-4614-7588-0.
[34] J. Zhu, K. Hu, X. Lu, X. Huang, K. Liu and X. Wu.
"A review of geothermal energy resources,
development, and applications in China: Current
status and prospects." Energy, vol. 93, pp. 466–
83, 2015, doi:10.1016/j.energy.2015.08.098.
[35] "Geothermal energy history in Iran." Renewable
Energy and Energy Efficiency Organization.
Available:
http://www.satba.gov.ir/fa/geothermal/introandhis
t [date, 2017].

Journal of Renewable Energy and Sustainable Development (RESD) Volume 4, Issue 1, June 2018 - ISSN 2356-8569 http://dx.doi.org/10.21622/RESD.2018.04.1.042
55 RESD © 2018 http://apc.aast.edu
[36] Y. Noorollahiand H. Yousefi. "Preliminary
environmental impact assessment of a
geothermal project in Meshkinshahr, NW-Iran."
International Geothermal Conference, Reykjavik,
2011, pp.25–9.
[37] A. Saffarzadeh, S. Porkhialand M. Taghaddosi.
"Geothermal energy developments in Iran,"
Proceedings in World Geothermal Congress,
2010, pp. 25–9.
[38] "Iran builds Mideast’s first geothermal plant." The
Chamber of Commerce and Industry Brazil-Iran
2017. Available:
http://camiranbrasil.com.br/noticias/energia/ira-c
[date, 2017].
[39] A. Yousefi-Sahzabi, K. Sasaki, H. Yousefi, S.
Pirastehand Y. Sugai Y. "GIS aided prediction of
CO2 emission dispersion from geothermal
electricity production." Journal of Cleaner
Production, vol. 19, pp.1982–93, 2011,
doi:10.1016/j.jclepro.2011.06.009.
[40] W.F. Giggenbach. "Geothermal solute equilibria.
Derivation of Na-K-Mg-Ca geoindicators."
Geochimica et Cosmochimica Acta, vol. 52, pp.
2749–65, 1988, doi:10.1016/0016-
7037(88)90143-3.
[41] S. Porkhial, MM. Ghomshei and P. Yousefi.
"Geothermal energy in Iran," in Proceedings
World Geothermal Congress, 2010, pp. 25–9.
[42] S. Jalilinasrabady, R. Itoi, H. Fujii T. Tanaka.
"Energy and exergy analysis of Sabalan
geothermal power plant, IRAN," in Proceedings,
World Geothermal Congress, 2010, pp. 25–9.
[43] M. Mohammadzadeh-Moghaddam, B. Oskooi,
M. Mirzaei and S.J. Jouneghani. "Magnetic
studies for geothermal exploration in Mahallat,
Iran," Istanbul 2012 - International Geophysical
Conference and Oil & Gas Exhibition,
Society of Exploration Geophysicists and the
Chamber of Geophysical Engineers of Turkey,
2012, pp. 1–4, doi:10.1190/IST092012-001.62.


![CE-RESD/SBC - Neurocomputação na Estimativa do ...ce-resd.facom.ufms.br/sbrc/2001/020.pdfCantor [4], a Figura 2 ilustra a construção destes conjuntos, os quais obedecem as seguintes](https://static.fdocuments.net/doc/165x107/608f080bcc25cd714616111f/ce-resdsbc-neurocomputao-na-estimativa-do-ce-resdfacomufmsbrsbrc2001020pdf.jpg)