Journal of Pure and Applied Ultrasonics 38(1) 2016-29-04.pdfJournal of Pure and Applied Ultrasonics...
36
A Publication of Ultrasonics Society of India A Publication of Ultrasonics Society of India Journal of Pure and Applied ISSN 0256-4637 Website : www.ultrasonicsindia.org Ultrasonics VOLUME 38 NUMBER 1 JANUARY-MARCH 2016 Ultrasonics O C I S E T S Y C I O N F O I S N A D R I A T L U
Transcript of Journal of Pure and Applied Ultrasonics 38(1) 2016-29-04.pdfJournal of Pure and Applied Ultrasonics...

A Publication of Ultrasonics Society of IndiaA Publication of Ultrasonics Society of India
Journal of Pure and Applied
ISSN 0256-4637
Website : www.ultrasonicsindia.org
Ultrasonics
VOLUME 38 NUMBER 1 JANUARY-MARCH 2016
Ultrasonics
OCIS E TS YCI ON FO IS NA DR IAT LU

Journal of Pure and Applied Ultrasonics
Ultrasonic Lcr wave technique for residual stress measurements in carbon steel weld jointsfabricated by different weld pass sequences 1A. Joseph, Govind K. Sharma, B. Purnachandra Rao and K. Nataraj
Comparative study of gallic acid with ethanol and acetone at 298 K 10G.M. Jamankar, M.S. Deshapande and N.R. Pawar
Evaluation of thermo-acoustical parameters of strong electrolytes-metal sulphates in aqueousmedium at different temperatures 14Bidyadhar Swain, Rabindra N. Mishra and Upendra N. Dash
Mechanical and thermophysical properties of europium monochalcogenides 23Vyoma Bhalla, Devraj Singh, Giridhar Mishra and Meher Wan
New Members (List continued after 2008) 28
(Authors have stated that the papers have not been published elsewhere)
ISSN 0256−4637
VOLUME 38 JANUARY−MARCH 2016NUMBER 1
CONTENTS
Website : www.ultrasonicsindia.org
A Publication of — Ultrasonics Society of India

2 J. PURE APPL. ULTRASON., VOL. 36, NO. 1 (2014)
dfdfdfffdsdfdf
XXIst National Symposium on Ultrasonics
(NSU-2016)
08 – 10 November, 2016
Organised by
Department of Condensed Matter Physics and Materials Science,
S. N. Bose National Centre for Basic Sciences, Kolkata
&
Ultrasonics Society of India, New Delhi
Contact us
Prof. P. K. Mukhopadhyay
Convener
S. N. Bose National Centre for Basic Sciences
Block-JD, Sector III, Salt Lake City, Kolkata -700098
Email: [email protected], [email protected]
Telephone +91-33-2335 1313/0312/3057/3061/5705
Fax: +91-33-2335-3477
Prof. Barnana Pal
Co - Convener
Saha Institute of Nuclear Physics
Sector-1, Block-AF Bidhannagar, Kolkata-700064
Email: [email protected]
Telephone +91-2337-5345-49
Fax: +91-33-2337-4637
Important dates :
• Abstract submission- from 1st July, 2016 to 31st August, 2016
• Confirmation of abstract acceptance - 15th September, 2016
• Registration ends- 30th September, 2016
Dr. Alo Dutta
Treasurer
S. N. Bose National Centre for Basic Sciences
Block-JD, Sector-III, Salt Lake City, Kolkata-700098
Email: [email protected]
Telephone +91-33-2335 1313/0312/3057/3061/5705
Fax: +91-33-2335-3477
Ms. Debashree Bhattacharyya
Secretary
S. N. Bose National Centre for Basic Sciences
Block-JD, Sector-III, Salt Lake City, Kolkata-700098
Email: [email protected]
Telephone +91-33-2335 1313/0312/3057/3061/5705
Fax: +91-33-2335-3477

1A. JOSEPH et al., ULTRASONIC LCR
WAVE TECHNIQUE FOR RESIDUAL STRESS MEASUREMENTS
Ultrasonic Lcr wave technique for residual stress measurements in carbon steelweld joints fabricated by different weld pass sequences
A. Joseph1*, Govind K. Sharma1, B. Purnachandra Rao1 and K. Nataraj2
1Nondestructive Evaluation Division, Metallurgy and Materials Group,Indira Gandhi Centre for Atomic Research, Kalpakkam-603102.
2Department of Physics, National Institute of Technology, Trichy-620015, India*E-mail: [email protected]
Low carbon steel is the most commonly used material for various applications because its cost is relatively low.Different methods are employed to reduce residual stresses in carbon steel weld joints. Post weld heat treatment(PWHT) is the most commonly used method to relieve/reduce the residual stresses. Use of different sequentialweld passes during welding is one of the alternate methods used to get minimum residual stresses in higher thicknessdouble 'V' carbon steel weld joints. A study was undertaken to nondestructively quantify the residual stressespresent in carbon steel weld joints made using three different weld pass sequences. For this study, three sets of 20.0mm thick low carbon steel double 'V' weld joints were fabricated with three different weld pass sequences using theManual Metal Arc Welding (MMAW) process. Ultrasonic based residual stress measurements offer estimation ofsurface, sub-surface and bulk residual stresses. Details of critically refracted longitudinal (Lcr) ultrasonic wavetechnique employed for residual stress measurements are discussed in this paper. The residual stress values ofcarbon steel weld joints obtained using the ultrasonic Lcr technique showed minimum longitudinal tensile residualstresses in the weld joints made by alternate weld pass sequence as compared to the other two weld pass sequences.The ultrasonic Lcr technique used is nondestructive, portable and low cost technique for residual stress measurements.This technique can also be used for in-situ measurement of residual stresses in operating components.
Keywords: Residual stress, ultrasonic technique, carbon steel, sequential welding passes
IntroductionResidual stresses are the stresses that exist within a
material without application of an external load. Theyare sometimes called as internal stresses or locked-instresses. Their magnitudes are within the elastic limit ofthe material. Residual stresses can be tensile as well ascompressive in nature. Generally, presence of tensileresidual stresses in components is detrimental to theintegrity of component1 as they tend to open a crack.Knowledge of residual stresses allows one to accuratelyestimate the safety factor and remaining useful life of acomponent in fabricated condition and in service,respectively2. Since, fatigue cracks and stress corrosioncracks always initiate on surface, it is often acceptedthat evaluation of surface/sub surface residual stressesshould be adequate to assess the resistance to fatigue
and stress corrosion cracking3-5. Various nondestructiveand destructive techniques are employed to measure theresidual stresses and their profiles in weld joints6-11.
Ultrasonics based residual stress determinationtechnique is governed by the theory of acoustoelasticityi.e. the stress dependence of ultrasonic velocity12-14.Experimental findings predicted that out of all thecombinations of ultrasonic wave propagation directionand stress field direction, longitudinal waves propagatingparallel to the stress field are the most sensitive to changein stress and least affected by texture15-16. Criticallyrefracted longitudinal (Lcr) wave travels at the surface/subsurface of the material. As the wave propagates, itdegenerates fast into the material and at times, it is alsoreferred to as surface skimming bulk longitudinal waves17-19. Hence, the receiver probe must be placed atappropriate distance from the transmitter probe to receivethe Lcr wave signals. This Lcr wave travels on the surface
J. Pure Appl. Ultrason. 38 (2016) pp. 1-9
A. Joseph is Life Member of USI.

2 J. PURE APPL. ULTRASON., VOL. 38, NO. 1 (2016)
and subsurface, so it carries the stress information of afew millimeters thick at a few MHz frequencies.Therefore, Lcr wave technique is an excellent techniquefor quantitative evaluation of longitudinal stress on thesurface and sub surfaces of the weld joints9, 16-19.
Low carbon steel is the most commonly used steelbecause its cost is relatively low while it providesmaterial properties that are acceptable for many structuralapplications. Manual Metal Arc welding (MMAW)processes is widely used for welding carbon steelcomponents. Different methods are employed to reduceresidual stresses in welded structures20-24. The commonmethods used for residual stress relieving are (i) Postweld heat treatment (annealing), (ii) Vibration, (iii)Mechanical, (iv) Shot peening and (v) Ultrasonics etc.Post weld heat treatment (PWHT) is most commonlyused method to relive/reduce the residual stresses.However, PWHT can be detrimental for certain steels.Detrimental effects of PWHT include scaling, loss offinish, distortion, temper embrittlement, over-softening,sensitization and reheat cracking, which mean thatcontrol of heating and cooling rates, holding temperaturetolerances and the times at holding temperature areextremely important, and must be carefully controlledin order to realise the full benefit of the PWHT process.The extent of relaxation of the residual stresses depends
on the material type and composition, the temperatureof PWHT and the soaking time at that temperature. Theother methods (vibration, shot peening and ultrasonicsetc.) are rarely used for residual stress relieving. Use ofdifferent sequential weld passes during welding is analternate method to get minimum residual stresses inhigher thickness double V weld joints. In this paper,details of a ultrasonic Lcr technique used for residualmeasurements in carbon steel weld joints fabricated bysequential welding pass sequence are discussed. Thisstudy will be useful to select a particular weld passsequence by which minimum residual stresses aregenerated in low carbon steel weld joints.
Fabrication of low carbon steel weld joints using threesequential welding passes
Low carbon steel plates of 20 mm thickness wereselected for the study. Surface grinding was carried outon top and bottom surfaces of the plates to remove scaleand rust to obtain same surface finish. The plates wereannealed to remove the stresses present before weldingand to have similar grain sizes in all the plates. Three setof 20 mm thick low carbon steel double 'V' weld jointswere fabricated with three different weld pass sequencesusing the Manual Metal Arc Welding (MMAW) process
Fig. 1 (a-c) Details of different weld pass sequences employed during the welding of carbon steel plates are shown for threedifferent welded plates (Plate A, Plate B and Plate C), respectively.
Table 1 – Chemical composition of the low carbon steel plates.
Element C Mn Si Cr Ni V P S Fe
Wt. % 0.15 1.46 0.34 <0.30 <0.30 <0.004 0.015 0.021 Bal.
(a)
(b)
(c)

3A. JOSEPH et al., ULTRASONIC LCR
WAVE TECHNIQUE FOR RESIDUAL STRESS MEASUREMENTS
with 7018 type electrodes. The chemical composition ofthe low carbon steel plates used for making the weldjoints is given in Table 1 and the details of the weld passsequences employed during welding are given in theFig. 1. Totally 8 weld passes were used in each weldjoint. In the first set of double V weld joint (Plate A), theweld passes were alternatively made on both the sides.In the second set of double V weld joint (Plate B), fourpasses were made on one side and then four passes weremade on the other side. In the third set (Plate C), rootpasses were made alternatively on both the sides andthen two filling passes were made alternatively on boththe sides and then final filling passes were madealternatively on both sides. Same weld parameters (i.e.voltage, current and welding speed etc.) were used duringwelding and only the weld pass sequence was varied.The weld parameters used in the welding are given inTable 2. The photographs of the three carbon steel weldjoints fabricated by sequential weld passes are given inFig. 2. The carbon steel weld joints were used for thestudy in as welded condition and weld bead crown wasnot flushed out. Grinding of weld crown may alter theresidual stress values and hence the weld joints wereused in as welded condition. The parent metals of all theweld joints have similar microstructures.
Theory of AcoustoelasticityThe theory of acoustoelasticity defines relation
between changes in velocity of ultrasonic waves in amedium with the changes in stress12. It was firstdeveloped by Hughes and Kelly, by using theMurnaghan's 'Theory of finite deformation of elasticsolids'25. Change in acoustic wave velocity with respectto change in stress is a non-linear property of the materialwhich could be explained by second and third orderelastic constants in hyper elastic stress-strain model25.Hughes and Kelly derived the expression of velocity withchange in stress12. Bray and Tang9 used ratio of velocitychange due to stress (∆V)/V0 vs. applied stress plot toestimate the acoustoelastic constant (AEC), where (∆V= V–V0); V and V0 are ultrasonic velocities of thematerial with stress and annealed conditions respectively.However, the estimation of precise ultrasonic velocityand the ratio ∆V/V is rather indirect and at times moreerror prone. Apart from the theory of acoustoelasticity,it has been pointed out by Palanichamy et al.7 that themeasurement of transit time is straight forward and lesserror prone for the measurement of residual stresses inweld joints.
For a given fixed path length, the acoustoelasticconstant can be defined in terms of transit time
t = t0 + Bσ (or) B = (t – t0)/σ ... (1)
where 't' is the measured ultrasonic transit time atdifferent loading conditions, t0 is the transit timemeasured under no load condition, B is the AEC definedin terms of transit time and σ is the applied or residualstress present in the material. Thus, the estimation ofAEC i.e. 'B' becomes simpler through above equation.In general, 't' is continuously measured with appliedstress (within the elastic limit of the material under stress)and then transit time ('t') vs. applied stress (σ) graph isplotted. The slope of the graph gives the value of AECof the material under test.
Fig. 2 Photographs of the three carbon steel weld joints (Plate A, Plate B and Plate C) fabricated by different sequential weldingpasses
Table 2 – Details of the weld parameters used
Weld parameter Details
Base material Low carbon steelBase material plate size (mm) 200.0 × 150.0 × 20.0Weld geometry Double 'V' butt jointElectrode used and size E-7018, 3.15 mm dia.Polarity and weld position Reverse and 1 GType of welding process SMAWOpen circuit voltage 96.8 VWelding current and Voltage 90 - 95 A and 22 - 25 VWelding speed 95 - 98 mm/min.

4 J. PURE APPL. ULTRASON., VOL. 38, NO. 1 (2016)
Ultrasonic Lcr Probe Design
Ultrasonic Lcr probe has been designed to generate Lcrwaves in the material7, 8. The incident angle of theultrasonic waves produced by the transducer elementshould be introduced to the material at the first criticalangle, by providing a specially fabricated 'Perspexwedge'. At first critical angle, the transmitted longitudinalwave is refracted by 90° to the normal and the wavetraverses on the surface and subsurface of a fewmillimeters thick. This surface skimming longitudinalwave is less sensitive to texture effects and mostsensitive to the stress field. First critical angle for carbonsteel and Perspex combination can be determined bySnell's law:
sin i/sin r = Vp/Vs ... (2)
where 'i' is the angle of incidence of wave in the Perspex,'r' is the angle of refracted longitudinal wave, Vp and Vsare the longitudinal wave velocity in Perspex and Steel,respectively. Longitudinal wave velocity in perspex andsteel are taken from literature as 2730 ms–1 and 5900ms–1, respectively. Thus the first critical angle for Perspexand Steel combination is found to be ~28°.
Lcr wave generally traverses in the surface andsubsurface regions up to 3 mm depth for certain distanceand later it degenerates into bulk waves. Lcr wavegeneration and propagation in the material isschematically shown in Fig. 3. Two separate ultrasonicLcr wave probes were arranged in tandem mode ona steel plate and their effectiveness in sending andreceiving the Lcr wave amplitude was found. Based onthis, the Lcr wave propagation path in the low carbonsteel was fixed as 61 mm approximately. Receiver probewas designed similar to the transmitter probe to detect
the Lcr waves generated by the transmitter probe.Transmitter and receiver probes (10 mm diameter) bothare placed opposite to each other and assembled in ahousing by separating them with an appropriate distanceof 61 mm between them. Two probe arrangements(sender-receiver) in the molded form as a single assemblyis used to maintain constant distance between the probesand it had improved the accuracy and repeatability inthe measurements. The 2 MHz Lcr probe assembly thusfabricated is shown in Fig. 4 and its approximate physicaldimension is 88 mm (long) × 30 mm (height) × 10 mm(width).
Fig. 4 Photographs of two probe ultrasonic Lcr wave assembly
(88 mm × 30 mm × 10 mm)
Fig. 3 Schematic diagram of Lcr wave generation principle.
Acoustoelastic constant (AEC) determination
AEC value is different for different metals. It isdetermined by performing tensile testing and ultrasonictime of flight measurements. Standard tensile specimenof low carbon steel with 6 mm thickness and 110 mmgauge length was used. Figure 5 shows the standardtensile specimen with Lcr wave probe under tensiletesting setup. The tensile specimen was mounted in aUniversal tensile testing machine, with the probe tiedby elastic rubber band. Enough care was taken to removeany air gap between the transducer and the tensilespecimen so that proper Lcr wave transmission isachieved. The tensile load was increased and at regularstress levels the ultrasonic signal was collected by asystem comprising of ultrasonic pulser/receiver and a 5GHz Digital Oscilloscope interfaced with a PC. Uptoyield strength (300 MPa) of the low carbon steel, the

5A. JOSEPH et al., ULTRASONIC LCR
WAVE TECHNIQUE FOR RESIDUAL STRESS MEASUREMENTS
region. At each location transit time measurements werecarried out 5 times and the average value is taken forcalculation. The measurement of transit time differenceis estimated by cross correlation of the trigger pulse withthe Lcr signal. Thus, transit times of Lcr waves at variousgrid lines were measured and these measurements wererepeated for all the other welded plates and the transittime profile was recorded against the distance from theweld center. In this study, we had tried to measure verysmall change in the residual stresses due to change inthe sequence of weld passes. The two probe assemblyavoided unwanted errors in the transit time measurementsand small variations in the values of residual stressescould be determined.
Results and discussion
The values of transit time 't0' were obtained for eachcarbon steel plate before welding. After welding theplates, transit time 't' values were obtained at eachlocation on the weld joints. Transit time difference (t0–t), which is the indirect measure of the residual stress,varied from one place to another on the welded plates.The positive and negative deviation in transit time fromt0 indicates the existence of tensile and compressiveresidual stresses, respectively. AEC for low carbon steelis determined by the tensile testing and it is found to be
Fig. 6 The Lcr wave transit time difference with respect to
zero stress condition showed linear behavior withapplied stress.
Fig. 5 Ultrasonic Lcr wave probe assembly mounted to the
tensile testing specimen for acquisition of signal fordetermination of AEC constant.
tensile load was applied and ultrasonic signals werecollected and transit time measurements weremade with the resolution of 0.2 ns with an overallaccuracy of +/-1 ns. Transit times measured were plottedagainst stress and a straight line fit was made [Fig. 6].The slope of the line gives the AEC and is found to be0.098 ns/MPa as shown in Fig. 6. The AEC determinedin the study is probe dependent. As long as this probeonly is being used for the carbon steels this AEC valueis applicable.
Transit time measurements on the low carbon steelweld joints
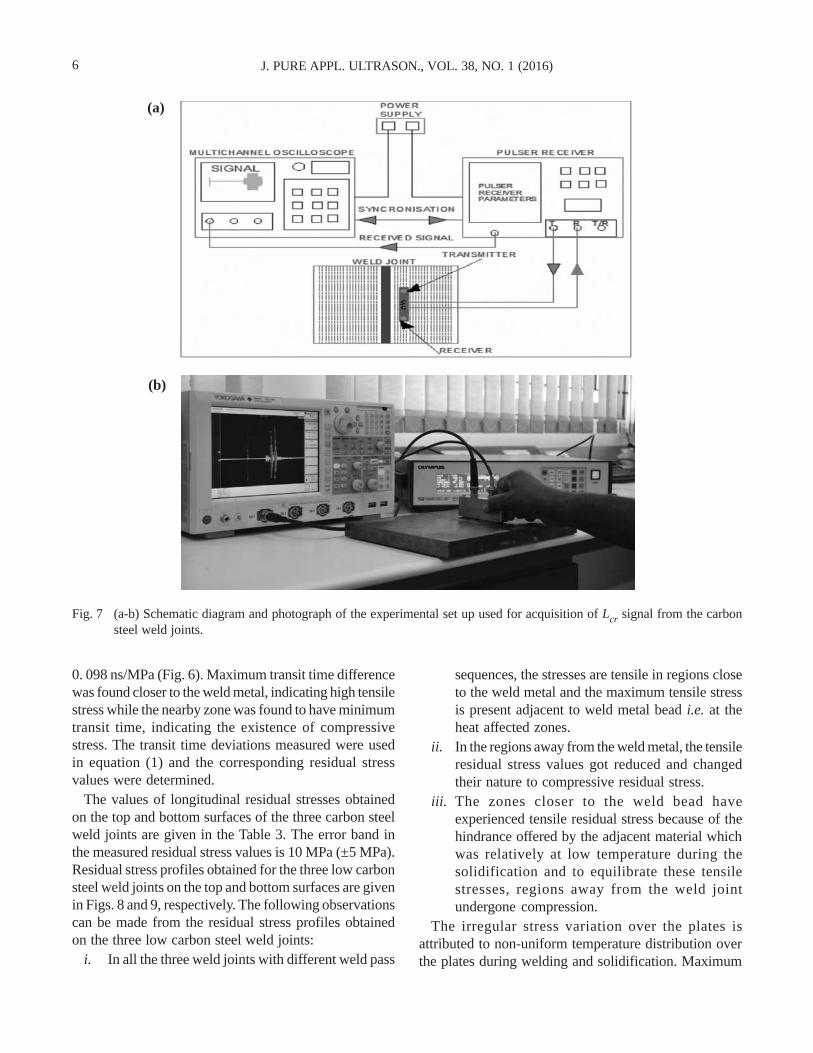
To measure the residual stress on the low carbonsteel weld joints, grid lines were marked on the plates atboth the sides of weld (heat affectd zones and parentmetal regions) with regular intervals of 5 mm. Since,longitudinal stress was selected for analysis, Lcr probewas placed on the grid lines along the weld directionand ultrasonic signals were stored in data files. Thetypical data acquisition set up (schematic diagram andphotograph) is shown in Fig. 7. The carbon steel weldjoints were used in as welded condition and weld crownswere not flushed out. The surface on the weld crownregion was not uniform and hence ultrasonic transit timemeasurements could not be made on the weld metal
6 J. PURE APPL. ULTRASON., VOL. 38, NO. 1 (2016)
Fig. 7 (a-b) Schematic diagram and photograph of the experimental set up used for acquisition of Lcr signal from the carbonsteel weld joints.
0. 098 ns/MPa (Fig. 6). Maximum transit time differencewas found closer to the weld metal, indicating high tensilestress while the nearby zone was found to have minimumtransit time, indicating the existence of compressivestress. The transit time deviations measured were usedin equation (1) and the corresponding residual stressvalues were determined.
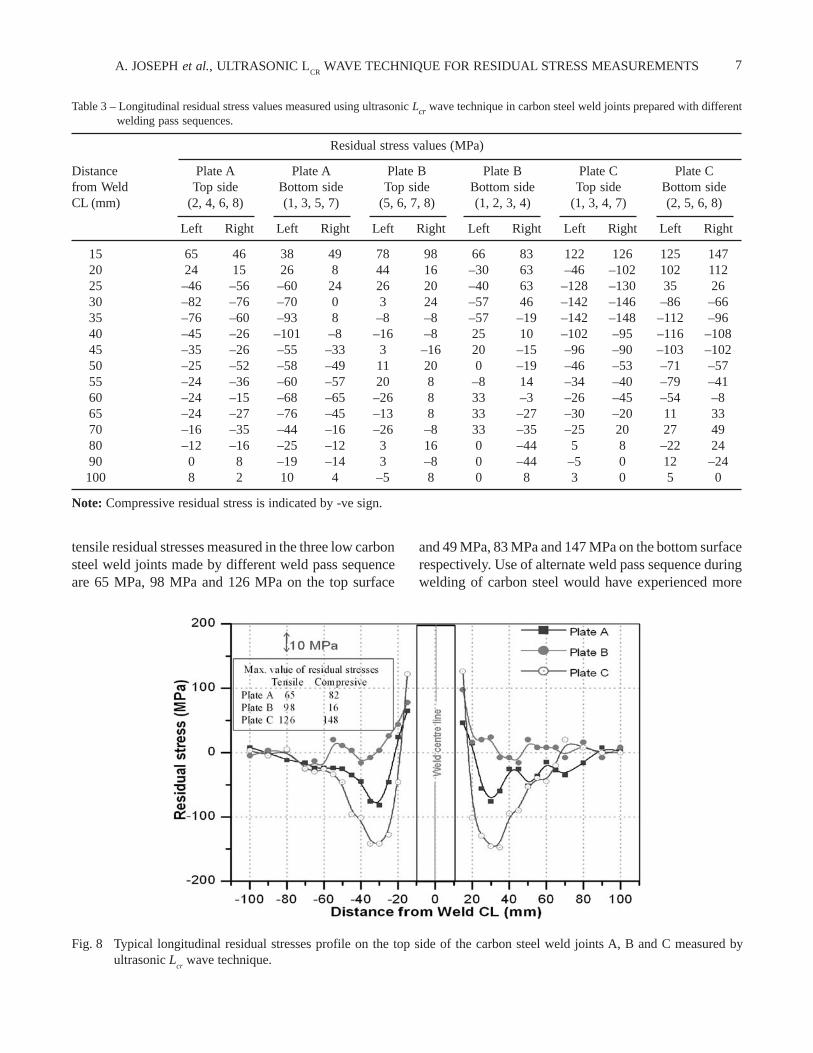
The values of longitudinal residual stresses obtainedon the top and bottom surfaces of the three carbon steelweld joints are given in the Table 3. The error band inthe measured residual stress values is 10 MPa (±5 MPa).Residual stress profiles obtained for the three low carbonsteel weld joints on the top and bottom surfaces are givenin Figs. 8 and 9, respectively. The following observationscan be made from the residual stress profiles obtainedon the three low carbon steel weld joints:
i. In all the three weld joints with different weld pass
sequences, the stresses are tensile in regions closeto the weld metal and the maximum tensile stressis present adjacent to weld metal bead i.e. at theheat affected zones.
ii. In the regions away from the weld metal, the tensileresidual stress values got reduced and changedtheir nature to compressive residual stress.
iii. The zones closer to the weld bead haveexperienced tensile residual stress because of thehindrance offered by the adjacent material whichwas relatively at low temperature during thesolidification and to equilibrate these tensilestresses, regions away from the weld jointundergone compression.
The irregular stress variation over the plates isattributed to non-uniform temperature distribution overthe plates during welding and solidification. Maximum
(a)
(b)
7A. JOSEPH et al., ULTRASONIC LCR
WAVE TECHNIQUE FOR RESIDUAL STRESS MEASUREMENTS
Table 3 – Longitudinal residual stress values measured using ultrasonic Lcr wave technique in carbon steel weld joints prepared with differentwelding pass sequences.
Residual stress values (MPa)
Distance Plate A Plate A Plate B Plate B Plate C Plate Cfrom Weld Top side Bottom side Top side Bottom side Top side Bottom sideCL (mm) (2, 4, 6, 8) (1, 3, 5, 7) (5, 6, 7, 8) (1, 2, 3, 4) (1, 3, 4, 7) (2, 5, 6, 8)
Left Right Left Right Left Right Left Right Left Right Left Right
15 65 46 38 49 78 98 66 83 122 126 125 14720 24 15 26 8 44 16 –30 63 –46 –102 102 11225 –46 –56 –60 24 26 20 –40 63 –128 –130 35 2630 –82 –76 –70 0 3 24 –57 46 –142 –146 –86 –6635 –76 –60 –93 8 –8 –8 –57 –19 –142 –148 –112 –9640 –45 –26 –101 –8 –16 –8 25 10 –102 –95 –116 –10845 –35 –26 –55 –33 3 –16 20 –15 –96 –90 –103 –10250 –25 –52 –58 –49 11 20 0 –19 –46 –53 –71 –5755 –24 –36 –60 –57 20 8 –8 14 –34 –40 –79 –4160 –24 –15 –68 –65 –26 8 33 –3 –26 –45 –54 –865 –24 –27 –76 –45 –13 8 33 –27 –30 –20 11 3370 –16 –35 –44 –16 –26 –8 33 –35 –25 20 27 4980 –12 –16 –25 –12 3 16 0 –44 5 8 –22 2490 0 8 –19 –14 3 –8 0 –44 –5 0 12 –24100 8 2 10 4 –5 8 0 8 3 0 5 0
Note: Compressive residual stress is indicated by -ve sign.
Fig. 8 Typical longitudinal residual stresses profile on the top side of the carbon steel weld joints A, B and C measured byultrasonic L
cr wave technique.
tensile residual stresses measured in the three low carbonsteel weld joints made by different weld pass sequenceare 65 MPa, 98 MPa and 126 MPa on the top surface
and 49 MPa, 83 MPa and 147 MPa on the bottom surfacerespectively. Use of alternate weld pass sequence duringwelding of carbon steel would have experienced more

8 J. PURE APPL. ULTRASON., VOL. 38, NO. 1 (2016)
Fig. 9 Typical longitudinal residual stresses profile on the bottom side of the carbon steel weld joints A, B and C measured byultrasonic L
cr wave technique.
uniform heating and cooling and resulted in less valueof tensile residual stresses. Use of alternate weld passsequence will be useful to minimize the tensile residualstresses in the critical welded structures which, in turn,will increase its safety factor. Studies clearly establishthat Lcr technique can be used to verify the efficiency ofweld pass sequence towards minimizing the residualstresses in weld joints. The ultrasonic Lcr technique isnondestructive and also portable and it can be used inthe plant for insitu measurement of residual stresses.The cost involved for ultrasonic Lcr method of residualstress measurement is less when compare to hole drillingstrain gauge and other methods.
Conclusion
The residual stress values were obtained bynondestructive ultrasonic Lcr wave technique on threepairs of low carbon steel weld joints fabricated usingdifferent weld pass sequences. From the present study,it is concluded as follows:
i. Lower longitudinal tensile residual stresses arepresent in the weld joints made by alternate weldpass sequence (Plate A) when compared to the othertwo weld pass sequences (Plates B & C).
ii. It is recommended to use alternate weld passsequence during the welding of thick carbon steelcomponents to get minimum residual stress values.
iii. The ultrasonic based Lcr wave technique is capablefinding small variations in residual stress values andthe residual stress distribution patterns across thelow carbon steel weld joints due to different weldpass sequence employed during welding.
iv. The ultrasonic Lcr technique used is nondestructive,portable and low cost technique for residual stressmeasurements. This technique can also be used forin-situ measurement of residual stresses in operatingcomponents.
Acknowledgments
The authors wish to sincerely thank Dr. A. K. Bhaduri,Director, Metallurgy and Materials Group (MMG),IGCAR, Kalpakkam and Dr. T. Jayakumar, FormerDirector MMG, IGCAR for their support andencouragements towards this study.
References
1 Masubuchi K., Residual stress and distortion. ASMHandbook, Welding Brazing and Soldering, USA,(1993) 1094-1102.
2 Bate S.K., Green D. and Buttle D., Review of residualstress distribution in welded joints for the defectassessment of offshore structures, Offshore technologyreport, Sheffield, U.K. (ISBN 0-7176-2411-0), (1997).

9A. JOSEPH et al., ULTRASONIC LCR
WAVE TECHNIQUE FOR RESIDUAL STRESS MEASUREMENTS
3 Denko J.C., Effects of residual stresses on stresscorrosion cracking of austenitic stainless steel pipeweldments, Proc. of Inter. Conf., ed. Ruud CO, ASMinternational, Metals Park, Ohio, USA, (1991) 27-37.
4 Cheng X., Fisher J.W., Prask H.J., Gnaupel-HeraldT., Yen B.T. and Roy, S., Residual stress modification bypost-weld treatment and its beneficial effect on fatiguestrength of welded structures. Int. J. Fatigue 25 (2003)1259-1269.
5 Lam P.S., Cheng C., Chao Y.J., Sindelar R.L., StefekT.M. and Elder J.B., Stress corrosion cracking of carbonsteel weldments. In proceedings of ASME pressure vesselsand piping division conference, 71327, (2005) 1-9.
6 Lu J., Handbook of measurement of residual stresses,Society for experimental mechanics, Fairmont, USA,(1996).
7 Palanichamy P. and Vasudevan M., Ultrasonic techniquefor assessment of microstructures and residual stressesaustenitic stainless steels. J. Pure Appl. Ultrasonics, 32(2010) 101-108.
8 Qozam H., Hoblos J., Bourse G., Robin C., WalaszekH., Bouteille P. and Cherfaoui M., Ultrasonic stressmeasurement in welded component by using Lcr wavesanalysis of the microstructure effect', Material scienceforum, 524 (2006) 453-458.
9 Don E. Bray and Tang W., Evaluation of stress gradientin steel plates bars with the Lcr ultrasonic wave. Nucl Engand Des, 207 (2001) 231-240.
10 Joseph A., Palanichamy P., Rai S.K., Jayakumar T.and Baldev Raj, Non-destructive measurement of residualstresses in carbon steel weld joints. Sci and Technol ofweld and Joi, 6(3) (1998) 267-271.
11 Palanichamy P., Joseph A., Bhattachraya D.K. andBaldev Raj, Residual stresses and their evalua-tion inwelds. Welding engineering hand book, ed. S.Soundararajan, Radiant, India, 1 (1992) 269-29.
12 Hughes D.S. and Kelly J.L., Second-order elasticdeformation of solids. Phys. Rev., 92(5) (1953) 1145-1149.
13 Kudryavtsev Y., Kleiman J. and Gushcha O., Residualstress measurement in welded elements by ultrasonicmethod. IX Inter. congress on experimental mechanics,Florida, (2000) 954-957.
14 Kudryavtsev Y., Kleiman J. and Gushcha O., Ultrasonicmeasurement of residual stresses in welded railwaybridge. NDT Conference on structural materialstechnology, NJ, (2000) 213-218.
15 Kudryavtsev Y., Kleiman J., Gushcha O., Smilenko V.and Brodovy V., Ultrasonic technique and device forresidual stress measurement. Xth Inter. congress andexposition on experimental and applied mechanics,(2004) 1-7.
16 Don E. Bray, Tang W. and Grewal D.S., Ultrasonicstress evaluation in compressor rotor. J. Test. Eval. 25(5)(1997) 503-509.
17 Salamanco L. and Don E. Bray, Residual stressmeasurement in steel plates and welds using criticallyrefracted waves. Res. Nondestruct. Eval., 7(4) (1996) 169-184.
18 Joseph A., Palanichamy P. and Jayakumar T.,Evaluation of residual stresses in carbon steel weldjoints by ultrasonic Lcr wave technique. J. Nondestruct.Eval., Springer, 33(4) (2014) 1-7.
19 Javadi Y. and Hloch S., Employing the Lcr waves tomeasure longitudinal residual stresses in different depthsof a stainless steel welded plate. Adv. Mater. Sci. Eng.,(2013) 1-8.
20 Root J.H., Coleman C.E., Bowden J.W. and HayashiM., Residual stress reduction in steel and zirconiumweldments by heat treatments. Trans. Am. Soc. Mech.Eng., J. Pressure Vessel Technol., 119(2) (1997) 137-141.
21 ASM Metals Handbook, Residual stress reduction byshot peening, USA, (1983) 856-895.
22 Gnirss G., Vibration and vibratory stress relief: Historicaldevelopment, theory and practical application. Weldingin the World, 26(11/12) (1988) 4-8.
23 Shigeru A., Probabilistic evaluation of a method ofreduction of residual stress in welded structures usingvibration, Chem. Eng. Trans., 33 (2013) 1-6.
24 Josephson B.L., Stress redistribution during annealingof a multi-pass butt-welded pipe, J. Pressure VesselTechnol, 105(2) (1983) 165-170.
25 Murnaghan F.D., Finite deformation of elastic solids.John Wiley, New York. (1951).

10 J. PURE APPL. ULTRASON., VOL. 38, NO. 1 (2016)
Comparative study of gallic acid with ethanol and acetone at 298 K
G.M. Jamankar1*, M.S. Deshapande1 and N.R. Pawar2
1Department of Physics, Ananad Niketan College, Anandwan, Warora-445206, India2Arts, Commerce and Science College, Maregaon-445303, India
*E-mail: [email protected]
The density, viscosity and ultrasonic velocity have been measured for binary mixture of gallic acid with ethanoland acetone of fixed equal volumes of the components at temperatures of 298 K. The experimental data have beenused to calculate some acoustic and thermodynamic parameters like adiabatic compressibility, free length, acousticimpedance, relaxation time and internal pressure. From the properties of the acoustical parameters, the nature andthe strength of interactions in these binary systems are discussed. Increase in velocity and decrease in adiabaticcompressibility shows strong association and interaction in the constituents' molecules. Some possible reasons onthe increase or decrease of acoustic and thermodynamic parameters with temperature change are presented.
Keywords: Gallic acid, adiabatic compressibility, viscosity, free length, internal pressure.
IntroductionThe ultrasonic studies are extensively used to estimate
the thermodynamic properties and to predict theintermolecular interactions of binary mixtures. Ultrasonicinvestigation of liquid mixture have significantimportance in understanding intermolecular interactionbetween the component molecules as that finds applica-tion in several industrial and technological processes.
Derived parameters from ultrasonic velocity measure-ments provide qualitative information regarding the natureand strength of molecular interactions in liquid mixtures.
This has been studied for various binary and ternarymixtures with respect to variation in concentration ofthe liquids and temperatures1-2.
Hydrolysable tannin that contains several units of gallicor ellagic acid esterifies with glucoses-OH to producecomplex tannin compounds. At the center of a hydro-lysable tannin molecule, there is a carbohydrate (usuallyD-glucose). Hydrolysable tannins are hydrolyzed byweak acids or weak bases to produce carbohydrate andphenolic acids. Tannins are a natural organic materialthat can be the byproducts of nature's fermentationprocess. The hydroxyl groups of the carbohydrate arepartially or totally esterified with phenolic groups suchas gallic acid.
Materials and Methods
The liquid mixture of various concentrations in molefraction was prepared by taking AR grade chemicals.The study was carried out for the temperatures 298 K,303 K and 308 K and 313 K at fixed frequency 2 MHz.The temperature of the liquid mixture was kept constantwithin an accuracy of ±0.1 K by using thermostat. Theexperimental temperature was maintained constant bycirculating water with the help of thermostatic water bath.Viscosity measurements were taken using Ostwald'sviscometer with an accuracy of ±0.1 Nsm–2. The flow oftime was measured by a digital stop watch capable ofregistering time accurate to ±0.1 s. An average of threesets of flow of time for each solution was taken for thepurpose of calculation of viscosity. The density of thesolution was determined accurately using 10 ml specificgravity bottle and electronic balance and accuracy in thedensity measurement is ±1 × 10⁻⁵gm/cm3. An averageof triple measurements was taken into account4.
(i) Adiabatic Compressibility (β)β = 1/U2.ρ
(ii) Intermolecular free length (Lf)Lf = KTβ1/2
where KT is the temperature dependent constantand 'β' is the adiabatic compressibility, U, theultrasonic velocity and ρ the density
J. Pure Appl. Ultrason. 38 (2016) pp. 10-13
M.S. Deshpande and N.R. Pawar are the Life Member of USI.

11G.M. JAMANKAR et al., COMPARATIVE STUDY OF GALLIC ACID WITH ETHANOL AND ACETONE
(iii) Internal Pressure (πi)πi = bRT (kη/U)1/2 (ρ2/3/Meff7/6)where, 'b' stands for cubic packing, which isassumed to be '2' for all liquids, 'k' is adimensionless constant independent oftemperature and nature of liquids. Its value is4.281 × 109 'T' is the absolute temperature inKelvin, 'Meff' is the effective molecular weight,'R' is the Universal gas constant, 'η' is theviscosity of solution in N.S.m–2, 'U' is theultrasonic velocity in m.s–1 and 'ρ' is the densityin kg.m–3 of solution.
(iv) Relaxation time (τ)τ = 4/3. (β.η)where 'β' is the adiabatic compressibility and'η' is the viscosity of the mixture.
(v) Viscosity measurementη2 = η1 (t2/t1) (ρ2/ρ1)where, η1 = Viscosity of water, η2 = Viscosity
Fig. 2 Density versus molar concentration
Fig. 1 Ultrasonic velocity versus molar concentration
Fig. 3 Viscosity versus molar concentration
Fig. 4 Adiabatic compressibility versus molar concentration
Fig. 5 Acoustic impedance versus molar concentration
of mixture, ρ1 = Density of water, ρ2 = Densityof mixture, t1 = Time of flow of water, t2 = Timeof flow of mixture5.

12 J. PURE APPL. ULTRASON., VOL. 38, NO. 1 (2016)
Results and discussionThe comparative study of experimental velocity at a
temperature 298 K for various concentrations is as shownin Fig. 1. It is observed that Gallic acid with acetone hashighest ultrasonic velocity as compared to gallic acidwith ethanol. The rise in velocity in acetone suggeststhat there may be the strong association of the componentin the medium. The variation of ultrasonic velocity canbe explained on the basis of nature of chemical bondingand their interaction between component molecules.
The density of gallic acid with ethanol is greater thanin acetone as shown in Fig. 2. In ethanol density isincreased so that number particles in a region of ethanolare more than acetone.
Viscosity decreases in gallic acid with acetone system,suggesting thereby more association between solute andsolvent molecules of gallic acid with ethanol6-9 as shownin Fig. 3.
Figure 4 shows that adiabatic compressibility increaseswith solute concentration for the systems. The decreaseof adiabatic compressibility with increasing concen-tration clearly indicates the presence of solute-solventinter-actions due to aggregation of solvent moleculesaround solute molecules. A strong intermolecular H-bonding interaction exists between gallic acid andacetone and ethanol. Relatively it is more in gallic acidand ethanol solution.
Acoustic impedance is more in acetone compared toethanol. Figure 5 shows that impedance trend in acetoneis more compare to ethanol. Ultrasonic velocity andacoustic impedance shows dip at 0.05 molar concentra-tions, whereas the adiabatic compressibility and freelength shows peak at corresponding concentration asshown in Figs. 5 and 7. This shows the complex formationand molecular dissociation. It also indicates weakeningof hydrogen bond at this molar concentration. Theincrease in Z with increase in concentrations of solutescan be explained in terms of inter and intra molecularinteractions between the molecules of liquid systems.This indicates significant interaction in liquid system.
It is observed that in Fig. 6 the relaxation time increaseswith increase in concentration of gallic acid with ethanoland decrease in acetone of solution. The variation ofrelaxation time is a collective effect of the density,viscosity and ultrasonic velocity10-11.
The intermolecular free length (Lf) also follows thesame trend as that of adiabatic compressibility; thedecrease in free length with increase in both the concen-tration reveals the presence of strong interaction as shown
Fig. 6 Relaxation time versus molar concentration
Fig. 7 Free length versus molar concentration
Fig. 8 Internal pressure versus molar concentration

13G.M. JAMANKAR et al., COMPARATIVE STUDY OF GALLIC ACID WITH ETHANOL AND ACETONE
in Fig. 7. It is more in ethanol as compared to acetone.Internal pressure values (πi) increases with increase in
both the concentrations. Internal pressure is greater inethanol solution as compared to acetone solution.
ConclusionThe nonlinear variation of ultrasonic velocity and other
thermo acoustical parameters with molar concentrationof gallic acid with ethanol and acetone shows theintermolecular interaction occurs in constituentmolecules. This provides useful information about thenature of intermolecular forces existing in the mixture.The observed complex formation in the binary liquidmixture may be due to the formation of hydrogen bondingand the tendency of solute-solvent interaction.
References
1 Md Nayeem S.K. and Krishna Rao D., UltrasonicInvestigations of Molecular Interaction in Binary Mixturesof Benzyl Benzoate with Isomers of Butanol Int JPResearch and Review, 3(2) (2014) 65-78.
2. Sivakumar V., Ravi Verma V., Rao P.G. andSwaminathan G., Studies on the use of power ultrasoundin solid liquid myrobalan extraction process. J CleanerProduction, 15 (2007) 1813-1818.
3. Kanhekar S.R., Panwar P.P. and Bichile G.K.Excess thermodynamic properties of mono and divalentelectrolytes solution with aqueous alanine at 303 K.Scholars R Lib Arch of Appl Sci Research, 4(6) (2012)2513-2524.
4. Pawar N.R. and Chimankar O.P., Comparativestudy of ultrasonic absorption and relaxation behaviorof polar solute and non-polar solvent J Pure ApplUltrason., 34 (2012) 49-52.
5. Ali A. and Nain A.K., Ultrasonic study of molecularinteraction in binary liquid mixtures at 30°C, PramanaJ Phys 58 (4) (2002) 695-701.
6. Nath G. Ultrasonic Study of Binary Mixture of Acetonewith Bromobenzene and Chlorobenzene at DifferentFrequencies, Chem Sci Trans., 1(3) (2012) 516-521.
7. Bebek K., Speed of ultrasound and thermo-dynamicproperties of 1-butanol in binary liquid mixture at293.15K. Mol and Quant Acoustics 26, (2005).
8. Sumathi T. and Varalakshmi M., Ultrasonic velocity,density,viscosity measurement of methionine in aqueouselectrolytic solution at 303 K. Ras J Che., 3(3) (2010)550-555.
9. Sunanda S. Aswale, Shashikant R. Aswale and AparnaB. Dhote, Relative association and free volume tostudy molecular interaction in dichlofenac sodiumin aqueous solution Eur J Appl Engineering andScientific Research, 1(2) (2012) 73-79.
10. Mehra R., Pancholi M. and Gaur A.K., Ultrasonic andthermodynamic studies in ternary liquid system oftoluene+1-dodecanol + cyclohexane at 298, 308 and318K Arch Appl Sci Research, 5(1) (2013) 124-133.
11. Pawar N.R., Ph.D thesis Summary on Investigation ofUltrasonic wave absorption in some Bio-liquids, J PureAppl Ultrason., 36 (2014) 69-70.

14 J. PURE APPL. ULTRASON., VOL. 38, NO. 1 (2016)
Evaluation of thermo-acoustical parameters of strong electrolytes-metal sulphates in aqueous medium at different temperatures
Bidyadhar Swain1*, Rabindra N. Mishra1 and Upendra N. Dash2
1P.G Department of Physics, Ravenshaw University, Cuttack, Odisha-753003, India2Plot No. 436, Chakeisihani, Bhubaneswar, Odisha-751010, India
*E-mail: [email protected]
Values of ultrasonic velocity (U), density (d) and viscosity (η) have been measured in aqueous solutions ofzinc sulphate and magnesium sulphate in different concentrations over the temperature range 298.15K to 313.15Kat 5K interval. The thermo-acoustical parameters, such as acoustic impedance (Z), isentropic compressibility (Ks),apparent isentropic compressibility (Ks, φ), intermolecular free length (Lf), relative association (RA), relaxation time(τ), Gibb's free energy change (∆G), solvation number (Sn), ultrasonic attenuation (α/f2), internal pressure (πi) andfree volume (Vf) have been computed to assess the ion-solvent and ion-ion interactions in these solutions. It is foundthat the ion-solvent and ion-ion interactions depend on concentration, temperature, ionic size, ionic field strengthand nature of the ion. The structural arrangement of molecules in electrolyte solutions has been discussed on thebasis of electrostatic field (ionic field) of ion. The qualitative intermolecular elastic forces between the solute andsolvent molecules are explained in terms of compressibility. The variation of solvation number with respect totemperature and concentration of electrolyte solution has been explained in the light of dipolar interaction betweensolute and solvent.
Keywords: Isentropic compressibility, internal pressure, solvation number, ultrasonic attenuation, free volume.
IntroductionUltrasonic wave is a non-destructive and mechanical
wave, which behaves like a powerful probe to investigatephysico-chemical properties of aqueous electrolytes1,2.The liquid state is an intermediate state between perfectdisorder of molecules in a gas and of perfect order ofmolecules as in a solid. To study the change from chaosto order, the liquid state of matter has attracted theattention of many researchers over the last several years.So, always it has posed a problem to researchers inarriving at a general conclusion regarding its state. Sinceultrasonic wave is a high frequency and low amplitudewave, due to its penetrating nature through liquidmedium, it is of interest to study its interaction withmatter to throw light into the molecular interaction andmolecular kinetic properties of the materials.
Ultrasonic velocity measurements have been exten-sively used to study the molecular interactions in
electrolyte solutions and to get significant informationon the arrangement of molecules in aqueous electrolytesolutions3-5. It is desirable that any discussion aboutthermo-acoustical and thermodynamic parametersof electrolytes is connected to ions as ions are playingvital role in an electrolyte solution. The effect ofconcentrations and temperatures of electrolyte solutionhelp understand ion-solvent (solvation) and ion-ion(electrostatic) interactions.
In the present investigation, we have studied variousthermo-acoustical parameters, such as acousticimpedance (Z), isentropic compressibility (Ks), apparentisentropic compressibility (Ks,φ ), intermolecular freelength (Lf ), relative association (RA), relaxation time (τ),Gibb's free energy change (∆G), solvation number (Sn),ultrasonic attenuation (α/f2), internal pressure (πi) andfree volume (Vf ) in different concentrations and atdifferent temperatures ranging from 298.15K to 313.15Kat 5 K interval to examine the ion-solvent and ion-ioninteractions in the aqueous solutions of ZnSO4 andMgSO4, which have wide applications in pharmaceutical,
J. Pure Appl. Ultrason. 38 (2016) pp. 14-22
Bidyadhar Swain is Life Member of USI.

15BIDYADHAR SWAIN et al., EVALUATION OF THERMO-ACOUSTICAL PARAMETERS
medicinal, agricultural, environmental, textile industry,leather industry, etc.
Materials and Methods
Zinc sulphate and magnesium sulphate used were ofGR or AR grades and dried over anhydrous CaCl2 indesiccator before use. All solutions were prepared in non-conducting water (Sp. cond. ~10–6 S.cm–1). The solutionswere prepared on the molal basis and conversion ofmolality to molarity was done by using standardexpression6 using the density data at the correspondingtemperature. The solute content of the solutions variedover a concentration range of 6.0×10⁻³M to 8.0×10⁻²Mfor all measurements.
Velocity measurement
Ultrasonic velocity measurements in the electrolytesolutions at different concentrations were made by usinga multi frequency ultrasonic interferometer operating ata frequency of 2 MHz at different temperatures rangingfrom 298.15 K to 313.15 K at 5 K intervals. Themeasuring cell of interferometer is a specially designeddouble-walled vessel with provision for temperatureconstancy. A constant temperature water bath with anaccuracy of ± 0.05 K was used to circulate water throughthe outer jacket of double-walled measuring cellcontaining the experimental solution. The cell wasallowed to equilibrate for 30 minutes prior to makingthe ultrasonic velocity measurements. The interferometerwas calibrated with water and the experimental value isin good agreement with literature value7. The precisionof the ultrasonic velocity measurements was within± 0.5 ms–1.
Density measurement
The densities of solutions were measured8 by relativemeasurement method using a specific gravity bottle (25ml capacity). At least five observations were taken andthe differences in any two readings did not exceed ±0.02%. Sufficient care was taken to avoid any entrapmentof air bubble.
Viscosity measurement
Viscosity measurements were made9 using an Ostwaldviscometer in a water thermostat whose temperature wascontrolled to ±0.05 K and efflux time was determined
using a digital stop clock with an accuracy of ±0.01 s.An average of three sets of flow times for each solutionwas taken for the calculation of viscosity. The values ofviscosity so obtained were accurate to within ± 0.3 ×10⁻³cP.
Theoretical Aspects
The experimentally measured values of ultrasonicvelocity (U), density (d) and viscosity (η) in aqueoussolutions of zinc sulphate and magnesium sulphate atdifferent temperatures have been used to compute thevalues of different parameters from the followingrelations10-15:
Acoustic impedance (Z) = Ud (1)
Isentropic compressibility (Ks) = 2
1
U d(2)
Apparent isentropic compressibility (Ks,φ)
= 1000 Ksc–1-Ks
0d0–1(1000c–1d–M) (3)
Intermolecular free length (Lf) = KT (Ks)½ (4)
Solvation number (Sn) = n1n2–1[1– KS/KS
o] (5)
Relative association (RA) =
13
0
0
Ud
d U⎛ ⎞× ⎜ ⎟⎝ ⎠
(6)
Relaxation time 2
4( )
3U d
ητ = (7)
Gibb's free energy change (∆G) = kBTln(kBTτ/h) (8)
Ultrasonic attenuation (α/f 2) = 4π 2τ /2U (9)
Internal pressure 2 713 62( ) ' ( / ) ( / )i effb RT K U d Mπ η= (10)
Free volume (Vf) = (MeffU/Kη)3/2 (11)
where Meff = Σmi xi is the effective molecular weight, miis the effective molecular weight of the individualconstituent, xi is the mole fraction of the individualconstituent, KT = (93.875 + 0.375T) × 10–8 is thetemperature dependent Jacobson's constant, M is themolecular mass of the solute, c is the molar concentration,do and d are densities of pure solvent and solution,respectively, U0 and U are the velocities of pure solventand solution, respectively, n1 and n2 are the number ofmoles of solvent and solute, respectively, KS and KS
o
are the isentropic compressibility of the solution andsolvent, respectively, b' is the cubic packing factor havingvalue '2' for all liquids, T is the temperature in Kelvin, αis the absorption co-efficient or attenuation co-efficientand 'f' is the frequency of ultrasonic wave (= 2MHz), kB

16 J. PURE APPL. ULTRASON., VOL. 38, NO. 1 (2016)
= 1.38 × 10⁻²³JK–1 (Boltzmann's constant), h = 6.626 ×10⁻³⁴ Js (Planck's constant), R=8.3143 JK–1mol–1
(Universal gas constant), K = 4.281×10⁹ is the dimension-less constant independent of temperature and nature ofliquid.
Results and discussionAs previously10, the sound velocity (U) increases with
concentration of aqueous solutions of zinc sulphate andmagnesium sulphate. It also increases with increasein temperature. Plots of ultrasonic velocity versusconcentration of these two electrolytes at differenttemperatures are shown in Fig. 1(a)-(b). As expected,the values of sound velocity in aqueous solutions of zincsulphate are higher than that of magnesium sulphatebecause of the higher mass of the former than the latter.The values of U were fitted to an equation of the form,
Fig. 1 Plot of ultrasonic velocity (U) vs c for aqueous (a) Zincsulphate (b) Magnesium sulphate.
Fig. 2 Plot of (U-U0)/c vs c1/2 for aqueous metal sulphates at
298.15K.
Table 1 – Values of constants, A', B' & C' of Eq. (12), A", B" & C" of Eq. (13), Ks0, φ (m3.mol–1.Pa–1), A"' & B"' of Eq. (14) for ZnSO4 and
MgSO4 in aqueous solution at 298.15K
Electrolytes 10A' 102B' 104C' 1013A" 1014B" 1017C" 1010Ks0,φ 1011A"' 1013B"'
ZnSO4 11.006 -10.497 -1.883 -8.339 7.528 -7.019 -10.133 8.755 -594.467
MgSO4 7.335 -6.147 -11.072 -5.709 4.667 51.445 -7.043 5.627 3.738
U = U0 + A'c + B'c3/2 + C'c2 (12)
where U0 is the sound velocity in water, c is the molarconcentration, and A', B' and C' are the empiricalconstants. These constants are given in Table 1. Thevariation of (U – U0)/c vs c1/2 are parabolic for lowerconcentration and decreases linearly for the higherconcentration in aqueous solutions of ZnSO4 and MgSO4at all temperatures agreeing fairly well with the Eq. (12).Typical plots are shown in Fig. 2 over the concentrationrange at 298.15K.
From Table 2, it is observed that the acoustic impe-dance (Z), which assesses the absorption of sound wavein a medium and determines the elastic behaviour(i.e., the bulk modulus of elasticity) of the mediumincreases with increase in concentration of electrolytes10.This is well agreeing with the theoretical requirementas density and ultrasonic velocity increase with increasein the concentration of electrolytes. The increase inZ values with concentration of electrolytes at all giventemperatures may be attributed to the effective solute-solvent interactions. The Z values also increase withincrease in temperature due to structural properties ofelectrolyte in the solution and there occurs a structuralrearrangement as a result of hydration (Solvation)leading to a comparatively more ordered state16,17.
ZnSO4
MgSO4
1
0.8
0.6
0.4
0.2
0
(U-U
0)c
(m4 .s
–1.m
ol–1
)
0 5 10
c1/2 (mol1/2.m–3/2)

17BIDYADHAR SWAIN et al., EVALUATION OF THERMO-ACOUSTICAL PARAMETERS
Therefore, ultrasound speed increases with increase intemperature and the resistance offered by the solution tothe sound velocity increases resulting in an increase inZ. The lower Z values of magnesium sulphate than thezinc sulphate in aqueous solution may be due to lowermolecular mass and low molecular association due tosmaller ion. The values of isentropic compressibility, Ksas calculated by Eq. (2) were fitted to an equation of theform,
Ks = Ks0 + A"c + B"c3/2 + C"c2 (13)
where A", B" and C" are constants and Ks0 is the
isentropic compressibility of water. The values of theconstants A", B" and C" are given in Table 1 for theaqueous solutions of ZnSO4 and MgSO4 at 298.15 K.Typical plots of (Ks – Ks
0)/c vs c1/2 are shown in Fig. 3.As observed, the value of Ks decreases with increase
in concentration of the solute at all temperatures. Thereason is that, when an electrolyte (solute) dissolves inwater (solvent) some of the surrounding solventmolecules are closely attached to the ions due to theinfluence of electrostatic field of the ions. Since thesolvent molecules are oriented in the ionic field(electrostatic field), the solvent molecules are morecompactly packed in the primary solvation shell ascompared to the compactness in the absence of the ions.
Thus, the electrostatic field of the ion causes compactnessof the medium due to ion-solvent interaction giving riseto a phenomenon called electrostriction. The interstitialspaces of water are occupied by the solute moleculesmaking the medium harder to compress, i.e., providinggreater electrostriction. The medium does not respondto further application of pressure. So, the compressibility
Table 2 – Values of Z (kg.m–2s–1), Ks (m2N–1) and Ks,φ (m3.mol–1.Pa–1) of aqueous electrolytes at different temperatures.
Con. Z × 10–3 Ks × 1010 Ks,φ × 1010
c × 10–3
(mol. m–3) Temperature (K)
298.15 303.15 308.15 313.15 298.15 303.15 308.15 313.15 298.15 303.15 308.15 313.15
Zinc sulphate
0.006 1498.9 1507.7 1514.8 1520.9 4.448 4.390 4.340 4.298 -7.186 -6.994 -6.528 -6.3300.008 1502.6 1511.3 1518.1 1524.2 4.428 4.370 4.322 4.280 -8.075 -7.892 -7.259 -7.0750.009 1503.9 1513.3 1519.4 1525.8 4.421 4.362 4.316 4.272 -8.040 -8.272 -7.286 -7.3130.010 1505.5 1514.6 1521.7 1528.1 4.414 4.355 4.306 4.263 -8.170 -8.205 -7.855 -7.8650.030 1512.3 1521.6 1528.2 1534.9 4.388 4.329 4.283 4.239 -4.061 -4.088 -3.837 -3.8990.050 1521.7 1529.9 1537.4 1544.2 4.349 4.295 4.246 4.200 -3.536 -3.396 -3.336 -3.3590.080 1533.1 1542.0 1549.8 1555.9 4.303 4.247 4.198 4.157 -3.028 -2.971 -2.944 -2.902
Magnesium sulphate
0.006 1496.0 1505.1 1512.5 1518.5 4.462 4.403 4.353 4.310 -4.265 -4.434 -4.315 -4.1500.008 1499.6 1508.7 1516.1 1522.2 4.443 4.384 4.334 4.291 -5.895 -5.971 -5.838 -5.6770.009 1500.9 1510.0 1517.4 1523.8 4.436 4.377 4.327 4.284 -6.106 -6.157 -6.026 -6.0730.010 1502.2 1511.3 1518.8 1525.4 4.429 4.370 4.320 4.276 -6.273 -6.313 -6.174 -6.3880.030 1506.8 1516.2 1524.0 1531.0 4.410 4.351 4.300 4.255 -2.990 -3.034 -3.048 -3.1650.050 1515.2 1524.1 1532.1 1539.5 4.374 4.317 4.266 4.218 -2.775 -2.733 -2.751 -2.8490.080 1525.4 1533.8 1542.4 1548.5 4.330 4.275 4.224 4.183 -2.469 -2.398 -2.432 -2.395
Fig. 3 Plot of (Ks-K
s0)/c vs c1/2 for aqueous metal sulphates at
298.15K.
ZnSO4
MgSO4
0
–1
–2
–3
–4
–5
–6
–7
–8
1013
(Ks–
Ks0 )
/c (
m5 .m
ol–1
.N–1
)
0 5 10
c1/2 (mol1/2.m–3/2)
18 J. PURE APPL. ULTRASON., VOL. 38, NO. 1 (2016)
and internal pressure increase. Hence, isentropic com-pressibility as well as internal pressure describes themolecular arrangement in the electrolyte solutions10.Also the values of Ks decrease with increase intemperature for all concentrations of aqueous ZnSO4 andMgSO4 solutions due to the fact that, with increase intemperature, the compression of the medium becomesmore prominent, resulting a decrease in Ks values. Asobserved, the isentropic compressibility value of aqueousZnSO4 solution is less than that of aqueous MgSO4solution at all concentrations and temperatures due tothe higher molecular mass, and hence, due to moreelectrostriction shown by the former than the latter.
The values of apparent molar isentropic compressi-bility, Ks, φ computed by means of Eq. (3) were fittedinto Eq. (14)
Ks,φ = Ks0, φ + A"'c1/2 + B"'c (14)
to obtain Ks0, φ, the limiting apparent molar isentropic
compressibility, A"' and B"' are constants, and aregiven in Table 1. As observed the values of apparentisentropic compressibility (Ks, φ) initially decrease(forlower concentrations) and then increase(for higherconcentrations) with increase in concentration of thesolutions. The negative values of Ks, φ and Ks
0, φ are dueto loss of compressibility of surrounding solventmolecules because of strong electrostrictive forces in the
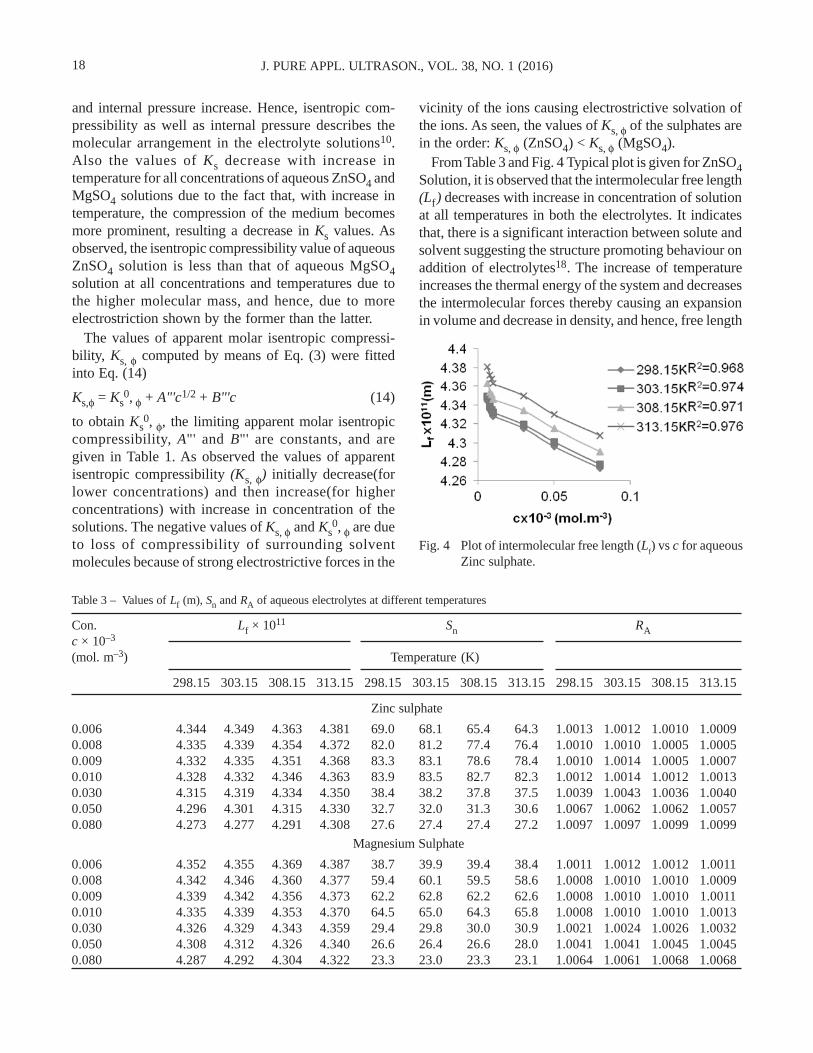
vicinity of the ions causing electrostrictive solvation ofthe ions. As seen, the values of Ks, φ of the sulphates arein the order: Ks, φ (ZnSO4) < Ks, φ (MgSO4).
From Table 3 and Fig. 4 Typical plot is given for ZnSO4Solution, it is observed that the intermolecular free length(Lf) decreases with increase in concentration of solutionat all temperatures in both the electrolytes. It indicatesthat, there is a significant interaction between solute andsolvent suggesting the structure promoting behaviour onaddition of electrolytes18. The increase of temperatureincreases the thermal energy of the system and decreasesthe intermolecular forces thereby causing an expansionin volume and decrease in density, and hence, free length
Table 3 – Values of Lf (m), Sn and RA of aqueous electrolytes at different temperatures
Con. Lf × 1011 Sn RAc × 10–3
(mol. m–3) Temperature (K)
298.15 303.15 308.15 313.15 298.15 303.15 308.15 313.15 298.15 303.15 308.15 313.15
Zinc sulphate
0.006 4.344 4.349 4.363 4.381 69.0 68.1 65.4 64.3 1.0013 1.0012 1.0010 1.00090.008 4.335 4.339 4.354 4.372 82.0 81.2 77.4 76.4 1.0010 1.0010 1.0005 1.00050.009 4.332 4.335 4.351 4.368 83.3 83.1 78.6 78.4 1.0010 1.0014 1.0005 1.00070.010 4.328 4.332 4.346 4.363 83.9 83.5 82.7 82.3 1.0012 1.0014 1.0012 1.00130.030 4.315 4.319 4.334 4.350 38.4 38.2 37.8 37.5 1.0039 1.0043 1.0036 1.00400.050 4.296 4.301 4.315 4.330 32.7 32.0 31.3 30.6 1.0067 1.0062 1.0062 1.00570.080 4.273 4.277 4.291 4.308 27.6 27.4 27.4 27.2 1.0097 1.0097 1.0099 1.0099
Magnesium Sulphate
0.006 4.352 4.355 4.369 4.387 38.7 39.9 39.4 38.4 1.0011 1.0012 1.0012 1.00110.008 4.342 4.346 4.360 4.377 59.4 60.1 59.5 58.6 1.0008 1.0010 1.0010 1.00090.009 4.339 4.342 4.356 4.373 62.2 62.8 62.2 62.6 1.0008 1.0010 1.0010 1.00110.010 4.335 4.339 4.353 4.370 64.5 65.0 64.3 65.8 1.0008 1.0010 1.0010 1.00130.030 4.326 4.329 4.343 4.359 29.4 29.8 30.0 30.9 1.0021 1.0024 1.0026 1.00320.050 4.308 4.312 4.326 4.340 26.6 26.4 26.6 28.0 1.0041 1.0041 1.0045 1.00450.080 4.287 4.292 4.304 4.322 23.3 23.0 23.3 23.1 1.0064 1.0061 1.0068 1.0068
Fig. 4 Plot of intermolecular free length (Lf) vs c for aqueous
Zinc sulphate.

19BIDYADHAR SWAIN et al., EVALUATION OF THERMO-ACOUSTICAL PARAMETERS
increases. Therefore, intermolecular free length increaseswith increase in temperatures. The intermolecular freelength of aqueous ZnSO4 is less than that of aqueousMgSO4 due to the less isentropic compressibility valueof former than the latter.
The number of solvent molecules surrounded the soluteand taking part in the formation of primary shell withthe central ion is termed as solvation number19. In thepresent investigation, it is observed that the solvationnumber (Sn) computed for two electrolytes is positive inaqueous medium at all the experimental temperaturesindicating the appreciable solvation of solute or structureforming tendency of the solute. The solvation numberincreases with increase in concentration and attainsmaximum value at specific concentration at allexperimental temperatures indicating increased dipolarinteraction between solute and water molecules20. Themaximum value of solvation number at specificconcentration indicates stronger ion-solvent interaction.Further, it starts to decrease with increase in concentra-tion suggesting increased ion-ion interaction. Theresultant values of the Sn depend upon solute-solventand solute-solute interaction occurring in the solution21,
22. With rise in temperature, the Sn values decrease inaqueous ZnSO4 solution but reverse is the case inaqueous MgSO4 solution.
Typical plots of Sn versus c are shown in Fig. 5.The relative association (RA) is another important
property23 of the electrolyte solution which can bestudied to understand the ion-ion or ion-solventinteractions. It is influenced by two factors: (i) breaking
up of the associated solvent molecules on addition ofthe solute and (ii) the solvation of solute molecules. Theformer leads to a decrease and the latter to an increaseof relative association. In the present study, RA increaseswith increase in concentration of solution24 due to thedecrease in intermolecular free length and also increasesin electrostatic interaction for both the electrolytesolutions. It suggests that the solvation of the sulphatesalt predominate over the breaking-up of the solventstructure. As observed from Fig. 6 (Typical plot is givenfor MgSO4 solution), RA values of both the sulphatesincrease linearly with concentration for all experimentaltemperatures. At very dilute solution the decrease is dueto breaking up of the solvent on addition of metalsulphates. But, it varies irregularly with increase intemperatures.
Relaxation time (τ) is directly proportional to co-efficient of viscosity and inversely proportional to theisentropic compressibility of solutions. From Table 4, itis clear that, relaxation time increases with increase inconcentration of electrolyte suggesting the rearrange-ment of molecules due to co-operation process andreinforcement of H-bonds25. Further the rise intemperature weakens the H-bonds due to thermalvibration, and structure breaking effect predominatesover H-bond formation causing decrease in τ in both theelectrolyte solutions26.
The value of ∆G increases with increase in con-centration of both the electrolytes suggesting shorter timefor rearrangement of molecules. But, it decreases withincrease in temperature as given in Table 4 due to increasein kinetic energy of the molecules by thermal energy andtakes longer time for rearrangement of molecules for a
Fig. 5 Plot of solvation number (Sn) vs c for aqueous metal
sulphates at 298.15K.
ZnSO4
MgSO4
100
80
60
40
20
0
S n
0 5 10
c × 10–3 (mol.m–3)
298.15K
303.15K
308.15K
313.15K
1.012
1.01
1.008
1.006
1.004
1.002
1
RA
0 5 10c × 10–3 (mol.m–3)
Fig. 6 Plot of relative association (RA) vs c for aqueous
Magnesium sulphate.

20 J. PURE APPL. ULTRASON., VOL. 38, NO. 1 (2016)
Table 5 – Values of πi (Nm–2) and Vf (m3.mol–1) of aqueous electrolytes at different temperatures.
Con. πi × 10–6 Vf × 107
c × 10–3
(mol. m–3) Temperature (K)
298.15 303.15 308.15 313.15 298.15 303.15 308.15 313.15
Zinc sulphate
0.006 2748.68 2630.94 2519.06 2408.44 0.18024 0.21542 0.25679 0.307180.008 2751.75 2631.40 2528.03 2411.10 0.17969 0.21537 0.25403 0.306110.009 2755.23 2639.17 2530.53 2426.96 0.17903 0.21368 0.25331 0.300320.010 2757.54 2647.76 2537.48 2432.57 0.17867 0.21164 0.25158 0.298660.030 2780.41 2655.65 2542.38 2436.98 0.17441 0.20994 0.25015 0.297220.050 2779.98 2654.53 2556.40 2441.87 0.17475 0.21018 0.24632 0.295360.080 2786.71 2669.92 2554.28 2450.60 0.17345 0.20669 0.24718 0.29263
Magnesium sulphate0.006 2741.15 2629.50 2519.38 2399.34 0.18159 0.21570 0.25671 0.310710.008 2743.02 2630.20 2525.55 2398.93 0.18130 0.21562 0.25494 0.311000.009 2752.62 2635.77 2529.89 2420.51 0.17945 0.21430 0.25369 0.302950.010 2754.74 2642.94 2534.21 2423.75 0.17907 0.21261 0.25245 0.301930.030 2753.93 2642.92 2536.83 2425.56 0.17911 0.21254 0.25170 0.301420.050 2757.92 2644.04 2540.51 2426.80 0.17864 0.21250 0.25095 0.301120.080 2770.30 2649.83 2538.08 2432.71 0.17637 0.21112 0.25184 0.29901
Table 4 – Values of τ (s), ∆G (kJ.mol–1) and α/f2 (Np.s2m–1) of aqueous electrolytes at different temperatures.
Con. τ × 1013 ∆G × 1020 α/f2 1015
c × 10–3
(mol. m–3) Temperature (K)
298.15 303.15 308.15 313.15 298.15 303.15 308.15 313.15 298.15 303.15 308.15 313.15
Zinc sulphate
0.006 5.450 4.811 4.259 3.765 0.5016 0.4648 0.4276 0.3882 7.174 6.287 5.529 4.8580.008 5.450 4.802 4.282 3.766 0.5016 0.4640 0.4300 0.3884 7.159 6.262 5.547 4.8510.009 5.459 4.821 4.287 3.811 0.5023 0.4657 0.4304 0.3935 7.166 6.283 5.550 4.9050.010 5.461 4.849 4.301 3.820 0.5025 0.4681 0.4317 0.3945 7.165 6.315 5.564 4.9130.030 5.540 4.866 4.311 3.826 0.5084 0.4696 0.4328 0.3952 7.259 6.329 5.571 4.9150.050 5.515 4.850 4.342 3.830 0.5065 0.4682 0.4358 0.3956 7.206 6.292 5.596 4.9040.080 5.524 4.887 4.316 3.841 0.5072 0.4714 0.4332 0.3969 7.195 6.319 5.544 4.906
Magnesium sulphate
0.006 5.432 4.814 4.266 3.741 0.5003 0.4651 0.4283 0.3854 7.160 6.299 5.544 4.8340.008 5.426 4.805 4.276 3.730 0.4998 0.4643 0.4293 0.3842 7.137 6.274 5.547 4.8110.009 5.459 4.821 4.287 3.792 0.5023 0.4656 0.4304 0.3914 7.176 6.291 5.557 4.8880.010 5.462 4.842 4.297 3.797 0.5025 0.4675 0.4314 0.3919 7.176 6.315 5.568 4.8910.030 5.456 4.838 4.300 3.796 0.5021 0.4671 0.4317 0.3917 7.158 6.301 5.564 4.8820.050 5.447 4.823 4.294 3.785 0.5014 0.4659 0.4311 0.3905 7.127 6.265 5.542 4.8520.080 5.473 4.828 4.269 3.792 0.5034 0.4663 0.4286 0.3913 7.138 6.251 5.491 4.849
given concentration27.Ultrasonic attenuation (α/f2) is a measure of spatial
rate of decrease in the intensity level of the ultrasonicwave and attenuation co-efficient (α) is characteristic of
the medium which depends upon the external conditionslike temperature, pressure and frequency of themeasurement. When temperature increases, the valuesof ultrasonic attenuation decrease. The decrease in
21BIDYADHAR SWAIN et al., EVALUATION OF THERMO-ACOUSTICAL PARAMETERS
isentropic compressibility or increase in velocity ofultrasonic wave indicates that the wave is less attenuatedin both the electrolyte solutions. But, it changesirregularly with increase in concentration at alltemperatures in both the electrolytes.
The free volume (Vf ) is the effective volume accessibleto the centre of a molecule in a liquid. The structure of aliquid is determined by strong repulsive forces in theliquid with the relatively weak attractive forces providingthe internal pressure which held the liquid moleculestogether. The free volume seems to be conditional byrepulsive forces whereas the internal pressure is moresensitive to attractive forces. These two factors togetheruniquely determine the entropy of the system. Thus, theinternal pressure, free volume and temperature seem tobe the thermodynamic variables that describe the liquidsystem of fixed composition10. From Table 5, it isobserved that free volume (Vf ) decreases with increasein concentration of electrolyte and internal pressure (πi)changes in a manner opposite to that of free volume inall experimental temperatures. The decrease of Vf (orincrease of πi) at a given temperature indicates theformation of hard and/or tight solvation layer around theion28,29 due to more ion-solvent interaction. Withincrease in temperature, thermal energy of the moleculesincrease, hence available free volume (Vf ) increases (orπi decreases).
ConclusionThe results of the present study reveal that specific
ion-ion and ion-solvent interactions play an importantrole for explaining the different thermo-acousticalparameters of strong electrolytes in aqueous medium atfour different temperatures 298.15K, 303.15K, 308.15Kand 313.15K. These interactions result in attractive forceswhich promote the structure forming tendency. It is alsonoticed that the strength of molecular interaction weakenswith rise of temperature which may be due to weakintermolecular forces and thermal energy of the system.However any deviation from the usual behaviour isprobably due to characteristic structural changes in thesystem.
AcknowledgementsThe authors thankfully acknowledge the support and
facilities provided by the management of DRIEMS,Tangi, Cuttack, India to carry out the research work inthe institution.
References
1 Johnson I. and Murthy R.S., Evaluation of physico-chemical parameters of EB + DMSO + DMFA using anacoustic method, Acoust. Lett., 24 (2001) 210-217.
2 Osamu K., Carl J.H. and George C.B., Ultrasonicvelocities, compressibilities and heat capacities for binarymixtures of benzene, cyclohexane and tetrachloromethaneat 298.15K, J. Chem. Thermodyn., 10 (1978) 721-730.
3 Ranga Nayakulu S.V., Reddy C.S. and Reddy D.L.,Ultrasonic studies of the binary mixtures of ethyle acetateand cresols-application of Kosower and Dimrothtreatments, Mat. Chem. Phys., 90 (2005) 213-220.
4 Kannappan V. and Jayasanthi R., Ultrasonic studiesof isomeric butylalcohol in aqueous solutions, IndianJ. Pure Appl. Phys., 43 (2005) 167-171.
5 Rabichandan S. and Ramanatham K., Ultrasonicinvestigations of MnSO4, NiSO4 and CuSO4 in aqueouspolyvinyl alcohol solution at 303K, Rasayan J. Chem.,3 (2010) 375-384.
6 Robinson R.A. and Stokes R.H., Electrolyte Solutions,Butterworth's Scientific publication, London, (1955) 30.
7 Jahagirdar B.V., Arbad B.R., Patil C.S. andShankarwer A.G., Studies in acoustic properties, partialmolar volumes, viscosity, B-coefficients of lithiumchloride in aqueous medium at five temperatures, IndianJ. Pure Appl Phys., 38 (2000) 645-650.
8 Swain B., Mishra R.N. and Dash U.N., Volumetricstudy of strong electrolytes-Metal chlorides and metalsulphates in aqueous medium at different temperatures,J. Chem. Pharm. Res., 7 (2015) 140-144.
9 Swain B., Mishra R.N. and Dash U.N., Viscometric andthermodynamic studies on strong electrolytes-Metalchlorides and metal sulphates in aqueous medium atdifferent temperatures, Int. J. Chem. Phy Sci., 4 (2015)66-76.
10 Moharatha D., Talukdar M., Roy G.S. and Dash U.N.,Evaluation of acoustic parameters of halides of alkalimetals and Ammonium in aqueous and aqueous Dextransolutions at 298.15K, Researcher, 3 (2011) 6-12.
11 Harned H.S. and Owan B.B., The Physical Chemistryof Electrolyte Solution, 3rd edition, Reinhold, New York,(1958) 358.
12 Palani R. and Balakrishnan S., Acoustical properties ofternary mixtures of 1-alkanols in di-isopropyl ether and2, 2, 2-trifluoroethanol mixed solvent, Indian J. Pure Appl.Phys., 48 (2010) 644-650.
22 J. PURE APPL. ULTRASON., VOL. 38, NO. 1 (2016)
13 Dash U.N., Roy G.S. and Mohanty S., Evaluation ofthermoacoustic parameters of potassium ferro- andferricyanides in water + alcohol mixtures, Ultrasci., 15(1)(2005).
14 Jacobson B., Ultrsonic study in liquids and liquidmixtures, Chem. Phys., 6 (1952) 927.
15 Das S. and Dash U.N., Evaluation of thermo-acousticand non-linearity parameter (B/A) of Glycine, α-alanine,β-alanine and phenyl Alanine in D-fructose solutions at298.15K, Int. J. Pharm. Sci. Rev. Res., 21 (2013) 212-220.
16 Singh G. and Banipal T.S., Partial molar adiabaticcompressibilities and viscosities of some amino acids inaqueous glycerol solutions at 298.15K, Indian J. Chem.,47A (2008) 1355.
17 Palani R. and Jayachitra K., Ultrasonic study ofternary electrolytic mixtures at 303, 308 and 313K,Indian J. Pure Appl Phys., 46 (2008) 251.
18 Kanhekar S.R., Pravina P. and Govind K.B.,Thermodynamic properties of electrolytes in aqueoussolutions of glycine at different temperatures, Indian J.Pure Appl. Phys., 48 (2010) 95-99.
19 Kannappan A.N. and Arumeyam Y., Viscosity B-Coefficient and solvation number of sodium chloride,sodium formate and sodium acetate in DMF-Watermixtures, Trans. SAEST, 39 (2004) 51-53.
20 Thirumaran S. and Inbam P., Thermodynamic andtransport studies on some basic amino acids in aqueoussodium acetate solutions at different temperatures, IndianJ. Pure Appl. Phys., 49 (2011) 451-459.
21 Ali A., Hyder S. and Nain A.K., Intermolecular and ion-solvent interaction of sodium iodide and potassium iodide
in dimethyl formamide + I-propanol mixtures at 303K,J. Pure Appl. Ultrason., 21 (1999) 127-131.
22 Kagathara V.M., Sanariya M.R. and Parsania P.H.,Sound velocity and molecular interaction studies onchloroepoxy resins solutions at 30°C, Eur. Polym. J., 36(2000) 2371-2374.
23 Eyring H. and Kincaid J.F., Free volume and freeangle ratio of molecules in liquid, J. Chem. Phys., 6 (1938)620.
24 Jahagirdar B.V., Arbad B.R., Walvekar A.A.,Shankarwer A.G. and Lande M., Studies in partialmolar volumes, partial molar compressibilities andviscosity B-coefficients of caffeine in water at fourtemperatures, J. mol. liq., 85 (2000) 361-373.
25 Ali A., Hyder S. and Nain A.K., Intermolecularinteractions in ternary liquid mixtures by ultrasonicvelocity measurements, Ind. J. Phys. B, 74 (2000) 63.
26 Wadekar M.P., Thermo acoustical molecular interactionstudy of azomethine and its Fe(III) metal complex usingultrasonic technique, J. Chem. Pharm. Res., 5 (2013) 37-41.
27 Fort R.J. and Moore W.R., Adiabatic compressibilitiesof binary liquid mixtures, Trans. Faraday Soc., 61 (1965)2102-2111.
28 Syal V.K., Chauhan S. and Gautam R., Ultrasonicvelocity measurements of carbohydrates in binarymixtures of DMSO + H2O at 25°C, Ultrasonics, 36 (1998)619.
29 Singh S., Singh R., Prasan N. and Prakash S.,Compressibility free length and molar and availablevolume in ternary liquid systems, Indian J. Pure Appl.Phys., 3 (1977) 629.

23VYOMA BHALLA et al., MECHANICAL AND THERMOPHYSICAL PROPERTIES
Mechanical and thermophysical properties of europium monochalcogenides
Vyoma Bhalla1,2*, Devraj Singh1, Giridhar Mishra1 and Meher Wan3
1Department of Applied Physics, Amity School of Engineering and Technology,Bijwasan, New Delhi-110061, India
2Amity Institute of Applied Sciences, Amity University Uttar Pradesh, Noida-201313, India3Advanced Technology Development Center, Indian Institute of Technology,
Kharagpur-721302, India*E-mail: [email protected]
The ultrasonic properties of europium chalcogenides EuX (X = O, S and Te) have been computed at roomtemperature along <100>, <110> and <111> orientations. The higher order elastic constants have also been computedusing Coulomb and Born-Mayer potential upto second nearest neighbour and these are applied to compute ultrasonicproperties. The mechanical and thermal properties like Youngs modulus, bulk modulus, Cauchy's relation, Zeneranisotropy factor, fracture to toughness ratio, Debye temperature have also been calculated for finding the futureperformance of these materials. Since these materials follow the Born stability criteria, so these are mechanicallystable. The fracture to toughness ratio is less than 1.75, hence these are brittle in nature. The results of presentinvestigation have been analysed in correlation with mechanical and thermophysical properties of the similar materials.
Keywords: Monochalcogenides, elastic properties, thermal properties, ultrasonic properties.
Introduction
Ultrasonic studies have been applied as an importanttool for studying the microstructural features and inherentproperties of different rare-earth materials1-3. Thestructural inhomogeneities, dislocations, thermalconductivity, specific heat etc. are well connected withtemperature dependent ultrasonic parameters of the rare-earth materials. The properties of rare earth materialshave been studied extensively in literature4-5. Thepartially filled f-orbitals lead to the anomalous behaviourof rare earth materials6-7. Many theoretical andexperimental studies have been done on europiummonochalcogenides having B1-type crystal structure8-13.Higher order elastic constants, ultrasonic velocities andultrasonic attenuation for europium selenide (EuSe) havebeen already described in our previous paper8. Varshneyet al.9 computed elastic properties in EuX using aneffective interionic interaction potential taking intoconsideration the long-range Coulomb as well chargetransfer interactions. A study of high-pressure phasetransition and elastic properties of europium
monochalcogenides has been carried out by Dubey andSingh10. Farberovich and Vlasov11 have applied theaugmented plane wave method (APW) for theoreticalstudy of europium monochalcogenides. Söllinger et al.12
applied the classical Heisenberg model for Monte Carlostudy of europium monochalcogenides. The electronicstructure and magnetic properties of EuX by the fullpotential linear muffin-tin orbital method have beeninvestigated by Ghosh et al.13.
To the best of authors' knowledge, there is no evidencefor the ultrasonic study of europium monopnictides inliterature. The present paper deals with elastic, ultrasonicand thermal properties of EuX (X = O, S and Te). Thesecond and third order elastic constants of europiummonochalcogenides, EuX have been evaluated usingCoulomb and Born Mayer potential in the temperaturerange 100-300 K. The higher order elastic constants areapplied to compute the mechanical properties likeYoung's modulus, shear modulus, bulk modulus,Poisson's ratio, Breazeale's non linearity parameter.Debye temperature, thermal conductivity, thermalrelaxation time, ultrasonic attenuation and ultrasonicvelocities have been calculated for longitudinal and shear
J. Pure Appl. Ultrason. 38 (2016) pp. 23-27
Mrs. Vyoma Bhalla, Devraj Singh and Meher Wan are the LifeMembers of USI.
24 J. PURE APPL. ULTRASON., VOL. 38, NO. 1 (2016)
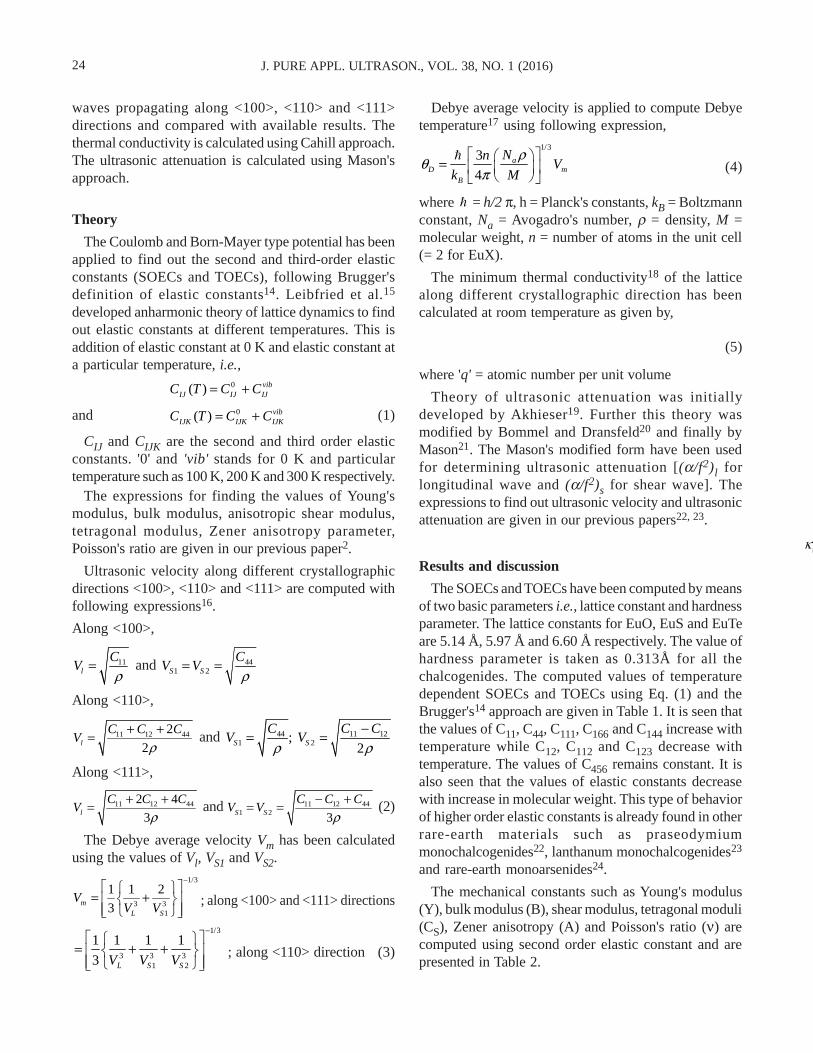
waves propagating along <100>, <110> and <111>directions and compared with available results. Thethermal conductivity is calculated using Cahill approach.The ultrasonic attenuation is calculated using Mason'sapproach.
Theory
The Coulomb and Born-Mayer type potential has beenapplied to find out the second and third-order elasticconstants (SOECs and TOECs), following Brugger'sdefinition of elastic constants14. Leibfried et al.15
developed anharmonic theory of lattice dynamics to findout elastic constants at different temperatures. This isaddition of elastic constant at 0 K and elastic constant ata particular temperature, i.e.,
0( ) = + vibIJ IJ IJC T C C
and 0( ) = + vibIJK IJK IJKC T C C (1)
CIJ and CIJK are the second and third order elasticconstants. '0' and 'vib' stands for 0 K and particulartemperature such as 100 K, 200 K and 300 K respectively.
The expressions for finding the values of Young'smodulus, bulk modulus, anisotropic shear modulus,tetragonal modulus, Zener anisotropy parameter,Poisson's ratio are given in our previous paper2.
Ultrasonic velocity along different crystallographicdirections <100>, <110> and <111> are computed withfollowing expressions16.
Along <100>,
11
ρ=l
CV and 44
1 2 ρ= =S S
CV V
Along <110>,
11 12 442
2ρ+ +
=l
C C CV and 44 11 12
1 2; 2ρ ρ−= =S S
C C CV V
Along <111>,
11 12 442 4
3ρ+ +=l
C C CV and 11 12 44
1 2 3ρ− += =S S
C C CV V (2)
The Debye average velocity Vm has been calculatedusing the values of Vl, VS1 and VS2.
1/3
3 31
1 1 2
3
−⎡ ⎤⎧ ⎫
= +⎢ ⎥⎨ ⎬⎢ ⎥⎩ ⎭⎣ ⎦
mL S
VV V
; along <100> and <111> directions
1/3
3 3 31 2
1 1 1 1
3
−⎡ ⎤⎧ ⎫
= + +⎢ ⎥⎨ ⎬⎢ ⎥⎩ ⎭⎣ ⎦L S SV V V
; along <110> direction (3)
Debye average velocity is applied to compute Debyetemperature17 using following expression,
1/33
4
ρθπ
⎡ ⎤⎛ ⎞= ⎢ ⎥⎜ ⎟⎝ ⎠⎣ ⎦
� aD m
B
NnV
k M(4)
where � = h/2 π, h = Planck's constants, kB = Boltzmannconstant, Na = Avogadro's number, ρ = density, M =molecular weight, n = number of atoms in the unit cell(= 2 for EuX).
The minimum thermal conductivity18 of the latticealong different crystallographic direction has beencalculated at room temperature as given by,
mκ
(5)
where 'q' = atomic number per unit volume
Theory of ultrasonic attenuation was initiallydeveloped by Akhieser19. Further this theory wasmodified by Bommel and Dransfeld20 and finally byMason21. The Mason's modified form have been usedfor determining ultrasonic attenuation [(α/f2)l forlongitudinal wave and (α/f2)s for shear wave]. Theexpressions to find out ultrasonic velocity and ultrasonicattenuation are given in our previous papers22, 23.
Results and discussion
The SOECs and TOECs have been computed by meansof two basic parameters i.e., lattice constant and hardnessparameter. The lattice constants for EuO, EuS and EuTeare 5.14 Å, 5.97 Å and 6.60 Å respectively. The value ofhardness parameter is taken as 0.313Å for all thechalcogenides. The computed values of temperaturedependent SOECs and TOECs using Eq. (1) and theBrugger's14 approach are given in Table 1. It is seen thatthe values of C11, C44, C111, C166 and C144 increase withtemperature while C12, C112 and C123 decrease withtemperature. The values of C456 remains constant. It isalso seen that the values of elastic constants decreasewith increase in molecular weight. This type of behaviorof higher order elastic constants is already found in otherrare-earth materials such as praseodymiummonochalcogenides22, lanthanum monochalcogenides23
and rare-earth monoarsenides24.
The mechanical constants such as Young's modulus(Y), bulk modulus (B), shear modulus, tetragonal moduli(CS), Zener anisotropy (A) and Poisson's ratio (ν) arecomputed using second order elastic constant and arepresented in Table 2.

25VYOMA BHALLA et al., MECHANICAL AND THERMOPHYSICAL PROPERTIES
central26. The value of Young's modulus is greater forEuO. Hence EuO is stiffer than EuS and EuTe.
The values of ultrasonic velocities for longitudinalmode (Vl), shear modes (VS1 and VS2), Debye averagevelocity (Vm) and Debye temperature (θD) are calculatedusing second order elastic constants values in Eqs. (2) -(4). The values of these parameters are given in Table 3.
It is seen that the ultrasonic velocities and Debyetemperature decrease from EuO to EuTe with increaseof their molecular weights. In the chosen materials, theultrasonic velocity along longitudinal mode is highestfor EuO along <100> direction and minimum for EuTealong <111> direction. This type of behavior has already
The Born criterion of stability25 is expressed as
B = (C11+2C12)/3>0, C44> 0, CS = (C11- C12)/2 > 0 (6)
It is obvious from Table 2 that the values of B, C44 andCS are greater than 1, so Born mechanical stabilitycriterion has been satisfied by these materials. Hencethese are stable substances. The ratio of B/G (fracture/toughness) is less than 1.75 as given in Table 2. Thus,europium monochalcogenides are brittle in nature. Thenature of bonding forces can be analysed from Poisson'sratio. For central forces, the value of Poisson's ratioshould lie in the range 0.25<ν<0.5. For materialsconsidered in the present study, the value does not fallin this range which means that the forces are non
Table 1 – SOECs and TOECs (1010 N/m2) of EuX in the temperature range 100K-300K.
Materials ECs→ SOECs TOECs
Temp. [K]↓ C11 C12 C44 C111 C112 C123 C144 C166 C456
EuO 100 5.80 2.16 2.26 -86.9 -8.95 3.07 3.61 -9.29 3.58200 5.98 2.12 2.27 -88.1 -8.76 2.94 3.62 -9.33 3.58300 6.19 2.09 2.28 -89.7 -8.60 2.81 3.63 -9.38 3.58
EuS 100 4.43 1.10 1.18 -72.5 -4.47 1.56 1.99 -4.78 1.97200 4.62 1.07 1.18 -74.0 -4.29 1.42 1.99 -4.80 1.97300 4.82 1.04 1.18 -75.7 -4.11 1.27 2.00 -4.83 1.97
EuTe 100 3.60 0.71 0.76 -62.6 -2.78 1.02 1.33 -3.04 1.32200 3.79 0.68 0.76 -64.3 -2.59 0.86 1.33 -3.06 1.32300 3.97 0.64 0.77 -66.0 -2.40 0.69 1.34 -3.08 1.32
Table 2 – Mechanical constants Y, BT, C44, CS and G and B/G, A and ν of EuX at room temperature.
Material Y BT G CS C44 B/G A ν(1010N/m2) (1010N/m2) (1010N/m2) (1010N/m2) (1010N/m2)
EuO 5.42 3.46 2.19 2.05 2.26 1.58 1.11 0.24EuS 3.55 2.30 1.43 1.89 1.18 1.61 0.63 0.24EuTe 2.63 1.75 1.05 1.66 0.77 1.67 0.46 0.25
Table 3 – Ultrasonic velocities Vl, VS, VD and θD of EuX.
Material Direction Vl VS1 VS2 Vm θD(103 m/s) (103 m/s) (103 m/s) (103 m/s) (K)
EuO <100> 2.75 1.67 1.67 1.84 213.58<110> 2.80 1.67 1.58 1.80 208.69<111> 2.82 1.61 1.61 1.79 207.45
EuS <100> 2.70 1.44 1.44 1.61 160.88<110> 2.68 1.44 1.82 1.75 174.94<111> 2.60 1.70 1.70 1.86 185.74
EuTe <100> 2.48 1.09 1.09 1.23 110.90<110> 2.18 1.09 1.60 1.39 125.58<111> 2.07 1.45 1.45 1.58 142.43

26 J. PURE APPL. ULTRASON., VOL. 38, NO. 1 (2016)
been proved for other rare-earth materials22-24.
The computed values of thermal relaxation time,thermal conductivity and ultrasonic attenuation alongdifferent crystallographic directions <100>, <110> and<111> in the temperature range 100K-300K are presentedin Table 4. Table 4 depicts the values of thermalconductivity computed using Eq. (5). It is found to behighest for EuO and lowest for EuTe. Thus, EuO havegreat potential application in high-temperatureconditions. The thermal relaxation time is of the orderof picoseconds. This indicates that these materials behavelike intermetallics27. It can also be observed that thevalues of relaxation time decreases as we go from <100>to <111>. The values of ultrasonic attenuation is foundlowest for EuO along <100> direction, where shear wavepolarised along <100> direction and highest along <111>direction where shear wave polarized along <110>direction. It is also observed that ultrasonic attenuationdue to p-p interaction for longitudinal wave is predo-minant over thermal loss. It clearly indicates that EuO ismore relevant than other monochalcogenides ofeuropium8.
ConclusionIn summary of the present results, we conclude thata. All the chosen materials are stable as they follow
Born stability criterion.b. Coulomb and Born-Mayer potential is applied
successfully to evaluate higher order elasticconstants for europium monochalcogenides.
c. Investigated materials are brittle in nature as theyhave ratio, fracture/toughness less than 1.75.
d. On the basis of picoseconds order of thermalrelaxation time for the chosen material we can saythat these materials are of intermetallic valence.
e. The minimum attenuation along <100> directionreveals that it is most suitable direction for theanisotropic study of these materials.
f. Ultrasonic attenuation for EuO is found minimum,so we may say that EuO is more suitable candidatefor futuristic applications.
The obtained results of present investigation will beuseful for their future performance and further studies.
AcknowledgementsWe owe special thanks to Dr. Ashok K. Chauhan,
Founder President, Amity Universe and Prof. B.P. Singh,Senior Director, ASET, Bijwasan for their inspirationand encouragements.
References
1 Singh D., Bhalla V., Kumar R. and Tripathi S.,Behaviour of acoustical phonons in CeAs in lowtemperature region, Indian J. Pure Appl. Phys., 53 (2015)169-174.
2 Bhalla V., Kumar R., Tripathy C. and Singh D.,Mechanical and thermal properties of praseodymiummonopnictides: An ultrasonic study, Int. J. Mod. Phys. B,27 (2013) 1350116 (28 pp.).
3 Singh D., Kumar R. and Pandey D.K., Temperature andorientation dependence of ultrasonic parameters inamericium monopnictides, Adv. Mat. Phys. Chem., 1(2011) 31-38.
4 Valtheeswaran G., Petit L., Svane A., Kanchana V. andRajagopalan M., Electronic structure of praseodymiummonopnictides and monochalco-genides under pressure,J. Phys.: Condensed Matter, 16 (2004) 4429-4440.
5 Coban C., Colakoglu K. and Ciftci Y.O., Firstprinciples predictions on mechanical and physical
Table 4 – Thermal conductivity (6min in W/mK), thermal relaxation time (τth in ps) and ultrasonic attenuation (α/f2 in 10–15Nps2/m) of EuX.
Material Direction 6min τth (α/f 2)l (α/f 2)s1 (α/f 2)s2 (α/f 2)th
EuO <100> 0.512 4.63 1.23 0.22 0.22 0.0051<110> 0.508 4.58 1.48 8.25 0.25 0.013<111> 0.507 4.37 1.49 3.63 3.63 0.010
EuS <100> 0.361 7.78 2.10 0.58 0.58 0.0047<110> 0.371 6.58 2.66 9.25 0.42 0.019<111> 0.375 5.83 2.33 4.63 4.63 0.020
EuTe <100> 0.238 2.52 4.37 1.56 1.56 0.0063<110> 0.251 1.96 6.01 16.30 0.95 0.0320<111> 0.256 1.53 4.59 7.92 7.92 0.0408
27VYOMA BHALLA et al., MECHANICAL AND THERMOPHYSICAL PROPERTIES
properties of HoX (X = As, P), Mat. Chem. Phys., 125(2011) 887-894.
6 Kasuya T., Haga Y., Kwon Y.S. and Suzuki T., Physicsin low carrier strong correlation systems, Physica B,186-188 (1993) 9-15.
7 Takahashi H. and Kasuya T., Anisotropic p-f mixingmechanism explaining anomalous magnetic propertiesin Ce monopnictides. I. Effective 4f level, J. Phys. C: SolidState Physics, 18 (1985) 2697-2708.
8 Singh D., Yadav R.R. and Tiwari, A.K., Ultrasonicattenuation in semiconductors, Indian J. Pure Appl. Phys.,40 (2002) 845-849.
9 Varshney D., Shriya S., Varshney M. and Khenata R.,Pressure dependent mechanical properties of europiummonochalcogenides under high pressure, Comput. Mat.Sc., 61 (2012) 158-179.
10 Dubey R. and Singh S., High pressure phase transitionand elastic behavior of europium monochalcogenides,J. Magn. Magn. Mat., 345 (2013) 266-275.
11 Farberovich O.V. and Vlasov S.V., APW Research ofeuropium monochalcogenides. I. band structures andelectron-electron interaction in ferromagnetic semi-conductors, Phys. Stat. Sol. (b), 105 (1981) 755-768.
12 Söllinger W., Heiss W., Lechner R.T., Rumpf K.,Granitzer P., Krenn H. and Springholz G., Exchangeinteractions in europium monochalco-genide magneticsemiconductors and their dependence on hydrostatic strain,Phys. Rev. B, 81 (2010) 155213 (15 pages).
13 Ghosh D.B., De M. and De S.K., Electronic structureand magneto-optical properties of magnetic semi-conductors: europium monochalcogenides, Phys. Rev.B, 70 (2004) 115211 (7 pages).
14 Brugger K., Thermodynamic definition of higher orderelastic coefficients, Phys. Rev., 133 (1964) A1611-A1612.
15 Leibfried G. and Haln H., Zurtemperatur-abhängigkeitder elastischenkonstanten von alkalihalogenidkristallen,Z. Phys., 150 (1958) 487-525.
16 Kittel C., Solid State Physics, 12th edition, Willey India,New Delhi, (2011).
17 Singh D., Kaushik S., Tripathi S., Bhalla V. and GuptaA.K., Temperature dependent elastic and ultrasonicproperties of berkelium monopnictides, Arab. J. Sci.Eng. 39 (2014) 485-494.
18 Bhalla V. and Singh D., Anisotropic assessment ofultrasonic wave velocity and thermal conductivity inErX (X: N, As), Indian J. Pure Appl. Phys., 53 (2016) 40-45.
19 Akhieser A., Absorption of sound in solids, J.Phys.(USSR), 1 (1939) 277-287.
20 Bommel H.E. and Dransfeld K., Excitation andattenuation of hypersonic waves in quartz, Phys. Rev.,117 (1960) 1245-1252.
21 Mason W.P., Physical Acoustics, Vol. 3B, AcademicPress, New York, (1965).
22 Yadav R.R. and Singh D., Effect of thermal conductivityon ultrasonic attenuation in praseodymium mono-chalcogenides, Acoust. Phys., 49 (2003) 595-604.
23 Yadav R.R. and Singh D., Ultrasonic attenuation inlanthanum monochalcogenides, J. Phys. Soc. Jpn.,70 (2001) 1825-1832.
24 Bhalla V., Singh D., Jain S.K. and Kumar R., Ultrasonicattenuation in rare-earth monoarsenides, Pramana-J.Phys., (2016). DOI : 10.1007/s/2043-015-1183-5.
25 Pugh S.F., Relations between the elastic moduli andthe plastic properties of polycrystalline pure metals,Philos. Mag., 45 (1954) 823-843.
26 Watt J.P. and Peselnick L., Clarification of the Hashin-Shtrikman bounds on the effective elastic moduli ofpolycrystals with hexagonal, trigonal, and tetragonalsymmetries, J. Appl. Phys., 51 (1980) 1525-1531.
27 Singh D., Pandey D.K. and Yadawa P.K., Ultrasonicwave propagation in rare-earth monochalcogenides,Cent. Eur. J. Phys., 7 (2009) 198-205.

28 J. PURE APPL. ULTRASON., VOL. 38, NO. 1 (2016)
Honorary FellowHF 13Prof. Ramesh Chandra BudhaniDepartment of Physics, Indian Institute of Technology, Kanpur
Life MembersLM 224Dr. A. Mohamed AliAssistant ProfessorAbdul Hakeem College,Mevisharam, Vellore - 632509, Tamil Nadu.
LM 225Mrs. S. SosammaScientist Officer-C, Non-DestructiveEvaluation Division (NDED), I.G.C.A.R.Kalpakkam - 603102, Tamil Nadu.
LM 226Prof. Kadinti Ravindra PrasadDepartment of PhysicsShri Venkateshwara University,Kavali - 524201, A.P.
LM 227Dr. (Mrs.) Neelima DubeyWomen Scientist -DSTDept. of Chemistry, KurukshetraUniversity, Kurakshetra - 136119, Haryana
LM 228Mr. K. MurugadossLecturer1619, Maratiya Street, KaranthaiThanjavur - 613002.
LM 229Dr. Charles Christopher KanakamProfessor & HeadChemistry DepartmentSRM Valliammai Engg. CollegeKattankulathur, Kancheepuram - 603203, Tamil Nadu.
LM 230Dr. S. RajakarthihanAsst. Professor in PhysicsThiagarajar College, TeppakulamMadurai - 625009, Tamil Nadu.
LM 231Dr. R. PadmavatiAssociate ProfessorSRC, Trichy - 620006, Tamil Nadu.
LM 232Dr. K. GanthmathiAssociate ProfessorHoly Cross CollegeTrichy - 620002, Tamil Nadu.
LM 233Ms. Sudha PattanMedical PhysicistRSO & Research InstitutePorur, Chennai - 600116, Tamil Nadu.
LM234Mr. Saju T. AbrahamQuality Assurance DivisionIGCAR, Kalpakkam - 603102, Tamil Nadu.
LM 235Mr. Prashant Bhagwantrao DabraseAssistant Professor, PhysicsBhalerao Science College, Saoner, Nagpur, Maharastra.
New Members (List continued after 2008)LM 236Dr. Narendra Digambar LondheDepartment of Electrical Engineering,National Institute of Technology (NIT),Raipur - 492010, Chhatisgarh.
LM 237Mr. Harish Kumar ManchandaAssistant Professor in ChemistryDr. B.R. Ambedkar NIT, Jalandhar - 144011, Punjab.
LM 238Dr. Imran KhanSchool of Industrial Technology,University of Sains, Penang - 11800, Malaysia.
LM 239Dr. S.G. GoswamiAsst. Prof., Department of Physics,Shri MM College of Science, Nagpur - 440009, Maharashtra.
LM 240Dr. Y.S. ReddyAsst. Prof. Cheitanya Bharati Institute of Technology,Gandipet, Hyderabad - 500075, Andhra Pradesh.
LM 241Dr. Abhay SaxenaAssociate ProfessorDepartment of Physics & Electronics, DAV Degree College, Kanpur. (UP).
LM 242Dr. Jagdish Chandra SharmaRetired as Chief Scientist, CSIR-NationalPhysical Laboratory, New Delhi -110012, India.
LM 243Mr. C. DhadapaniC-42, Industrial EstateGuindy, Chennai - 600032, Tamil Nadu.
LM244Dr. Jaikar Bapurao ThakreAssociate ProfessorSSSKR Innani College, Washim-444105
LM 245Mr. Rambhau Atmaramji PatilAssociate Professor, S.S.S.K. R. InnaniMahavidyala, Martizapur Road,Karanja (lad) Distt. Washim - 444105, Maharashtra.
LM 246Dr. Nandanwar Deoram VithobaAssociate ProfessorShri MM College of Science,Nagpur - 440009, Maharashtra.
LM 247Dr. Rita PaikarayAssociate Professor in PhysicsRavenshaw University, Cuttack - 753003, Odisha
LM 248Dr. Ganeswar NathAssociate Professor, Department of Physics,Veer Surendra Sai University of Technology (VSSUT),Burla, Sambalpur - 768018, Odisha.
LM 249Dr. C.K. MukhopadhayScientific Offcer (H) & Head, EMSIS,NDED, Indira Gandhi Centre for AtomicResearch (IGCAR), Kalpakkam - 603102, Tamil Nadu.
LM 250Dr. Vinod Kumar SinghAssociate Professor in Physics, VSSD College, Kanpur - 208002, Uttar Pradesh

29NEW MEMBERS (LIST CONTINUED AFTER 2008)
LM 251Mr. Amit Ramesh BansodJRF, Acoustical Research Laboratory,Department of Physics, RTM, NagpurUniversity, Nagpur - 440033, Maharashtra
LM-252Mrs. Sunita Tryambak HiwarkarLecturer, Department of Physics,Sindhu Mahavidyalaya, Pancholy - 440017, Maharashtra.
LM 253Dr. Anil Bhanudas NaikAssistant Professor, Department of Chemical Technology,SGB Amravati University, Amravati - 444602
LM 254Ms. Sugandha V KhangarDepartment of Physics,RTM Nagpur University, Nagpur - 440033, Maharashtra.
LM-255Dr. K. SakthipandiAssistant Professor, Department ofPhysics, Sethu Institute of Technology,Kariapatti - 626115, Tamil Nadu, India.
LM 256Dr. Surendra Singh KachhwahaProfessor in Mechanical Engineering School of Technology,Petrotroleum University, Raisan, Gandhinagar - 38200.
LM 257Dr. Amit PalAssistant Professor,Delhi Technological Univesity, Delhi - 110042.
LM 258Dr. Sudhir Pandurang DangeAssistant Professor,Department of Physics, Sindhu MahavidyalayaPanchanpaoli, Nagpur - 440017, Maharashtra.
LM-259Dr. Raj Kumar SainiAssisstant ProfessorGurgaon Institute of Technology & ManagementGurgaon - 122413, Haryana.
LM 260Dr. Bidyadhar SwainDepartment of PhysicsRavenshaw University, Cuttack-753003, Odisha
LM-261Mr. Pukhrambam Ibomcha SinghAssistant Professor, Moirang College,Moirang - 795133, (Manipur).
LM 262Dr. Michael Anjello Jothi RajanAssociate Professor in Physics; Head Department of Foundation Courses;Dean for Research and UGC Affairs; Director, Bio-nano Laboratory,Arul Anandar College, Theni Main Road, Karumathur,Madurai Disttt. - 625154, Tamil Nadu.
LM 263Mr. G. K. AroraRetired as Scientist 'F',CSIR-National Physical Laboratory, New Delhi.
LM 264Dr. (Mr.) Shashi ChawlaAssistant Professor, Department of Applied Chemistry and EVSAmity School of Engineering & Technology,New Delhi - 110 061.
LM 265Mrs. Chinmayee TripathyAssistant Professor, HMR Institute of Technology & ManagementHamidpur, Delhi - 110036.
LM 266Dr. Jitendra KumarAssistant Professor, Govt. Girls P.G. College,Banda - 210 001, Uttar Pradesh.
LM 267Dr. Virendra KumarTeacher, DAV Inter College, Banda - 210001, Uttar Pradesh
LM-268Dr Sandeep KumarAssistant Professor, Hemvati Nandan Bahuguna Govt. PG College,Naini, Allahabad - 211 008, Uttar Pradesh.
LM 269Mrs. Aparna Bapuji DhoteAssistant ProfessorNilkanthrao Shinde Science and Arts College,Bhadravati, Distt. Chandrapur - 442402, Maharastra.
LM-270Dr.M. SivabharathyAssociate Dean (R & D) and Professor,Sethu Institute of Technology, Pulloor,Kariapatti, Virudhunagar Distt.- 626115, Tamil Nadu.
LM-271Dr. K. S. AprameyaAssociate Professor, UniversityBDT College of Engineering, Davengere - 577004, Karnataka.
LM 272Dr. Milind Shankar DeshpandeAssociate Professor, Dept. of Physics,Anand Niketan College, Anandwan, Distt. Chandrapur.
LM 273Mr. Sanjay Parsharam RamtekeAssistant Professor in Physics, SardarPatel Mahavidyalaya, Chandrapur Distt.Chandrapur - 442402, Maharashtra.
LM 274Mr. Deepak BansalSr. Technical Officer (3),CSIR-National Physical Laboratory, New Delhi - 110012.
LM 275Mr. Bhikam SinghSr. Technical Officer (3)CSIR-National Physical Laboratory, New Delhi - 110012.
LM-276Dr. Shashikant Rajeshwar AswalePrincipal, Lokmanya TilakMahavidyalaya, Wani ,Distt. Yavatmal - 445304, Maharashtra.
LM-277Dr. Sunanda Shashikant AswaleAssociate Professor, Lokmanya TilakMahavidyalaya, Wani, Distt. Yavatmal - 445304, Maharashtra.
LM 278Mr. Sudhanshu TripathiAssistant Professor,ICE Dept. Amity School of Engineering and TechnologyNew Delhi - 110061.
LM 279Mrs. Vyoma BhallaDepartment of Applied Physics, Amity School of Engineering and Technology,Bijwasan, New Delhi - 110061.
LM-280Dr. Premshankar Kedarnath DubeySenior Scientist,CSIR-National Physical Laboratory, New Delhi - 110012.
LM 281Dr. S. Seelakumar TitusPrincipal Scientist, CSIR-National Physical Laboratory, New Delhi - 110012.

30 J. PURE APPL. ULTRASON., VOL. 38, NO. 1 (2016)
LM-282Late Dr. Tushya Kumar SaxenaFormerly Chief Scientist,CSIR-National Physical Laboratory, New Delhi - 110012.
LM-283Mr. Ravi Gopal AllamsettyScientific Officer, Indra Gandhi Centre for Atomic Research,Kakpakkam, Kancheepuram Distt. - 603102, Tamil Nadu.
LM 284Dr. Gajendra Ramdas BedareAsistant Professor,N. S. Science & Arts College,Bhadrawati, Chandrapur - 442902, Maharashtra
LM 285Mr. Morey Panjabrao BalajiAssistant Professor,Vidyabharati Colege,Karanja Lad, Distt. Washim - 444105, Maharashtra.
LM 286Mrs. Amita TripathyAssistant Professor,ABES EngineeringCollege, Vijayanagar, Ghaziabad- 201009, Uttar Pradesh.
LM 287Dr. Brajabandhu NandaProfessor & Head,Department of Chemistry,Dhaneshwar Rath Institute of Engineering and Management Studies (DRIEMS),Kairapari, Kotsahi Tangi, Cuttack - 754022.
LM 288Dr. Manoj Kumar PraharajAssistant Professor,Department of Physics,Ajay Binoya Institute of Technology (ABIT),CDA-1, Cuttack - 753014, Odisha.
LM 289Dr. (Mrs.) Smrutiprava DasAssociate ProfessorDepartment of Chemistry, Ravenshaw University,Cuttack - 753003, Odisha.
LM 290Dr. (Mrs.) Ninima MohantyAssistant Professor, Department of Physics,Womens College, Cuttack - 753002, Odisha.
LM 291Dr.Anoop Kumar ShuklaAssistant Professor,Department of Physic,Amity Institute of Applied Sciences,Amity University Uttar Pradesh,Sector 125, Express Way, NOIDA,Gautam Budh Nagar - 201301.
LM 292Dr. Priyanka Vilas TabhaneAssistant Professor,S.D.M.C. Colege of Commerce & Science,Dadra Nagar Haweli, Silvassa - 396230.
LM 293Dr. Surendra Pratap SinghAssistant Professor & Head, Physics DepartmentDr. B R Ambedkar Govt. Degree College,Mainpuri - 205001, Uttar Pradesh
LM 294Dr. R. Sugaraj SamuelAssistant Professor,Dept. of Physics,The New College (Autonomous),Peters Road, Royapettah, Tamil Nadu.
LM-295Dr. Namdeo Ramdin PawarAsstt. Prof. & Head, Deptt. of Physics,Arts Commerce and Science College, Maregaon Road,Distt. Yavatmal, Maharashtra - 445303.
LM 296Mrs Bhave Manisha GirishDeptt. of Physics,Sidharth College of Arts,Sci. & Comm. Budha Bhuvan Fort, Mumbai - 400001
LM 297Dr. T. Srinivasa KrishnaAssistant ProfessorNalanda Institute of Engg & TechnologySiddhartha Nagar, Kantepudi (V), Sattenpalli, Gantur - 522438, A.P
LM 298Dr Rita A. GhardeAssociate ProfessorTilak Bhavan Univ of Mumbai, Santa Cruz Mumbai - 400098
LM 299Mr Atul Ramkrishnaji KhobragadeAsst Prof., R. D. College of Science Aheri, Distt. Gadchiroli - 442705, M.S.
LM 300Dr Sangita Uttareshwar ShindeAsst Professor, Deptt of PhysicsPratisthan Mahavidyalya, Paithan, Aurangabad - 431001
LM 301Mr Sankar ChakmaDeptt of Chemical Engg.Indian Institute of Technology, Gauhati, Assam - 781031.
LM 302Dr. Meher WanPost Doctoral FellowAdvanced Technology Development CentreIndian Institute of Technology, Kharagpur - 721302.
LM 303Mr Punit Kumar DhawanSRF, Department of PhysicsUniversity of Allahabad, Allahabad - 211002.
LM 304Dr Pramod Kumar Yadawa,Assistant Professor, Dept. of Applied PhysicsAmity School of Engg & Technology, Bijwasan, New Delhi - 110061
LM 305Dr Kirti SoniScientist, AUV Standards, CSIR-NPL, New Delhi - 110012
LM 306Dr Arvind Kumar TiwariAssistant Professor, Dept. of PhysicsB.S.N.V.P.G. College, Charbagh, Lucknow - 226001 (UP)
LM 307Dr Kolla NarendraAssistant Professor,V.R. Siddhartha Engg College, Kanuru, Penamaluru Mandal,Vijayawada, Krishna (Dt) 520007 (AP)
LM 308Dr Ch KavithaAssistant Professor,V.R. Siddhartha Engg College, Kanuru, Penamaluru Mandal,Vijayawada, Krishna (Dt) 520007 (AP)
LM 309Dr M Durga BhavaniAssistant Professor,V.R. Siddhartha Engg College,Kanuru, Penamaluru Mandal,Vijayawada, Krishna (Dt) 520007 (AP)
to be continued in the next issue

1. Type of Contribution
JOURNAL OF PURE AND APPLIEDULTRASONICS welcomes contributions on allaspects of ultrasonics including ultrasonic studiesin medical ultrasonics, NDT, underwater,transducers, materials & devices and any otherrelated topic. Contributions should fall into one ofthe following classes.
Paper - These should be on original research workcontributing to scientific developments. Theyshould be written with a wide readership in mindand should emphasize the significance of the work.
Reviews and Articles - Includes critical reviews andsurvey articles.
Research and Technical notes - These should beshort descriptions of new techniques, applications,instruments and components.
Letters to the editor - Letters will be published onpoints arising out of published articles and papersand on questions of opinion.
Miscellaneous - Miscellaneous contributions suchas studies, interpretive and tutorial articles,conference reports and news items are also accepted.Recommended contribution lengths are: Papers2000-4000 words. Reviews and Surveys 2000-5000words; Conference Reports 500-1500 words; NewsItems, Research and Technical Notes up to 1000words.
2. Manuscripts
Manuscripts should be typed on one side of the paperin double spacing with wide margins on A4 sizepaper. The originals of text and illustrations plustwo copies should be provided to facilitate the
Journal of Pure and Applied Ultrasonics
INFORMATION FOR AUTHORS
process of reviewing. Complete manuscript in MSWORD or Page Maker would ensure no mistake.Floppy containing article should be sent along withthe manuscript.
Title - Titles should be short and indicate the natureof the contribution.
Abstract - An abstract of 100-200 words should beprovided on the title page of paper and review article.This should indicate the full scope of the contributionand include the principal conclusions.
Mathematics - Mathematical expressions should bearranged to occupy the minimum number of linesconsistent with clarity e.g., ( x2+y2 )/( x-y )1/2.
Illustration - The line illustrations along withcaptions should be clearly drawn with black Indianink. Figures in Excel are preferred.
References - References should be referred to in thetext by number only. The reference number shouldbe given as superscript. The corresponding referenceshall contain the following information in order;names and initials of author (s)(bold), title of thework, journal or book title (italic), volume number(bold), year of publication in brackets, page number,e.g., Sabesan R., Determination of apparent molarvolume from hydration number, J. Pure Appl.Ultrason., 16 (1994) 18-28.
Units and Abbreviations - Authors should use SIunits wherever possible.
3. Reprints
One copy of the issue in which the paper is publishedis sent to the author free of charges. Reprints maybe made available on nominal charges. The ordermay be placed directly with the printer in advance.
INTERNATIONAL CONFERENCE
ON
Engineering Physics, Materials and
Ultrasonics (ICEPMU)
3-4 June 2016
CALL FOR PAPERS
Organized by
Department of Applied Sciences
THE NORTHCAP UNIVERSITY
Sector 23 A, Gurgaon 122017 - Haryana
Tel: 0124-2365811, Fax: 0124-2367488
Website: www.ncuindia.edu
Accepted papers will be published in “Journal of Pure & Applied Ultrasonics”
or “Technology Letters”
In Association with Ultrasonics Society of India
& & Materials Research Society of India
(Delhi Chapter)
Novel materials: synthesis & applns
Nano-materials & Applications
Opto-electronic mat. Photonics Dielectric, ferroelec.
piezoelec. mat. & characterization
Magnetic mat. & characterization
Energy harvesting sys Adv. in metrology Ultrasonic trans. &
devices Ultrasonic mat.
Characterization & nondestr. evaluation
Important Dates Abstract Submission
10 April 2016 Acceptance Notification
20 April 2016
Full-paper Submission 15 May 2016
Contact: Prof. S.K. Jain Convener-ICEPMU Dept of Applied Sciences THE NORTHCAP University Sector 23A, Gurgaon 122017.Email: [email protected] [email protected] Phone No: 0124-2365811 (O) Mobile: 9899699595