PROBLEM SOLVING AND METACOGNITION · Problem(solving(and(metacognition(!! (! problem.!

3docs.lib.purdue.edu/jps 2016 | Volume 9
Journal of Problem SolvingSpecial iSSue
Alternative Representations for Algebraic Problem Solving: When Are Graphs Better Than Equations?Marta K. Mielicki1 and Jennifer Wiley1
1 University of Illinois at Chicago
Successful algebraic problem solving entails adaptability of solution methods using different representations. Prior research has suggested that students are more likely to prefer symbolic solution methods (equations) over graphical ones, even when graphical methods should be more efficient. However, this research has not tested how representation format might affect solution success, and whether the efficiency of solution varies depending on the nature of the problem solving task. This study addressed the question of whether symbolic or graphi-cal representation format provides different affordances with respect to two different types of problems: computation and interpretation. Graphical representation was found to facili-tate problem solving among college students, and problems that required the comparison of slopes were more difficult when presented in a symbolic format than in graphical format.
Correspondence:Correspondence concerning this article should be addressed to Marta K. Mielicki, via email to [email protected].
Keywords: multiple representations, algebra, slope
Acknowledgment:Thank you to James W. Pellegrino and Mara V. Martinez for their valuable feed-back on this project.
In order to be successful at algebraic problem solving, stu-dents must possess a robust understanding of algebraic concepts, which includes understanding how different representations can be used to express an underlying con-cept (National Council of Teachers of Mathematics, 2000; Moschkovich, Schoenfeld, & Arcavi, 1993). However, many students fail to appreciate the meaning of alternative represen-tations of algebraic concepts, and struggle to switch flexibly between representations during problem solving (Leinhardt, Zaslavsky, & Stein, 1990; Romberg, Fennema, & Carpenter, 1993). Selecting an appropriate representation for a given task is a critical part of successful problem solving, and this selec-tion entails understanding the affordances of different repre-sentations in different contexts (Ainsworth, 2006). Previous research suggests that students may not select appropriate representations during algebraic problem solving, and instead prefer to solve problems by using symbolic representations (equations) rather than graphical ones, even when the latter are thought to be more efficient for solution (Herman, 2007; Knuth, 2000). In Knuth’s (2000) study, high-school students were given several function problems to solve while thinking aloud, and were provided with both a symbolic and a graphical representation for each problem. Knuth found that students generally chose to use equations rather than graphs to solve function problems, even when the former might be expected to be less efficient than the latter. Knuth attributed this prefer-ence to instruction that emphasizes symbolic representations over graphical ones (Yerushalmy & Chazan, 2002).
Taking a similar approach, Herman (2007) examined the strategies used on algebraic function problems by col-lege students. The students had completed a course which
emphasized multiple representations, and had been trained to use a graphing calculator. Herman found that symbolic representations were still overwhelmingly preferred by students when solving algebraic function problems, even though students had been explicitly encouraged to use mul-tiple representations. Herman also conducted follow-up interviews with the students, and these interviews suggested that students considered symbolic manipulation to be a more important mathematical skill than graphing, and perceived an instructor bias toward using symbolic representations over graphical ones.
Although the results of both Knuth (2000) and Herman (2007) demonstrate a student preference for symbolic meth-ods over graphical methods when solving problems pertaining to functions, many questions remain about why students may have these preferences and how they might affect student per-formance during problem solving. A key assumption in these earlier studies is that there is some benefit to using a graphical approach during problem solving—that this approach should be more efficient and lead to more successful problem solv-ing relative to a symbolic approach. However, this assump-tion has not been empirically tested. One possibility is that although graphical representation might lead to more effi-cient problem solving for experts (including math teachers), it may not be as effective for novices. Thus, the assumption that graphs are a more appropriate representation for solv-ing some types of problems may be an instance of the expert blind spot (Koedinger & Nathan, 2004). This study sought to answer the question of whether graphical representation can facilitate algebraic problem solving for novices. Using solu-tion success as a dependent variable, this study tested whether
http://dx.doi.org/10.7771/1932-6246.1181

docs.lib.purdue.edu/jps 2016 | Volume 9
M. K. Mielicki & J. Wiley When Are Graphs Better Than Equations?
4
students are able to use a graphical approach successfully, and whether graphical representations might support efficient problem solving for only some types of problems.
In addition to using solution success as a dependent vari-able instead of preference, the present investigation also var-ied the problem types that students were asked to solve. In instructional sequences found in most curricula, students typically progress from problem solving tasks that require identification of specific points (e.g., solving for an unknown) to tasks that require relational reasoning and comparisons (Bieda & Nathan, 2009). The two different problem types used in this study were intended to capture this progression and to serve as analogs for local and global graph interpreta-tion tasks as defined by Guthrie, Shelley, and Kimmerly (1993; Leinhardt, Zaslavsky, & Stein, 1990). Local graph interpreta-tion tasks require attention to specific details, while global interpretation tasks entail identification of trends or patterns. Correspondingly, students in this study were either prompted to compute specific points for a single linear function (com-putation problems) or they were prompted to engage in comparisons across multiple linear functions (interpretation problems). To test whether the effects of problem represen-tation on problem solving performance depend on problem type, students were presented with problems in either graphi-cal or symbolic format, and were given several of each of these types of problems. Examples of the two kinds of problems in each representation format are shown in Figure 1.
WHEN ARE GRAPHS BETTER THAN EQUATIONS? 6
Solve for x problem in graphical format
Slope comparison problem in graphical format
Solve for y problem in symbolic format
The use of both computation problems and interpretation problems extends the scope of the earlier studies by Knuth (2000) and Herman (2007) that each used only computation problems. Knuth (2000) suggested that students’ reluctance to use graphical strategies stems from the difficulty of isolat-ing specific coordinate points in graphical representations, and from a lack of understanding that if a point falls on the line in a graph then that point is a solution to the algebraic equation of the line. Similarly, Hall and colleagues have sug-gested that symbolic representation might allow for ease in computation of exact points, whereas graphical representa-tion should allow for easier visualization of overall patterns (Hall, Kibler, Wenger, & Truxaw, 1989). Thus, the prefer-ence for equations that Knuth and Herman observed may be because they only administered computation problems. When students are asked to solve interpretation problems, an advantage for graphical representations may emerge.
The main goal of this study was to test the impact of graphical representations on student problem solving relative to symbolic representations, and whether graphical representation differ-entially impacts performance on problems that entail compar-ing multiple linear functions (interpretation problems) versus problems that require computation of a value from a single lin-ear function (computation problems). If graphical representa-tion facilitates a more efficient approach in general, then there should be a significant main effect for representation type on solution success in favor of graphical format. Alternatively, if
students
Figure 1. Examples of interpretation problems (slope comparison, point comparison) and computation problems (solve for x, solve for y) in either symbolic or graphical format.
Malik is comparing three cab companies. Each company has a different fare structure for charging customers.
Use the graph below (which also appears in your answer booklet) to answer the following questions.
If company C charges Malik $25, how many miles did he travel?
Write the answer in your answer booklet and press the space bar to proceed to the next question.
Solve for x problem in graphical format
docs.lib.purdue.edu/jps 2016 | Volume 9
M. K. Mielicki & J. Wiley When Are Graphs Better Th an Equations?
5
WHEN ARE GRAPHS BETTER THAN EQUATIONS? 7
Solve for y problem in symbolic format
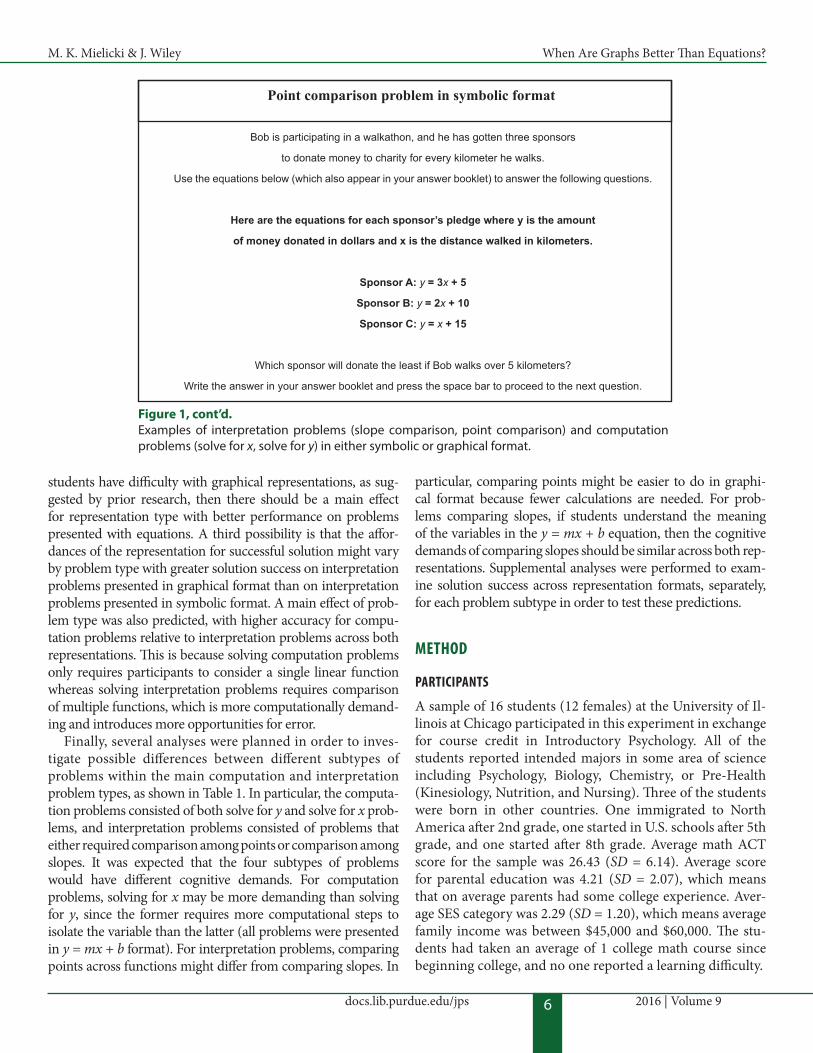
Point comparison problem in symbolic format
Figure 1. Examples of interpretation problems (slope comparison, point comparison) and computation problems (solve for x, solve for y) in either symbolic or graphical format.
Figure 1, cont’d. Examples of interpretation problems (slope comparison, point comparison) and computation problems (solve for x, solve for y) in either symbolic or graphical format.
Bob is participating in a walkathon, and he has gotten three sponsors to donate money to charity for every kilometer he walks.
Use the equations below (which also appear in your answer booklet) to answer the following questions.
Here are the equations for each sponsor’s pledge where y is the amount
of money donated in dollars and x is the distance walked in kilometers.
Sponsor A: y = 3x + 5
Sponsor B: y = 2x + 10
Sponsor C: y = x + 15
How much will sponsor C donate if Bob walks 10 kilometers?
Write the answer in your answer booklet and press the space bar to proceed to the next question.
Solve for y problem in symbolic format
WHEN ARE GRAPHS BETTER THAN EQUATIONS? 6
Solve for x problem in graphical format
Slope comparison problem in graphical format
Solve for y problem in symbolic format
Malik is comparing three cab companies. Each company has a different fare structure for charging customers.
Use the graph below (which also appear in your answer booklet) to answer the following questions.
Which cab company has the lowest rate per mile?
Write the answer in your answer booklet and press the space bar to proceed to the next question.
Slope Comparison problem in graphical format
docs.lib.purdue.edu/jps 2016 | Volume 9
M. K. Mielicki & J. Wiley When Are Graphs Better Than Equations?
6
students have difficulty with graphical representations, as sug-gested by prior research, then there should be a main effect for representation type with better performance on problems presented with equations. A third possibility is that the affor-dances of the representation for successful solution might vary by problem type with greater solution success on interpretation problems presented in graphical format than on interpretation problems presented in symbolic format. A main effect of prob-lem type was also predicted, with higher accuracy for compu-tation problems relative to interpretation problems across both representations. This is because solving computation problems only requires participants to consider a single linear function whereas solving interpretation problems requires comparison of multiple functions, which is more computationally demand-ing and introduces more opportunities for error.
Finally, several analyses were planned in order to inves-tigate possible differences between different subtypes of problems within the main computation and interpretation problem types, as shown in Table 1. In particular, the computa-tion problems consisted of both solve for y and solve for x prob-lems, and interpretation problems consisted of problems that either required comparison among points or comparison among slopes. It was expected that the four subtypes of problems would have different cognitive demands. For computation problems, solving for x may be more demanding than solving for y, since the former requires more computational steps to isolate the variable than the latter (all problems were presented in y = mx + b format). For interpretation problems, comparing points across functions might differ from comparing slopes. In
particular, comparing points might be easier to do in graphi-cal format because fewer calculations are needed. For prob-lems comparing slopes, if students understand the meaning of the variables in the y = mx + b equation, then the cognitive demands of comparing slopes should be similar across both rep-resentations. Supplemental analyses were performed to exam-ine solution success across representation formats, separately, for each problem subtype in order to test these predictions.
Method
ParticiPants
A sample of 16 students (12 females) at the University of Il-linois at Chicago participated in this experiment in exchange for course credit in Introductory Psychology. All of the students reported intended majors in some area of science including Psychology, Biology, Chemistry, or Pre-Health (Kinesiology, Nutrition, and Nursing). Three of the students were born in other countries. One immigrated to North America after 2nd grade, one started in U.S. schools after 5th grade, and one started after 8th grade. Average math ACT score for the sample was 26.43 (SD = 6.14). Average score for parental education was 4.21 (SD = 2.07), which means that on average parents had some college experience. Aver-age SES category was 2.29 (SD = 1.20), which means average family income was between $45,000 and $60,000. The stu-dents had taken an average of 1 college math course since beginning college, and no one reported a learning difficulty.
WHEN ARE GRAPHS BETTER THAN EQUATIONS? 7
Solve for y problem in symbolic format
Point comparison problem in symbolic format
Figure 1. Examples of interpretation problems (slope comparison, point comparison) and computation problems (solve for x, solve for y) in either symbolic or graphical format.
Figure 1, cont’d. Examples of interpretation problems (slope comparison, point comparison) and computation problems (solve for x, solve for y) in either symbolic or graphical format.
Point comparison problem in symbolic format
Bob is participating in a walkathon, and he has gotten three sponsors
to donate money to charity for every kilometer he walks.
Use the equations below (which also appear in your answer booklet) to answer the following questions.
Here are the equations for each sponsor’s pledge where y is the amount
of money donated in dollars and x is the distance walked in kilometers.
Sponsor A: y = 3x + 5
Sponsor B: y = 2x + 10
Sponsor C: y = x + 15
Which sponsor will donate the least if Bob walks over 5 kilometers?
Write the answer in your answer booklet and press the space bar to proceed to the next question.

docs.lib.purdue.edu/jps 2016 | Volume 9
M. K. Mielicki & J. Wiley When Are Graphs Better Than Equations?
7
Materials
Algebra Problems. The problem sets were modeled on items involving linear functions found in Pearson Hall Connected Mathematics (CMP2) materials. Each participant was pre-sented with 12 scenarios, half of which were presented with a graph of three linear functions, and half with equations for three linear functions, as shown in Figure 1. The scenarios alternated between the two representations, and the order was counterbalanced, with half of the participants receiving graphical representations first and the other half receiving symbolic representations first. Within each scenario, solvers were presented with two problems, one computation and one interpretation, for a total of 24 problem solving opportuni-ties. Computation problems were divided into two subtypes: problems that required solving for the dependent variable, solve for y, and problems that required solving for the inde-pendent variable, solve for x. Interpretation problems also had two subtypes: slope comparison and point comparison. Slope comparison problems required comparing the slopes of the three linear functions to determine which has the larg-est or smallest value. Point comparison problems required participants to compare the y values for all three functions across some range of x values. Each participant saw three instances of each of the four problem subtypes within each representation format. For problems presented in symbolic format, the equations were always in slope-intercept form.
To minimize the number of counterbalancing conditions needed for a full design, computation problem subtypes that required solving for x were always paired with slope com-parison interpretation problem subtypes, and computation problem subtypes that required solving for y were always paired with point comparison interpretation problem subtypes
within each scenario. The problem subtype pairs were alter-nated between each scenario, with order counterbalanced.
In order to minimize the repetitiveness of the task, three configurations of linear functions were used: zero slope, mid-dle intersection, and converging. Graphs and equations for the three configurations are presented in Table 2. Certain features of linear functions were avoided in order to minimize diffi-culty for participants (i.e., all linear functions have positive or zero slopes and y-intercepts). In an effort to limit the number of counterbalancing conditions needed for a full replication, the three configurations were presented in the same order for all participants. The first 4 problem solving opportunities were presented with a middle intersection configuration, the sec-ond 4 with a converging configuration, and the third 4 with a zero slope configuration. The same ordering was repeated for the remaining 12 problem solving opportunities.
In sum, there were four dimensions that were counter-balanced across the 24 problem solving opportunities. The assignment of each scenario to representation type was coun-terbalanced across participants, with half of the participants receiving graphical representation for scenario A and half receiving symbolic representation for scenario A. The order of representation presentation was also counterbalanced, with half of the participants receiving graphical representations first within pairs of problems in each scenario and the other half receiving symbolic representations first. The order of presen-tation of problem-subtype pairs was counterbalanced across participants so that half received solve for x computation/slope comparison interpretation pairs first and half received solve for y computation/point comparison interpretation pairs first. The order of computation-interpretation subtype pairs was
WHEN ARE GRAPHS BETTER THAN EQUATIONS? 10
Table 1. Examples of problem solving scenarios, and computation and interpretation problems.
Computation Problems Interpretation Problems
Bob is participating in a walkathon, and he has gotten three sponsors to donate money to charity for every kilometer that he walks. Each sponsor has a different pledge plan for how much money he or she will donate.
Solve for x
If sponsor A donates $35, how many kilometers did Bob walk?
Solve for y
How much will sponsor C donate if Bob walks 6 kilometers?
Malik is comparing three cab companies. Each company has a different fare structure for charging customers.
Point Comparison (P)
Which company offers the best deal if Malik wants to travel over 5 miles?
Slope Comparison (S)
Which company has the lowest rate per mile?
Method
Participants
A sample of 16 students (12 females) at the University of Illinois at Chicago participated
in this experiment in exchange for course credit in Introductory Psychology. All of the students
reported intended majors in some area of science including Psychology, Biology, Chemistry, or
Pre-Health (Kinesiology, Nutrition, and Nursing). Three of the students were born in other
countries. One immigrated to North America after 2nd grade, one started in U.S. schools after 5th
grade, and one started after 8th grade. Average math ACT score for the sample was 26.43 (SD =
6.14). Average score for parental education was 4.21 (SD = 2.07), which means that on average
parents had some college experience. Average SES category was 2.29 (SD = 1.20), which means
average family income was between $45,000 and $60,000. The students had taken an average of
1 college math course since beginning college, and no one reported a learning difficulty.
Materials
Table 1. Examples of problem solving scenarios, and computation and interpretation problems.

docs.lib.purdue.edu/jps 2016 | Volume 9
M. K. Mielicki & J. Wiley When Are Graphs Better Than Equations?
8
WHEN ARE GRAPHS BETTER THAN EQUATIONS? 13
Configuration Graphical Symbolic
Zero slope
Provider A: y = 0.5x + 15
Provider B: y = 0.25x + 25
Provider C: y = 35
Middle
intersection
Sponsor A: y = 3x + 5
Sponsor B: y = 2x + 10
Sponsor C: y = x + 15
ConvergingJonah: y = 3x + 20
Tim: y = 4x + 10
Anchee: y = 5x
Table 2. Linear function configurations with corresponding graphical and symbolic representations.
Configuration Graphical Symbolic
Zero Slope
Middleintersection
Converging

docs.lib.purdue.edu/jps 2016 | Volume 9
M. K. Mielicki & J. Wiley When Are Graphs Better Than Equations?
9
reversed for each participant on the second half of the sce-narios. Finally, the order of presentation for interpretation and computation problem types was counterbalanced, with half of the participants receiving computation problems first within each cover story scenario and the other half receiving interpre-tation problems first. These four dimensions that were coun-terbalanced across participants resulted in a 2 x 2 x 2 x 2 design and 16 different versions of the task. Each of the 16 participants provided data in one of these versions so that the sample repre-sented one complete replication of the full design.
Final Survey. A final survey included items designed to assess participants’ background in order to provide general descrip-tive information on the sample. Items included parental education and household income. Each parent received an edu-cation score from 1 to 8 (with the scale representing the highest level of education completed using 1= less than high school, 2 = high school, 3 = professional training, 4 = some college, 5 = college, 6 = some graduate school, 7 = Masters, 8 = PhD, MD, or JD). Education scores for both parents were averaged to obtain a composite parent education score. Another item asked for household income (with a scale of 1 = under $45,000, 2 = $45,000–$50,000, 3 = $50,000–$60,000, 4 = over $60,000). Students were asked to report their ACT Math score, the num-ber of math classes taken since graduating high school, and their intended major. The descriptive information obtained from this survey is reported in the participants section.
ProcedureAll problems were presented on a computer, but participants received an answer booklet which contained the equations and graphs required to solve the problems. This allowed partici-pants to make full use of either representation by being able to annotate and interact with it on paper in addition to having it visible on a computer screen. Participants were first presented with an instruction screen with the following instructions: “In this experiment you will be asked to solve some math problems. Please write the answer to each problem in the answer book-let provided, and work as quickly and accurately as possible.” Problems were presented one at a time on the computer screen. Participants wrote their answers down in an answer booklet and pressed a key to move on to the next problem. The task was self-paced and took less than an hour to complete. Participants’ annotations in the answer booklets were examined and there were no cases in which a participant spontaneously wrote in the alternative representation. There were 5 missing data points out of 385 opportunities due to computer and experimenter error. To maintain the fully crossed design, missing data were replaced with the expected scores for their condition.
results
Main analyses for rePresentation and ProbleM tyPeThe pattern of results is presented in Figure 2. To test whether graphical representation leads to more successful problem solving, two parallel 2 x 2 within-subjects ANOVAs were conducted using representation (graphical, symbolic) and problem type (interpretation, computation) as fixed effects and both participants (F1) and items (F2) as random effects.
The analyses revealed a main effect of representation, F1(1,15) = 5.34, p < .04, ηp
2 = .26; F2(1,23) = 6.34, p < .02, ηp2 = .22. Par-
ticipants solved both types of problems more successfully when problems were presented with graphs than with equations. The analysis also revealed a main effect of problem type, F1(1,15) = 15.76, p < .001, ηp
2 = .74; F2(1,23) = 12.69, p < .01, ηp2 = .36.
Participants solved computation problems more successfully than interpretation problems, regardless of presentation format. The interaction did not reach significance for subjects, F1(1,15) = 2.32, p < .15, ηp
2 = .15, or items, F2(1,23) = 3.88, p = .06, ηp2 = .14.
In addition, the data were examined by estimating a Bayes factor using Bayesian Information Criteria (Jarosz & Wiley, 2014; Wagenmakers, 2007). The Bayes Factor compares the fit of the data under the null hypothesis, compared to alternative hypotheses. The BIC for the empty or null model was 431.2, while the BIC for the predictor model including both problem type and representation format factors, and their interaction, was 413.7. This yielded an estimated Bayes factor (null/alternative) that suggested that the data were .00016:1 in favor of the alterna-tive hypothesis, or rather over 6,000 times more likely to occur under a model including these effects than a model without it.
WHEN ARE GRAPHS BETTER THAN EQUATIONS? 16
Figure 2. Mean solution success by subject for interpretation and computation problems presented in graphical and symbolic format. The data plotted are participant means and error bars and represent standard error.
The analyses revealed a main effect of representation, F1(1,15) = 5.34., p < .04, ηp2 = .26;
F2(1,23) = 6.34, p < .02, ηp2 = .22. Participants solved both types of problems more successfully
when problems were presented with graphs than with equations. The analysis also revealed a
main effect of problem type, F1(1,15) = 15.76, p < .001, ηp2 = .74; F2(1,23) = 12.69, p < .01, ηp2
= .36. Participants solved computation problems more successfully than interpretation problems,
regardless of presentation format. The interaction did not reach significance for subjects,
F1(1,15) = 2.32, p < .15, ηp2 = .15, or items, F2(1,23) = 3.88, p = .06, ηp2 = .14.
In addition, the data were examined by estimating a Bayes factor using Bayesian
Information Criteria (Jarosz & Wiley, 2014; Wagenmakers, 2007). The Bayes Factor compares
the fit of the data under the null hypothesis, compared to alternative hypotheses. The BIC for the
empty or null model was 431.2, while the BIC for the predictor model including both problem
type and representation format factors, and their interaction, was 413.7. This yielded an
estimated Bayes factor (null/alternative) that suggested that the data were .00016:1 in favor of
0.000.100.200.300.400.500.600.700.800.901.00
Interpretation ComputationSo
lutio
n success
Problem type
Graphical Symbolic
Figure 2. Mean solution success by subject for interpretation and com-putation problems presented in graphical and symbolic for-mat. Error bars represent standard error.
docs.lib.purdue.edu/jps 2016 | Volume 9
M. K. Mielicki & J. Wiley When Are Graphs Better Than Equations?
10
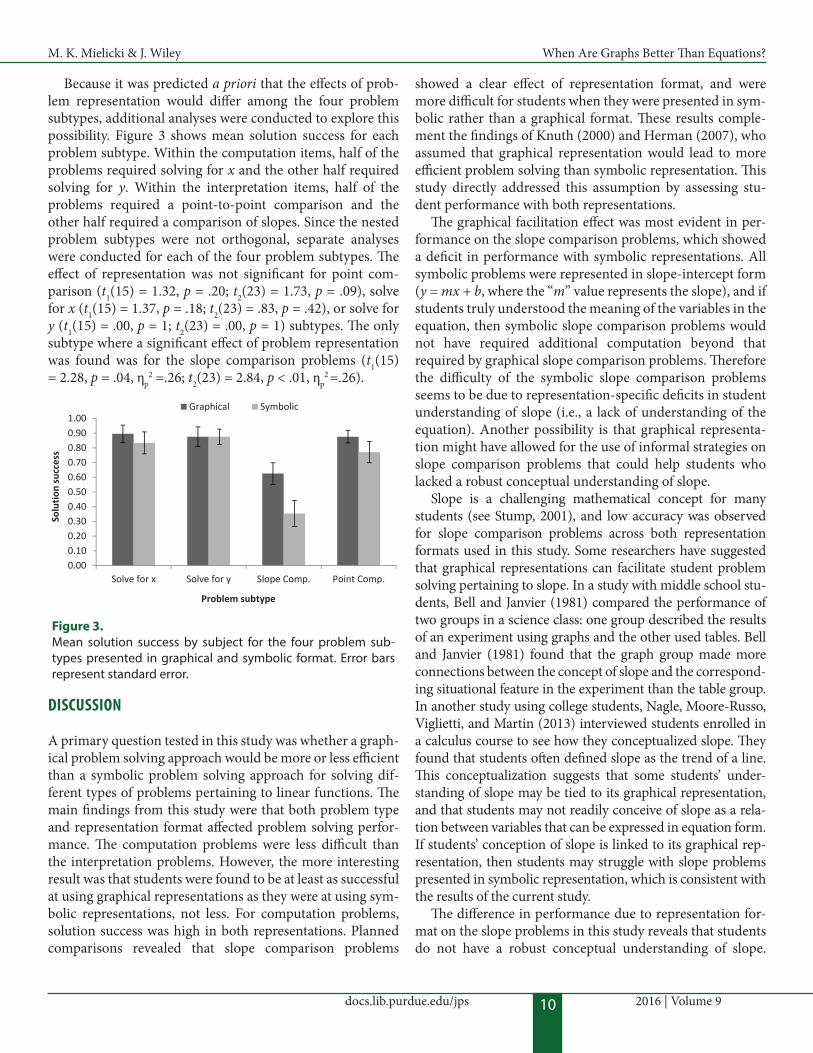
Because it was predicted a priori that the effects of prob-lem representation would differ among the four problem subtypes, additional analyses were conducted to explore this possibility. Figure 3 shows mean solution success for each problem subtype. Within the computation items, half of the problems required solving for x and the other half required solving for y. Within the interpretation items, half of the problems required a point-to-point comparison and the other half required a comparison of slopes. Since the nested problem subtypes were not orthogonal, separate analyses were conducted for each of the four problem subtypes. The effect of representation was not significant for point com-parison (t1(15) = 1.32, p = .20; t2(23) = 1.73, p = .09), solve for x (t1(15) = 1.37, p = .18; t2(23) = .83, p = .42), or solve for y (t1(15) = .00, p = 1; t2(23) = .00, p = 1) subtypes. The only subtype where a significant effect of problem representation was found was for the slope comparison problems (t1(15) = 2.28, p = .04, ηp
2 =.26; t2(23) = 2.84, p < .01, ηp2 =.26).
discussion
A primary question tested in this study was whether a graph-ical problem solving approach would be more or less efficient than a symbolic problem solving approach for solving dif-ferent types of problems pertaining to linear functions. The main findings from this study were that both problem type and representation format affected problem solving perfor-mance. The computation problems were less difficult than the interpretation problems. However, the more interesting result was that students were found to be at least as successful at using graphical representations as they were at using sym-bolic representations, not less. For computation problems, solution success was high in both representations. Planned comparisons revealed that slope comparison problems
showed a clear effect of representation format, and were more difficult for students when they were presented in sym-bolic rather than a graphical format. These results comple-ment the findings of Knuth (2000) and Herman (2007), who assumed that graphical representation would lead to more efficient problem solving than symbolic representation. This study directly addressed this assumption by assessing stu-dent performance with both representations.
The graphical facilitation effect was most evident in per-formance on the slope comparison problems, which showed a deficit in performance with symbolic representations. All symbolic problems were represented in slope-intercept form (y = mx + b, where the “m” value represents the slope), and if students truly understood the meaning of the variables in the equation, then symbolic slope comparison problems would not have required additional computation beyond that required by graphical slope comparison problems. Therefore the difficulty of the symbolic slope comparison problems seems to be due to representation-specific deficits in student understanding of slope (i.e., a lack of understanding of the equation). Another possibility is that graphical representa-tion might have allowed for the use of informal strategies on slope comparison problems that could help students who lacked a robust conceptual understanding of slope.
Slope is a challenging mathematical concept for many students (see Stump, 2001), and low accuracy was observed for slope comparison problems across both representation formats used in this study. Some researchers have suggested that graphical representations can facilitate student problem solving pertaining to slope. In a study with middle school stu-dents, Bell and Janvier (1981) compared the performance of two groups in a science class: one group described the results of an experiment using graphs and the other used tables. Bell and Janvier (1981) found that the graph group made more connections between the concept of slope and the correspond-ing situational feature in the experiment than the table group. In another study using college students, Nagle, Moore-Russo, Viglietti, and Martin (2013) interviewed students enrolled in a calculus course to see how they conceptualized slope. They found that students often defined slope as the trend of a line. This conceptualization suggests that some students’ under-standing of slope may be tied to its graphical representation, and that students may not readily conceive of slope as a rela-tion between variables that can be expressed in equation form. If students’ conception of slope is linked to its graphical rep-resentation, then students may struggle with slope problems presented in symbolic representation, which is consistent with the results of the current study.
The difference in performance due to representation for-mat on the slope problems in this study reveals that students do not have a robust conceptual understanding of slope.
WHEN ARE GRAPHS BETTER THAN EQUATIONS? 17
the alternative hypothesis, or rather over 6,000 times more likely to occur under a model
including these effects than a model without it.
Because it was predicted a priori that the effects of problem representation would differ
among the four problem subtypes, additional analyses were conducted to explore this possibility.
Figure 3 shows mean solution success for each problem subtype. Within the computation items,
half of the problems required solving for x and the other half required solving for y. Within the
interpretation items, half of the problems required a point-to-point comparison and the other half
required a comparison of slopes. Since the nested problem subtypes were not orthogonal,
separate analyses were conducted for each of the four problem subtypes. The effect of
representation was not significant for point comparison (t1(15) = 1.32, p = .20; t2(23) = 1.73, p =
.09), solve for x (t1(15) = 1.37, p = .18; t2(23) = .83, p = .42), or solve for y (t1(15) = .00, p = 1;
t2(23) = .00, p = 1) subtypes. The only subtype where a significant effect of problem
representation was found was for the slope comparison problems (t1(15) = 2.28, p = .04, ηp2
=.26; t2(23) = 2.84, p < .01, ηp2 =.26).
0.000.100.200.300.400.500.600.700.800.901.00
Solve for x Solve for y Slope Comp. Point Comp.
Solutio
n success
Problem subtype
Graphical Symbolic
Figure 3. Mean solution success by subject for the four problem sub-types presented in graphical and symbolic format. Error bars represent standard error.

docs.lib.purdue.edu/jps 2016 | Volume 9
M. K. Mielicki & J. Wiley When Are Graphs Better Than Equations?
11
Given the relatively low rate of success on slope problems in symbolic format observed in this study, it seems that par-ticipants were not fluent with symbolic representations of linear functions. It is also possible that graphical representa-tions may have engendered more intuitive, informal problem solving strategies than symbolic representations. When stu-dents lack a strong conceptual understanding, then different external representations can encourage more or less efficient strategies during problem solving (Ainsworth, 2006). For the slope comparison problems in the current study, sym-bolic representation may have led to an erroneous “plug and chug” strategy of substituting random values for x, whereas graphical representation led participants to consider the relationship between the algebraic functions more holisti-cally, which led to greater success. This explanation of the results of this study would be consistent with the findings of Koedinger, Alibali, and Nathan (2008) and Koedinger and Nathan (2004), who found that story problems were easier for students to solve than equivalent problems presented with equations, because story problems were more likely to elicit more appropriate informal strategies.
The results of the current study suggest several directions for future research. One main finding of this study was that students are able to use graphs to solve problems about lin-ear functions. A second important result was that the advan-tage of graphs over equations was most clearly seen on only one problem type. To be able to connect these results based in student performance with previous work based in stu-dent preference, in the future both measures would need to be examined in the same study. Participants in the current study were not given the option to choose a representation for solving the problems as they were in Knuth’s (2000) and Herman’s (2007) studies. It is possible that when students are presented with both representation options they may choose to solve both computation and interpretation problems sym-bolically. Alternatively, students may choose different repre-sentations depending on problem type. There is some prior research that suggests students may change strategies based on task demands (Hall et al., 1989; Huntley, Marcus, Kahan, & Miller, 2007), which supports the prediction that students may choose different representations for computation and interpretation problems.
A second direction for future research is to better under-stand the source of difficulty for slope comparison problems. It is possible that the poor performance on slope comparison problems across both representations in the current study can be attributed to participants misunderstanding the prob-lem demands. That is, the natural language of the scenarios may have prevented them from applying their knowledge of the concept of slope to solving the problems. Participants may have failed to interpret expressions like “who charges
the most per minute” as an indication that they should com-pare the slopes of the lines, or they may have not been able to retrieve the knowledge that the “m” in y = mx + b rep-resents the slope of a line. Follow-up studies are exploring whether performance on slope comparison problems varies depending on whether the problem is presented with natural language corresponding to the problem scenario (the pre-sentation used in the current study) or with language that explicitly references the mathematical concept of slope.
The results of the current study revealed that even college students may struggle with slope. Participants in this study did not seem to have a robust understanding of the concept of slope and how this concept is expressed in different represen-tations. If participants fully understood the concept of slope, then differences in problem solving success due to represen-tation would not have been observed for slope comparison problems. Slope represents a critical conceptual foundation for more advanced problem solving in higher level math-ematics, and, given the results of this study, it is clear that future work on improving problem solving with linear func-tions involving slope is necessary. Some promising instruc-tional techniques that may help students to achieve a more robust understanding of slope include teaching students algebraic concepts by considering multiple representations of a concept (Brenner et al., 1997; Schliemann, Goodrow, & Lara-Roth, 2001). Hattikudur, Sidney, and Alibali (2016, in this issue) found that instruction that encouraged students to compare different problem solving procedures for solving systems of equations led to gains in conceptual understand-ing, particularly for participants who reported not liking mathematics. Although their study did not address the role of graphical versus symbolic representations specifically, it suggests that instructional approaches that encourage com-parison across multiple representations when solving prob-lems could help facilitate deeper conceptual understanding.
references
Ainsworth, S. (2006). DeFT: A conceptual framework for considering learning with multiple representations. Learning and Instruction, 16, 183–198. http://dx.doi .org/10.1016/j.learninstruc.2006.03.001
Bell, A., & Janvier, C. (1981). The interpretation of graphs representing situations. For the Learning of Mathematics, 2, 34–42.
Bieda, K. N., & Nathan, M. J. (2009). Representational dis-fluency in algebra: Evidence from student gestures and speech. ZDM, 41, 637–650. http://dx.doi.org/10.1007 /s11858-009-0198-0
Brenner, M. E., Mayer, R. E., Moseley, B., Brar, T., Duran, R., Reed, B. S., & Webb, D. (1997). Learning by understanding:

docs.lib.purdue.edu/jps 2016 | Volume 9
M. K. Mielicki & J. Wiley When Are Graphs Better Than Equations?
12
The role of multiple representations in learning algebra. American Educational Research Journal, 34, 663–689. http://dx.doi.org/10.3102/00028312034004663
Guthrie, J. T., Weber, S., & Kimmerly, N. (1993). Search-ing documents: Cognitive processes and deficits in understanding graphs, tables, and illustrations. Contem-porary Educational Psychology, 18, 186–221. http://dx.doi .org/10.1006/ceps.1993.1017
Hall, R., Kibler, D., Wenger, E., & Truxaw, C. (1989). Explor-ing the episodic structure of algebra story problem solving. Cognition and Instruction, 6, 223–283. http://dx.doi.org/10.1207/s1532690xci0603_2
Hattikudur, S., Sidney, P. G., & Alibali, M. W. (2016). Does comparing informal and formal procedures promote mathematics learning? The benefits of bridging depend on attitudes toward mathematics. Journal of Problem Solving, 9(1), 13–27.
Herman, M. (2007). What students choose to do and have to say about use of multiple representations in college alge-bra. Journal of Computers in Mathematics & Science Teach-ing, 26, 27–54.
Huntley, M. A., Marcus, R., Kahan, J., & Miller, J. L. (2007). Inves-tigating high-school students’ reasoning strategies when they solve linear equations. Journal of Mathematical Behavior, 26, 115–139. http://dx.doi.org/10.1016/j.jmathb.2007.05.005
Jarosz, A. F., & Wiley, J. (2014). What are the odds? A practical guide to computing and reporting Bayes Fac-tors. Journal of Problem Solving, 7, 2–9. http://dx.doi .org/10.7771/1932-6246.1167
Knuth, E. J. (2000). Student understanding of the Cartesian connection: An exploratory study. Journal for Research in Mathematics Education, 31, 500–507. http://dx.doi .org/10.2307/749655
Koedinger, K., Alibali, M., & Nathan, M. (2008). Trade-offs between grounded and abstract representations: Evi-dence from algebra problem solving. Cognitive Science: A Multidisciplinary Journal, 32, 366–397. http://dx.doi .org/10.1080/03640210701863933
Koedinger, K. R., & Nathan, M. J. (2004). The real story behind story problems: Effects of representations on quantitative
reasoning. Journal of the Learning Sciences, 13, 129–164. http://dx.doi.org/10.1207/s15327809jls1302_1
Leinhardt, G., Zaslavsky, O., & Stein, M. K. (1990). Func-tions, graphs, and graphing: Tasks, learning and teaching. Review of Educational Research, 60, 1–64. http://dx.doi .org/10.3102/00346543060001001
Moschkovich, J., Schoenfeld, A. H., & Arcavi, A. (1993). Aspects of understanding: On multiple perspectives and representations of linear relations and connections among them. In T. A. Romberg, E. Fennema, & T. P. Carpenter (Eds), Integrating research on the graphical representation of functions (pp. 69–100). Hillsdale, NJ: Erlbaum.
Nagle, C., Moore-Russo, D., Viglietti, J., & Martin, K. (2013). Calculus students’ and instructors’ conceptualizations of slope: A comparison across academic levels. International Journal of Science and Mathematics Education, 11, 1491–1515. http://dx.doi.org/10.1007/s10763-013-9411-2
National Council of Teachers of Mathematics (2000). Prin-ciples and standards for school mathematics. Reston, VA: NCTM.
Romberg, T. A., Fennema, E., & Carpenter, T. A. (Eds.). (1993). Integrating research on the graphical representation of functions. Hillsdale, NJ: Erlbaum.
Schliemann, A. D., Goodrow, A., & Lara-Roth, S. (2001). Functions and graphs in third grade. Paper presented at National Council of Teachers of Mathematics (NCTM) Research Pre-session, Orlando, FL.
Stump, S. L. (2001). High school precalculus students’ under-standing of slope as measure. School Science and Mathe-matics, 101, 81–89. http://dx.doi.org/10.1111/j.1949-8594 .2001.tb18009.x
Wagenmakers, E. J. (2007). A practical solution to the perva-sive problems of p values. Psychonomic Bulletin & Review, 14, 779–804. http://dx.doi.org/10.3758/BF03194105
Yerushalmy, M., & Chazan, D. (2002). Flux in school algebra: Curricular change, graphing technology, and research on student learning and teacher knowledge. Handbook of International Research In Mathematics Education (pp. 725–755). Mahwah, NJ: Erlbaum.