Journal of Membrane Science - wetlab.net.technion.ac.il · cross-sections, (ii) water uptake...
12
Investigating the void structure of the polyamide active layers of thin-film composite membranes Lin Lin a , Rene Lopez b , Guy Z. Ramon c , Orlando Coronell a,n a Department of Environmental Sciences and Engineering, Gillings School of Global Public Health, University of North Carolina at Chapel Hill, Chapel Hill, NC 27599-7431, United States b Department of Physics and Astronomy, University of North Carolina at Chapel Hill, Chapel Hill, NC 27599-3255, United States c Department of Civil and Environmental Engineering, Technion – Israel Institute of Technology, Technion City, Haifa, Israel article info Article history: Received 15 May 2015 Received in revised form 10 September 2015 Accepted 11 September 2015 Available online 15 September 2015 Keywords: Reverse osmosis Aromatic polyamide Active layer Voids Nodules abstract The potential presence of voids in the fully-aromatic polyamide active layers of thin-film composite (TFC) membranes for water purification was studied in a selection of commercial membranes with a broad range of performance levels. The membranes were characterized for their potential void fractions using three independent methods: (i) analysis of transmission electron microscopy (TEM) images of membrane cross-sections, (ii) water uptake measurements by quartz crystal microbalance (QCM), and (iii) estimates of the effective refractive indices of active layers by spectroscopic ellipsometry. Results revealed that voids having tens of nanometers in diameter exist in the fully-aromatic polyamide active layers of TFC membranes, the voids fill up with water when immersed in it, and the voids account for a significant volume fraction of the active layers (i.e., 15–32% for the membranes studied). It was concluded that the voids in polyamide active layers do not form passageways connecting the feed and permeate sides, but rather are cavities disconnected from the feed side. In addition, it was also concluded that the globular features observable in TEM images of membrane cross sections that had been previously identified as voids or nodules are indeed voids, and not nodules. The finding that a significant volume fraction of fully- aromatic polyamide active layers corresponds to water-filled voids has deep implications on various aspects of TFC membrane science and technology. For example, we illustrate how the presence of voids can potentially increase the effective water permeability of the active layer by as much as a factor of E5 compared with the case of an equivalent active layer without any voids. The methods developed in this study to measure void volume fraction represent useful tools for future membrane characterization studies, and the void fractions measured can be used as input or calibration parameters in future modeling studies of active layer formation or water and solute transport. & 2015 Elsevier B.V. All rights reserved. 1. Introduction Thin-film composite (TFC) membranes with polyamide active layers are used in a broad range of applications, including water desalination, hardness removal, and water reuse by nanofiltration (NF) and reverse osmosis (RO), and energy production [1–4]. Poly- amide TFC membranes consist of a top ultrathin ( 20–200 nm) polyamide active layer, a microporous polysulfone support ( 20– 50 mm), and a polyester backing layer ( 50–150 mm) [5–7]. The polyamide active layer constitutes the selective barrier to water and solute permeation [5,8], and thus the physical structure of the active layer likely plays an essential role in the water permeability and solute rejection properties of the membranes [9]. The polyamide active layer of TFC membranes has traditionally been assumed to be a dense polymer phase, with pores, if any, no larger than a few nanometers in diameter. This conceptualization of the active layer is reflected in the two mechanistic models commonly used to describe water and solute permeation through polyamide membranes, the solution-diffusion model [10] and the pore-flow model [11]. The solution-diffusion model assumes that the active layer is dense without any pores [10], and the pore-flow model assumes the existence of nanopores (typically cylindrical with a diameter of a few nanometers or less) that stretch across the active layer within an otherwise dense structure [11,12]. Contrary to this conceptualization of the active layer, recent stu- dies [13–16] suggest that globular features visible in cross-sec- tional transmission electron microscopy (TEM) images of mem- brane active layers correspond to voids (i.e., regions without polymer) having tens of nanometers in diameter. It is important to note that the voids suggested in these studies are not the same as Contents lists available at ScienceDirect journal homepage: www.elsevier.com/locate/memsci Journal of Membrane Science http://dx.doi.org/10.1016/j.memsci.2015.09.020 0376-7388/& 2015 Elsevier B.V. All rights reserved. n Corresponding author. Fax: þ1 919 966 7911. E-mail address: [email protected] (O. Coronell). Journal of Membrane Science 497 (2016) 365–376
Transcript of Journal of Membrane Science - wetlab.net.technion.ac.il · cross-sections, (ii) water uptake...
Investigating the void structure of the polyamide active layers ofthin-film composite membranes
Lin Lin a, Rene Lopez b, Guy Z. Ramon c, Orlando Coronell a,na Department of Environmental Sciences and Engineering, Gillings School of Global Public Health, University of North Carolina at Chapel Hill, Chapel Hill, NC27599-7431, United Statesb Department of Physics and Astronomy, University of North Carolina at Chapel Hill, Chapel Hill, NC 27599-3255, United Statesc Department of Civil and Environmental Engineering, Technion – Israel Institute of Technology, Technion City, Haifa, Israel
a r t i c l e i n f o
Article history:Received 15 May 2015Received in revised form10 September 2015Accepted 11 September 2015Available online 15 September 2015
Keywords:Reverse osmosisAromatic polyamideActive layerVoidsNodules
a b s t r a c t
The potential presence of voids in the fully-aromatic polyamide active layers of thin-film composite (TFC)membranes for water purification was studied in a selection of commercial membranes with a broadrange of performance levels. The membranes were characterized for their potential void fractions usingthree independent methods: (i) analysis of transmission electron microscopy (TEM) images of membranecross-sections, (ii) water uptake measurements by quartz crystal microbalance (QCM), and (iii) estimatesof the effective refractive indices of active layers by spectroscopic ellipsometry. Results revealed thatvoids having tens of nanometers in diameter exist in the fully-aromatic polyamide active layers of TFCmembranes, the voids fill up with water when immersed in it, and the voids account for a significantvolume fraction of the active layers (i.e., 15–32% for the membranes studied). It was concluded that thevoids in polyamide active layers do not form passageways connecting the feed and permeate sides, butrather are cavities disconnected from the feed side. In addition, it was also concluded that the globularfeatures observable in TEM images of membrane cross sections that had been previously identified asvoids or nodules are indeed voids, and not nodules. The finding that a significant volume fraction of fully-aromatic polyamide active layers corresponds to water-filled voids has deep implications on variousaspects of TFC membrane science and technology. For example, we illustrate how the presence of voidscan potentially increase the effective water permeability of the active layer by as much as a factor of E5compared with the case of an equivalent active layer without any voids. The methods developed in thisstudy to measure void volume fraction represent useful tools for future membrane characterizationstudies, and the void fractions measured can be used as input or calibration parameters in futuremodeling studies of active layer formation or water and solute transport.
& 2015 Elsevier B.V. All rights reserved.
1. Introduction
Thin-film composite (TFC) membranes with polyamide activelayers are used in a broad range of applications, including waterdesalination, hardness removal, and water reuse by nanofiltration(NF) and reverse osmosis (RO), and energy production [1–4]. Poly-amide TFC membranes consist of a top ultrathin (!20–200 nm)polyamide active layer, a microporous polysulfone support (!20–50 mm), and a polyester backing layer (!50–150 mm) [5–7]. Thepolyamide active layer constitutes the selective barrier to water andsolute permeation [5,8], and thus the physical structure of the activelayer likely plays an essential role in the water permeability andsolute rejection properties of the membranes [9].
The polyamide active layer of TFC membranes has traditionallybeen assumed to be a dense polymer phase, with pores, if any, nolarger than a few nanometers in diameter. This conceptualizationof the active layer is reflected in the two mechanistic modelscommonly used to describe water and solute permeation throughpolyamide membranes, the solution-diffusion model [10] and thepore-flow model [11]. The solution-diffusion model assumes thatthe active layer is dense without any pores [10], and the pore-flowmodel assumes the existence of nanopores (typically cylindricalwith a diameter of a few nanometers or less) that stretch acrossthe active layer within an otherwise dense structure [11,12].Contrary to this conceptualization of the active layer, recent stu-dies [13–16] suggest that globular features visible in cross-sec-tional transmission electron microscopy (TEM) images of mem-brane active layers correspond to voids (i.e., regions withoutpolymer) having tens of nanometers in diameter. It is important tonote that the voids suggested in these studies are not the same as
Contents lists available at ScienceDirect
journal homepage: www.elsevier.com/locate/memsci
Journal of Membrane Science
http://dx.doi.org/10.1016/j.memsci.2015.09.0200376-7388/& 2015 Elsevier B.V. All rights reserved.
n Corresponding author. Fax:þ1 919 966 7911.E-mail address: [email protected] (O. Coronell).
Journal of Membrane Science 497 (2016) 365–376

the pores in the pore-flow model, as the pores in the pore-flowmodel connect the feed side and permeate side of membrane ac-tive layers and have diameters of a few nanometers while thevoids apparently seen in the TEM images do not seem to connectthe feed side and permeate side of membrane active layers andhave diameters of as much as tens of nanometers.
A different interpretation of the globular features observed incross-sectional TEM images of polyamide active layers was proposedby Pacheco et al. [17] who indicated that these features correspondto polymer nodules. Based on TEM images of the active layer of abrackish water reverse osmosis (RO) membrane in which globularfeatures 20–60 nm in size were visible, Pacheco et al. further pro-posed that active layers are composed of a dense nodular base fromwhich the ridge-and-valley structure extends outwards. Similarfeatures to those interpreted as nodules by Pacheco et al. and voidsby others [13–16] are visible in TEM images reported elsewhere [18–20], although they were not identified as nodules or voids.
While there is no agreement in the peer-reviewed literature onwhether the globular features in TEM images discussed here arevoids or dense nodules [21], the features are significantly lighter inshade than the rest of the active layer when bright-field imaging isused [14–20], indicating that they have a lower electron densitythan the surrounding polymer. Therefore, these features are likelyvoids, instead of dense nodules, or correspond to regions of sig-nificantly lower polymer density. The postulation that the featuresare voids is supported by the recent scanning electron microscopy(SEM) work by Yan et al. [22] who reported cross-sectional SEMimages with features interpreted as voids with sizes of tens to overa hundred of nanometers in diameter. The lack of agreement onwhether the globular features are voids or nodules is partially basedon the fact that the only evidence supporting either claim are theelectron microscopy images themselves which may be affected bythe electron beam irradiation during TEM and SEM analysis. If theseglobular features represent a significant volume fraction of the ac-tive layers and are commonly found in fully-aromatic polyamideTFC membranes with a broad range of performance levels, con-firming that they are indeed voids would have important implica-tions for the understanding of transport mechanisms of water andcontaminants through polyamide membranes since, as describedabove, current transport models do not account for voids. Con-firming the existence of voids and measuring the volume fractionthey account for in polyamide active layers would not only providea more accurate understanding of active layer structure but alsoenable a more accurate interpretation of active layer characteriza-tion data, e.g., partition and diffusion coefficients in polyamide. Theconfirmation of the existence of voids as common features in thefully-aromatic polyamide active layers of TFC membranes wouldalso indicate to membrane developers that the voids are an activelayer property that could potentially be targeted for optimizationtowards the development of improved membranes.
Accordingly, the objectives of this study were to evaluate whe-ther (1) the globular features observed in the TEM cross-sectionalimages are in fact voids, (2) voids exist in a broad range of fully-aromatic polyamide TFC membranes, (3) voids account for a sig-nificant volume fraction of the active layers, and (4) voids are filledwith water when the membranes are immersed in it. An additionalobjective was to (5) briefly illustrate some of the implications of theexistence of water-filled voids on broad aspects of RO/NF mem-branes science and technology, with an emphasis on the determi-nation of the water transport properties of polyamide active layers.To accomplish these objectives, a broad range of fully-aromaticpolyamide TFC membranes were studied, the volume fractions ac-counted for by the globular features in the active layers weremeasured by TEM image analyses, and the volume fractions ac-counted for by voids in the active layers were measured using twonon-microscopy techniques – quartz crystal microbalance (QCM)
measurements of water uptake by polyamide active layers andspectroscopic ellipsometry estimates of the refractive indices ofactive layers. The volume fractions obtained for the globular fea-tures through TEM image analyses and voids through QCM andellipsometry analyses were compared to each other. Similar volumefractions obtained with the different analyses methods wouldprovide evidence in support of the hypothesis that the globularfeatures are actually voids, not nodules, as the methods employedare based on completely different physical principles. Furthermore,elemental mapping of membrane cross sections using energy dis-persive X-ray spectroscopy and electron energy loss spectroscopywere also used to evaluate the elemental composition of the glob-ular features so as to ascertain their void or nodular nature. QCMmeasurements also served to assess whether the voids filled upwith water. This study presents experimental results and theircorresponding discussion, as well as the implications of the findingsto the study and development of polyamide TFC membranes.
2. Materials and methods
2.1. Target membranes and sample preparation
Five fully-aromatic polyamide TFC membranes of various per-formance levels were studied: NF90 [23], XLE [24] and SW30HR [25]received as flat sheets in dry state (Dow Filmtec, Minneapolis, MN)and ESPA3 [26] and SWC4þ [27] received as flat sheets in wet state(Hydranautics, Oceanside, CA). ATR-FTIR analyses (see Section S1 inSupplementary Material) indicated that all membranes have aro-matic polyamide active layers and that the active layer of theSW30HR membrane has a coating, which is likely polyvinyl alcohol[28]. Membrane samples were initially prepared as 2.5#5.0 cm2
coupons thoroughly rinsed with and stored in ultrapure water(418 MΩ cm). Before further sample preparation for TEM, QCM,ellipsometry and atomic force microscopy (AFM) analyses, the cou-pons were blot-dried by placing them between two filter papercircles (qualitative grade circles No.1, 9 cm in diameter, Whatman)and applying fingertip pressure [29,30]. Pressure exerted in thismanner is orders of magnitude lower than the pressure that RO/NFmembranes experience during membrane operation in treatmentplants (!100–1200 psi). The coupons were then air dried overnight.
2.2. TEM analyses
For TEM analyses, a membrane sample preparation proceduresimilar to that described by Tang et al. [18] was used. In brief,membrane samples were dehydrated with 100% ethanol, in-filtrated and embedded with LR White resin (London Resin Co.,Reading, UK) diluted in ethanol, cured at 48 °C for 3 days, and cutinto thin (!90–100 nm) slices with a Sorvall MT 6000 Ultra-microtome (RMC Co., Tucson, AR). TEM imaging of membranecross-sections was performed with a JEOL 100CX II TEM (JEOL USA,Peabody, MA) at an acceleration voltage of 80 kV. Three imageswere taken for each membrane studied at magnifications of29,000# or 72,000# depending on the thickness of the activelayers. Control TEM images were obtained for SWC4þ membranesamples dried using supercritical CO2 drying, which confirmedthat air/ethanol drying did not affect the active layer structure (seeSection S2 in Supplementary Material).
2.3. Scanning transmission electron microscopy-energy dispersiveX-ray spectroscopy (STEM-EDS) and electron energy loss spectro-scopy (STEM-EELS) analyses
Membrane sample preparation and sectioning for STEM-EDSand STEM-EELS analyses were performed in the same manner as
L. Lin et al. / Journal of Membrane Science 497 (2016) 365–376366

for TEM analyses. STEM-EDS and STEM-EELS analyses of SWC4þmembrane samples were performed with an aberration correctedscanning transmission electron microscope (STEM) FEI Titan (FEI,Houston, TX) at an acceleration voltage of 200 kV and magnifica-tion of 80,000# . The Titan was equipped with a SuperX EDSsystem with four Bruker silicon drift detectors (Bruker AXS, Ma-dison, WI) and a Gatan Enfinium spectrometer with high-speedspectrum imaging (Gatan Inc., Pleasanton, CA). Multiple locationson SWC4þ sample cross-sections were analyzed.
2.4. SEM analyses
Membrane coupons were removed from the ultrapure waterand gently shaken twice to remove excess water. Next, the sam-ples were immersed in liquid nitrogen for 30 s, taken out andcracked in air. Secondary electron SEM imaging of membranecross-sections was performed with a FEI Helios 600 Nanolab DualBeam System after the samples were coated with a thin film(o5 nm) of Au (60%):Pd (40%) (Ted Pella, Redding, CA) using aCressington 108 Auto Sputter Coater (Cressington Scientific In-struments, Watford, UK). Triplicate images were taken for eachmembrane studied at magnifications of 40,000# , 60,000# or80,000# depending on the thickness of the active layers.
2.5. Active layer isolation
Membrane active layers were isolated onto gold-coated QCMsensors and silicon wafers for ellipsometry and AFM analyses. Theactive layer isolation procedure was similar to that described inour previous study [31], is based on a protocol previously reportedby Freger [32], has been successfully used by various researchgroups [7,17,22], and has been shown not to affect physico-che-mical and transport properties of the active layer [31,33]. Briefly,the membrane polyester backing was peeled off by hand leavingbehind a composite of the polyamide active layer and polysulfonesupport layer. Next, the polyamide–polysulfone composite wasplaced on a clean sensor/wafer, with the active layer facing thesensor/wafer and the sensor/wafer resting on top of a customizedstainless steel support. A matching customized stainless steelframe with an open window in the center was used to secure thecomposite and sensor/wafer to the metal support. Then, di-methylformamide (DMF) (Fisher Scientific, Pittsburgh, PA) wasadded in a dropwise manner through the metal frame window todissolve the polysulfone layer and the DMF-polysulfone solutionwas discarded after 1 min. This process was repeated 15 times,after which the assembly was air dried. Next, the sensor/waferwith the active layer already isolated onto it was removed fromthe metal assembly and the isolated active layer was left in airovernight for further drying. In order to remove any polysulfoneremaining on the sample, the sensor/wafer coated with the activelayer was dipped in fresh DMF for 4 h and air dried overnight. Thesample was finally rinsed with ultrapure water and gently driedwith ultrapure nitrogen gas. Any potential gaps created betweenthe isolated active layers and sensor/wafer surfaces due to theroughness of the membrane surface were shown not to affect theactive layer void fractions estimated from QCM and ellipsometryanalyses (see Section S6 in Supplementary Material).
2.6. QCM analyses
A Q-Sense E4 QCM (Biolin Scientific, Lithicum Heights, MD) wasused to measure the areal mass (ng cm$2) of active layer polymerisolated on QCM sensors and the areal mass of water absorbed byactive layers. For each membrane, we tested two samples, eachwith an area of 1.54 cm2, and for each sample we conducted du-plicate measurements of water sorption in each liquid and vapor
environments. The mass of active layer isolated on a sensor (mAL)was obtained as described in our previous study [31] from thedifference in QCM response between the uncoated sensor and thesensor coated with the active layer. Active layer mass measure-ments were performed with the sensors placed in Q-Sense flowmodules (Biolin Scientific, Lithicum Heights, MD), which are de-picted in Fig. 1a. During measurements the sensors were exposedto air in the absence of flow.
Water uptake in liquid environment (ml) was obtained from thedifference in QCM response to the coated sensor exposed to drynitrogen (o0.02% relative humidity-RH) and to ultrapure water.Measurements were performed with the sensors placed inQ-Sense flow modules (see Fig. 1a). During measurements withliquid water, the surface of the sensors was in direct contact withthe water. The water flow rate (0.1 mL min$1) was adjusted toensure laminar conditions and negligible disturbance of the sen-sor. Each of the dry nitrogen gas and liquid water streams wereallowed to flow until the system reached equilibrium (typically10–20 min), as indicated by a rate of change in areal mass lowerthan 3.6 ng cm$2 min$1. This parameter was chosen as an in-dicator of equilibrium for water uptake tests with both liquidwater and humidified nitrogen gas because 3.6 ng cm$2 min$1 is2–3 orders of magnitude lower than the rates of change in arealmass measured in the first few minutes of exposure of the activelayers to either fluid, and because 3.6 ng cm$2 corresponds too0.08% and o0.2% of the water sorption values measured underliquid water and humidified nitrogen, respectively. Water sorptionin vapor environment (mv) was obtained from the difference inQCM response to the coated sensor exposed to dry nitrogen and tohumidified nitrogen gas at 96% RH. Measurements were per-formed with the sensors placed in Q-Sense humidity modules
GORETM membrane
inner chamber
QCM sensor isolated active layerelectrodes
o-rings
dry nitrogen or liquid water
dry or humidified nitrogen
outer chamber
dry nitrogen or liquid water
QCM sensor isolated active layerelectrodes
o-rings
yx
z
Fig. 1. Schematic of a cross section of the quartz crystal microbalance (QCM)modules used for water uptake tests. (a) Flow module for measurement of wateruptake by active layers when exposed to liquid water. The flow module was alsoused for measurement of active layer mass with the sensors exposed to air in theabsence of flow. (b) Humidity module for measurement of water uptake by activelayers when exposed to humidified nitrogen gas. The schematics are not to scale. Inthe schematics, the positioning of the inlet and outlet channels of the modules havebeen slightly modified for clarity; in reality they are located on the same xy plane.
L. Lin et al. / Journal of Membrane Science 497 (2016) 365–376 367
(Biolin Scientific, Lithicum Heights, MD), which are depicted inFig. 1b. The humidity modules had two chambers separated by aGORETM membrane (W.L. Gore & Associates, Newark, DE). Whilethe dry and humidified nitrogen streams flowed through the‘outer’ chamber (o0.1 psi), the sensor surface was in contact withthe ‘inner’ chamber. Each of the dry and 96% RH nitrogen streamswere allowed to flow through the outer chamber until the outerchamber-inner chamber-active layer system reached equilibrium,as indicated by our indicator of equilibrium described above, i.e., arate of change in areal mass lower than 3.6 ng cm$2 min$1. The96% RH level in the nitrogen stream was achieved by flowing drynitrogen through cylinders filled with water and verifying therelative humidity of the exit stream with a humidity meter. Hu-midified nitrogen gas at 96% RH was used to prevent water con-densation during experiments (i.e., at 96% RH, dew point is 21 °C).
In all cases, an uncoated control sensor was exposed in parallelto the same liquids or gases as the coated sensors to account forchanges in the response of the QCM due to variations in theviscosity and density of the fluid to which the sensor was exposed,as well as to surface adsorption to the sensor and isolated activelayer [31,34,35]. In other words, the measurements obtained withthe control bare sensor were always subtracted from those ob-tained with the isolated active layer sample (e.g., ml ormv¼apparent mass increase in active layer sample – apparentmass increase in control bare sensor). All experiments were per-formed at a temperature of 2270.05 °C using the temperaturecontrol feature of the QCM.
2.7. Ellipsometry analyses
The refractive indices of the membrane active layers were ob-tained using spectroscopic ellipsometry. Samples consisted of ac-tive layers isolated on silicon wafers. In spectroscopic ellipsometry,the relative amplitude and phase changes between two orthogonalpolarizations of a light beam reflected off the sample under studyare measured as a function of light wavelength and incidenceangle. This information is then fitted to an electromagnetic modelof the sample, leaving the unknown properties or geometricalfeatures (in this case the active layer refractive index and thick-ness) as adjustable parameters. The particular way in which therefractive index is a function of the light wavelength is referred toas “dispersion formulae”. “Cauchy” formulae is the simplest dis-persion used, and it is particularly suitable to describe the opticalproperties of weakly absorbing materials [36] such as varioustransparent polymers [37–39]. Therefore, our complete modelused to fit the ellipsometric data consisted of a 3-layer structurehaving a Cauchy layer at the surface representing the active layer,an intermediate 2-nm silicon dioxide layer [40], and 1 mm siliconsubstrate. Triplicate samples were analyzed for each membrane,and three locations (0.3 cm2 each) were analyzed in each sampleusing a variable angle spectroscopic ellipsometer (J.A. WoollamCo., Lincoln, NE). Data acquisition was performed at incidenceangles of 65°, 70° and 75° and wavelength range of 380–1000 nmusing the Autoretarder feature. Data analysis was performed usingthe software WVASEs (J.A. Woollam Co.). Cauchy dispersion for-mulae [36] were used to describe the optical properties of thepolymer layer by selecting the appropriate option in the WVASEs
software whose database also contains the well-known opticalconstants for silicon and silicon dioxide. The refractive index andthickness of the active layers were obtained with the WVASEs
software by fitting the data to the model until a minimized meansquared error of less than 20 was reached. This relatively lowmean squared error resulted in model simulations matching theexperimental data (see representative fitted data in Section S3 inSupplementary material), therefore indicating that the Cauchyformulae described well the data.
2.8. AFM analyses
Active layer thickness was characterized with an Asylum Re-search MFP-3D AFM (Santa Barbara, CA) and Tap300Al tips (Bud-getSensors, Sofia, Bulgaria) in tapping mode, using a proceduresimilar to that described by Freger [32]. Briefly, active layers iso-lated on silicon wafers were gently scratched with a sharp razor toexpose the surface of the wafer and obtain multiple polyamidethin strips. AFM analysis was then used to obtain topographyprofiles of the thin strips covering areas approximately30#30 mm2 in size. The topography profiles allowed the de-termination of the average thickness of the isolated polyamidefilm from the difference of the average height of the polyamidesurface and the average height of the silicon wafer surface. Whilewe did not detect any polyamide rolling up or separation from thesubstrate, to avoid any potential confounding edge effects, we didnot use in the calculations the data from E6 μm wide bands ofpolymer and substrate next to either edge of the film strips. Tri-plicate samples of each membrane were analyzed.
2.9. Water permeation tests
Permeation experiments were performed in duplicate for eachmembrane using a SterlitechTM (Kent, WA) HP4750 dead-endstirred filtration system (14.6 cm2 effective membrane area) op-erated with ultrapure water at 2072 °C and a transmembranepressure (ΔP) of 0.67 MPa. Permeate volume was measured usingan electronic balance and filtration time using a stopwatch until astabilized water flux (Jv, m s$1) was reached. Under the frame-work of solution-diffusion theory [10], the water permeability ofthe active layers was quantified by the water permeability coeffi-cient (A, m s$1 Pa$1) as calculated from
J A P , 1v π= (Δ − Δ ) ( )
where Δπ (Pa) is the transmembrane osmotic pressure whichwas zero in our experiments.
3. Results and discussion
3.1. Presence of globular features in active layers
Fig. 2 shows representative cross-sectional bright-field TEMand SEM images of the NF90, ESPA3 and SWC4þ membranes.Similar images (not shown) were obtained for the XLE andSW30HR membranes. For each membrane, the region corre-sponding to the active layer is outlined in red dotted lines. For allmembranes, the TEM images show well-defined globular features,lighter in color than the surrounding polyamide, similar to thefeatures identified as voids [13–16] and nodules [17] in the lit-erature. The grayscale contrast between any two regions in TEMimages is produced by the difference in the amount of electrons ofthe analysis beam that pass through the two regions of the sample[41]. Areas with lower electron density (i.e., fewer or smalleratoms) allow for the transmission of a higher number of electronsof the analysis beam, resulting in corresponding lighter imageareas in bright-field TEM images. Thus, the significantly lightercolor of the globular features with respect to the surroundingpolymer indicates that they either are voids or correspond to re-gions with a significantly lower polymer density than the sur-rounding polyamide.
The color contrast in the secondary electron SEM images inFig. 2 provides an indication of the cross-sectional topology of themembrane samples [41]. Dark areas correspond to depressions(from where secondary electrons generated cannot reach the
L. Lin et al. / Journal of Membrane Science 497 (2016) 365–376368

detector), which are indicative of the existence of voids in theactive layer. The SEM images in Fig. 2 are consistent with thosereported by Yan et al. [22] and show that the active layer crosssections feature distinct depressions of similar size as the globularfeatures observed in the TEM images. This supports the postula-tion that the active layers are not continuous dense polymer films,but rather have voids in them. Thus, the TEM and SEM evidencetogether indicate that the active layer globular features identifiedas voids by some [13–16,22] and nodules by others [17] commonlyexist in polyamide RO and NF membranes of a broad performancerange.
3.2. Volume fraction of active layer occupied by globular features fromTEM image analyses
Image analysis of the TEM micrographs was performed in orderto estimate the volume fractions of the active layers occupied bythe globular features. For each TEM image, the software ImageJ1.47 v [42] was used to obtain the area of the active layer and thearea of the globular features. The areal fraction of the active layeroccupied by the features in a given image ( f feature i
areal, ) was calculated
as the ratio between the total features area and the total activelayer area. It was assumed that for any given membrane, the
LR White resin
Polysulfone
c d Polyamide
Polysulfone
LR White resin
f Polyamide
Polysulfone
b
Polysulfone
a
Nodules/voids
Top film
Polysulfone
LR White resin
0.5 µm
0.5 µm
0.5 µm
0.5 µm
0.5 µm
Voids Polyamide
Polysulfone
e 0.5 µm
Fig. 2. Cross-sectional TEM and SEM images of samples of the (a,b) NF90, (c,d) ESPA3, and (e,f) SWC4þ membranes. For any given membrane, the TEM and SEM images donot correspond to the exact same cross section. The perimeter of the active layers of all membranes is outlined in red dotted lines, and the active layers are labeled in the SEMimages. Examples of globular features (i.e., nodules/voids) in the active layers are indicated by arrows for the NF90 membrane. The nodules/voids are also visible in theimages of the ESPA3 and SWC4þ membranes. The active layer “top film” is illustrated in the image of the NF90 membrane. The top film refers to the dense (i.e., withoutvoids) active layer region delimited by the active layer surface and the first set of voids from the surface (yellow dotted line). (For interpretation of the references to color inthis figure legend, the reader is referred to the web version of this article.)
L. Lin et al. / Journal of Membrane Science 497 (2016) 365–376 369
average areal fraction occupied by the features obtained from ar-bitrary 2D TEM images was representative of the corresponding3D volume fraction ( f feature
volume) as given by
fm
f1 ,2feature
volume
i
m
feature iareal
1,∑= ( )
( )=
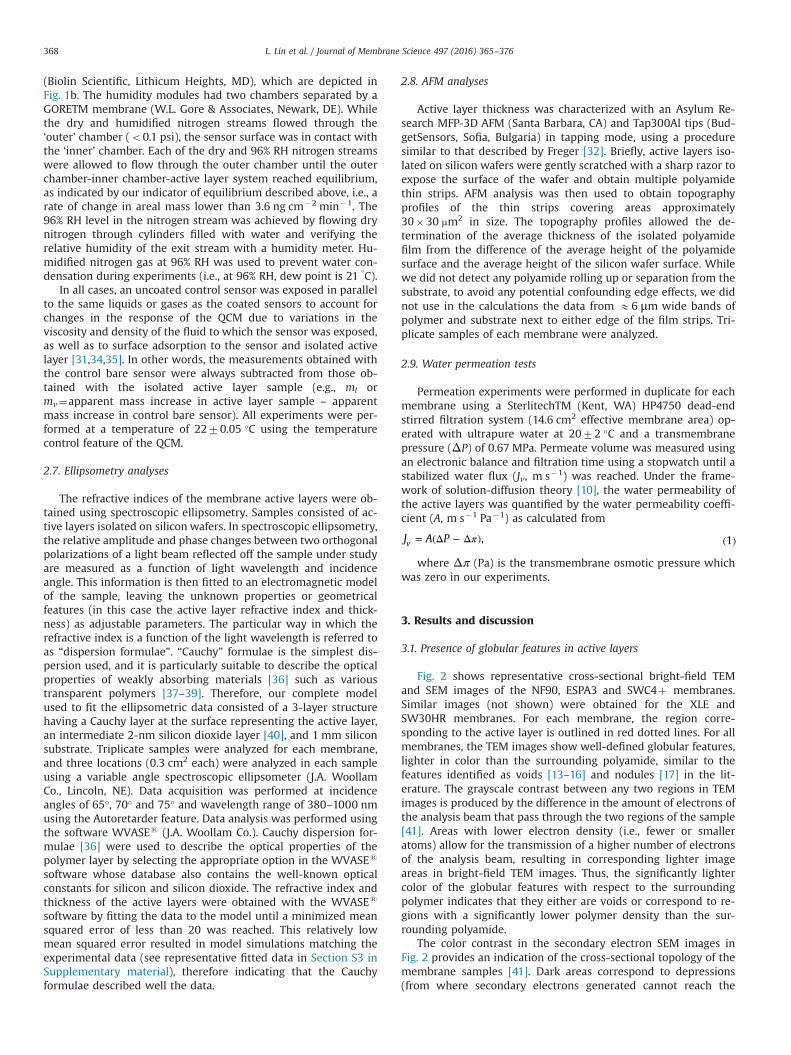
where m corresponds to the number of TEM images analyzed.The features volume fractions calculated using this approach areshown in Fig. 3 as empty bars and were all in the 27–32% range. Ananalysis of variance (ANOVA) F-test of the results indicates that,with a 95% confidence level, all features volume fractions are notstatistically different from each other. SEM images were not used
to obtain the void fractions because: (1) the cut to obtain the crosssections for SEM (i.e., liquid nitrogen freezing followed by break-age by hand) is not controlled or clean as it is for TEM (i.e., ul-tramicrotome cut), and (2) it is a very subjective task to distinguishthe polyamide and void regions that are on the focus plane of theSEM image from those that are also visible in the image but are afew/several nanometers behind or before the focus plane.
3.3. Void volume fraction from water uptake measurements
Table 1 presents the results for water uptake (ng cm$2) byactive layers when exposed to ultrapure water and humidifiednitrogen gas at 96% RH. The results show that for all membranes,water uptake was significantly larger (2–5 fold) when the activelayer was exposed to liquid water than when it was exposed tohumidified nitrogen gas. In terms of thermodynamic equilibrium,if the active layer were a dense polymer phase, the water uptakeby the active layer should be the same when exposed to liquidwater as when exposed to humidified nitrogen gas at 100% RH(and, by extension, very similar to when exposed to humidifiednitrogen gas at 96% RH). This is because both environments re-present a water activity of E1 outside the active layer, and ther-modynamics indicates that it is the water activity outside the ac-tive layer, not the water state (i.e., liquid or vapor), that determinesthe activity of water inside the active layer (see detailed thermo-dynamic discussion in Section S4 in Supplementary Material). Forthis reason, other researchers in previous studies [7,43] have alsoperformed water sorption experiments with humidified inert ga-ses at water vapor activities near unity (i.e., 95% RH or 0.95 wateractivity). The differences observed between the mass changesmeasured under humidified nitrogen gas and under liquid waterwere not of a kinetic nature because we ensured that equilibriumwas reached for each measurement as detailed in Section 2.6.Thus, the different water uptake results in Table 1 with liquidwater from those with humidified nitrogen gas indicate that theactive layers are not dense polymer films.
The larger water uptake from the liquid phase compared withthat from the humidified nitrogen gas phase can be explained bythe existence of permeable voids within the active layer as de-picted in Fig. 4. From thermodynamics, when the active layerswere exposed to humidified nitrogen gas, both water and nitrogenpartitioned into the polyamide phase and saturated the voids.Nitrogen mass uptake by polyamide was negligible because thebaseline readings were performed with the active layers exposedto pure dry nitrogen, and the partial pressure (i.e., activity) of ni-trogen in humidified nitrogen gas at 96% RH (98,680 Pa) is only2.6% lower than the partial pressure of nitrogen in pure dry
MembranesNF90 XLE ESPA3 SWC4+ SW30HR
Feat
ure
or v
oid
fract
ion
(-)
0.0
0.2
0.4
0.6
0.8
1.0ffeature from TEMfvoid from water uptakefvoid from refractive index, parallel modelfvoid from refractive index, series model
Fig. 3. Feature volume fractions ( f featurevolume) and void volume fractions (fvoid) in the
active layers of five commercial polyamide thin-film composite membranes. Fea-ture volume fractions (empty bars) were obtained from analyses of TEM cross-sectional images. Void volume fractions were obtained using (i) water uptakemeasurements with a QCM and Eq. (3) (blue brick bars), and (ii) refractive indexestimates by spectroscopic ellipsometry and Eq. (4) (parallel model, solid red bars)and 5 (series model, cross hatched yellow bars). For each membrane, the reportedvalues were obtained as follows. The feature volume fraction corresponds to theaverage of the values obtained for triplicate images. The void volume fraction fromwater uptake measurements corresponds to the average of the values obtained forduplicate samples (1.54 cm2 each), where duplicate measurements were taken ineach sample. The void fraction from refractive index measurements corresponds tothe average of the values obtained for triplicate samples, where three locations(0.3 cm2 each) were analyzed in each sample. The error bars for the feature volumefractions represent standard deviation. All other error bars represent the propa-gated error obtained in calculations using the uncertainties in Table 1. (For inter-pretation of the references to color in this figure legend, the reader is referred tothe web version of this article.)
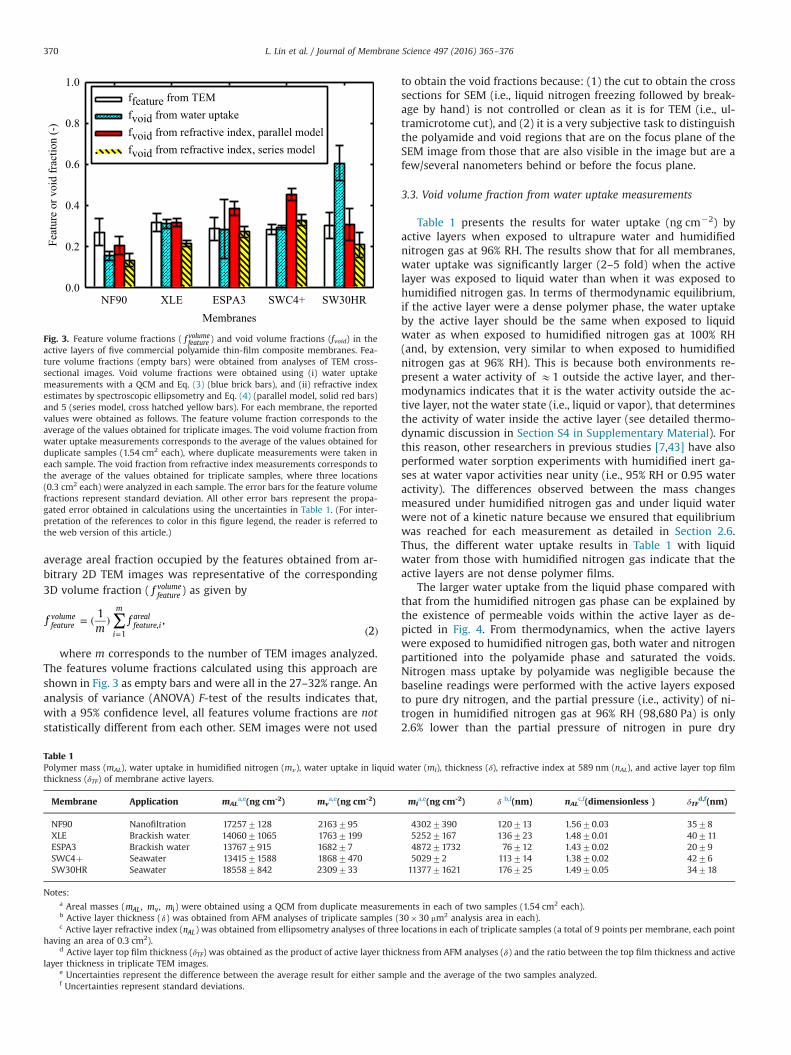
Table 1Polymer mass (mAL), water uptake in humidified nitrogen (mv), water uptake in liquid water (ml), thickness (δ), refractive index at 589 nm (nAL), and active layer top filmthickness (δTF) of membrane active layers.
Membrane Application mALa,e(ng cm-2) mv
a,e(ng cm-2) mla,e(ng cm-2) δ b,f(nm) nAL
c,f(dimensionless ) δTFd,f(nm)
NF90 Nanofiltration 172577128 2163795 43027390 120713 1.5670.03 3578XLE Brackish water 1406071065 17637199 52527167 136723 1.4870.01 40711ESPA3 Brackish water 137677915 168277 487271732 76712 1.4370.02 2079SWC4þ Seawater 1341571588 18687470 502972 113714 1.3870.02 4276SW30HR Seawater 185587842 2309733 1137771621 176725 1.4970.05 34718
Notes:a Areal masses (m m m, ,AL v l) were obtained using a QCM from duplicate measurements in each of two samples (1.54 cm2 each).b Active layer thickness (δ) was obtained from AFM analyses of triplicate samples (30#30 mm2 analysis area in each).c Active layer refractive index (nAL) was obtained from ellipsometry analyses of three locations in each of triplicate samples (a total of 9 points per membrane, each point
having an area of 0.3 cm2).d Active layer top film thickness (δTF) was obtained as the product of active layer thickness from AFM analyses (δ) and the ratio between the top film thickness and active
layer thickness in triplicate TEM images.e Uncertainties represent the difference between the average result for either sample and the average of the two samples analyzed.f Uncertainties represent standard deviations.
L. Lin et al. / Journal of Membrane Science 497 (2016) 365–376370

nitrogen (101,325 Pa). Likewise, humidified nitrogen uptake by thevoids contributed a negligible mass increase because the densitiesof dry (1157 Kg m$3) and humidified (1146 Kg m$3) nitrogen gasare within 1% of each other (see calculation of densities in SectionS5 in Supplementary material). Therefore, given that the nitrogenmass uptake by polyamide and humidified nitrogen gas massuptake by the voids were negligible, then the mass increasemeasured during tests with humidified nitrogen gas correspondsto the mass uptake associated with water uptake by polyamide(mv).
As discussed above, water uptake by the polyamide was ex-pected to be the same when the active layers were exposed toliquid water as when they were exposed to humidified nitrogengas. However, since polyamide is permeable to water, exposure ofthe active layers to liquid water would also result in water fillingthe voids. The total mass uptake measured during tests with liquidwater (ml) can therefore be used to calculate the mass uptakeassociated with the liquid water that filled the voids as ml$mv.Then the water uptake measurements can be used to calculate thevoid fraction in active layers (fvoid) using the expression
fm m
mtotal void volume
active layer volume,
3l v
wvoid
AL
AL
ρρ= =
( − )( )
where ml (ng cm$2) and mv (ng cm$2) correspond to the watermass uptake when active layers were exposed to liquid water andhumidified nitrogen, respectively, and mAL (ng cm$2),ρAL¼1.24 g cm$3 [43,44], and ρw¼1.0 g cm$3 are the active layerpolymer mass, effective active layer density (i.e., polymer mass pertotal active layer volume including polymer and voids), and waterdensity, respectively. Notice that the thickness of the active layersample analyzed is accounted for by the mAL/ρAL ratio.
Void fractions of the active layers studied were calculated usingEq. (3) and the corresponding results are presented in Fig. 3 as(blue) brick bars. The volume fractions occupied by the globularfeatures obtained from TEM image analysis and the void fractionscalculated from water uptake measurements were comparedthrough Welch's t-tests. Results show that, with a 95% confidencelevel, the features volume fractions and void fractions are sig-nificantly different only for the SW30HR membrane. For the otherfour membranes, the features volume fractions and void fractions
are statistically the same. It is not known why the SW30HR voidfraction obtained fromwater uptake measurements is significantlylarger than the features volume fraction obtained from TEM imageanalyses, but it is reasonable to speculate that it may be related tothe PVA coating in its active layer. SW30HR is the only membranetested that had a coating, and PVA (the coating material) has asignificantly higher water absorption (30 wt% [45]) compared tofully-aromatic polyamide (11–20 wt% in the literature [7,43] and12–14 wt% in this study). Nevertheless, the agreement betweenthe features volume fractions obtained from TEM image analysesand the void fractions obtained from water uptake measurementsfor all active layers made of only polyamide indicates that theglobular features are likely voids, not dense nodules.
Our calculations of void fraction using water uptake measure-ments have the following uncertainties. In Eq. (3), it is assumedthat the swelling of active layers in liquid water is the same as inwater vapor. While there is no reason to believe that this is not thecase, even in the worst-case scenario where no swelling occurredunder humidified nitrogen gas but swelling under liquid waterwere in the 2–35% range reported in the literature for aromaticpolyamide active layers [32,46], the error in the void fractionsestimated with Eq. (3) would be at most 35%. Also, a fraction of themass increase measured during water uptake tests in both liquidand humidified nitrogen gas may correspond to the adsorption ofwater at the external surface of the isolated active layer sample;however, a monolayer of water adsorbed at the external surface(E30 ng cm$2) would account for E0.6% and E1.5% of themeasured water uptake in tests with liquid water and humidifiednitrogen gas, respectively. Note that the use of a control baresensor exposed to the same liquids and gases to which the isolatedactive layer samples were exposed, served to minimize the un-certainties associated with water adsorption to the polyamidesurface. Similarly, during measurements with humidified nitrogengas, capillary condensation may occur in voids having a sizesmaller than the critical diameter, which was estimated as 30 nm(see Section S7 in Supplementary Material) [47,48]. Based on thesize distribution of voids in active layers obtained from TEMimages, we estimated that if the kinetics of capillary condensationwere such that it occurred to its maximum extent during thetimescale of our tests, the fraction of mv that would be accountedfor by capillary condensation would be in the 0–20% range (i.e., 8%,5%, 20%, 0%, and 5% for the active layers of NF90, XLE, ESPA3,SWC4þ , and SW30HR membranes, respectively). This results in amaximum uncertainty -due to capillary condensation- in the fvoidvalues calculated with Eq. (3) in the 0–7% range (i.e., 4%, 2%, 7%, 0%,and 1% for the active layers of NF90, XLE, ESPA3, SWC4þ , andSW30HR membranes, respectively).
Overall, the factor to most likely contribute to uncertainty inour calculations of void fraction with Eq. (3) is capillary con-densation, which as discussed above is expected to result in anuncertainty of less than 10%. Importantly, we note that capillarycondensation can only lead to an underestimation of fvoid (as mv
would be overestimated in Eq. (3)). Therefore, even under theuncertainty of possible occurrence of capillary condensation, theresults underscore that voids do account for a significant fractionof the volume of active layers.
3.4. Elemental mapping of active layer cross sections
To further evaluate the void nature of the globular features,STEM-EDS and STEM-EELS analyses of SWC4þ membrane cross-sections were performed. Fig. 5 shows a representative dark-fieldSTEM image (left), and corresponding nitrogen and sulfur (middle)and carbon (right) STEM-EDS mappings. In the dark-field STEMimage, the globules appear as darker regions compared to thesurrounding polymer. In the STEM-EDS elemental mappings, dark
Dry polyamide active layer
Liquid waterWater vapor
Substrate Substrate
Substrate
Potential gap between polyamide and substrate
Void
Fig. 4. Illustration of an isolated polyamide active layer when exposed to dry ni-trogen (top), water vapor via humidified nitrogen gas (bottom left) and liquid water(bottom right). When the active layer is exposed to humidified nitrogen gas, ni-trogen and water partition into the polyamide phase and the voids saturate withhumidified nitrogen. In contrast, when the active layer is exposed to liquid water,water partitions into the polyamide phase and bulk water, not humidified gas, fillsthe voids within the active layer. Any potential gaps existing between the isolatedactive layers and sensor surfaces due to the roughness of the active layer wereshown to not affect the active layer void fractions estimated from QCM and ellip-sometry analyses. The figure depicts the active layer under the assumption of nointerconnectivity between voids, though some void interconnectivity and/or con-nectivity between voids and the backside of the active layer may exist (see Section3.5).
L. Lin et al. / Journal of Membrane Science 497 (2016) 365–376 371

regions within the red and blue areas correspond to regions wherenitrogen content and carbon content, respectively, are significantlylower (or absent) compared to the surrounding polyamide. Similarobservations were made in STEM-EELS images (see Fig. 6).Therefore, STEM-EDS/EELS images confirm that the globular fea-tures are voids or have significantly lower polymer density com-pared to the surrounding polyamide.
3.5. Void fraction from refractive indicesTable 1 presents the refractive indices at a light wavelength of
589 nm obtained for the active layers studied by spectroscopicellipsometry. Assuming that the active layers have voids in them,as supported by the TEM, STEM-EDS/EELS, SEM and QCM resultsabove, one can conceptualize the active layers as a compositehaving polyamide as the continuous phase and voids as the in-clusions that make up the dispersed phase. Therefore, the re-fractive index measured by ellipsometry constitutes the effectiverefractive index of the active layer (nAL) and can be related to therefractive indices of polyamide at 589 nm (npolymer ¼1.70) [49] andair (nvoid ¼1) [50] filling the voids using effective-medium ap-proximation (EMA) models [51].
EMA models treat heterogeneous media as a homogeneousmedium with some effective properties. For the case of a solid-air
composite like dry polyamide active layers, the effective properties(e.g., refractive index) are assumed to be independent of the het-erogeneity of void size, void size distribution, and spatial dis-tribution of voids. Two of the most commonly used EMA modelsfor the calculation of effective refractive indices are the paralleland series models given by [51]
n f n f n1 , 4AL void polymer void void=( − ) + ( )
and
nf
nf
n1 1
,5AL
void
polymer
void
void=
−+
( )
respectively. These two models cover a wide range of thevariability among the refractive index values obtained using thedifferent existing EMA models, with the parallel and series modelsgiving values in the higher and lower ends of the spectrum, re-spectively [51].
Two other EMA models that are also often used to describe theeffective refractive index of interspersed phases are the Maxwell-Garnett and the Bruggeman models [51]. These models assume anarrangement of spheroidal inclusions in the continuous phase, andtherefore -from a geometrical perspective- may be consideredmore appropriate for randomly interspersed phases such aspolyamide active layers. Our calculations showed that the voidfractions calculated using the parallel, Maxwell-Garnett, andBruggeman models were not statistically significantly differentfrom each other (see Section S8 in Supplementary Material). Assuch, we use in our subsequent discussion the fvoid values calcu-lated with the parallel and series models. The corresponding re-sults are presented in Fig. 3 and show that the models providesimilar results when the refractive indices of the continuous anddisperse phases are close, such as in our case. We also note that itis not immediately clear which EMA model best describes anyparticular sample, partly because all models have limitations andthere are more than geometrical considerations in their develop-ment (e.g., the Maxwell-Garnett and Bruggeman models wereinitially developed to describe the effective dielectric constant ofan interspersed phase, not the effective refractive index, thus in-clusions must be significantly smaller than the wavelength of lightand be fairly separated) [51].
Welch's t-tests (95% confidence level) were performed com-paring the void fractions obtained from ellipsometry analysesusing the parallel and series models to the features volume
100 nm 100 nm100 nm
Fig. 5. Representative dark-field STEM image (left), and corresponding nitrogen (red) and sulfur (green) STEM-EDS mappings (middle), and carbon (blue) STEM-EDSmapping (right), of a cross section of the active layer of a SWC4þ RO membrane sample. The dark areas within the white (left), red (middle) and blue (right) areascorrespond to localized regions where polymer, nitrogen and carbon content, respectively, are significantly lower (or absent) compared to the surrounding polyamide,therefore indicating the presence of a void. In the middle panel, the trace sulfur signal in the polyamide region and trace nitrogen signal in the sulfur region correspond tobackground signal of the EDS caused by bremsstrahlung radiation. (For interpretation of the references to color in this figure legend, the reader is referred to the web versionof this article.)
Polyamide
Void (dark area)
Polysulfone
Polyamide
Resin
100 nm20nm
Fig. 6. Representative dark-field STEM image (left) and corresponding nitrogenSTEM-EELS mapping (right) of a cross-section of the active layer of a SWC4þ ROmembrane sample. The red area in the EELS mapping corresponds to regionscontaining nitrogen which is present in polyamide. The dark area within the redarea corresponds to a localized region where nitrogen content is significantly lower(or absent) compared to the surrounding polyamide, therefore indicating the pre-sence of a void. (For interpretation of the references to color in this figure legend,the reader is referred to the web version of this article.)
L. Lin et al. / Journal of Membrane Science 497 (2016) 365–376372
fractions obtained from TEM analyses and the void fractions ob-tained from water uptake measurements. Results showed that forall possible comparisons (i.e., fvoid from series model versus f feature
volume
from TEM results, fvoid from parallel model versus fvoid from QCMresults, etc.), only one of the membranes (SWC4þ) studied had avoid fraction obtained from refractive index values that was sta-tistically different from the features volume fraction obtained fromTEM images or the void fraction obtained from water uptake tests.The agreement between ellipsometry, TEM and QCM results fur-ther supports the existence of voids in the active layers as well asthe void nature of the globular features.
3.6. Size and interconnectivity of voids
The existence of voids with diameters 41 nm (including4100 nm) is directly supported by the TEM [13–20] and SEM[13,22] images reported elsewhere, as well as the TEM, STEM-EDS/EELS and SEM images reported in this study. Given that RO/NFmembranes have high levels of sodium chloride rejection (i.e.,485% for NF90 [23] and 499% for all others [24–27]), the existenceof voids larger than 1 nm in their active layers indicates that if thevoids are interconnected, then the interconnectivity is such that thevoids do not form passageways from the feed side to the permeateside. This conclusion is supported by the TEM images in this andother studies [13–20] which show clearly defined voids but notclearly defined passageways from the feed to the permeate side. Thelack of interconnectivity between the voids and the feed side is alsosupported by TEM images in the literature [17,18,52], which showthat the filtration of aqueous solutions containing natural organicmatter and 10–30 nm gold nanoparticles resulted in natural organicmatter and nanoparticle deposition on the active layer surface, notinside the active layer. Finally, note that the absence of connectivitybetween the voids and the feed side does not exclude the possibilityof some level of interconnectivity between voids. SEM images re-ported by Yan et al. [22] suggest that there is some level of inter-connectivity between the voids, and potentially between the voidsand the backside of the active layer, but not between the voids andthe feed side. Comprehensive characterization of the topology ofthe voids in polyamide active layer, in particular of the inter-connectivity between voids, requires further research and is beyondthe scope of this study.
3.7. Broad Implications on RO/NF science and technology
Existing analytical, numerical and atomistic approaches formodeling the transport of water and solutes through RO/NFmembranes [9,10,21,44,53–60] and active layer formation[21,44,54–56] do not take into account the existence of voids.Therefore, future transport modeling efforts should evaluate theimportance of the presence of voids in active layers (e.g., water/solute partitioning events at polyamide-water interfaces at thevoids walls, non-constant water/solute diffusion coefficients in theactive layer), and active layer formation modeling efforts shouldtarget a more accurate active layer structure that includes thevoids. The results from this study provide quantitative ranges ofvoid volume fractions and sizes that can be used as initial simu-lation values in transport modeling and calibration values in activelayer formation modeling. Also, given that there is no evidencethat the voids have been taken into account in membrane opti-mization efforts, this work reveals to membrane developers thatthere is an untapped complex parameter (i.e., void size distribu-tion, volume fraction, and topology) that could potentially be op-timized to develop improved membranes.
The existing experimental studies in the literature character-izing solute and water transport properties in polyamide active
layers (i.e., permeability, partition and diffusion coefficients) havenot taken into account the existence of voids [7,29,33,43,61,62].Therefore, existing studies have assumed that any measurementstaken (e.g., water sorption by the active layer) represent theproperties of polyamide alone, when they actually represent theeffective properties of the polyamide–voids composite (i.e., of theactive layer). Thus, future related characterization studies shouldtake into account the presence of the voids in active layers to ac-curately obtain the transport properties of polyamide and under-stand the effect that the voids have on the effective properties ofthe active layer. We elaborate on a related analysis of the watertransport properties of polyamide in the next section.
3.8. Implications on analysis of water transport properties ofpolyamide
3.8.1. Water permeabilityHaving demonstrated the existence of water-filled voids in
fully-aromatic polyamide active layers, we illustrate how ac-counting for their existence affects the estimated water transportproperties of polyamide. In our analysis we take into account voidfraction (i.e., amount of voids) and void interconnectivity, but notother void properties such as size and spatial distribution that mayalso affect the water transport properties of polyamide.
Under the framework of solution–diffusion theory, the waterpermeability coefficient A is given by [10]
AP D K C v
RT/
/, 6
AL AL AL Bulkν νδ δ= = ( )
where PAL (m2 s$1 Pa$1) is the permeability of the active layer(i.e., an intrinsic property of the active layer material independentof its thickness), δ (m) is the active layer thickness, KAL (di-mensionless) and DAL (m2 s$1) are the water partition and diffu-sion coefficients, respectively, in the active layer, CBulk is the con-centration of bulk water (55.5#103 mol m$3), v is the molar vo-lume of water (18.02#10$6 m3 mol$1), R is the ideal gas constant(8.314 m3 Pa K$1 mol$1), and T (K) is the absolute temperature.Note that A and PAL are divided by v to convert them from volu-metric to molar units. From the traditional perspective that con-ceptualizes the active layer as a dense polymer film (i.e., fvoid ¼0),the active layer permeability (PAL) is interpreted to be the same asthe polyamide permeability (PP) because there are no voids. Wecalculated PAL values using Eq. (6), and the measured δ (Table 1)and A (Table 2) values. The calculated PAL values are presented inTable 2 and were in the 0.2–2.7#10$18 m2 s$1 Pa$1 range. Therecognition of the existence of water-filled voids, however, bringsthe realization that PAL≠PP and that PAL actually corresponds to theeffective permeability of the active layer.
Accurate estimation of PP requires knowledge of the level ofinterconnectivity between voids; however, there is currently notechnique that allows for the quantitative characterization of voidinterconnectivity. Therefore, we estimated PP assuming the twolimiting conditions of void interconnectivity: (i) no void inter-connectivity (PP,NI), and (ii) complete void interconnectivity (PP,CI)including connectivity to the backside of the active layer. The ac-tual polymer permeability thus lies in the permeability range de-limited by PP,NI and PP,CI.
Under the assumption of no interconnectivity, and using theframework of Maxwell's effective-medium approximation theory[63] in the limit of a large disparity in the diffusion coefficients inthe liquid and solid phase (i.e., diffusivity in the liquid in the voidsis much bigger than in the solid polyamide), the effective perme-ability of the active layer PAL is related to the polymer permeabilityPP,NI and liquid-filled void fraction fvoid by (see Section S9 in Sup-plementary Material)
L. Lin et al. / Journal of Membrane Science 497 (2016) 365–376 373
PP
ff
1 21
.7
AL
P NI
void
void,=
+− ( )
Accordingly, we calculated PP,NI values using Eq. (7), and the PALand fvoid values in Table 2. We list the resulting PP,NI values also inTable 2.
Under the assumption of complete interconnectivity, the ef-fective active layer thickness is that of the dense (i.e., withoutvoids) active layer region delimited by the active layer surface andthe first set of voids from the surface, as illustrated in Fig. 2a. Werefer to this region as the active layer “top film” and denote itsthickness with δTF. Accordingly, PP,CI can be calculated from
AP
.8
P CI
TF
,
δ=( )
The top film thickness δTF for each of the membranes studied islisted in Table 1 and was obtained as the product of the total activelayer thickness obtained from AFM analyses (δ) and the ratio be-tween the top film thickness and active layer thickness in TEMimages. We used this approach because it allowed for a directcomparison of PAL and PP values, as both PAL and PP were calculatedusing thickness values corresponding to the samples analyzed byAFM. AFM measurements are more representative of the actualthickness of the active layers as they correspond to the thicknessobtained from samples having 90 mm2 in size, while TEM imagescorrespond to the thickness obtained from the analyses of only afew (linear) micrometers of sample. We used Eq. (8), and themeasured δTF (Table 1) and A (Table 2) values to calculate PP,CIvalues. We list the resulting PP,CI values in Table 2.
The calculated PAL, PP,NI and PP,CI values listed in Table 2 showthat polymer permeability values were lower than correspondingeffective active layer permeability values by a factor of 1.5–5.3(average of 2.9). Thus, the results indicate that the polymer per-meability is overestimated by a factor of 1.5–5.3 when the ex-istence of voids is neglected, or equivalently, that the presence ofthe voids potentially increases the effective water permeability ofthe active layer by as much as a factor of E5 compared with thecase of an equivalent active layer without any voids.
3.8.2. Water partitioningA similar comparison between effective active layer properties
and polymer properties can be performed for the partitioning ofwater into polyamide active layers when water sorption mea-surements are obtained by exposing the active layer to water va-por, as has been done in the literature [7,43]. The effective partitioncoefficient of water into the active layer (KAL) is given by
KC
Cm
MWC/ ,
9ALAL
Bulk
v
WBulkδ= = ( )
( )
where CAL, MWW (18.02 g mol$1), and mv correspond to themolar concentration of water in the active layer, molar mass ofwater, and areal mass of water sorbed by the active layer whenexposed to a humidified gas at 495% RH. Using Eq. (9) and themeasured mv and δ values in Table 1, the calculated KAL values(Table 2) were in the 0.13–0.22 range. Recognizing the existence ofvoids and remembering that KP¼CP/CBulk, where CP corresponds tothe molar concentration of water in polyamide, the partitioncoefficient of water into polyamide (KP) can be calculated as
Km
MW fC
1/ ,
10P
v
W voidBulkδ= ( ( − ) )
( )
because, as described above, the water vapor mass uptake bythe voids is negligible and therefore the measured mv valuescorrespond to the mass water uptake by polyamide. The calculatedKP values using Eq. (10) are listed in Table 2. Note that the calcu-lation of water partitioning into polyamide is independent of thelevel of interconnectivity between pores as it simply depends onthe amount of water sorbed by the polymer and the amount ofpolymer in the active layer. A comparison between the KAL and KP
values in Table 2 indicates that when the voids are neglected, thepartition coefficient of water into polyamide is underestimated bya factor of 1.2–1.5 (average of 1.4).
Note that KAL and KP depend onmv, and therefore both have thepropagated uncertainty from mv associated with capillary con-densation (r20%). Similarly, while the KP/KAL ¼ 1.2–1.5 ratio doesnot directly depend on mv (i.e., mv cancels out), it does depend onfvoid which has a r10% uncertainty associated with capillarycondensation. Therefore, all calculated parameters that depend onmv, fvoid obtained from water uptake tests, KAL or KP have an un-certainty associated with the possible occurrence of capillarycondensation.
3.8.3. Water diffusivityThe diffusion coefficient of water in the active layer (DAL) cal-
culated using Eq. (6) assuming that the active layer is a dense filmis presented in Table 2. The results obtained for the NF90 and XLEmembranes are not statistically significantly different from theself-diffusion coefficient of liquid water (DH2O¼2#10$9 m2 s$1)[64], which suggests that the solution–diffusion model as de-scribed by Eqs. (1) and (6) under the assumption that the activelayer is a dense film is likely inaccurate. Diffusion coefficients ofwater in polyamide under the assumption of no void inter-connectivity (DP,NI), i.e., DP,NI ¼(PP,NIRT)/(KPCBulkv), and under theassumption of complete void interconnectivity (DP,CI), i.e., DP,
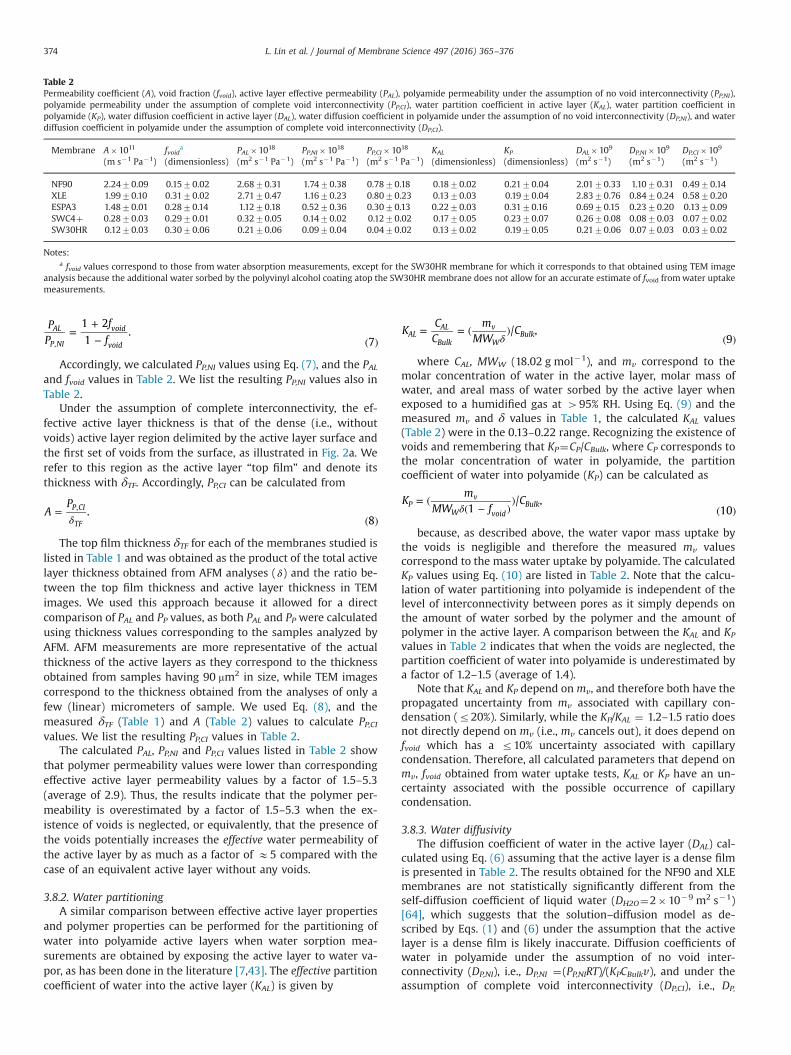
Table 2Permeability coefficient (A), void fraction (fvoid), active layer effective permeability (PAL), polyamide permeability under the assumption of no void interconnectivity (PP,NI),polyamide permeability under the assumption of complete void interconnectivity (PP,CI), water partition coefficient in active layer (KAL), water partition coefficient inpolyamide (KP), water diffusion coefficient in active layer (DAL), water diffusion coefficient in polyamide under the assumption of no void interconnectivity (DP,NI), and waterdiffusion coefficient in polyamide under the assumption of complete void interconnectivity (DP,CI).
Membrane A#1011 fvoida PAL#1018 PP,NI#1018 PP,CI#1018 KAL KP DAL#109 DP,NI#109 DP,CI#109
(m s$1 Pa$1) (dimensionless) (m2 s$1 Pa$1) (m2 s$1 Pa$1) (m2 s$1 Pa$1) (dimensionless) (dimensionless) (m2 s$1) (m2 s$1) (m2 s$1)
NF90 2.2470.09 0.1570.02 2.6870.31 1.7470.38 0.7870.18 0.1870.02 0.2170.04 2.0170.33 1.1070.31 0.4970.14XLE 1.9970.10 0.3170.02 2.7170.47 1.1670.23 0.8070.23 0.1370.03 0.1970.04 2.8370.76 0.8470.24 0.5870.20ESPA3 1.4870.01 0.2870.14 1.1270.18 0.5270.36 0.3070.13 0.2270.03 0.3170.16 0.6970.15 0.2370.20 0.1370.09SWC4þ 0.2870.03 0.2970.01 0.3270.05 0.1470.02 0.1270.02 0.1770.05 0.2370.07 0.2670.08 0.0870.03 0.0770.02SW30HR 0.1270.03 0.3070.06 0.2170.06 0.0970.04 0.0470.02 0.1370.02 0.1970.05 0.2170.06 0.0770.03 0.0370.02
Notes:a fvoid values correspond to those from water absorption measurements, except for the SW30HR membrane for which it corresponds to that obtained using TEM image
analysis because the additional water sorbed by the polyvinyl alcohol coating atop the SW30HR membrane does not allow for an accurate estimate of fvoid fromwater uptakemeasurements.
L. Lin et al. / Journal of Membrane Science 497 (2016) 365–376374

CI¼(PP,CIRT)/(KPCBulkv), are also presented in Table 2. The calculatedDP,NI and DP,CI values were all well below the self-diffusion coeffi-cient of water. A comparison between DAL, DP,NI and DP,CI valuesshows that the water diffusion coefficients in the polymer werelower than the effective water diffusion coefficients in the activelayers by a factor of 1.8–7.4 (average of 4.0). The results thereforesuggest that solution–diffusion theory may satisfactorily explainwater permeation in active layers if the voids are taken into ac-count, though a more rigorous modeling approach such as nu-merical solutions considering two- or three- dimensional flow islikely needed to take into account void topology in the active layer.
4. Conclusions
The presence of voids in the fully-aromatic polyamide activelayers of TFC membranes for water purification was studied usinga selection of commercial membranes with a broad range of per-formance levels. The study was partly motivated by conflictinginterpretations in the literature of globular features observed incross-sectional electron microscopy images of fully-aromaticpolyamide TFC membranes that some authors [13–16] have in-terpreted as voids and some others as nodules [17]. We evaluatedthe void or nodular nature of the globular features using TEM andSEM imaging as well as STEM-EDS and STEM-EELS elementalmapping, measured the volume fraction of the active layer occu-pied by the features using TEM image analysis, measured the voidvolume fraction in active layers using water sorption and refractiveindex analyses, and illustrated how the voids have an effect on thewater transport properties of polyamide and active layers. Ourresults and discussion support the following conclusions:
& The globular features observed in TEM images are voids, notnodules. This conclusion is supported by (i) the matching vo-lume fractions occupied by the features (TEM image analyses)and volume fraction occupied by voids (water sorption andrefractive index analyses) in the active layers, and (ii) the ele-mental mapping results by STEM-EDS and STEM-EELS.
& The voids are a common feature of fully-aromatic polyamideactive layers as they were observed in the active layers of all fivefully-aromatic polyamide TFC membranes studied which cov-ered a broad range of performance levels including nanofiltra-tion, brackish water RO and seawater RO.
& Voids accounted for a significant volume fraction (15–32%) ofthe membrane active layers.
& Voids are filled with liquid water when the membranes areimmersed in it.
& The voids in polyamide active layers do not form passagewaysconnecting the feed and permeate sides, but rather are cavitiesdisconnected from the feed side. Further research is required toassess the extent to which the voids are interconnected to eachother.
& The presence of the voids increases the effective water perme-ability of the active layers compared with the case of anequivalent active layer without any voids. For the active layersstudied, the potential increase in water permeability was asmuch as a factor of E5.
& Neglecting the presence of the voids led to an overestimation ofthe water permeability of polyamide by a factor of 1.5–5.3(average of 2.9), an underestimation of the water partitioncoefficient into polyamide by a factor of 1.2–1.5 (average of 1.4),and an overestimation of the water diffusion coefficient inpolyamide by a factor of 1.8–7.4 (average of 4.0).
In addition to the findings above, this study contributed threedifferent methods to measure void volume fraction in active
layers, and experimentally measured void volume fractions thatcan be used as input or calibration parameters in future modelingstudies of water and solute transport or active layer formation. Theconfirmation of the existence of voids as common features in thefully-aromatic polyamide active layers of TFC membranes indicatesthat the voids are an active layer property that could potentially betargeted for optimization towards the development of improvedmembranes.
Acknowledgments
We thank Wallace Ambrose and Amar S. Kumbhar (TEM), YangLiu (STEM-EDS/EELS), and Carrie Donley (SEM) for assistance inacquisition of microscopy images and helpful discussions. TEM,AFM and ellipsometry analyses were conducted at the Chapel HillAnalytical and Nanofabrication Laboratory in Chapel Hill, NC. TheSTEM-EDS/EELS analyses were performed at the Analytical In-strumentation Facility of the North Carolina State University. Thiswork was supported by the National Science Foundation (NSF)Grants Opportunities for Academic Liaison with Industry (GOALI)and Chemical and Biological Separations Programs under Award#1264690, and NSF Environmental Engineering Program underAward #1336532. G.Z.R was supported by a Marie-Curie grant (No.275911) from the European Union Seventh Framework Program(FP7/2007-2013).
Appendix A. Supplementary material
Supplementary data associated with this article can be found inthe online version at http://dx.doi.org/10.1016/j.memsci.2015.09.020.
References
[1] L.F. Greenlee, D.F. Lawler, B.D. Freeman, B. Marrot, P. Moulin, Reverse osmosisdesalination: water sources, technology, and today's challenges, Water Res. 43(2009) 2317–2348, http://dx.doi.org/10.1016/j.watres.2009.03.010.
[2] J.G. Jacangelo, R.R. Trussell, M. Watson, Role of membrane technology indrinking water treatment in the United States, Desalination 113 (1997)119–127, http://dx.doi.org/10.1016/S0011-9164(97)00120-3.
[3] B. Van der Bruggen, K. Everaert, D. Wilms, C. Vandecasteele, Application ofnanofiltration for removal of pesticides, nitrate and hardness from groundwater: rejection properties and economic evaluation, J. Memb. Sci. 193 (2001)239–248, http://dx.doi.org/10.1016/S0376-7388(01)00517-8.
[4] N.Y. Yip, A. Tiraferri, W.A. Phillip, J.D. Schi, L.A. Hoover, Y.C. Kim, et al., Thin-film composite pressure retarded osmosis membranes for sustainable powergeneration from salinity gradients, Environ. Sci. Technol. 45 (2011) 4360–4369.
[5] R.J. Petersen, Composite reverse osmosis and nanofiltration membranes, J.Memb. Sci. 83 (1993) 81–150, http://dx.doi.org/10.1016/0376-7388(93)80014-O.
[6] K.P. Lee, T.C. Arnot, D. Mattia, A review of reverse osmosis membrane materialsfor desalination—Development to date and future potential, J. Memb. Sci. 370(2011) 1–22, http://dx.doi.org/10.1016/j.memsci.2010.12.036.
[7] J. Lee, C.M. Doherty, A.J. Hill, S.E. Kentish, Water vapor sorption and free vo-lume in the aromatic polyamide layer of reverse osmosis membranes, J.Memb. Sci. 425–426 (2013) 217–226, http://dx.doi.org/10.1016/j.memsci.2012.08.054.
[8] C. Bellona, J.E. Drewes, P. Xu, G. Amy, Factors affecting the rejection of organicsolutes during NF/RO treatment—A literature review, Water Res. 38 (2004)2795–2809, http://dx.doi.org/10.1016/j.watres.2004.03.034.
[9] G.Z. Ramon, E.M.V. Hoek, Transport through composite membranes, part 2:impacts of roughness on permeability and fouling, J. Memb. Sci. 425–426(2013) 141–148, http://dx.doi.org/10.1016/j.memsci.2012.08.004.
[10] J.G. Wijmans, R.W. Baker, The solution-diffusion model: a review, J. Memb. Sci.107 (1995) 1–21, http://dx.doi.org/10.1016/0376-7388(95)00102-I.
[11] W.R. Bowen, J.S. Welfoot, Modelling the performance of membrane nanofil-tration—Critical assessment and model development, Chem. Eng. Sci. 57(2002) 1121–1137.
[12] A. Szymczyk, P. Fievet, Investigating transport properties of nanofiltrationmembranes by means of a steric, electric and dielectric exclusion model, J.Memb. Sci. 252 (2005) 77–88, http://dx.doi.org/10.1016/j.memsci.2004.12.002.
[13] M. Kurihara, M. Hanakawa, Mega-ton Water System, Japanese national re-search and development project on seawater desalination and wastewaterreclamation, Desalination 308 (2013) 131–137, http://dx.doi.org/10.1016/j.
L. Lin et al. / Journal of Membrane Science 497 (2016) 365–376 375

desal.2012.07.038.[14] Q. An, W.-S. Hung, S.-C. Lo, Y.-H. Li, M. De Guzman, C.-C. Hu, et al., Comparison
between free volume characteristics of composite membranes fabricatedthrough static and dynamic interfacial polymerization processes, Macro-molecules 45 (2012) 3428–3435, http://dx.doi.org/10.1021/ma3001324.
[15] C. Kong, A. Koushima, T. Kamada, T. Shintani, M. Kanezashi, T. Yoshioka, et al.,Enhanced performance of inorganic-polyamide nanocomposite membranesprepared by metal-alkoxide-assisted interfacial polymerization, J. Memb. Sci.366 (2011) 382–388, http://dx.doi.org/10.1016/j.memsci.2010.10.026.
[16] C. Kong, M. Kanezashi, T. Yamomoto, T. Shintani, T. Tsuru, Controlled synthesisof high performance polyamide membrane with thin dense layer for waterdesalination, J. Memb. Sci. 362 (2010) 76–80, http://dx.doi.org/10.1016/j.memsci.2010.06.022.
[17] F.A. Pacheco, I. Pinnau, M. Reinhard, J.O. Leckie, Characterization of isolatedpolyamide thin films of RO and NF membranes using novel TEM techniques, J.Memb. Sci. 358 (2010) 51–59, http://dx.doi.org/10.1016/j.memsci.2010.04.032.
[18] C.Y. Tang, Y.-N. Kwon, J.O. Leckie, Probing the nano- and micro-scales of re-verse osmosis membranes—A comprehensive characterization of physio-chemical properties of uncoated and coated membranes by XPS, TEM, ATR-FTIR, and streaming potential measurements, J. Memb. Sci. 287 (2007)146–156, http://dx.doi.org/10.1016/j.memsci.2006.10.038.
[19] C.Y. Tang, Q.S. Fu, A.P. Robertson, C.S. Criddle, J.O. Leckie, Use of reverse os-mosis membranes to remove perfluorooctane sulfonate (PFOS) from semi-conductor wastewater, Environ. Sci. Technol. 40 (2006) 7343–7349.
[20] J. Yin, E.-S. Kim, J. Yang, B. Deng, Fabrication of a novel thin-film nano-composite (TFN) membrane containing MCM-41 silica nanoparticles (NPs) forwater purification, J. Memb. Sci. 423–424 (2012) 238–246, http://dx.doi.org/10.1016/j.memsci.2012.08.020.
[21] H.F. Ridgway, J.D. Gale, Z.E. Hughes, M.B. Stewart, J.D. Orbell, S.R. Gray, Mo-lecular scale modeling of membrane water treatment processes, in: M. Duke,D. Zhao, R. Semiat (Eds.), Functional Nanostructured Materials and Mem-branes for Water Treatment, Wiley-VCH, Germany, 2013.
[22] H. Yan, X. Miao, J. Xu, G. Pan, Y. Zhang, Y. Shi, et al., The porous structure of thefully-aromatic polyamide film in reverse osmosis membranes, J. Memb. Sci.475 (2015) 504–510, http://dx.doi.org/10.1016/j.memsci.2014.10.052.
[23] Dow Filmtec. NF90-400 nanofiltration element datasheet, Form No. 609-00345-0312. Available at http://www.dowwaterandprocess.com/en/Products/F/FILMTEC%20NF90_4040⟩ (accessed on 26.10.14).
[24] Dow Filmtec. XLE-440 extra low energy RO element datasheet, Form No. 609-00245-0606. Available at ⟨http://www.dowwaterandprocess.com/en/products/f/filmtec_xle_4040⟩ (accessed on 26.10.14).
[25] Dow Filmtec. SW30HR-380 seawater reverse osmosis element datasheet,Form No. 609-00390-1008. Available at ⟨http://www.dowwaterandprocess.com/en/products/f/filmtec_sw30hr_380⟩ (accessed on 26.10.14).
[26] Hydranautics. ESPA3-4040 brackish water reverse osmosis membrane ele-ment datasheet. Available at ⟨http://www.lenntech.com/Data-sheets/Hydranautics-ESPA3-4040.pdf⟩ (accessed on 26.10.14).
[27] Hydranautics. SWC4þ 8040 seawater reverse osmosis element datasheet.Available at ⟨http://www.lenntech.com/Data-sheets/Hydranautics-SWC4þ8040.pdf⟩ (accessed on 26.08.15).
[28] C.Y. Tang, Y.-N. Kwon, J.O. Leckie, Effect of membrane chemistry and coatinglayer on physiochemical properties of thin film composite polyamide RO andNF membranes I. FTIR and XPS characterization of polyamide and coatinglayer chemistry, Desalination. 242 (2009) 149–167, http://dx.doi.org/10.1016/j.desal.2008.04.003.
[29] X. Zhang, D.G. Cahill, O. Coronell, B.J. Marinas, Partitioning of salt ions in FT30reverse osmosis membranes, Appl. Phys. Lett. 91 (2007) 181904, http://dx.doi.org/10.1063/1.2802562.
[30] O. Coronell, B.J. Mariñas, D.G. Cahill, Accessibility and ion exchange stoichio-metry of ionized carboxylic groups in the active layer of FT30 reverse osmosismembrane, Environ. Sci. Technol. 43 (2009) 5042–5048.
[31] L.A. Perry, O. Coronell, Reliable, bench-top measurements of charge density inthe active layers of thin-film composite and nanocomposite membranes usingquartz crystal microbalance technology, J. Memb. Sci. 429 (2013) 23–33, http://dx.doi.org/10.1016/j.memsci.2012.11.023.
[32] V. Freger, Swelling and morphology of the skin layer of polyamide compositemembranes: an atomic force microscopy study, Environ. Sci. Technol. 38(2004) 3168–3175.
[33] S. Bason, Y. Oren, V. Freger, Ion transport in the polyamide layer of ROmembranes: composite membranes and free-standing films, J. Memb. Sci. 367(2011) 119–126, http://dx.doi.org/10.1016/j.memsci.2010.10.048.
[34] K.A. Marx, Quartz crystal microbalance: a useful tool for studying thin poly-mer films and complex biomolecular systems at the solution-surface interface,Biomacromolecules 4 (2003) 1099–1120, http://dx.doi.org/10.1021/bm020116i.
[35] C.K. O’Sullivan, G.G. Guilbault, Commercial quartz crystal microbalances—Theory and applications, Biosens. Bioelectron. 14 (1999) 663–670, http://dx.doi.org/10.1016/S0956-5663(99)00040-8.
[36] E.A. Irene, A brief history and state of the art of ellipsometry, in: M. Losurdo,K. Hingerl (Eds.), Ellipsometry at the Nanoscale, Springer-Verlag, Berlin Hei-delberg, 2013, pp. 1–30, http://dx.doi.org/10.1007/978-3-642-33956-1.
[37] W. Ogieglo, H. van der Werf, K. Tempelman, H. Wormeester, M. Wessling,A. Nijmeijer, et al., n-Hexane induced swelling of thin PDMS films under non-equilibrium nanofiltration permeation conditions, resolved by spectroscopic
ellipsometry, J. Memb. Sci. 431 (2013) 233–243.[38] O. Kahle, U. Wielsch, H. Metzner, J. Bauer, C. Uhlig, C. Zawatzki, Glass transi-
tion temperature and thermal expansion behaviour of polymer films in-vestigated by variable temperature spectroscopic ellipsometry, Thin SolidFilms 313–314 (1998) 803–807.
[39] W. Ogieglo, H. Wormeester, M. Wessling, N.E. Benes, Spectroscopic ellipso-metry analysis of a thin film composite membrane consisting of polysulfoneon a porous α-alumina support, Appl. Mater. Interfaces 4 (2012) 935–943.
[40] Y. Huang, D.R. Paul, Physical aging of thin glassy polymer films monitored bygas permeability, Polymer 45 (2004) 8377–8393, http://dx.doi.org/10.1016/j.polymer.2004.10.019.
[41] J.J. Bozzola, L.D. Russell, Electron Microscopy: Principles and Techniques forBiologist, 2nd ed, Jones and Bartlett, United States of America, 1999.
[42] W.S. Rasband, ImageJ, U.S. National Institutes of Health, Bethesda, Maryland,USA, 1997–2014. ⟨http://imagej.nih.gov/ij/⟩.
[43] X. Zhang, D.G. Cahill, O. Coronell, B.J. Mariñas, Absorption of water in theactive layer of reverse osmosis membranes, J. Memb. Sci. 331 (2009) 143–151,http://dx.doi.org/10.1016/j.memsci.2009.01.027.
[44] V. Kolev, V. Freger, Hydration, porosity and water dynamics in the polyamidelayer of reverse osmosis membranes: a molecular dynamics study, Polymer 55(2014) 1420–1426, http://dx.doi.org/10.1016/j.polymer.2013.12.045.
[45] S. Jeck, P. Scharfer, W. Schabel, M. Kind, Water sorption in poly(vinyl alcohol)membranes: an experimental and numerical study of solvent diffusion in acrosslinked polymer, Chem. Eng. Process. Process Intensif. 50 (2011) 543–550,http://dx.doi.org/10.1016/j.cep.2010.09.004.
[46] E. Dražević, K. Košutić, V. Freger, Permeability and selectivity of reverse os-mosis membranes: correlation to swelling revisited, Water Res. 49 (2014)444–452, http://dx.doi.org/10.1016/j.watres.2013.10.029.
[47] H.-J. Butt, K. Graf, M. Kappl, Physics and chemistry of interfaces, Wiley-VCH,Germany, 2003.
[48] R. Evans, U.M. Bettolo Marconi, P. Tarazona, Capillary condensation and ad-sorption in cylindrical and slit-like pores, J. Chem. Soc. Faraday Transc. 82(1986) 1763–1787.
[49] A. Ben-David, Y. Oren, V. Freger, Thermodynamic factors in partitioning andrejection of organic compounds by polyamide composite membranes, En-viron. Sci. Technol. 40 (2006) 7023–7028.
[50] P.E. Ciddor, Refractive index of air: new equations for the visible and nearinfrared, Appl. Opt. 35 (1996) 1566–1573.
[51] M.M. Braun, L. Pilon, Effective optical properties of non-absorbing nanoporousthin films, Thin Solid Films. 496 (2006) 505–514, http://dx.doi.org/10.1016/j.tsf.2005.08.173.
[52] C.Y. Tang, Y.-N. Kwon, J.O. Leckie, Characterization of humic acid fouled reverseosmosis and nanofiltration membranes by transmission electron microscopyand streaming potential measurements, Environ. Sci. Technol. 41 (2007)942–949, http://dx.doi.org/10.1021/es061322r.
[53] S. Bason, V. Freger, Phenomenological analysis of transport of mono- and di-valent ions in nanofiltration, J. Memb. Sci. 360 (2010) 389–396, http://dx.doi.org/10.1016/j.memsci.2010.05.037.
[54] M. Ding, A. Ghoufi, A. Szymczyk, Molecular simulations of polyamide reverseosmosis membranes, Desalination 343 (2014) 48–53, http://dx.doi.org/10.1016/j.desal.2013.09.024.
[55] M. Ding, A. Szymczyk, F. Goujon, A. Soldera, A. Ghoufi, Structure and dynamicsof water confined in a polyamide reverse-osmosis membrane: a molecular-simulation study, J. Memb. Sci. 458 (2014) 236–244, http://dx.doi.org/10.1016/j.memsci.2014.01.054.
[56] E. Harder, D.E. Walters, Y.D. Bodnar, R.S. Faibish, B. Roux, Molecular dynamicsstudy of a polymeric reverse osmosis membrane, J. Phys. Chem. B 113 (2009)10177–10182, http://dx.doi.org/10.1021/jp902715f.
[57] M.J. Kotelyanskii, N.J. Wagner, M.E. Paulaitis, Molecular dynamics simulationstudy of the mechanisms of water diffusion in a hydrated, amorphous poly-amide, Comput. Theor. Polym. Sci. 9 (1999) 301–306, http://dx.doi.org/10.1016/S1089-3156(99)00020-3.
[58] A. Yaroshchuk, X. Martínez-Lladó, L. Llenas, M. Rovira, J. de Pablo, Solution–diffusion-film model for the description of pressure-driven trans-membranetransfer of electrolyte mixtures: one dominant salt and trace ions, J. Memb.Sci. 368 (2011) 192–201, http://dx.doi.org/10.1016/j.memsci.2010.11.037.
[59] M.J. Kotelyanskii, N.J. Wagner, M.E. Paulaitis, Atomistic simulation of waterand salt transport in the reverse osmosis membrane FT-30, J. Memb. Sci. 139(1998) 1–16.
[60] D.R. Paul, Reformulation of the solution–diffusion theory of reverse osmosis, J.Memb. Sci. 241 (2004) 371–386, http://dx.doi.org/10.1016/j.memsci.2004.05.026.
[61] B. Mi, B.J. Mariñas, D.G. Cahill, RBS characterization of arsenic(III) partitioningfrom aqueous phase into the active layers of thin-film composite NF/ROmembranes, Environ. Sci. Technol. 41 (2007) 3290–3295.
[62] E. Drazevic, S. Bason, K. Kosutic, V. Freger, Enhanced partitioning and trans-port of phenolic micropollutants within polyamide composite membranes,Environ. Sci. Technol. 46 (2012) 3377–3383, http://dx.doi.org/10.1021/es204188j.
[63] C. Maxwell, Treatise on Electricity and Magnetism, Oxford University Press,London, UK, 1973.
[64] L.G. Longsworth, The mutual diffusion of light and heavy water, J. Phys. Chem.64 (1960) 1914–1917.
L. Lin et al. / Journal of Membrane Science 497 (2016) 365–376376