Journal of Experimental Psychology: Generalmariaol/files/BaeEtAlJEP2015.pdf · Journal of...
21
Journal of Experimental Psychology: General Why Some Colors Appear More Memorable Than Others: A Model Combining Categories and Particulars in Color Working Memory Gi-Yeul Bae, Maria Olkkonen, Sarah R. Allred, and Jonathan I. Flombaum Online First Publication, May 18, 2015. http://dx.doi.org/10.1037/xge0000076 CITATION Bae, G.-Y., Olkkonen, M., Allred, S. R., & Flombaum, J. I. (2015, May 18). Why Some Colors Appear More Memorable Than Others: A Model Combining Categories and Particulars in Color Working Memory. Journal of Experimental Psychology: General. Advance online publication. http://dx.doi.org/10.1037/xge0000076
Transcript of Journal of Experimental Psychology: Generalmariaol/files/BaeEtAlJEP2015.pdf · Journal of...

Journal of Experimental Psychology: General
Why Some Colors Appear More Memorable Than Others:A Model Combining Categories and Particulars in ColorWorking MemoryGi-Yeul Bae, Maria Olkkonen, Sarah R. Allred, and Jonathan I. FlombaumOnline First Publication, May 18, 2015. http://dx.doi.org/10.1037/xge0000076
CITATIONBae, G.-Y., Olkkonen, M., Allred, S. R., & Flombaum, J. I. (2015, May 18). Why Some ColorsAppear More Memorable Than Others: A Model Combining Categories and Particulars inColor Working Memory. Journal of Experimental Psychology: General. Advance onlinepublication. http://dx.doi.org/10.1037/xge0000076

Why Some Colors Appear More Memorable Than Others: A ModelCombining Categories and Particulars in Color Working Memory
Gi-Yeul BaeUniversity of California, Davis, and Johns Hopkins University
Maria OlkkonenUniversity of Pennsylvania
Sarah R. AllredRutgers—The State University of New Jersey
Jonathan I. FlombaumJohns Hopkins University
Categorization with basic color terms is an intuitive and universal aspect of color perception. Yet researchon visual working memory capacity has largely assumed that only continuous estimates within colorspace are relevant to memory. As a result, the influence of color categories on working memory remainsunknown. We propose a dual content model of color representation in which color matches to objects thatare either present (perception) or absent (memory) integrate category representations along with esti-mates of specific values on a continuous scale (“particulars”). We develop and test the model through 4experiments. In a first experiment pair, participants reproduce a color target, both with and without adelay, using a recently influential estimation paradigm. In a second experiment pair, we use standardmethods in color perception to identify boundary and focal colors in the stimulus set. The main resultsare that responses drawn from working memory are significantly biased away from category boundariesand toward category centers. Importantly, the same pattern of results is present without a memory delay.The proposed dual content model parsimoniously explains these results, and it should replace prevailingsingle content models in studies of visual working memory. More broadly, the model and the resultsdemonstrate how the main consequence of visual working memory maintenance is the amplification ofcategory related biases and stimulus-specific variability that originate in perception.
Keywords: visual working memory, delayed estimation, color perception, categorization
Visually guided behavior requires both perception and workingmemory. For example, choosing the ripest avocado at the storerequires a comparison between avocados experienced in the pastand those observable now. Distinguishing between objects thatdiffer on color—or any other basic visual feature—may seemeffortless. But like many other tasks in perception and cognition, itis enormously challenging in practice. Because of inherent uncer-tainty in perception, inescapably noisy neural processing, and the
complexity of viewing conditions, even comparing two side-by-side avocados is computationally difficult. Adding memory de-mands compounds the difficulty.
Despite considerable interest in the role of visual workingmemory in behaviors such as detecting changes and reproducingremembered features, little contact has been made between re-search on the perception of basic visual features and research thatuses those features to investigate the nature of visual workingmemory. Here, we focus on color, which has received the majorityof attention in studies targeting visual working memory. We testthree hypotheses: (a) that working memory maintenance exhibitscolor-specific biases, (b) that biases originate in perception, and (c)that observers functionally use two kinds of color informationwhen matching colors between objects. These are an estimate ofhue on a continuous scale —what has been called a “particular” inother contexts (e.g., Huttenlocher, Hedges, & Vevea, 2000)—anda probabilistic category assignment. The results are central fortheories of visual working memory, in which inferences aboutmemory processing rest on assumptions that are contravened byour hypotheses. More generally, our results demonstrate that visualperception and working memory share a common vocabulary fordescribing the material properties of surfaces in the world.
Delayed Estimation
Recent and influential work in the domain of visual workingmemory has examined the mechanisms that support detection of
Gi-Yeul Bae, Center for Mind and Brain, University of California,Davis, and Department of Psychological and Brain Sciences, Johns Hop-kins University; Maria Olkkonen, Department of Psychology, Universityof Pennsylvania; Sarah R. Allred, Department of Psychology, Rutgers—The State University of New Jersey; Jonathan I. Flombaum, Department ofPsychological and Brain Sciences, Johns Hopkins University.
This research was supported in part by Grant NSF CAREER BCS-0954749 to Sarah R. Allred and by a Research Expansion Award toGi-Yeul Bae administered by the Johns Hopkins University Department ofPsychological and Brain Sciences and funded by the Walter L. ClarkFellowship Fund. We also thank Ed Vogel, Brent Strickland, and DarylFougnie for thoughtful comments and suggestions.
Correspondence concerning this article should be addressed to JonathanI. Flombaum, Department of Psychological and Brain Sciences, JohnsHopkins University, JHU/3400 N. Charles Street, Ames Hall/PBS, Balti-more, MD 21218. E-mail: [email protected]
Thi
sdo
cum
ent
isco
pyri
ghte
dby
the
Am
eric
anPs
ycho
logi
cal
Ass
ocia
tion
oron
eof
itsal
lied
publ
ishe
rs.
Thi
sar
ticle
isin
tend
edso
lely
for
the
pers
onal
use
ofth
ein
divi
dual
user
and
isno
tto
bedi
ssem
inat
edbr
oadl
y.
Journal of Experimental Psychology: General © 2015 American Psychological Association2015, Vol. 144, No. 3, 000 0096-3445/15/$12.00 http://dx.doi.org/10.1037/xge0000076
1
object change, detection of object similarity (match), and, moregenerally, the mechanisms involved in the reproduction of featuresseen in the recent past. Research on visual working memory hastypically framed such tasks in the language of estimation: Aparticipant must estimate the feature of an object seen in the past,given noisy inputs, and then compare it with an estimate of whatis seen currently. Appropriately, a paradigm called “delayed esti-mation” has been devised and proven productive for investigatingworking memory mechanisms associated with matching (Figure1a; Wilken & Ma, 2004; Zhang & Luck, 2008).
The majority of studies using this task focus on color workingmemory—as we will here—and so we describe the basic method-ology in that context. In a typical experiment, participants remem-ber the individual hues in a set of circles or squares. After a shortdelay period, participants report the hue value of one of the studyobjects on a continuous response scale—a hue circle (usually with180 exemplars) comprising all the hues utilized in the study.Response variability—measured as angular deviation between se-lected and true hues—differs between trials and by condition,motivating inferences concerning the structure of visual workingmemory (Anderson & Awh, 2012; Bays, Catalao, & Husain, 2009;Bays, Wu, & Husain, 2011; Emrich & Ferber, 2012; Fougnie &Alvarez, 2011; Fougnie, Asplund, & Marois, 2010; Fougnie,Suchow, & Alvarez, 2012; Gold et al., 2010; van den Berg, Shin,Chou, George, & Ma, 2012; Wilken & Ma, 2004; Zhang & Luck,2011, 2009, 2008).
Ultimately, interpreting the results of this and any related par-adigm depends on one’s expectations about performance withoutmemory maintenance (without an enforced memory delay), situa-tions that are constrained more by perception than by the attendantchallenges arising from an absent stimulus and working memorymaintenance. Fortunately, the same paradigm can be manipulatedminimally to investigate this performance. Simply removing thedelay period allows one to measure variability of responses whenthere are no externally enforced memory demands, what we willcall “undelayed estimation” (Figure 1b; see also Bae, Olkkonen,Allred, Wilson, & Flombaum, 2014). Practically, undelayed esti-mation supplies an opportunity to build empirical expectationsabout performance for use when interpreting effects of memory.And theoretically, it supplies a good methodological opportunity todirectly relate perception and working memory in the same task
(Bae et al., 2014; Brady, Konkle, Gill, Oliva, & Alvarez, 2013;Gold et al., 2010; Souza, Rerko, Lin, & Oberauer, 2014).
However, we have recently demonstrated that several unwar-ranted assumptions are built into expectations about undelayed anddelayed responses in the literature on visual working memory (Baeet al., 2014). In our previous study, we investigated responses ona color-specific basis, while also employing what appears to bestandard color rendering practice in published reports using de-layed estimation. We discovered considerable stimulus-dependentdifferences in response variability. This is a problem becausestandard practice with delayed estimation has been to collapseresponses across colors, characterizing response variability underthe implicit assumption that all colors would elicit more or lesssimilar response distributions.
Further scrutiny of these color-specific response properties ledto several additional discoveries. First, color-specific differencescorrelated across independent observers, demonstrating that theywere not random. Second, color-specific differences appeared inundelayed experiments and were correlated with delayed color-specific differences, demonstrating that they originate in percep-tion. Third, color-specific differences were large: In some in-stances, differences between colors were larger than differencescaused by memory load—the primary phenomenon that theories ofvisual working memory seek to explain. Fourth, color-specificresponse properties were reliably related to category structurewithin the set of color samples, suggesting that color categorieslikely play a role in visual working memory. Finally, we discov-ered that omitting the calibration and rendering techniques pre-scribed in research on color perception has likely caused manystudies to include rendered colors that differ in meaningful waysfrom intended ones. Notably, in our study, which specified equi-luminant intended colors, rendered colors differed considerably inluminance.
These results motivate the present study. They suggest that colorworking memory may not behave uniformly, even with equilumi-nant stimuli, and that it may rely on encoding of stimulus catego-ries—along with continuous values—to support comparative stim-ulus judgments.
Indeed, there are good reasons to expect such effects (Allred &Flombaum, 2014). With respect to stimulus-specific responseproperties, it is known that even equiluminant, but different, hueswill elicit meaningfully different response distributions in a match-ing context (Witzel & Gegenfurtner, 2013). These effects canoriginate in perception, as opposed to arising only through aninteraction with working memory maintenance (Nemes, Parry, &McKeefry, 2010; Olkkonen & Allred, 2014; Olkkonen, McCarthy,& Allred, 2014). More generally, careful work on color discrimi-nation in psychology and color science has shown that no colorspace is ever likely to be perceptually uniform (for discussion, seeBrainard, 2003; Wyszecki & Stiles, 1982).
In addition, color perception has a salient categorical aspect, atleast intuitively. English speakers generally feel comfortable usingonly 11 terms, often even fewer, to describe a space including amillion discriminable shades (Linhares, Pinto, & Nascimento,2008; Pointer & Attridge, 1997). The development of color termsseems to follow a seemingly universal hierarchical structure sug-gesting that people using different languages share broadly similarintuitions about color categories (Berlin & Kay, 1969). Addition-ally, both continuous and categorical representations of colors are
Figure 1. Procedure for color estimation (a) with a delay and (b) withouta delay. See the online article for the color version of this figure.
Thi
sdo
cum
ent
isco
pyri
ghte
dby
the
Am
eric
anPs
ycho
logi
cal
Ass
ocia
tion
oron
eof
itsal
lied
publ
ishe
rs.
Thi
sar
ticle
isin
tend
edso
lely
for
the
pers
onal
use
ofth
ein
divi
dual
user
and
isno
tto
bedi
ssem
inat
edbr
oadl
y.
2 BAE, OLKKONEN, ALLRED, AND FLOMBAUM
present in mammalian brains, although the latter representation(Bird, Berens, Horner, & Franklin, 2014; Brouwer & Heeger,2013; Koida & Komatsu, 2007) is perhaps less established than theformer (e.g., Conway & Tsao, 2006; Horwitz & Hass, 2012;Johnson, Hawken, & Shapley, 2001, 2004).
We therefore sought to use the estimation paradigm to test threerelated proposals about the contents of color working memory andtheir relationship to perceptual inputs. We propose that reproducing aperceived hue relies on both continuous and categorical representa-tions of hue, that reproducing a remembered hue relies on these sametwo representations, and that the joint reliance on these contentsproduces stimulus-specific biases. This challenges prevailing assump-tions in color working memory research, which include only a con-tinuous hue estimate and no stimulus-specific biases.
Dual Contents: Continuous Estimates (“Particulars”)and Probabilistic Categories
To explain how joint continuous and categorical representationscan produce reproduction biases, the well-known relationship be-tween spatial working memory and local landmarks serves as anelegant example. Consider an empty piece of paper with a dot on it.If asked to reproduce the dot on another, entirely empty piece ofpaper, your responses will likely form a cloud—probably a two-dimensional Gaussian—characterized by the uncertainty in your po-sition estimates and noise in your motor machinery. Now consider acase in which the dot is placed in the same place on the paper, butwithin a larger circle and near its perimeter. Assuming the circle isalso on the reproduction paper, your responses over many trials willform a different cloud. None of your responses will cross the perim-eter of the circle. The presence of a salient landmark will biasresponses. These and related experiments conducted by Huttenlocherand colleagues (2000; Crawford, Huttenlocher, & Hedges, 2006;Duffy, Huttenlocher, Hedges, & Crawford, 2010) demonstrate thatspatial working memory relies on both continuous position esti-mates—in their terms, “particulars”—and categorical descriptionsrelative to either inductively developed categories, such as distribu-tions of stimuli used during an experiment, or landmarks, such as
“within the circle and near the perimeter.” Combining these contentsproduces biased reproductions.
We propose that color working memory—and perception—workin much the same way. In the case of the delayed estimation task, eachstimulus in a memory sample is represented both by a noisy estimateof a particular hue value on a continuous scale and also by a categorylabel from the set comprising the basic color terms (e.g., blue, green,orange). In our model, the category label is itself assigned probabi-listically, so that hues near a category boundary will be assigned todifferent categories on different occasions. The combination of thesetwo contents will result in biases that differ by stimulus. Colors nearthe center of categories are unlikely to produce biased estimates,because continuous and categorical estimates align. But colors nearboundaries will exhibit large biases in the focal direction of theircategories. In the same way that an observer will not place a dotoutside a circle when she remembers it as being inside the circle, sheshould not respond with hues she would label as green to reproduceone she remembers as blue.
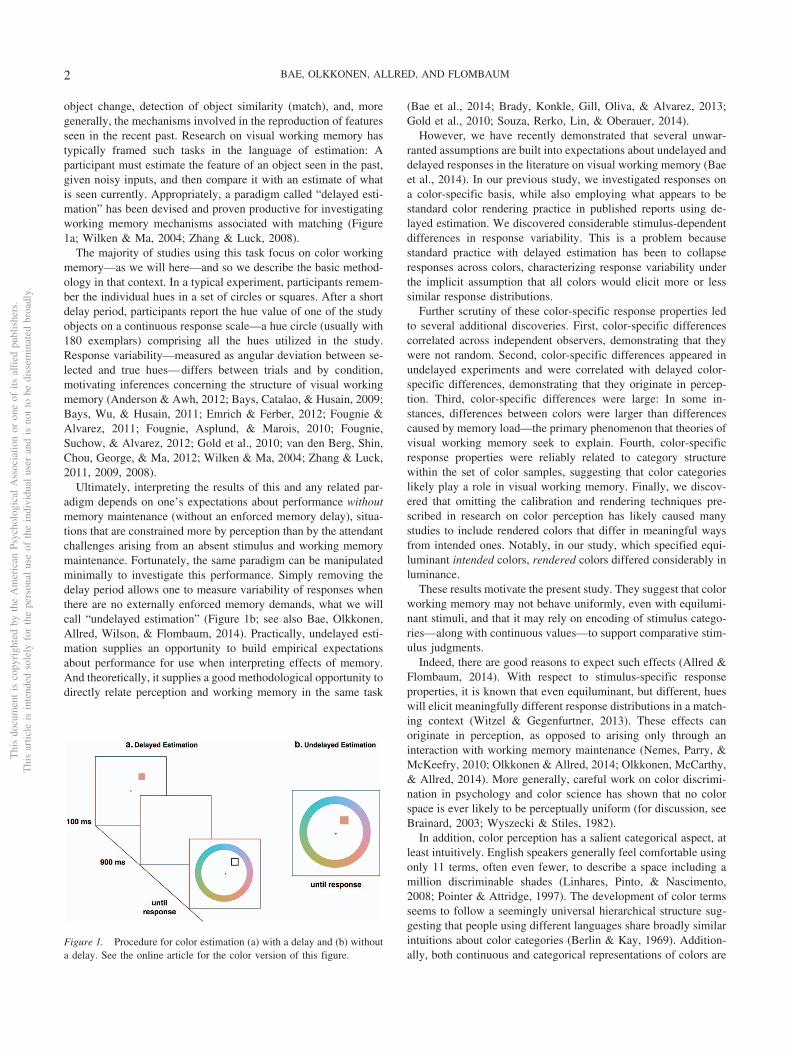
To test our proposal, we employ two approaches. In behavioralexperiments, we first characterize stimulus-specific response dis-tributions elicited by each of the colors (i.e., 180 colors) in acomplete hue circle using delayed and undelayed estimation. Inorder to establish the relationship between continuous and cate-gorical contents of colors, we independently identify probabilisticcategory boundaries and focal exemplars using category assign-ment and focal identification procedures typical in research oncolor appearance (Figure 2; see also Bae et al., 2014; Witzel &Gegenfurtner, 2013). The results of these experiments are reportedfirst. We then describe a computational model designed to predictempirically obtained response distributions by combining contin-uous estimates and probabilistic category assignments.
Experiments: Categories and Stimulus-SpecificResponse Properties
The experiments included in this study encompass several goals.The first goal is to characterize any systematic stimulus-specificproperties of matching responses to colors on a hue circle (with
Figure 2. Procedure for (a) category naming and (b) category identification. See the online article for the colorversion of this figure.
Thi
sdo
cum
ent
isco
pyri
ghte
dby
the
Am
eric
anPs
ycho
logi
cal
Ass
ocia
tion
oron
eof
itsal
lied
publ
ishe
rs.
Thi
sar
ticle
isin
tend
edso
lely
for
the
pers
onal
use
ofth
ein
divi
dual
user
and
isno
tto
bedi
ssem
inat
edbr
oadl
y.
3CATEGORIES AND PARTICULARS IN COLOR WORKING MEMORY

constant luminance), using both delayed and undelayed estimation.By “systematic,” we mean stimulus-specific properties that do notarise randomly, which we diagnose through correlations acrossindependent observers. Toward this end, we identified a circle of180 equally spaced colors (CIELAB) with a constant luminancethat we employ in delayed and undelayed estimation experiments.Both experiments include only a single sample item in each trial,either presented simultaneously with a response wheel (undelayedestimation) or followed by a delay and then a response wheel(delayed estimation; Figure 1).
Our second goal is to identify category boundaries and focalcolors within the hue circle. We do this using a pair of experimentssimilar to those common in research on color perception (cf.Witzel & Gegenfurtner, 2013). One group of participants com-pleted a category naming experiment, in which they indicate whichcolor term best describes each of the 180 hues. Another group ofparticipants completed a category identification experiment, inwhich they select the best example of each of the basic color termsfrom the complete hue circle. The third goal is to characterize anyreliable relationships between stimulus-specific response proper-ties in the estimation experiments and the category landmarksderived from the category experiments.
Method
Participants. All participants were Johns Hopkins Universityundergraduates who received course-related credit in exchange forparticipation: delayed estimation, n � 3; undelayed estimation,n � 8; category naming, n � 10; category identification, n � 5. Allparticipants had normal or corrected-to-normal visual acuity andreported normal color vision. Each completed only one of the fourexperiments. Protocol was approved by the Johns Hopkins Uni-versity Homewood Institutional Review Board.
Apparatus. The experiment took place in a dark, sound-attenuated room. There was no light source except for a CRTmonitor at a viewing distance of 60 cm, such that the displaysubtended approximately 39.56° � 25.35° of visual angle.
Stimuli. We chose 180 equally spaced stimuli that only variedin hue in CIELAB space (L� � 70, a� � 0, b� � 0, radius of 38;Figure 3). This ring is similar, but not identical, to prevalently usedrings in the literature on delayed estimation. We found that morecommonly used settings were outside the monitor gamut. RGBvalues corresponding to the CIELAB coordinates were generatedby performing a standard monitor calibration (Brainard, Pelli, &
Robson, 2002). In color conversions from device-independent todevice-dependent spaces, we used the measured monitor whitepoint of CIE xyY [0.3184, 0.3119, 48.64]. Conversions betweencolor spaces were performed with colorimetric routines imple-mented in the Psychophysics Toolbox (Brainard, 1997) and radi-ometer measurements (PR655; PhotoResearch Inc., Chattsworth,CA). Stimuli were always presented on a uniform background thatwas the center point of the chosen CIELAB hue ring (L�a�b� �[70,0,0]), in order to ensure equal saturation and chromatic con-trast with respect to background across hues.
Procedures and analyses. In the undelayed estimation exper-iment, participants made color matches to study stimuli as follows.Each trial began with a white fixation cross (0.5° � 0.5°) displayedin the center of the monitor. After 500 ms, the study stimulus (a2° � 2° colored square) appeared at one of eight possible positions(4.5° from fixation) together with the matching wheel (8.2° radiusand 2° thick) that surrounded the space in which study stimulicould appear (Figure 1). The matching wheel consisted of all 180stimuli, organized as a hue circle. On each trial, the matchingwheel was randomly rotated to prevent position-color associations.The task was to click the color on the matching wheel that wasperceived as most similar to the study color. Both the studystimulus and the matching wheel remained on the screen untilresponse, at which time a black line superimposed on the matchingcolor indicated the clicked position.
The undelayed experiment included eight participants. This isbecause we sought approximately 60 measurements across theexperiment in response to each individual hue, a typical number ofmeasurements obtained in delayed estimation experiments within acondition (see, e.g., Bays et al., 2009). Because obtaining 60measurements per color, per participant in this case would haveproduced an excessively long experiment, we divided the 180study colors into two sets of 90 colors. Arbitrarily setting one ofthe colors as Number 1 and then moving around the circle untilcolor 180, the two sets were made by grouping odd and even colorstogether, so that colors within each set formed a color wheel of 90exemplars with an equal spacing of 4° (instead of 2°) betweenhues. Half of the participants were presented only odd exemplarsas study stimuli, and the other half were presented only even ones.All participants, however, encountered the entire color wheelincluding all 180 hues for response selection. Each participantcompleted four blocks of 360 trials, totaling 1,440 trials. Within ablock, each color appeared four times in a random order, produc-
Figure 3. Hue circle used in experiments. (a) Hue circle a� and b� coordinates in CIELAB space, (b) L� valuesof all hues, and (c) x and y values of hue circle, shown within monitor gamut (triangle; CIE xyY space). See theonline article for the color version of this figure.
Thi
sdo
cum
ent
isco
pyri
ghte
dby
the
Am
eric
anPs
ycho
logi
cal
Ass
ocia
tion
oron
eof
itsal
lied
publ
ishe
rs.
Thi
sar
ticle
isin
tend
edso
lely
for
the
pers
onal
use
ofth
ein
divi
dual
user
and
isno
tto
bedi
ssem
inat
edbr
oadl
y.
4 BAE, OLKKONEN, ALLRED, AND FLOMBAUM

ing 16 measurements per color per participant and 64 observationsper color overall.
The delayed estimation task was identical to undelayed estima-tion, with the following exceptions. Most importantly, the studycolor remained on the screen for 100 ms, and then disappearedfrom view for 900 ms. Only after the delay did the matching wheelappear (see Figure 1). Participants were asked to remember thepresented color as precisely as possible.
This experiment included three participants, again, in order toobtain approximately 60 measurements per color across the exper-iment. In this case, each participant completed 10 blocks of 360trials, totaling 3,600 trials. In each block, each of the 180 colorswas presented twice, in a random order, resulting in 20 observa-tions per color and participant and 60 observations per coloroverall. The 10 blocks were distributed over 3 consecutive days(with four blocks on the last day). This experiment was actuallyrun before the undelayed experiment. We found it difficult to findparticipants that would reliably return to the lab over 3 consecutivedays, which led us to the design of the undelayed experiment withmore participants in shorter sessions, but producing approximatelythe same number of observations per color.
We used a mixture model comprised of a von Mises and auniform distribution to analyze the results of each estimationexperiment (Zhang & Luck, 2008). The model includes three freeparameters: the proportion of target-based responses (�, 0 � � �1), bias (�, –� � � � ��), and the concentration parameter of thevon Mises distribution (�, 0 � � � 700), which is the inversevariance and is often called “precision.” Larger � values reflectless dispersed distributions. In the remainder of the article, werefer to precision of color matches. The complete model is asfollows:
p(X | Si) � ���Si � �i, �i� � �1 ��1
2(1)
X denotes the angular position of an estimated hue to a particular
target stimulus, Si, so that p�X�Si� is the probability of a responsesampled by an observer given the target color. Note that we use thesubscript i to denote individual stimulus values, emphasizing thefact that we fit the model to each individual color stimulus with itsown parameters. The first term in the model denotes the von Misesdensity (, circular normal distribution) described by the two freeparameters—� and �—multiplied by a mixture coefficient, �. Byfitting � along with �, we are able to determine whether individualcolors elicit differentially biased distributions, that is, whether theyelicit response distributions not centered on the correct samplecolor.
The second term of the mixture model denotes the uniformdensity attributed to guessing; thus, 1 – � is typically interpreted asthe guessing rate, reflecting trials with encoding or maintenancefailures.
All model fitting was performed by maximum likelihood infer-ence. Parameters were initialized to multiple starting values in anattempt to avoid local maxima. Importantly, we fit the model toeach study color individually.
The category naming experiment (Figure 2a) was designed toidentify boundaries on the hue circle. On each trial, a square (2° �2°) filled with one of the 180 study colors was presented at thecenter of the screen. On the right side of the square, the chromatic
color terms comprising Berlin and Kay’s (1969) eight basic colorcategories were presented vertically (“Red,” “Brown,” “Orange,”“Yellow,” “Green,” “Blue,” “Purple,” and “Pink”). Participantsselected the color term that most closely described the study color.The study square and color terms remained on the screen until aresponse. Each participant completed six trials for each of the 180study colors, presented in random order, for a total of 1,080 trialsper participant. We included 10 participants. Our previous studyusing this method included eight observers (Bae et al., 2014). Weincluded 10 here using a slightly shorter design per participant,intending to obtain the same number of observations nonetheless.
The category identification experiment (Figure 2b) was de-signed to identify focal exemplars for each of the basic color terms.Participants selected the study color that best exemplified eachcolor category as follows. On each trial, the matching wheelappeared in the center of the screen together with the basic colorterms to the right of the wheel. Participants clicked on the match-ing wheel to indicate the best example of each color term. A blackline appeared after the mouse click at each location to preventmultiple responses for the same color term. The matching wheelrandomly rotated on each trial to prevent any association betweencolor and position.
The terms “Red” and “Brown” were excluded because very fewstudy colors were identified with these terms in the color namingexperiment (see Figure 4a). This is likely because of the saturationlevel and luminance selected for the hue circle. Thus, participantsmade six responses—one for each color term—per trial, and theyeach completed 30 trials, resulting in 30 responses for each colorterm per participant.
The purpose of the category experiments pair was to derivedistributions describing category membership for the six basiccolor terms. By collapsing responses across participants (withineach experiment), we obtained two empirical frequencies for eachcolor describing the probability that it was assigned a particularname, as the best name for that color in the category namingexperiment, or as the best example of a given name in the categoryidentification experiment.
Through the category naming experiment, we operationalizedcolor boundaries as colors that were equally likely to be namedwith adjacent category terms. To interpret the results of the iden-tification experiment, we fit six von Mises distributions, one to theresponses elicited by each of the six color terms. The means ofthese distributions were considered estimates of focal exemplars.
Results
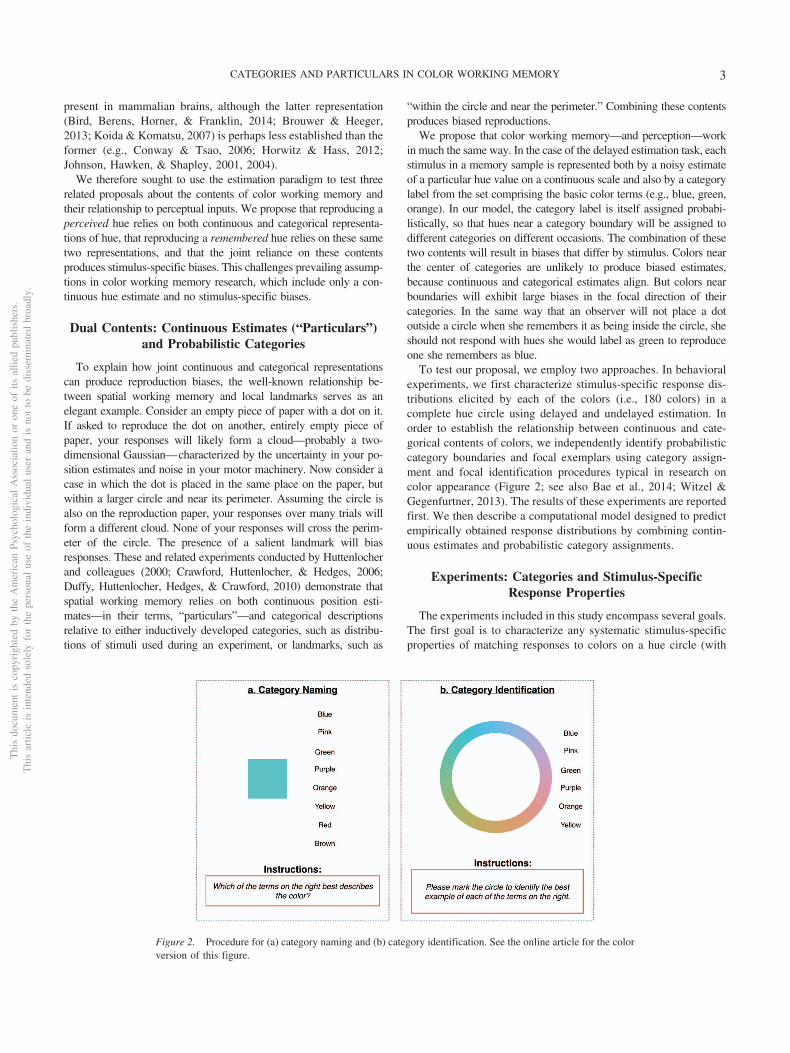
Categorization experiments. Figure 4a plots the results ofthe category naming experiment. Most colors were assigned asingle term repeatedly. But some were likely to elicit more than asingle response, and a handful received two adjacent terms withequal probability. These can be thought of as category boundaries.(Note that “Red” and “Brown” were rarely attributed to any of thesamples). This pattern of response is similar to that in previouscategory experiments (e.g., Boynton & Olson, 1990; Sturges &Whitfield, 1997). Figure 4b plots the frequency with which eachcolor was selected as the best example of any of the six colorsterms, along with best-fit von Mises densities. If all samples withina category were perceived as equally good exemplars of thecategories, these frequencies would have been relatively uniform,
Thi
sdo
cum
ent
isco
pyri
ghte
dby
the
Am
eric
anPs
ycho
logi
cal
Ass
ocia
tion
oron
eof
itsal
lied
publ
ishe
rs.
Thi
sar
ticle
isin
tend
edso
lely
for
the
pers
onal
use
ofth
ein
divi
dual
user
and
isno
tto
bedi
ssem
inat
edbr
oadl
y.
5CATEGORIES AND PARTICULARS IN COLOR WORKING MEMORY
much like the distributions in the naming experiment. But distri-butions in the identification experiment were clearly peaked, re-flecting agreement among observers about best exemplars. Wetreat the peaks of these distributions, operationalized as the meanof a von Mises distribution, as focal colors in the analyses re-ported.
The qualitative take-away from this pair of experiments is thatmany colors were best described by a single color term, but not allof those colors were equally good examples of their respectiveterms. And some colors were neither good examples nor wellcharacterized by a single term.
Precision and bias in the estimation experiments. As ex-pected, both estimation experiments produced uniformly lowguessing rates (1 – �; no-delay average, 0.8%; delay average,2.1%). We could therefore use model-free measures of dispersionand bias to characterize stimulus-specific response characteristics.Indeed, all the results reported are similar when viewed in thisway. But we employ the model-based parameters to accommodatethe broader project of supplying a model of working memorycontents that can be used to analyze responses in situations withhigher expected guessing rates.
Figure 5 shows response distributions with and without delayfor two target examples. It is meant to illustrate three broadlyapplicable points. First, distributions to different hues were notequally dispersed. In these cases, responses to the blue examplewere more dispersed than to the yellow one (high kappa valuescorrespond to low dispersion). Second, responses were biased;the average of a response distribution (represented by the dottedlines in the figure) was usually not the veridical study hue(triangles in the figure). The degree of bias, which was com-puted as the distance between the mean response and the studycolor, was also stimulus-specific, with some study hues show-
ing more bias than other study hues, and as in the two examplesshown, biases were not in the same angular direction for allhues.
These patterns were evident in the data set as a whole. Figure 6makes the point theory-free: We plot the frequency with whicheach color was selected as a response across the whole of eachexperiment. If hues generally elicited similar and unbiased re-sponse distributions, these overall distributions should be close touniform (each color was the target equally often). The distributionsclearly are not uniform. Figure 7 and Figure 8 plot precision andbias estimates for each color with and without delay. Again, therewas considerable color-by-color variability. Crucially, color-by-color � estimates were significantly correlated in two out of threepairwise observer-relationships, and the third correlation was mar-ginally significant, t(178) � 4.51, r � .32, p .01; t(178) � 2.81,r � .21, p .01; t(178) � 1.81, r � .13, p � .07). Estimates of� were also significantly correlated across all pairwise compari-sons, t(178) � 12.88, r � .70, p .001; t(178) � 6.80, r � .45,p .001; t(178) � 11.18, r � .64, p .01).
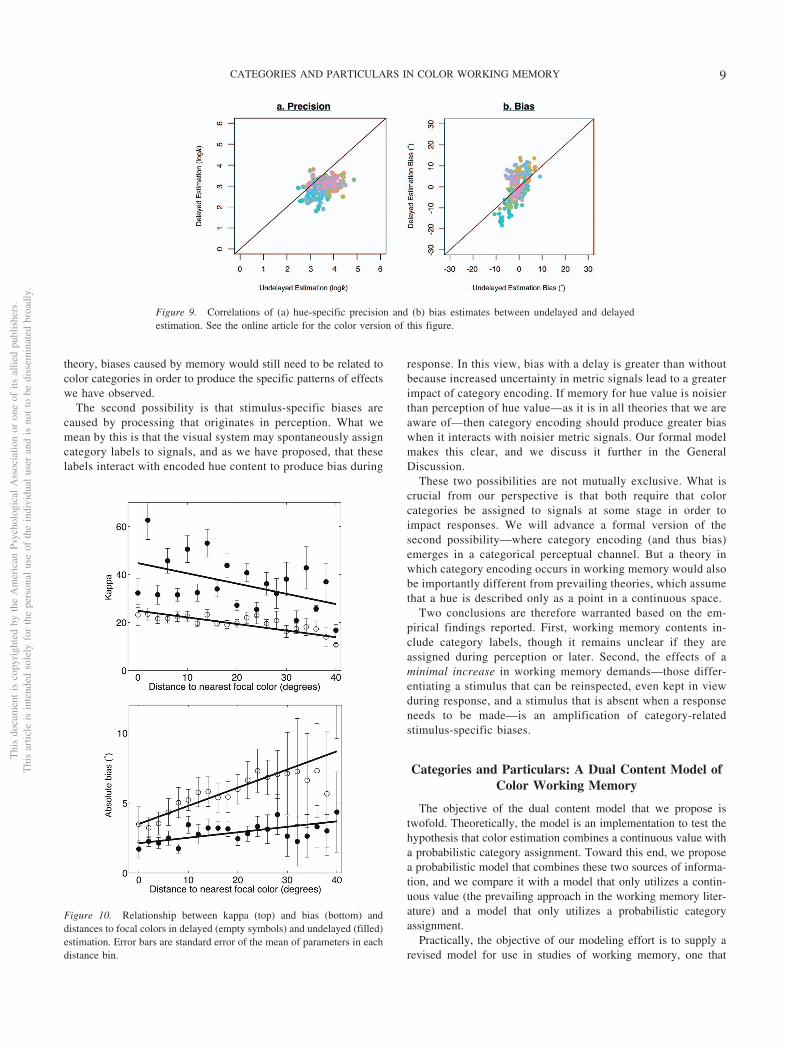
More importantly—for the purpose of characterizing the con-tents and mechanisms of color working memory—delayed � es-timates were significantly smaller (more variable) than undelayedestimates (delayed � � 20.56; undelayed � � 38.39), t(179) �12.26, p .001, and estimates of � were larger (more biased;mean � � 5.61 vs. 2.84), t(179) � 11.204, p .001. Additionally,patterns of stimulus-specific response correlated significantly be-tween delayed and undelayed estimation experiments for both �,t(178) � 5.50, r � .38, p .001, and �, t(178) � 10.82, r � .63,p .001, as shown in Figure 9. Recall that these experimentsincluded distinct groups of participants.
Having established reliable patterns of color-specific responses(with and without a delay), we considered whether these prop-
Figure 4. Results of the (a) category naming and (b) category identification experiments. (a) The responsefrequency with which each color term was used is shown for each of the 180 hues. (b) The response frequencywith which each hue was labeled as the best exemplar for each color term. von Mises distributions fit to theresponse frequencies are shown in (b) as well. See the online article for the color version of this figure.
Thi
sdo
cum
ent
isco
pyri
ghte
dby
the
Am
eric
anPs
ycho
logi
cal
Ass
ocia
tion
oron
eof
itsal
lied
publ
ishe
rs.
Thi
sar
ticle
isin
tend
edso
lely
for
the
pers
onal
use
ofth
ein
divi
dual
user
and
isno
tto
bedi
ssem
inat
edbr
oadl
y.
6 BAE, OLKKONEN, ALLRED, AND FLOMBAUM

erties contained interpretable variability. A number of system-atic effects become qualitatively apparent in the patterns ofhue-specific performance. First, some regions of the hue circleacted as attractors. Hues on either side of these regions showed
oppositely directed biases toward the attractor region. Second,some regions of the color space seemed to repel responses.Responses to their surrounding colors were biased away fromthese regions.
Figure 5. Response distributions for two study hues, in undelayed (top) and delayed (bottom) estimation.Triangles on the graphs designate the true hue values, and dotted lines identify the distribution means. See theonline article for the color version of this figure.
Figure 6. Normalized response frequencies for each individual hue across all observers in the (a) undelayed and (b)delayed estimation experiments. Each hue appeared as a target with equal frequency (60 or 64 times depending on theexperiment). A response proportion of one (the dashed horizontal lines) thus indicates that a matching hue wasselected with the same frequency it appeared as a study hue. Vertical dotted lines indicate focal colors, and verticalsolid lines indicate border colors (see Method). See the online article for the color version of this figure.
Thi
sdo
cum
ent
isco
pyri
ghte
dby
the
Am
eric
anPs
ycho
logi
cal
Ass
ocia
tion
oron
eof
itsal
lied
publ
ishe
rs.
Thi
sar
ticle
isin
tend
edso
lely
for
the
pers
onal
use
ofth
ein
divi
dual
user
and
isno
tto
bedi
ssem
inat
edbr
oadl
y.
7CATEGORIES AND PARTICULARS IN COLOR WORKING MEMORY
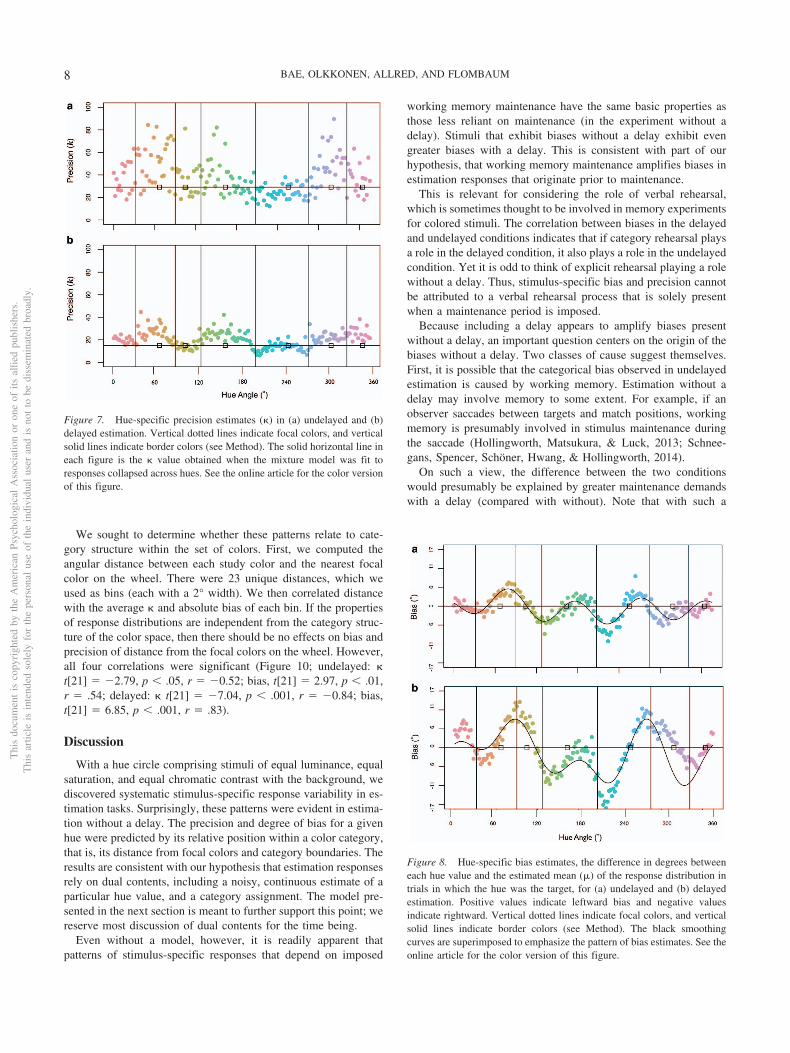
We sought to determine whether these patterns relate to cate-gory structure within the set of colors. First, we computed theangular distance between each study color and the nearest focalcolor on the wheel. There were 23 unique distances, which weused as bins (each with a 2° width). We then correlated distancewith the average � and absolute bias of each bin. If the propertiesof response distributions are independent from the category struc-ture of the color space, then there should be no effects on bias andprecision of distance from the focal colors on the wheel. However,all four correlations were significant (Figure 10; undelayed: �t[21] � �2.79, p .05, r � �0.52; bias, t[21] � 2.97, p .01,r � .54; delayed: � t[21] � �7.04, p .001, r � �0.84; bias,t[21] � 6.85, p .001, r � .83).
Discussion
With a hue circle comprising stimuli of equal luminance, equalsaturation, and equal chromatic contrast with the background, wediscovered systematic stimulus-specific response variability in es-timation tasks. Surprisingly, these patterns were evident in estima-tion without a delay. The precision and degree of bias for a givenhue were predicted by its relative position within a color category,that is, its distance from focal colors and category boundaries. Theresults are consistent with our hypothesis that estimation responsesrely on dual contents, including a noisy, continuous estimate of aparticular hue value, and a category assignment. The model pre-sented in the next section is meant to further support this point; wereserve most discussion of dual contents for the time being.
Even without a model, however, it is readily apparent thatpatterns of stimulus-specific responses that depend on imposed
working memory maintenance have the same basic properties asthose less reliant on maintenance (in the experiment without adelay). Stimuli that exhibit biases without a delay exhibit evengreater biases with a delay. This is consistent with part of ourhypothesis, that working memory maintenance amplifies biases inestimation responses that originate prior to maintenance.
This is relevant for considering the role of verbal rehearsal,which is sometimes thought to be involved in memory experimentsfor colored stimuli. The correlation between biases in the delayedand undelayed conditions indicates that if category rehearsal playsa role in the delayed condition, it also plays a role in the undelayedcondition. Yet it is odd to think of explicit rehearsal playing a rolewithout a delay. Thus, stimulus-specific bias and precision cannotbe attributed to a verbal rehearsal process that is solely presentwhen a maintenance period is imposed.
Because including a delay appears to amplify biases presentwithout a delay, an important question centers on the origin of thebiases without a delay. Two classes of cause suggest themselves.First, it is possible that the categorical bias observed in undelayedestimation is caused by working memory. Estimation without adelay may involve memory to some extent. For example, if anobserver saccades between targets and match positions, workingmemory is presumably involved in stimulus maintenance duringthe saccade (Hollingworth, Matsukura, & Luck, 2013; Schnee-gans, Spencer, Schöner, Hwang, & Hollingworth, 2014).
On such a view, the difference between the two conditionswould presumably be explained by greater maintenance demandswith a delay (compared with without). Note that with such a
Figure 8. Hue-specific bias estimates, the difference in degrees betweeneach hue value and the estimated mean (�) of the response distribution intrials in which the hue was the target, for (a) undelayed and (b) delayedestimation. Positive values indicate leftward bias and negative valuesindicate rightward. Vertical dotted lines indicate focal colors, and verticalsolid lines indicate border colors (see Method). The black smoothingcurves are superimposed to emphasize the pattern of bias estimates. See theonline article for the color version of this figure.
Figure 7. Hue-specific precision estimates (�) in (a) undelayed and (b)delayed estimation. Vertical dotted lines indicate focal colors, and verticalsolid lines indicate border colors (see Method). The solid horizontal line ineach figure is the � value obtained when the mixture model was fit toresponses collapsed across hues. See the online article for the color versionof this figure.
Thi
sdo
cum
ent
isco
pyri
ghte
dby
the
Am
eric
anPs
ycho
logi
cal
Ass
ocia
tion
oron
eof
itsal
lied
publ
ishe
rs.
Thi
sar
ticle
isin
tend
edso
lely
for
the
pers
onal
use
ofth
ein
divi
dual
user
and
isno
tto
bedi
ssem
inat
edbr
oadl
y.
8 BAE, OLKKONEN, ALLRED, AND FLOMBAUM
theory, biases caused by memory would still need to be related tocolor categories in order to produce the specific patterns of effectswe have observed.
The second possibility is that stimulus-specific biases arecaused by processing that originates in perception. What wemean by this is that the visual system may spontaneously assigncategory labels to signals, and as we have proposed, that theselabels interact with encoded hue content to produce bias during
response. In this view, bias with a delay is greater than withoutbecause increased uncertainty in metric signals lead to a greaterimpact of category encoding. If memory for hue value is noisierthan perception of hue value—as it is in all theories that we areaware of—then category encoding should produce greater biaswhen it interacts with noisier metric signals. Our formal modelmakes this clear, and we discuss it further in the GeneralDiscussion.
These two possibilities are not mutually exclusive. What iscrucial from our perspective is that both require that colorcategories be assigned to signals at some stage in order toimpact responses. We will advance a formal version of thesecond possibility—where category encoding (and thus bias)emerges in a categorical perceptual channel. But a theory inwhich category encoding occurs in working memory would alsobe importantly different from prevailing theories, which assumethat a hue is described only as a point in a continuous space.
Two conclusions are therefore warranted based on the em-pirical findings reported. First, working memory contents in-clude category labels, though it remains unclear if they areassigned during perception or later. Second, the effects of aminimal increase in working memory demands—those differ-entiating a stimulus that can be reinspected, even kept in viewduring response, and a stimulus that is absent when a responseneeds to be made—is an amplification of category-relatedstimulus-specific biases.
Categories and Particulars: A Dual Content Model ofColor Working Memory
The objective of the dual content model that we propose istwofold. Theoretically, the model is an implementation to test thehypothesis that color estimation combines a continuous value witha probabilistic category assignment. Toward this end, we proposea probabilistic model that combines these two sources of informa-tion, and we compare it with a model that only utilizes a contin-uous value (the prevailing approach in the working memory liter-ature) and a model that only utilizes a probabilistic categoryassignment.
Practically, the objective of our modeling effort is to supply arevised model for use in studies of working memory, one that
Figure 9. Correlations of (a) hue-specific precision and (b) bias estimates between undelayed and delayedestimation. See the online article for the color version of this figure.
Figure 10. Relationship between kappa (top) and bias (bottom) anddistances to focal colors in delayed (empty symbols) and undelayed (filled)estimation. Error bars are standard error of the mean of parameters in eachdistance bin.
Thi
sdo
cum
ent
isco
pyri
ghte
dby
the
Am
eric
anPs
ycho
logi
cal
Ass
ocia
tion
oron
eof
itsal
lied
publ
ishe
rs.
Thi
sar
ticle
isin
tend
edso
lely
for
the
pers
onal
use
ofth
ein
divi
dual
user
and
isno
tto
bedi
ssem
inat
edbr
oadl
y.
9CATEGORIES AND PARTICULARS IN COLOR WORKING MEMORY
efficiently predicts stimulus-specific response variability and pro-vides transparent parameters for building theories of workingmemory limits. To demonstrate the presence of stimulus-specificbias and precision in the experimental section, we fit a three-parameter mixture model to each of the 180 individual hues on ourcolor circle. But this is an inefficient approach. It ultimatelyincludes many free parameters, requires long experiments, and it isnot obvious how it can be used to build theories of workingmemory limits or to engage in rigorous comparisons of thosetheories. Fortunately, the significant relationships we observedbetween stimulus-specific responses and category landmarks sug-gest a systematic cause—or at least, a reliable predictor—ofinterstimulus response differences. We thus sought to leverage theresults of the category experiments to build a more compact model,one that could replace the prevailing mixture model and eventuallyaccommodate further alterations in the service of better under-standing visual working memory under a variety of experimentalconditions.
CATMET: A Dual Content Model
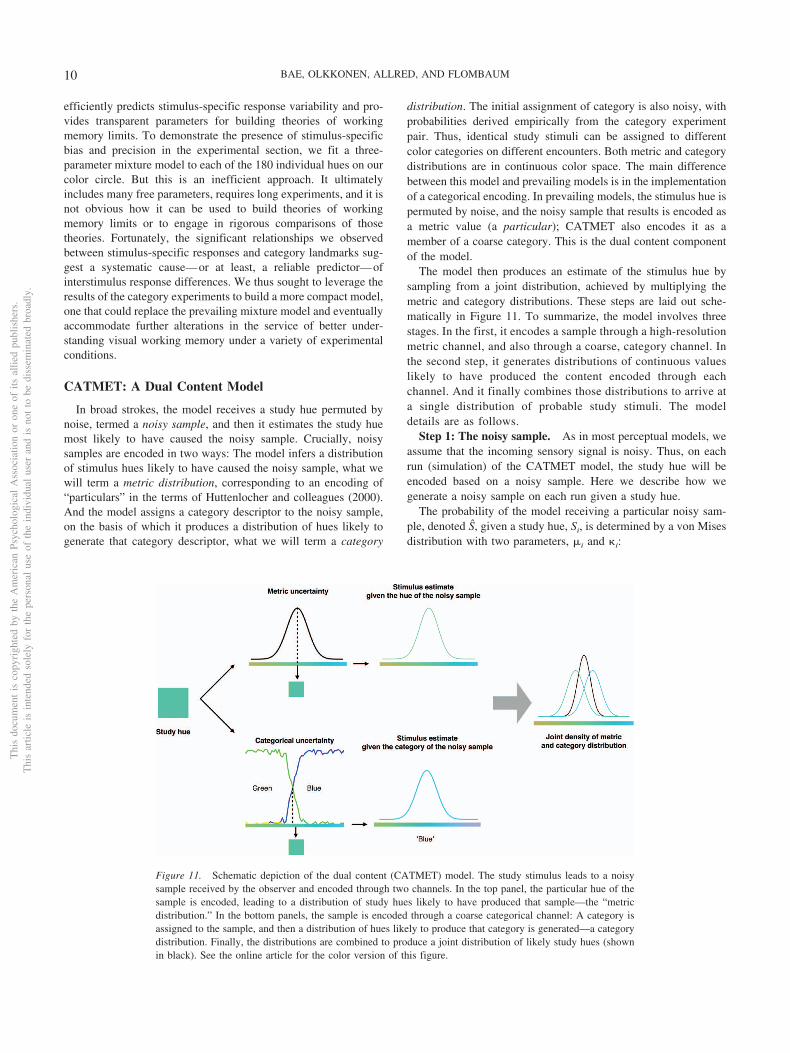
In broad strokes, the model receives a study hue permuted bynoise, termed a noisy sample, and then it estimates the study huemost likely to have caused the noisy sample. Crucially, noisysamples are encoded in two ways: The model infers a distributionof stimulus hues likely to have caused the noisy sample, what wewill term a metric distribution, corresponding to an encoding of“particulars” in the terms of Huttenlocher and colleagues (2000).And the model assigns a category descriptor to the noisy sample,on the basis of which it produces a distribution of hues likely togenerate that category descriptor, what we will term a category
distribution. The initial assignment of category is also noisy, withprobabilities derived empirically from the category experimentpair. Thus, identical study stimuli can be assigned to differentcolor categories on different encounters. Both metric and categorydistributions are in continuous color space. The main differencebetween this model and prevailing models is in the implementationof a categorical encoding. In prevailing models, the stimulus hue ispermuted by noise, and the noisy sample that results is encoded asa metric value (a particular); CATMET also encodes it as amember of a coarse category. This is the dual content componentof the model.
The model then produces an estimate of the stimulus hue bysampling from a joint distribution, achieved by multiplying themetric and category distributions. These steps are laid out sche-matically in Figure 11. To summarize, the model involves threestages. In the first, it encodes a sample through a high-resolutionmetric channel, and also through a coarse, category channel. Inthe second step, it generates distributions of continuous valueslikely to have produced the content encoded through eachchannel. And it finally combines those distributions to arrive ata single distribution of probable study stimuli. The modeldetails are as follows.
Step 1: The noisy sample. As in most perceptual models, weassume that the incoming sensory signal is noisy. Thus, on eachrun (simulation) of the CATMET model, the study hue will beencoded based on a noisy sample. Here we describe how wegenerate a noisy sample on each run given a study hue.
The probability of the model receiving a particular noisy sam-ple, denoted S, given a study hue, Si, is determined by a von Misesdistribution with two parameters, �i and �i:
Figure 11. Schematic depiction of the dual content (CATMET) model. The study stimulus leads to a noisysample received by the observer and encoded through two channels. In the top panel, the particular hue of thesample is encoded, leading to a distribution of study hues likely to have produced that sample—the “metricdistribution.” In the bottom panels, the sample is encoded through a coarse categorical channel: A category isassigned to the sample, and then a distribution of hues likely to produce that category is generated—a categorydistribution. Finally, the distributions are combined to produce a joint distribution of likely study hues (shownin black). See the online article for the color version of this figure.
Thi
sdo
cum
ent
isco
pyri
ghte
dby
the
Am
eric
anPs
ycho
logi
cal
Ass
ocia
tion
oron
eof
itsal
lied
publ
ishe
rs.
Thi
sar
ticle
isin
tend
edso
lely
for
the
pers
onal
use
ofth
ein
divi
dual
user
and
isno
tto
bedi
ssem
inat
edbr
oadl
y.
10 BAE, OLKKONEN, ALLRED, AND FLOMBAUM

p(S | Si) � �(S | Si � �i, �i) (2)
We use the subscript i to denote stimulus specific � and �values, the values that apply to the ith exemplar on the color wheel.But our goal with this model is to characterize stimulus-specificdifferences without stimulus-specific parameters. Indeed, we as-sume that the metric distribution is unbiased, and instead thatobserved biases result from the interaction with a category distri-bution. Accordingly, we assume unbiased sensory signals, endow-ing each study hue with � equal to zero, and we use a single �value for all stimuli. With stimulus-independent von Mises param-eters, Equation 2 can be rewritten as follows:
p(S | Si) � �(S | Si, �) (3)
Rather than fit � within the model, we choose an easily obtain-able estimate. In modeling the results of the experiment without adelay, we obtain � by fitting the prevailing mixture model (Zhang& Luck, 2008; Equation 1) to the responses from that experimentacross all colors simultaneously, a value of 29.10 (which is thevalue of the horizontal line in Figure 7). Our goal here is to quicklyobtain a reasonable, color-neutral estimate in order to see thebehavior that arises from the model generally. We discuss thisfurther after presenting the model results. The same is done whenwe model the experiment with a delay; we fit the mixture model inEquation 1 across all responses and colors in that experiment,obtaining a single � value of 14.89 to utilize in testing the model.
Step 2: Assigning noisy samples to categories. Unlike extantmodels, the CATMET model assigns a category label to any noisysample received. Simply put, it labels the sample with one of a setof basic color terms. For most samples, this should be a straight-forward and uncontroversial process; as shown in Figure 4a, mostindividual hues were reliably named with only one basic colorterm in the category naming experiment. But some colors receivedtwo adjacent labels, such as “Green” and “Blue” with high prob-abilities. On each simulation, we therefore assign labels to samplesprobabilistically, as follows.
First, we derive distributions of boundary colors by identifyingthe colors in the category naming experiment that were closest toreceiving two adjacent color names with equal frequency. We thenset these values as border colors. To implement the assumptionof noisy borders, we use von Mises distributions, centered oneach border color, and with the color-independent � values fromStep 1.
We now have six border colors, which we denote as Bj. On eachmodel simulation, a discrete border between each category j andj � 1 is selected randomly by drawing a color from the probabi-listic distributions defined by the parameters �j and �B. (The “B”subscript here is just meant to denote the fact that we use the sameprecision value for all boarders).
Bj � ���j, �B� (4)
With the sampled border colors, Bj, the category of a target coloris determined by the relative position of a target color and eachborder color (Ashby & Maddox, 1993). Suppose a target color isSi, and there are six alternative categories:
if the angular position of Si � B1 and � B2; then Si � category 1
�B2 and � B3; then Si � category 2
�B3 and � B4; then Si � category 3
� B4 and � B5; then Si � category 4
�B5 and � B6; then Si � category 5
�B6 and � B1; then Si � category 6
(5)
Straightforwardly, if Si is between Bj and Bj�1, the modeldetermines that the target color is a member of category j. By usingnoisy samples and noisy borders, a single stimulus (especially onenear a border) will be assigned to different categories on differentsimulations. Thus, on each model simulation the noisy sample Sthat is used (in Step 4) to generate the metric distribution of likelystimulus hues, is also assigned a category which we denote C.
Step 3: Probability of study hues given a category. With acategory label assigned, the model now engages in a process toensure that a response generated will be a good example of thecategory assigned. The coarse encoding of category leads themodel to prefer responses that are better examples of a particularcategory. To do this, the model calculates the probability that eachstudy hue would have produced the category description encodedin Step 2. Formally, the probability of drawing a hue from adistribution of hues that are likely to belong to category C:
p�XC | C) � �(XC | �c, �c) (6)
We denote this distribution XC, in order to distinguish it fromthe distribution reflecting the probability of study hues obtained onthe basis of a sample’s encoded metric value in extant models (andalso in Step 4 upcoming, and denoted XS). �c and �c are param-eters describing a distribution of hue values in category C. Weestimate their values using the data from the category experimentpair.
To do so, we combine the data from both category experimentsinto a frequency distribution, as follows. The raw data on each trialof those experiments—a total of 10,800 color naming and 150category identification trials—are a color value and color term thatwere associated by a participant. On the basis of each experiment,we thus compute the probability of each of 180 colors beingassociated with a given color term. Because for each color we nowhave two association probabilities (one from each of the categoryexperiments), we average the probabilities, producing a unifiedprobability of association between each of the six basic color termsand each of the 180 color values. In other words, for each indi-vidual color term—the six possible color categories—we nowhave a distribution of normalized association strengths with eachof the 180 hues. To each of these six distributions we fit a vonMises, thus obtaining estimates for �c and �c for each categorydistribution. With these parameters, we can now use Equation 6 to
compute p�XC � C� for each color category and each of the 180hues.
Step 4: Probability of study hues given a noisy sample. Inaddition to encoding the noisy sample (Equation 3) through acoarse categorical channel, the model encodes it through a higherresolution channel. That is, it records the exact sample hue fromamong the set of 180 possible hues. And it then generates a
Thi
sdo
cum
ent
isco
pyri
ghte
dby
the
Am
eric
anPs
ycho
logi
cal
Ass
ocia
tion
oron
eof
itsal
lied
publ
ishe
rs.
Thi
sar
ticle
isin
tend
edso
lely
for
the
pers
onal
use
ofth
ein
divi
dual
user
and
isno
tto
bedi
ssem
inat
edbr
oadl
y.
11CATEGORIES AND PARTICULARS IN COLOR WORKING MEMORY

distribution of study hues likely to have generated the encodedsample hue. This is accomplished using Bayes’ theorem:
p(XS | S) p(S | XS)p(XS) (7)
Here, p(XS) is a uniform density—all colors are equally likely to
occur—such that p�XS � S� is simply identical to p�S � XS� , a valueobtainable by using Equation 3 (with XS replacing Si). Step 4 thusimplements what is the typical metric model applied widely inprevious work (e.g., Zhang & Luck, 2008).
Step 5: Estimating the study hue. To arrive at a final esti-mate of the study hue, we combine the metric information aboutthe noisy sample in Step 4 with the category information about thenoisy sample in Step 3. This joint probability distribution is createdby combining the two distributions in Step 3 and Step 4 (Equations6 and 7). We denote the final joint distribution XJD.
p(XJD | S, C) �p(XS | S)p(XC | C)
� p(XC|S)p(XS | C)(8)
A single hue estimate for the response in a given simulation is
obtained by sampling from the distribution p�XJD � S,C�
Analysis
We used the CATMET model to generate simulated responsesto the delayed and undelayed estimation experiments that partici-pants completed. As noted already, in places where the modelemployed a color-neutral � value, it was derived from the data inthe appropriate experiment (i.e., delay or undelayed estimation).This was the only parameter derived from the estimation experi-
ments themselves. The parameters employed in the assignment anduse of category information were fit to responses in the categori-zation experiments, which involved unique groups of participants,and which did not involve estimation responses.
The model generated 100 simulated responses to each of the 180hues, in a simulated version of the undelayed as well as the delayedestimation experiments. Once simulated responses had been gen-erated, we repeated the analyses that had been applied to theempirical results of the estimation experiments; we fit a mixturemodel to each individual color, thus allowing us to characterize thestimulus-specific response properties (dispersion and bias) thatarose in practice (from a model with no initial representationalbiases). We then compared these parameters with those that wehad obtained from the responses of human participants.
Results
The CATMET model produced biased responses that are similarto the biases measured in the responses of human observers (Fig-ure 12). The mean-response (�) fits we obtained from the modelwere highly correlated with those of human observers (no-delay,r � .55, p .001; delay, r � .65, p .001). Estimates of responseprecision, on a color-by-color basis (Figure 13) fit to model re-sponses also correlated significantly with the estimates fit to re-sponses from experimental participants (no-delay, r � .16, p .05; delay, r � .39, p .001). Although significant, these corre-lations were weaker than those for bias. In participants, between-observer correlations were also weaker for matching precision thanfor bias. Thus, the precision of color matches appears less system-atic than the bias of color matches.
Figure 12. CATMET model-derived (black open circles) and observer-derived (filled circles) bias estimatesfor undelayed and delayed estimation; four-category model shown. See the online article for the color versionof this figure.
Thi
sdo
cum
ent
isco
pyri
ghte
dby
the
Am
eric
anPs
ycho
logi
cal
Ass
ocia
tion
oron
eof
itsal
lied
publ
ishe
rs.
Thi
sar
ticle
isin
tend
edso
lely
for
the
pers
onal
use
ofth
ein
divi
dual
user
and
isno
tto
bedi
ssem
inat
edbr
oadl
y.
12 BAE, OLKKONEN, ALLRED, AND FLOMBAUM

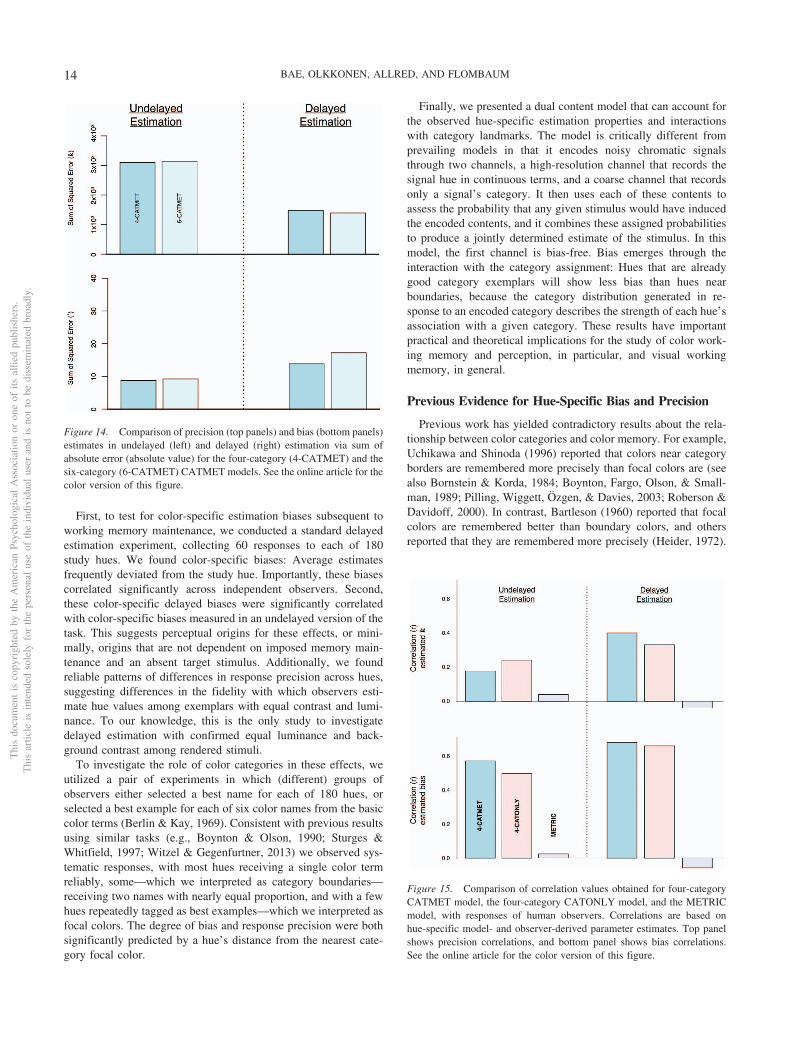
These correlations were obtained from a version of the CATMETmodel utilizing only four (instead of six) categories, “Orange,”“Green,” “Blue,” and “Pink.” The four-category model performedbetter than the six-category model, and inspection of observerresponses suggests that these categories are more obviously pres-ent in the set of colors, with yellow and purple less well repre-sented. But the six-category model faired worse only by a smallmargin, as shown in Figure 14, which plots summed squared errorfor each model’s hue-specific predictions compared with estimatesobtained from observer responses.
Comparison With Other Models
We also compared the CATMET model with two additionalmodels—one that uses only category encoding (CATONLY), andone that is more similar to the prevailing approach, using onlycontinuous values, without categories (the METRIC model). Im-plementation of these models is straightforward. The METRICmodel omits all steps apart from Steps 1 and 4 in the CATMETmodel. It receives a noisy sample, encodes the hue of that sample,which then becomes the basis for an inferred distribution of likelystimulus values (from which responses are sampled). The CA-TONLY model, in contrast, omits Steps 4 and 5. It encodes a noisysample only in terms of its category. It then generates a distributionof stimulus hues likely to belong to the encoded category, and itsamples responses from only that distribution.
We simulated each of these Models 100 times for each of the180 hues, then fitting hue-specific � and � estimates to thegenerated responses (Equation 1), as we initially did for the re-
sponses of human participants. These estimates were then corre-lated with those obtained from the human participants, with rvalues for each correlation shown in Figure 15. The CATMETmodel produced stronger correlations than the CATONLY model,whereas the correlations with the METRIC model were uniformlyclose to zero.
Discussion
To summarize, the CATMET model produced stimulus esti-mates and responses that correlated relatively strongly and signif-icantly with biases observed in human responses. Crucially, itachieved this outcome with underlying representations that wereunbiased. Bias emerged by combining category-dependent andvalue-dependent estimates obtained through simultaneous encod-ing channels. Devising the model in this way, we sought to capturewhat seems to us a commonsense way of characterizing individualcolors, as particular cases within categories, as opposed to partic-ular cases within a general and entirely continuous color space.
General Discussion
We sought to test a three-part hypothesis: (a) that workingmemory maintenance exhibits color-specific biases, (b) that thesebiases originate in perception, and (c) that observers functionallyuse two kinds of color information when matching colors betweenobjects, an estimate of hue on a continuous scale—what has beencalled a “particular” in other contexts (e.g., Huttenlocher et al.,2000)—and a probabilistic category assignment.
Figure 13. CATMET model-derived (black open circles) and observer-derived (filled circles) precisionestimates for undelayed and delayed estimation; four-category model shown. See the online article for the colorversion of this figure.
Thi
sdo
cum
ent
isco
pyri
ghte
dby
the
Am
eric
anPs
ycho
logi
cal
Ass
ocia
tion
oron
eof
itsal
lied
publ
ishe
rs.
Thi
sar
ticle
isin
tend
edso
lely
for
the
pers
onal
use
ofth
ein
divi
dual
user
and
isno
tto
bedi
ssem
inat
edbr
oadl
y.
13CATEGORIES AND PARTICULARS IN COLOR WORKING MEMORY
First, to test for color-specific estimation biases subsequent toworking memory maintenance, we conducted a standard delayedestimation experiment, collecting 60 responses to each of 180study hues. We found color-specific biases: Average estimatesfrequently deviated from the study hue. Importantly, these biasescorrelated significantly across independent observers. Second,these color-specific delayed biases were significantly correlatedwith color-specific biases measured in an undelayed version of thetask. This suggests perceptual origins for these effects, or mini-mally, origins that are not dependent on imposed memory main-tenance and an absent target stimulus. Additionally, we foundreliable patterns of differences in response precision across hues,suggesting differences in the fidelity with which observers esti-mate hue values among exemplars with equal contrast and lumi-nance. To our knowledge, this is the only study to investigatedelayed estimation with confirmed equal luminance and back-ground contrast among rendered stimuli.
To investigate the role of color categories in these effects, weutilized a pair of experiments in which (different) groups ofobservers either selected a best name for each of 180 hues, orselected a best example for each of six color names from the basiccolor terms (Berlin & Kay, 1969). Consistent with previous resultsusing similar tasks (e.g., Boynton & Olson, 1990; Sturges &Whitfield, 1997; Witzel & Gegenfurtner, 2013) we observed sys-tematic responses, with most hues receiving a single color termreliably, some—which we interpreted as category boundaries—receiving two names with nearly equal proportion, and with a fewhues repeatedly tagged as best examples—which we interpreted asfocal colors. The degree of bias and response precision were bothsignificantly predicted by a hue’s distance from the nearest cate-gory focal color.
Finally, we presented a dual content model that can account forthe observed hue-specific estimation properties and interactionswith category landmarks. The model is critically different fromprevailing models in that it encodes noisy chromatic signalsthrough two channels, a high-resolution channel that records thesignal hue in continuous terms, and a coarse channel that recordsonly a signal’s category. It then uses each of these contents toassess the probability that any given stimulus would have inducedthe encoded contents, and it combines these assigned probabilitiesto produce a jointly determined estimate of the stimulus. In thismodel, the first channel is bias-free. Bias emerges through theinteraction with the category assignment: Hues that are alreadygood category exemplars will show less bias than hues nearboundaries, because the category distribution generated in re-sponse to an encoded category describes the strength of each hue’sassociation with a given category. These results have importantpractical and theoretical implications for the study of color work-ing memory and perception, in particular, and visual workingmemory, in general.
Previous Evidence for Hue-Specific Bias and Precision
Previous work has yielded contradictory results about the rela-tionship between color categories and color memory. For example,Uchikawa and Shinoda (1996) reported that colors near categoryborders are remembered more precisely than focal colors are (seealso Bornstein & Korda, 1984; Boynton, Fargo, Olson, & Small-man, 1989; Pilling, Wiggett, Özgen, & Davies, 2003; Roberson &Davidoff, 2000). In contrast, Bartleson (1960) reported that focalcolors are remembered better than boundary colors, and othersreported that they are remembered more precisely (Heider, 1972).
Figure 14. Comparison of precision (top panels) and bias (bottom panels)estimates in undelayed (left) and delayed (right) estimation via sum ofabsolute error (absolute value) for the four-category (4-CATMET) and thesix-category (6-CATMET) CATMET models. See the online article for thecolor version of this figure.
Figure 15. Comparison of correlation values obtained for four-categoryCATMET model, the four-category CATONLY model, and the METRICmodel, with responses of human observers. Correlations are based onhue-specific model- and observer-derived parameter estimates. Top panelshows precision correlations, and bottom panel shows bias correlations.See the online article for the color version of this figure.
Thi
sdo
cum
ent
isco
pyri
ghte
dby
the
Am
eric
anPs
ycho
logi
cal
Ass
ocia
tion
oron
eof
itsal
lied
publ
ishe
rs.
Thi
sar
ticle
isin
tend
edso
lely
for
the
pers
onal
use
ofth
ein
divi
dual
user
and
isno
tto
bedi
ssem
inat
edbr
oadl
y.
14 BAE, OLKKONEN, ALLRED, AND FLOMBAUM

Still other studies have failed to find systematic relationshipsbetween categories and fidelity of color memory; Witzel andGergenfurtner (2013) found that category boundaries are notbroadly predictive of stimulus-specific differences in discrimina-tion thresholds and others have reported a lack of systematic biasas a function of hue (Allred & Olkkonen, 2015; Jin & Shevell,1996; Siple & Springer, 1983).
One potential explanation for these mixed results involves dif-ferences in methodology. Alternative forced choice (AFC) meth-ods for example may lead observers to rely on category andparticular encodings differently than they do in estimation tasks.However, several observations suggest that our findings may gen-eralize to other tasks. First, we previously reported hue-specificresponse precision using an estimation task with a different re-sponse method (Bae et al., 2014): an aperture through whichparticipants rotated a color wheel to reveal one hue at a time (seealso van den Berg et al., 2012). Hue-specific responses in thisexperiment correlated significantly with responses in the standardestimation experiment. The effects in a standard estimation tasktherefore generalize to an adjustment procedure. And second, therelative sizes of the biases we have reported here are consistentwith those reported elsewhere in tasks using AFC methods (Nemeset al., 2010; Olkkonen & Allred, 2014). We found values up to 10°,but with significant and systematic effects as small as 2° near focalcolors, which is the smallest measurable effect in these experi-ments.
Two other methodological issues, both involving sampling, mayproduce differences between studies. First, if study stimuli sampleonly a small region of color space, or coarsely sample large regionsof color space, they are ill-quipped to uncover patterns of re-sponses across a hue circle (Allred & Olkkonen, 2015; Hedrich,Bloj, & Ruppertsberg, 2009; Ling & Hurlbert, 2008). Second, ifstudy stimuli are sampled too coarsely, this could also produce theimpression of relatively discrete and precise—as opposed to prob-abilistic—category boundaries. To see why, consider the patternof results in Figures 6 and 10. We have demonstrated that bias nearboundaries is toward focal colors. Imagine that colors on eitherside of the blue–green border are sampled—a between-borderdiscrimination. If the border colors sampled are very far from theborder, the focal bias will pull the just-green toward green and thejust-blue toward blue, and the between-category discriminationwill appear very good. If, on the other hand, the colors sampled arevery close to the border region, study colors will be easily con-fused. Thus, many small-spaced samples across a relatively largespace may be necessary to identify the kinds of effects found in ourstudy.
Finally, it is important to note that, in their original report,Zhang and Luck (2008) did investigate the possibility of categoryeffects—and found none. Specifically, Zhang and Luck were con-cerned that participants may encode stimuli only in terms of colorcategories, then selecting a nearby focal color value, but respectingcategory boundaries when making responses. To investigate thispossibility, they conducted an appropriate analysis, generating aheat map for responses given each target value with a memory loadof one. A category-only representation, they predicted, wouldproduce a staircase pattern in such a heat map; but they found acontinuous distribution, with average responses near target values.The problem is that this analysis assumes clear, “noiseless” bound-aries and focal colors. The noisy nature of category boundaries, in
practice, means that responses near boundaries will appear“fuzzy,” not staircase-like, even if observers respect boundaries.(Indeed, we were able to replicate their analysis with our data).Likewise, the noisy focal colors will lead to continuous distribu-tions of category responses rather than discrete ones.
With the data from our delayed estimation experiment—whichclearly include category effects—we were able to produce a heatmap of responses very similar to the one produced by Zhang andLuck (2008), and meant to suggest an absence of category effects(see Figure 16). In contrast, Figure 6 presents an alternative routeto detecting nonuniformity in responses—one that many groupscan easily apply to their data sets (assuming each hue has beenpresented as target a sufficient number of times). There, we plottednormalized response frequency for each hue. There are clear peaksand valleys; retrospectively, it is clear that the biggest effects areat the category prototypes, not the boundaries. If hues generallyelicited similar and unbiased response distributions, these overalldistributions should be close to uniform (each color was the targetequally often). The distributions clearly are not uniform. Figures 7and 8 plot precision and bias estimates for each color with andwithout delay.
Overall, a contribution of this work to ongoing research onprecision and bias as a function of category structure is in dem-onstrating that the estimation paradigm—devised for, and untilnow used only to study, working memory—can serve as anefficient paradigm for studying color perception. Forced choiceand related psychophysical approaches require too many trials todesign experiments with 180 hues and sufficient numbers of com-parative observations. Future work should continue to investigateborder and focal color performance, perhaps using estimation as ameans to select smaller subsets of important comparisons for usewith forced choice and related methods.
Figure 16. Heat map showing color reports as a function of a target’s truecolor in delayed estimation, replicating an analysis conducted by Zhangand Luck (2008; see their supplementary material). See the online articlefor the color version of this figure.
Thi
sdo
cum
ent
isco
pyri
ghte
dby
the
Am
eric
anPs
ycho
logi
cal
Ass
ocia
tion
oron
eof
itsal
lied
publ
ishe
rs.
Thi
sar
ticle
isin
tend
edso
lely
for
the
pers
onal
use
ofth
ein
divi
dual
user
and
isno
tto
bedi
ssem
inat
edbr
oadl
y.
15CATEGORIES AND PARTICULARS IN COLOR WORKING MEMORY

Color Terms and Categories: Verbal VersusVisual Memory
Throughout this report, we have used “color categories” and“color terms” interchangeably. But some have drawn a distinctionbetween linguistic labels that do not necessarily map onto under-lying representations, and category markers in visual processing ofcolor. This distinction may also relate to a common distinctionbetween verbal and visual working memory (Baddeley & Hitch,1974), with some arguing that color terms can be stored in verbalworking memory, whereas visual working memory traffics only incontinuous coordinates (Luck & Vogel, 2013).
Importantly, the practical implications of our work are indepen-dent of whether the categorical channel is verbal or nonverbal. Wehave demonstrated empirically that participant responses vary byhue in ways that relate to color terms, and that these responses canbe modeled by combining probabilistic categorization with con-tinuous hue estimates. Regardless of the underlying cause, this factis important for understanding behaviors guided by visual workingmemory.
Theoretically, though, we would suggest that our results areconsistent with the hypothesis that categorization occurs as part ofvisual processing, before any additional verbal labeling takesplace. Category effects emerged in undelayed estimation, whenresorting to verbal encoding is unnecessary, because the study hueremained perpetually in view during response selection. Similarly,in our previous study (Bae et al., 2014), category effects werepresent with very short exposure and delay periods (100 ms each)and with large memory loads, where verbal encoding and rehearsalwould be difficult and unlikely.
Note that categorical processing need not involve verbal re-hearsal in principle. In the case of object orientation, for example,degrees of tilt are coded within the context of associated categorylabels related to object-internal axes and external frames of refer-ences. Roughly, this can be thought of as coding an object as “thetop of the object is tilted to the left, by 30 degrees’” in contrastwith “tilted 330 degrees.” Categorical, nonverbal encoding oforientation appears critical for explaining neuropsychological dys-function as well as performance asymmetries with healthy partic-ipants (adults and children; Gregory, Landau, & McCloskey, 2011;Gregory & McCloskey, 2010; McCloskey, 2009; McCloskey, Val-tonen, & Sherman, 2006; Valtonen, Dilks, & McCloskey, 2008).Similar conclusions have been reached in the context of orientationand visual search, in which it has been suggested that objects arepreattentively categorized as “steep,” “shallow,” “tilted-left,” and“tilted-right,” with attentive processing then augmenting theserepresentations with continuous angular values (Wolfe, Friedman-Hill, Stewart, & O’Connell, 1992; see also Foster & Ward, 1991;Treisman & Gormican, 1988).
In the case of color, whether nonverbal categorization takesplace has long been an important question (along with broaderquestions about the impacts on perception of verbal categoriza-tion). Evidence that is consistent with nonverbal categorizationtaking place within perception includes neural evidence of earlycategorical encoding in the brain (Bird et al., 2014; Stoughton &Conway, 2008), categorical color constancy in perception of real-world scenes (Olkkonen et al., 2010), and categorical effects onvisual search for colored targets (Daoutis et al., 2006). The re-ported results contribute to this body of evidence by demonstrating
that categorization influences matching performance even with anin-view stimulus. Strengthening this evidence, as well, is thereported reliability of interobserver category judgments and theability to predict categorical influences on matching performancein one group of participants based on category landmarks identi-fied by other individuals.
Nonuniform Visual Memory
The empirical results presented here falsify key assumptionsbuilt into current models of working memory. Specifically, wehave demonstrated that the fidelity of working memory—both interms of bias and precision—is not uniform across hues with equalluminance and equal chromatic contrast with the background.These results suggest that conclusions previously drawn aboutworking memory utilizing delayed estimation should be reexam-ined, having incorporated inaccurate assumptions into data analy-sis and interpretation.
As one example, consider the debate about whether or notobservers ever “drop” items from memory—perhaps because of afixed capacity limit (see, e.g., Luck & Vogel, 2013; Ma, Husain, &Bays, 2014). Because the question is about whether some re-sponses amount to random guesses, average angular error cannotbe used to compare theories; it would conflate target-directed and“guess” responses. This calculus led Zhang and Luck (2008) totheir influential mixture model (Equation 1), designed to estimateaverage guessing rate and average response precision by bestaccounting for the individual angular errors that participants pro-duce on each trial. The fitting seeks parameters that manage thetrade-off between lowering precision and, effectively, countingfewer responses as guesses (see also Suchow, Fougnie, Brady, &Alvarez, 2014). But in the way the fitting has been done, itincorporates the assumption that all target-directed responsesshould look more or less the same, or equivalently, that no target-directed responses should look more guess-like than ones directedto any other target. Our results invalidate this assumption: Somecolor targets do tend to elicit responses that are more distributedthan others and with means distant from the target, responses thatwould look like guesses under a high-precision, unbiased assump-tion applied to all colors equally.
The same concerns apply to many modifications, extensions,and proposed alternatives to the Zhang and Luck (2008) model.For example, Bays and colleagues (2009) proposed that in additionto target-directed and guess responses, observers sometimes makenon-target-directed responses, arising from feature and object mis-bindings (Treisman & Gelade, 1980). To estimate the frequency ofthese occurrences, they added a misbinding term to the Zhang andLuck model. In this case, the misbinding term included the sameprecision parameter as the target-directed term in the model. Inother words, it implemented a uniformity assumption in twoplaces. On this basis, Bays and colleagues argued that previousmodels produced the appearance of high guessing rates—inter-preted to demonstrate fixed capacity limits—because they misat-tributed misbinding as guessing.
It may turn out that deriving an estimated misbinding rate witha base that is more similar to our model (or some other set ofnonuniform expectations) will produce very similar estimates asthose obtained previously. But at this stage, the question remainsopen, empirical, and nontrivial. Assigning a probability to a given
Thi
sdo
cum
ent
isco
pyri
ghte
dby
the
Am
eric
anPs
ycho
logi
cal
Ass
ocia
tion
oron
eof
itsal
lied
publ
ishe
rs.
Thi
sar
ticle
isin
tend
edso
lely
for
the
pers
onal
use
ofth
ein
divi
dual
user
and
isno
tto
bedi
ssem
inat
edbr
oadl
y.
16 BAE, OLKKONEN, ALLRED, AND FLOMBAUM

response under the assumption that it reflects a misbinding de-pends on the probability one would assign were it actually aresponse to the same hue in the case that the hue were the actualtarget. Just like estimating guessing rates, accurately estimatingmisbinding rates depends on one’s expectations about what target-directed responses will look like for each hue, and we havedemonstrated that those expectations should not be uniform.
A final example concerns recent models that propose stochasticcauses of intertrial and interitem precision (e.g., van den Berg etal., 2012; see also Fougnie et al., 2012). Essentially, these modelspropose that representational precision does not have the samevalue at all moments in time, and should itself be thought of asdrawn from a (gamma) distribution. To account for seeminglyunlikely responses as nonetheless target-directed, the models ulti-mately suggest that with some frequency, precision is very low,making large angular-error responses more likely than they mightotherwise appear (i.e., given a single precision value applied to alltrials). The radical significance of this hypothesis is in the sugges-tion that there may be no fixed capacity limits in working memorywhatsoever, evident in the complete absence of guessing responsesin model fits.
But the methodological and analytical problem here should beclear: If each trial has a different target color, and different colorstend to produce different response distributions—some that arerelatively biased and imprecise—then color-driven trial-by-trialvariability needs to be accounted for before further stochasticvariability can be evaluated. The relevant models were fit under anassumption of color uniformity.
None of the studies just mentioned are unique with respect to auniformity assumption. In fact, all delayed estimation experimentswe are aware of, including those investigating other visual fea-tures, appear to assume uniformity. And there are reasons to expectthat nonuniformity extends to other stimulus domains. Orientationis probably the second most common feature in studies of visualworking memory with delayed estimation. All the relevant studiesin this domain also seem to assume representational uniformity.But there are extant results that should give pause. There areknown orientation-dependent asymmetries in visual search (Foster& Ward, 1991; Treisman & Gormican, 1988; Wolfe et al., 1992),there are theories of orientation representation that rely on cate-gorical variables (McCloskey, 2009), and the accuracy of orienta-tion estimation is known to depend on orientation, apparentlydriven by prior expectations over orientation frequencies (Gir-shick, Landy, & Simoncelli, 2011).
Thus, we suspect that uniformity assumptions are violated inpractice in all, or nearly all, estimation experiments in which theyhave been applied—certainly in all cases pertaining to color.Recognizing this may turn out to be a positive development.Debates concerning the underlying structure of visual workingmemory appear intransigent. Perhaps the impasse is to some de-gree caused by unexpected perceptual nonuniformity interactingwith individual stimulus and data sets.
Finally, we note that there are many ways to formally charac-terize nonuniformities in a relevant feature space. The CATMETmodel does so on the basis of category identification experimentsof a manageable size, and it is a natural extension of the originalZhang and Luck (2008) mixture model. In particular, CATMETuses a single precision value, but produces nonuniform estimatesthrough a combination of hue information with category informa-
tion. In this way, it may supply a quick, initial method for estab-lishing parameter estimates for guessing rates, precision, and mis-binding rates as a function of memory load. We hope that furtherresearch will identify alterations that can more completely modelstimulus-specific response properties and also illuminate the na-ture of visual working memory limits.
Categories as Priors
The main theoretical contribution of this work is to support thehypothesis that estimation abilities for color rely on both contin-uous and categorical representations, even when a stimulus is inview. What appears, in aggregated responses, as differences in thememorability of different colors is the consequence of a tendencyto categorize colors such that some are better examples of a givencategory than others, and with some as reasonable examples ofmore than one category. Colors are more accurately and preciselyremembered when they are good examples of their respectivecategories.
The CATMET model was inspired by related models describedby Huttenlocher and colleagues (2000) in the case of spatialmemory, and thus it relied on a category-encoding channel. Thisseems intuitive to us in the case of color, in which typical discoursewill refer to particulars within a category as opposed to justparticulars. To pump intuition: It seems that a paint buyer is morelikely to hold up a sample and say, “We want this blue,” than tosay, “We want this color.”
But there are other ways one might arrive to similar outcomes.One important possibility is that perceptual context effects elicitthe bias: Embedding a hue in the color wheel may alter itsperception compared with the study hue. Perhaps the color wheelitself draws responses to particular points: category centers. Couldthe results be a response bias caused by perception of the colorwheel, rather than any actual encoding of the study hue’s category?Although this kind of perceptual context effect may play a role inestimation without delay, we note that the effects were even largerin the memory experiment. Thus, the bias is not purely a percep-tual context effect.
A more thorny issue concerns whether the samples were actu-ally encoded as categories, as our model and theorizing suggest.Perhaps a purely metric encoding interacts with a perceptualcontext effect at the wheel to produce response bias. In this case,the noisier metric encoding during estimation with delay wouldincrease the relative weight of the perceptual context effect. Forexample, an observer may encode the sample as #136, but uponinspecting the wheel, note that #139 is a better example of the kindof category that #136 belongs to. There are a number of reasons tothink this is not the best explanation for the effects. Specifically, inour previous work (Bae et al., 2014), we found the same pattern ofstimulus specific effects using a different response method—anaperture for viewing a single color at a time with the wheel rotatingbelow. Similar biases have also been found in research with AFCmethods (Nemes et al., 2010; Olkkonen & Allred, 2014). Thus, itseems inaccurate to describe the effects as merely response bias,driven by the response method.
But there is one other alternative that may suggest a usefuldistinction between working memory and long-term memory in themechanisms that support color matching. This alternative relies onlong-term memory to encode a prior over hues that can reflect
Thi
sdo
cum
ent
isco
pyri
ghte
dby
the
Am
eric
anPs
ycho
logi
cal
Ass
ocia
tion
oron
eof
itsal
lied
publ
ishe
rs.
Thi
sar
ticle
isin
tend
edso
lely
for
the
pers
onal
use
ofth
ein
divi
dual
user
and
isno
tto
bedi
ssem
inat
edbr
oadl
y.
17CATEGORIES AND PARTICULARS IN COLOR WORKING MEMORY

category structure. That is, from a more typical Bayesian perspec-tive, a nonuniform prior over hues—with higher probabilities atfocal colors—might produce the effects without an explicitly cat-egorical encoding of each instance. We cannot exclude this pos-sibility based on our current analyses, and we welcome futureinvestigation of related models that are more traditionally Bayes-ian. Indeed, the consequences of a categorical encoding channel inthe CATMET model are not very different from those that wouldbe expected from a general prior over colors. The latter would biasparticipants away from any unlikely hues. In the case of CATMET, theimpact of category encoding is ultimately to bias participants awayfrom unlikely hues within a known category.
Operationalizing the impact of categories through a Bayesianprior has the advantage of connecting delayed and undelayed hueestimation to the much larger program of research involved inresolving memory as well as perceptual uncertainty. Bayesianpriors are expected to apply to the perceptual appearance ofstimuli, even in view. In perceptual contexts, Bayesian modelshave successfully explained stimulus-specific patterns of bias inmany domains, including size (Ashourian & Loewenstein, 2011),time (Jazayeri & Shadlen, 2010), motion speed (Stocker & Simo-ncelli, 2006), and orientation (Girshick et al., 2011). Given noisysignals that depend on interactions with viewing conditions, priorsfacilitate perception by directing observers away from generallyunlikely conclusions, and toward generally likely ones. Such pri-ors—whether implemented as priors or as category encoding—should have stronger effects when signals are noisier. Under thepresumption that signals associated with absent objects are noisierthan signals associated with viewable ones, it makes sense that animposed memory delay appears to have the impact of increasingcategory-related biases compared with undelayed conditions. Fromthis perspective, perception and working memory are perhaps lessdistinct than typically portrayed. Both face the challenge of esti-mating properties of the physical world from noisy sensory signals.
Conclusion
Interest in working memory has largely focused on the nature ofunderlying limits that restrict the amount and quality of contentthat the system can store. Relatively neglected, however, has beenthe nature of the content itself—the variables whose values thesystem stores in order to describe a stimulus. We have shown thatin the case of color working memory, assumed contents inaccu-rately omit categorical variables, and as a result, produce unwar-ranted assumptions about content uniformity in the system’s out-puts. This demonstrates how limits on content cannot be studiedeffectively without also characterizing content empirically. More-over, a research program that considers the contents of workingmemory systems inherently situates the system within a broadersuite of behavior-guiding mechanisms. The contents of workingmemory are usually acquired from perceptual inputs, and thenature of working memory outputs depends not only how much itstores but also on what it stores.
References
Allred, S. R., & Flombaum, J. I. (2014). Relating color working memoryand color perception. Trends in Cognitive Sciences, 18, 562–565. http://dx.doi.org/10.1016/j.tics.2014.06.002
Allred, S. R., & Olkkonen, M. (2015). The effect of memory and contextchanges on color matches to real objects. Attention, Perception, &Psychophysics. Advance online publication. http://dx.doi.org/10.3758/s13414-014-0810-4
Anderson, D. E., & Awh, E. (2012). The plateau in mnemonic resolutionacross large set sizes indicates discrete resource limits in visual workingmemory. Attention, Perception, & Psychophysics, 74, 891–910. http://dx.doi.org/10.3758/s13414-012-0292-1
Ashby, F. G., & Maddox, W. T. (1993). Relations between prototype,exemplar, and decision bound models of categorization. Journal ofMathematical Psychology, 37, 372–400. http://dx.doi.org/10.1006/jmps.1993.1023
Ashourian, P., & Loewenstein, Y. (2011). Bayesian inference underlies thecontraction bias in delayed comparison tasks. PLoS ONE, 6(5), e19551.http://dx.doi.org/10.1371/journal.pone.0019551
Baddeley, A. D., & Hitch, G. J. (1974). Working memory. In G. H. Bower(Ed.), The psychology of learning and motivation: Advances in researchand theory (Vol. 8, pp. 47–89). New York, NY: Academic Press.
Bae, G. Y., Olkkonen, M., Allred, S. R., Wilson, C., & Flombaum, J. I.(2014). Stimulus-specific variability in color working memory withdelayed estimation. Journal of Vision, 14(4), 7. http://dx.doi.org/10.1167/14.4.7
Bartleson, C. J. (1960). Memory colors of familiar objects. Journal of theOptical Society of America, 50, 73–77. http://dx.doi.org/10.1364/JOSA.50.000073
Bays, P. M., Catalao, R. F., & Husain, M. (2009). The precision of visualworking memory is set by allocation of a shared resource. Journal ofVision, 9(10), 7. http://dx.doi.org/10.1167/9.10.7
Bays, P. M., Wu, E. Y., & Husain, M. (2011). Storage and binding ofobject features in visual working memory. Neuropsychologia, 49, 1622–1631. http://dx.doi.org/10.1016/j.neuropsychologia.2010.12.023
Berlin, B., & Kay, P. (1969). Basic color terms: Their universality andevolution. Berkeley, CA: University of California Press.
Bird, C. M., Berens, S. C., Horner, A. J., & Franklin, A. (2014). Categor-ical encoding of color in the brain. PNAS Proceedings of the NationalAcademy of Sciences of the United States of America, 111, 4590–4595.http://dx.doi.org/10.1073/pnas.1315275111
Bornstein, M. H., & Korda, N. O. (1984). Discrimination and matchingwithin and between hues measured by reaction times: Some implicationsfor categorical perception and levels of information processing. Psycho-logical Research, 46, 207–222. http://dx.doi.org/10.1007/BF00308884
Boynton, R. M., Fargo, L., Olson, C. X., & Smallman, H. S. (1989).Category effects in color memory. Color Research and Application, 14,229–234. http://dx.doi.org/10.1002/col.5080140505
Boynton, R. M., & Olson, C. X. (1990). Salience of chromatic basic colorterms confirmed by three measures. Vision Research, 30, 1311–1317.http://dx.doi.org/10.1016/0042-6989(90)90005-6
Brady, T. F., Konkle, T., Gill, J., Oliva, A., & Alvarez, G. A. (2013).Visual long-term memory has the same limit on fidelity as visualworking memory. Psychological Science, 24, 981–990. http://dx.doi.org/10.1177/0956797612465439
Brainard, D. H. (1997). The psychophysics toolbox. Spatial Vision, 10,433–436. http://dx.doi.org/10.1163/156856897X00357
Brainard, D. H. (2003). Color appearance and color difference specifica-tion. In S. K. Shevell (Ed.), The science of color (2nd ed., Vol. 116, pp.191–216). Washington, DC: Optical Society of America. http://dx.doi.org/10.1016/B978-044451251-2/50006-4
Brainard, D. H., Pelli, D. G., & Robson, T. (2002). Display characteriza-tion. In J. P. Hornak (Ed.), Encyclopedia of imaging science and tech-nology (pp. 172–188). Hoboken, NJ: Wiley.
Brouwer, G. J., & Heeger, D. J. (2013). Categorical clustering of the neuralrepresentation of color. The Journal of Neuroscience, 33, 15454–15465.http://dx.doi.org/10.1523/JNEUROSCI.2472-13.2013
Thi
sdo
cum
ent
isco
pyri
ghte
dby
the
Am
eric
anPs
ycho
logi
cal
Ass
ocia
tion
oron
eof
itsal
lied
publ
ishe
rs.
Thi
sar
ticle
isin
tend
edso
lely
for
the
pers
onal
use
ofth
ein
divi
dual
user
and
isno
tto
bedi
ssem
inat
edbr
oadl
y.
18 BAE, OLKKONEN, ALLRED, AND FLOMBAUM

Conway, B. R., & Tsao, D. Y. (2006). Color architecture in alert macaquecortex revealed by FMRI. Cerebral Cortex (New York, N. Y.: 1991), 16,1604–1613.
Crawford, L. E., Huttenlocher, J., & Hedges, L. V. (2006). Within-categoryfeature correlations and Bayesian adjustment strategies. PsychonomicBulletin & Review, 13, 245–250. http://dx.doi.org/10.3758/BF03193838
Daoutis, C. A., Pilling, M., & Davies, I. R. (2006). Categorical effects invisual search for colour. Visual Cognition, 14, 217–240.
Duffy, S., Huttenlocher, J., Hedges, L. V., & Crawford, L. E. (2010).Category effects on stimulus estimation: Shifting and skewed frequencydistributions. Psychonomic Bulletin & Review, 17, 224–230. http://dx.doi.org/10.3758/PBR.17.2.224
Emrich, S. M., & Ferber, S. (2012). Competition increases binding errorsin visual working memory. Journal of Vision, 12(4), 12.
Foster, D. H., & Ward, P. A. (1991). Asymmetries in oriented-line detec-tion indicate two orthogonal filters in early vision. Proceedings. Bio-logical Sciences/The Royal Society, 243, 75– 81. http://dx.doi.org/10.1098/rspb.1991.0013
Fougnie, D., & Alvarez, G. A. (2011). Object features fail independently invisual working memory: Evidence for a probabilistic feature-store mod-el. Journal of Vision, 11(12), 3.
Fougnie, D., Asplund, C. L., & Marois, R. (2010). What are the units ofstorage in visual working memory? Journal of Vision, 10(12), 27.
Fougnie, D., Suchow, J. W., & Alvarez, G. A. (2012). Variability in thequality of visual working memory. Nature Communications, 3, 1229.http://dx.doi.org/10.1038/ncomms2237
Girshick, A. R., Landy, M. S., & Simoncelli, E. P. (2011). Cardinal rules:Visual orientation perception reflects knowledge of environmental sta-tistics. Nature Neuroscience, 14, 926–932. http://dx.doi.org/10.1038/nn.2831
Gold, J. M., Hahn, B., Zhang, W. W., Robinson, B. M., Kappenman, E. S.,Beck, V. M., & Luck, S. J. (2010). Reduced capacity but sparedprecision and maintenance of working memory representations inschizophrenia. Archives of General Psychiatry, 67, 570–577. http://dx.doi.org/10.1001/archgenpsychiatry.2010.65
Gregory, E., Landau, B., & McCloskey, M. (2011). Representation ofobject orientation in children: Evidence from mirror-image confusions.Visual Cognition, 19, 1035–1062. http://dx.doi.org/10.1080/13506285.2011.610764
Gregory, E., & McCloskey, M. (2010). Mirror-image confusions: Impli-cations for representation and processing of object orientation. Cogni-tion, 116, 110–129. http://dx.doi.org/10.1016/j.cognition.2010.04.005
Hedrich, M., Bloj, M., & Ruppertsberg, A. I. (2009). Color constancyimproves for real 3D objects. Journal of Vision, 9(4), 16. http://dx.doi.org/10.1167/9.4.16
Heider, E. R. (1972). Universals in color naming and memory. Journal ofExperimental Psychology, 93, 10 –20. http://dx.doi.org/10.1037/h0032606
Hollingworth, A., Matsukura, M., & Luck, S. J. (2013). Visual workingmemory modulates rapid eye movements to simple onset targets. Psy-chological Science, 24, 790 –796. http://dx.doi.org/10.1177/0956797612459767
Horwitz, G. D., & Hass, C. A. (2012). Nonlinear analysis of macaque V1color tuning reveals cardinal directions for cortical color processing.Nature Neuroscience, 15, 913–919. http://dx.doi.org/10.1038/nn.3105
Huttenlocher, J., Hedges, L. V., & Vevea, J. L. (2000). Why do categoriesaffect stimulus judgment? Journal of Experimental Psychology: Gen-eral, 129, 220–241. http://dx.doi.org/10.1037/0096-3445.129.2.220
Jazayeri, M., & Shadlen, M. N. (2010). Temporal context calibrates inter-val timing. Nature Neuroscience, 13, 1020–1026. http://dx.doi.org/10.1038/nn.2590
Jin, E. W., & Shevell, S. K. (1996). Color memory and color constancy.Journal of the Optical Society of America. A, Optics, Image Science, andVision, 13, 1981–1991. http://dx.doi.org/10.1364/JOSAA.13.001981
Johnson, E. N., Hawken, M. J., & Shapley, R. (2001). The spatial trans-formation of color in the primary visual cortex of the macaque monkey.Nature Neuroscience, 4, 409–416. http://dx.doi.org/10.1038/86061
Johnson, E. N., Hawken, M. J., & Shapley, R. (2004). Cone inputs inmacaque primary visual cortex. Journal of Neurophysiology, 91, 2501–2514. http://dx.doi.org/10.1152/jn.01043.2003
Koida, K., & Komatsu, H. (2007). Effects of task demands on the re-sponses of color-selective neurons in the inferior temporal cortex. Na-ture Neuroscience, 10, 108–116. http://dx.doi.org/10.1038/nn1823
Ling, Y., & Hurlbert, A. (2008). Role of color memory in successive colorconstancy. Journal of the Optical Society of America. A, Optics, ImageScience, and Vision, 25, 1215–1226. http://dx.doi.org/10.1364/JOSAA.25.001215
Linhares, J. M., Pinto, P. D., & Nascimento, S. M. (2008). The number ofdiscernible colors in natural scenes. Journal of the Optical Society ofAmerica. A, Optics, Image Science, and Vision, 25, 2918–2924. http://dx.doi.org/10.1364/JOSAA.25.002918
Luck, S. J., & Vogel, E. K. (2013). Visual working memory capacity: Frompsychophysics and neurobiology to individual differences. Trends inCognitive Sciences, 17, 391–400. http://dx.doi.org/10.1016/j.tics.2013.06.006
Ma, W. J., Husain, M., & Bays, P. M. (2014). Changing concepts ofworking memory. Nature Neuroscience, 17, 347–356. http://dx.doi.org/10.1038/nn.3655
McCloskey, M. (2009). Visual reflections: A perceptual deficit and itsimplications. New York, NY: Oxford Scholarship Online. http://dx.doi.org/10.1093/acprof:oso/9780195168693.001.0001
McCloskey, M., Valtonen, J., & Sherman, J. C. (2006). Representingorientation: A coordinate-system hypothesis and evidence from devel-opmental deficits. Cognitive Neuropsychology, 23, 680–713. http://dx.doi.org/10.1080/02643290500538356
Nemes, V. A., Parry, N. R. A., & McKeefry, D. J. (2010). A behaviouralinvestigation of human visual short term memory for colour. Ophthalmic& Physiological Optics, 30, 594–601. http://dx.doi.org/10.1111/j.1475-1313.2010.00772.x
Olkkonen, M., & Allred, S. R. (2014). Short-term memory affects colorperception in context. PLoS ONE, 9 (1), e86488. http://dx.doi.org/10.1371/journal.pone.0086488
Olkkonen, M., McCarthy, P. F., & Allred, S. R. (2014). The centraltendency bias in color perception: Effects of internal and external noise.Journal of Vision, 5 (14), 11. http://dx.doi.org/10.1167/14.11.5
Olkkonen, M., Witzel, C., Hansen, T., & Gegenfurtner, K. R. (2010).Categorical color constancy for real surfaces. Journal of Vision, 10,1–22.
Pilling, M., Wiggett, A., Özgen, E., & Davies, I. R. (2003). Is color“categorical perception” really perceptual? Memory & Cognition, 31,538–551. http://dx.doi.org/10.3758/BF03196095
Pointer, M. R., & Attridge, G. G. (1997). The number of discerniblecolours. Color Research and Application, 23, 17–19.
Roberson, D., & Davidoff, J. (2000). The categorical perception of colorsand facial expressions: The effect of verbal interference. Memory &Cognition, 28, 977–986. http://dx.doi.org/10.3758/BF03209345
Schneegans, S., Spencer, J. P., Schöner, G., Hwang, S., & Hollingworth, A.(2014). Dynamic interactions between visual working memory andsaccade target selection. Journal of Vision, 14(11), 9. http://dx.doi.org/10.1167/14.11.9
Siple, P., & Springer, R. M. (1983). Memory and preference for the colorsof objects. Perception & Psychophysics, 34, 363–370. http://dx.doi.org/10.3758/BF03203049
Souza, A. S., Rerko, L., Lin, H.-Y., & Oberauer, K. (2014). Focusedattention improves working memory: Implications for flexible-resourceand discrete-capacity models. Attention, Perception, & Psychophysics,76, 2080–2102. http://dx.doi.org/10.3758/s13414-014-0687-2
Thi
sdo
cum
ent
isco
pyri
ghte
dby
the
Am
eric
anPs
ycho
logi
cal
Ass
ocia
tion
oron
eof
itsal
lied
publ
ishe
rs.
Thi
sar
ticle
isin
tend
edso
lely
for
the
pers
onal
use
ofth
ein
divi
dual
user
and
isno
tto
bedi
ssem
inat
edbr
oadl
y.
19CATEGORIES AND PARTICULARS IN COLOR WORKING MEMORY

Stocker, A. A., & Simoncelli, E. P. (2006). Noise characteristics and priorexpectations in human visual speed perception. Nature Neuroscience, 9,578–585. http://dx.doi.org/10.1038/nn1669
Stoughton, C. M., & Conway, B. R. (2008). Neural basis for unique hues.Current Biology, 18, R698–R699. http://dx.doi.org/10.1016/j.cub.2008.06.018
Sturges, J., & Whitfield, T. W. A. (1997). Salient features of Munsellcolour space as a function of monolexemic naming and response laten-cies. Vision Research, 37, 307–313. http://dx.doi.org/10.1016/S0042-6989(96)00170-8
Suchow, J. W., Fougnie, D., Brady, T. F., & Alvarez, G. A. (2014). Termsof the debate on the format and structure of visual memory. Attention,Perception, & Psychophysics, 76, 2071–2079. http://dx.doi.org/10.3758/s13414-014-0690-7
Treisman, A. M., & Gelade, G. (1980). A feature-integration theory ofattention. Cognitive Psychology, 12, 97–136. http://dx.doi.org/10.1016/0010-0285(80)90005-5
Treisman, A., & Gormican, S. (1988). Feature analysis in early vision:Evidence from search asymmetries. Psychological Review, 95, 15–48.http://dx.doi.org/10.1037/0033-295X.95.1.15
Uchikawa, K., & Shinoda, H. (1996). Influence of basic color categories oncolor memory discrimination. Color Research and Application, 21,430 – 439. http://dx.doi.org/10.1002/(SICI)1520-6378(199612)21:6430::AID-COL5�3.0.CO;2-X
Valtonen, J., Dilks, D. D., & McCloskey, M. (2008). Cognitive represen-tation of orientation: A case study. Cortex: A Journal Devoted to theStudy of the Nervous System and Behavior, 44, 1171–1187. http://dx.doi.org/10.1016/j.cortex.2007.06.005
van den Berg, R., Shin, H., Chou, W. C., George, R., & Ma, W. J. (2012).Variability in encoding precision accounts for visual short-term memorylimitations. PNAS Proceedings of the National Academy of Sciences ofthe United States of America, 109, 8780 – 8785. http://dx.doi.org/10.1073/pnas.1117465109
Wilken, P., & Ma, W. J. (2004). A detection theory account of changedetection. Journal of Vision, 4(12), 11. http://dx.doi.org/10.1167/4.12.11
Witzel, C., & Gegenfurtner, K. R. (2013). Categorical sensitivity to colordifferences. Journal of Vision, 13(7), 1. http://dx.doi.org/10.1167/13.7.1
Wolfe, J. M., Friedman-Hill, S. R., Stewart, M. I., & O’Connell, K. M.(1992). The role of categorization in visual search for orientation.Journal of Experimental Psychology: Human Perception and Perfor-mance, 18, 34–49. http://dx.doi.org/10.1037/0096-1523.18.1.34
Wyszecki, G., & Stiles, W. (1982). Color science: Concepts and methods,quantitative data and formulae. New York, NY: Wiley.
Zhang, W., & Luck, S. J. (2008). Discrete fixed-resolution representationsin visual working memory. Nature, 453, 233–235. http://dx.doi.org/10.1038/nature06860
Zhang, W., & Luck, S. J. (2009). Sudden death and gradual decay in visualworking memory. Psychological Science, 20, 423–428. http://dx.doi.org/10.1111/j.1467-9280.2009.02322.x
Zhang, W., & Luck, S. J. (2011). The number and quality of representa-tions in working memory. Psychological Science, 22, 1434–1441. http://dx.doi.org/10.1177/0956797611417006
Received November 18, 2014Revision received March 20, 2015
Accepted March 31, 2015 �
Thi
sdo
cum
ent
isco
pyri
ghte
dby
the
Am
eric
anPs
ycho
logi
cal
Ass
ocia
tion
oron
eof
itsal
lied
publ
ishe
rs.
Thi
sar
ticle
isin
tend
edso
lely
for
the
pers
onal
use
ofth
ein
divi
dual
user
and
isno
tto
bedi
ssem
inat
edbr
oadl
y.
20 BAE, OLKKONEN, ALLRED, AND FLOMBAUM