Journal of Experimental Psychology: Human Learning and Memory
28
Journal of Experimental Psychology: Human Learning and Memory VOL. 4, No. 6 NOVEMBER 1978 Judged Frequency of Lethal Events Sarah Lichtenstein, Paul Slovic, Baruch Fischhoff, Mark Layman, and Barbara Combs Decision Research, A Branch of Perceptronics Eugene, Oregon A series of experiments studied how people judge the frequency of death from various causes. The judgments exhibited a highly consistent but sys- tematically biased subjective scale of frequency. Two kinds of bias were identi- fied: (a) a tendency to overestimate small frequencies and underestimate larger ones, and (b) a tendency to exaggerate the frequency of some specific causes and to underestimate the frequency of others, at any given level of ob- jective frequency. These biases were traced to a number of possible sources, including disproportionate exposure, memorability, or imaginability of vari- ous events. Subjects were unable to correct for these sources of bias when specifically instructed to avoid them. Comparisons with previous laboratory studies are discussed, along with methods for improving frequency judg- ments and the implications of the present findings for the management of societal hazards. How well can people estimate the fre- how small a difference in frequency can be quencies of the lethal events they may en- reliably detected? Do people have a con- counter in life (e.g., accidents, diseases, sistent internal scale of frequency for such homicides, suicides, etc.) ? More specifically, events? What factors, besides actual fre- quency, influence people's judgments? The answers to these questions may have to society. Citizens must Defense and was monitored by the Office of Naval assess rlsks accurately in order to mobilize Research under Contracts N00014-76-C-0074 and society's resources effectively for reducing N00074-78-C-0100 (ARPA Order Nos. 3052 and hazards and treating their victims. Official ,5469) under subcontract to Oregon Research In- reco nition of the irn p 0r t a nce of valid risk stitute and Subcontracts 76-030-0714 and 78-072- b . , , . , < < . , • ^ » 0722 to Perceptronics, Inc. from Decisions and assessments is found m the vital statistics Designs, Inc. that are carefully tabulated and periodically We would like to thank Nancy Collins and reported to the public (see Figure 1 ). There Peggy Roecker for extraordinary diligence and ; Sj i lowev er, no guarantee that these statis- patience in typing and data analysis. We are also . a , ? . , , ,. , • , ... grateful to Ken Hammond, Jim Shanteau, Amos tics are reflected in the public s intuitive Tversky, and an anonymous reviewer for percep- judgments. tive comments on various drafts of this article. Few studies have addressed these ques- Requests for reprints should be sent to Sarah . ,, . .... ,. . , , ? Lichtenstein, Decision Research, 1201 Oak Street, tlons - Most investigations of judged f re- Eugene, Oregon 97401. quency have been laboratory experiments Copyright 1978 by the American Psychological Association, Inc. 0096-1515/78/0406-0551S00.75 551
Transcript of Journal of Experimental Psychology: Human Learning and Memory

Journal of Experimental Psychology:Human Learning and Memory
VOL. 4, No. 6 NOVEMBER 1978
Judged Frequency of Lethal Events
Sarah Lichtenstein, Paul Slovic, Baruch Fischhoff,Mark Layman, and Barbara Combs
Decision Research, A Branch of PerceptronicsEugene, Oregon
A series of experiments studied how people judge the frequency of deathfrom various causes. The judgments exhibited a highly consistent but sys-tematically biased subjective scale of frequency. Two kinds of bias were identi-fied: (a) a tendency to overestimate small frequencies and underestimatelarger ones, and (b) a tendency to exaggerate the frequency of some specificcauses and to underestimate the frequency of others, at any given level of ob-jective frequency. These biases were traced to a number of possible sources,including disproportionate exposure, memorability, or imaginability of vari-ous events. Subjects were unable to correct for these sources of bias whenspecifically instructed to avoid them. Comparisons with previous laboratorystudies are discussed, along with methods for improving frequency judg-ments and the implications of the present findings for the management ofsocietal hazards.
How well can people estimate the fre- how small a difference in frequency can bequencies of the lethal events they may en- reliably detected? Do people have a con-counter in life (e.g., accidents, diseases, sistent internal scale of frequency for suchhomicides, suicides, etc.) ? More specifically, events? What factors, besides actual fre-
quency, influence people's judgments?The answers to these questions may have
to society. Citizens mustDefense and was monitored by the Office of Naval assess rlsks accurately in order to mobilizeResearch under Contracts N00014-76-C-0074 and society's resources effectively for reducingN00074-78-C-0100 (ARPA Order Nos. 3052 and hazards and treating their victims. Official,5469) under subcontract to Oregon Research In- reco nition of the irnp0rtance of valid riskstitute and Subcontracts 76-030-0714 and 78-072- b . , , . , < < . , • ^ »0722 to Perceptronics, Inc. from Decisions and assessments is found m the vital statisticsDesigns, Inc. that are carefully tabulated and periodically
We would like to thank Nancy Collins and reported to the public (see Figure 1 ). TherePeggy Roecker for extraordinary diligence and ;Sj ilowever, no guarantee that these statis-patience in typing and data analysis. We are also . a , ? . , , ,. , • , ...grateful to Ken Hammond, Jim Shanteau, Amos tics are reflected in the public s intuitiveTversky, and an anonymous reviewer for percep- judgments.tive comments on various drafts of this article. Few studies have addressed these ques-
Requests for reprints should be sent to Sarah . ,, . . . . . ,. . , , ?Lichtenstein, Decision Research, 1201 Oak Street, tlons- Most investigations of judged f re-Eugene, Oregon 97401. quency have been laboratory experiments
Copyright 1978 by the American Psychological Association, Inc. 0096-1515/78/0406-0551S00.75
551

552 LICHTENSTEIN ET AL.
Earthquakes not more numeroust populated mat," aaM Ocofbyiidtt Iilud region of the South Pacific'averly Persons. "But It you look at Ocer- The quake registered 6.! on theW quaket, they all occurred In hlihly opt ' - *•»!« snd occurred
GOLDEN, Colo. (UPI) - The Na- In populated mat," aaM 0tlwal Earthquake Information Center Waverly Pensays recent earthquakes In populated the quaket, tregions may have faliely led the public settmlc are** wnerc eannqusiet nave K y *10 believe an abnormally high amount occurred all Uiratioh hiMnrva- '-----L Olll/WJ^q,...i,.,,KW™,,l,g EtlcefrWltttW , '"oesun
"Recenily. eanhquakei save gotten •wHVwf'*"™ /lii* » r'Recently, earthquake) have gotten- ..uiuinn hM^use ihey have been
Ir Botulism outbreakslinf<ed to Hard times
s^jS^HiWft. =Mn»-.«.<€H"l Bubonic plagueinem IOT ymfiw > ""• ™ •"•»»»• — ™»" "r^ B, mim-Hitv- j*»*™o"--"
Fire fatalities Traffic deaths^ expected to setdown slightly drop in nation record for year
^n«-r,N fAPl - Flte deaths were BjlsmMnimi FORT COLLINS, Cfllo. (""1,*̂ *
i:S'i: ss«"SHS'i<l year, the ^J9' ^BTndlclitions this will ba a i
1J^™— inr ihe atmtt In tht Un
Figure 1. Eat, drink and be merry.
using sequential or simultaneous displaysof lights, letters, numbers or horizontal andvertical lines. In such tasks, people's esti-mates of frequency and proportion havetypically been quite accurate. According toPeterson and Beach (1967), the most strik-ing aspect of many of these studies was thatthe relation between estimated and actualfrequency was described well by the identityfunction. Howell's (1973) review of theliterature concluded that "subjects show aremarkable facility for synthesizing andstoring the repetitive attribute of event oc-currences. They seem capable of maintain-ing a number of separate frequency streamsconcurrently as evidenced by the creditableaccuracy of frequency retrieval" (p. 51).Similarly, Estes (1976) observed that sub-jects in probability-learning experimentswere "extremely efficient" (p. 51) at ac-quiring relative-frequency information.
Despite these optimistic conclusions, somestudies have found inaccuracies. For exam-ple, Attneave (1953) and Hintzman (1969)found that judged frequency increased withthe log of the true frequency. Still otherstudies have suggested some cognitive pro-cesses that could lead to even more serious
errors in judgments of lethal events. In thisregard, Postman (1964) noted that fre-quency learning is typically incidental learn-ing, which is strongly influenced by selectiveattention. Estes (1976) observed that ac-curate learning of frequencies requires thelearner to "attend to and encode occur-rences of all the alternative events withequal uniformity or efficiency" (p. 53).Underwood (1969) found that items werejudged more frequent under conditions ofdistributed rather than massed practice, andHintzman (1977) discussed a great deal ofevidence showing that apparent frequencyof an item increases with greater spacingbetween its repetitions in a list. Any of thesefactors could bias judgments about the fre-quencies of causes of death. Events thatcapture our attention and "stick in ourmind," like homicide, may appear morefrequent than they are. Rare events maybe overestimated because their appearancesare well spread and distinct. Catastrophic(multifatality) events may be overesti-mated because of their salience or under-estimated because of massed presentation.
Tversky and Kahneman (1973) haveargued that people judge the probability orfrequency of an event by the ease withwhich relevant instances can be retrievedfrom memory or imagined. Reliance onmemorability and imaginability as a cue forfrequency is called the "availability" heuris-tic. In the context of lethal events, the con-cept of availability suggests that one's judg-ments will be influenced not only by directexperience with death and indirect exposurevia movies, books, television, newspapers,and the like, but also by memorable char-acteristics of the different causes of death,such as sensationalism or vividness. Thuswe might expect that the frequencies of dra-matic events such as cancer, homicide, ormultiple-death catastrophes, which tend tobe publicized disproportionately, would beoverestimated, while the frequencies of"quiet killers" would be underestimated.
In summary, experimental research showsthat although people are very good at track-ing event frequencies, the potential exists

JUDGED FREQUENCY OF LETHAL EVENTS 553
for serious misjudgment. Even without theambiguity of this conclusion, the implica-tions of these laboratory studies for judg-ments regarding causes of death would beunclear. Lethal events are emotion-ladenstimuli experienced idiosyncratically overthe course of a lifetime. Any one person hasdirect experience with only a few of theseevents; knowledge about the other eventsis gained indirectly, from a wide variety ofsources. Some of these events occur thou-sands of times more frequently than others.No laboratory experiments have even ap-proximated these conditions.
Perhaps more relevant are field surveysby several geographers (Burton, Kates, &White, 1978; Kates, 1978; White, 1974;Kates, Note 1). These studies have indi-cated that (a) people misjudge the haz-ards posed by floods, earthquakes, hurri-canes, and drought; (b) more frequenthazards are estimated more accurately; and(c) accuracy is increased by both the re-cency of the hazard's last major occurrenceand its impact on one's livelihood.
Judgments concerning the probabilitiesand frequencies of real-life events have alsobeen studied by Selvidge (1972). In onephase of her research, five subjects firstranked several sets of accidents and crimesaccording to frequency and then estimatedthe absolute frequencies. Although her sub-jects were fairly good at ordering theevents, they did a poor job of assigning ab-solute frequencies. She also found a greatamount of variability across subjects, eventcategories, and response modes. This varia-bility and her small sample size led Selvidgeto advocate that these issues be investigatedon a much larger scale. The present studydoes this.
Five experiments are reported here. Thefirst two examine the accuracy of compara-tive judgments, using a paired-comparisonformat. The third evaluates judgments ofabsolute frequency. The fourth examinesthe role that several aspects of availabilitymay play in determining such judgments.The fifth explores the degree to which sub-jects can overcome their errors when in-formed of the nature of their biases.
Table 1Master List of Causes of Death
Cause Rate/108
Smallpox 0Poisoning by vitamins .5Botulism 1Measles 2.4Fireworks 3Smallpox vaccination 4Whooping cough 7.2Polio 8.3Venomous bite or sting 23.5Tornado 44Lightning 52Nonvenomous animal 63Flood 100Excess cold 163Syphilis 200Pregnancy, childbirth,
and abortion 220Infectious hepatitis 330Appendicitis 440Electrocution 500Motor vehicle—train collision 740Asthma 920Firearm accident 1,100Poisoning by solid or liquid 1,250Tuberculosis 1,800Fire and flames 3,600Drowning 3,600Leukemia 7,100Accidental falls 8,500Homicide 9,200Emphysema 10,600Suicide 12,000Breast cancer 15,200Diabetes 19,000Motor vehicles (car, truck,
or bus) accidents 27,000Lung cancer 37,000Cancer of the digestive system 46,600All accidents 55,000Stroke 102,000AH cancer 160,000Heart disease 360,000All disease 849,000
Experiment 1: Paired-ComparisonJudgments of Lethal Events
The first experiment investigated the ac-curacy of relative-frequency judgments forvarious causes of death.
Method
Stimuli. Table 1 shows the stimulus events,41 causes of death, and gives, for each item, thefrequency of death per 10s United States residents

554 LICHTENSTEIN ET AL.
per year, based on reports prepared by the Na-tional Center for Health Statistics for the years1968-1973.1 These events were chosen to repre-sent the range of frequencies of causes of death forwhich yearly statistics are available. Obscure orunfamiliar causes were excluded, as were causesshowing large fluctuations from year to year. Forthe few chosen events that showed a systematictrend across years (e.g., homicide, which in-creased from 7,300 per 10e in 1968 to 9,400 per10s in 1973), the average over the last 2 yearswas used.
From these 41 causes of death, 106 pairs wereconstructed such that (a) each cause appeared inapproximately six pairs and (b) the ratios ofrelative frequencies (comparing the more to theless frequent cause of death) varied systematicallyfrom 1.25:1 (example: fireworks vs. measles) toabout 100,000:1 (example: stroke vs. botulism).Five pairs included smallpox as the less frequentcause of death. Since no one in the United Stateshas died of smallpox since 1949, the rate shownin Table 1 is zero, and no ratio comparing anyother disease with smallpox can be denned. Inthe results that follow, all analyses employing ra-tios of true frequencies (called true ratios) ex-clude the five pairs involving smallpox.
Subjects. Two groups of subjects participated.The first, hereafter referred to as the collegestudents, consisted of 51 males and 60 females whoanswered an ad in the University of Oregon cam-pus newspaper. The second consisted of 77 femalemembers of the Eugene, Oregon chapter of theLeague of Women Voters, a group representativeof the best-informed citizens in the community.All subjects were paid for participating. The datawere collected from the students in the autumnof 1974 and from the league members in the springof 1975.
The order of the 106 pairs and of the twocauses within each pair was determined ran-domly. All subjects saw the same random order.
Instructions. The subjects' instructions read asfollows:
Each item in part one consists of two differentpossible causes of death. The question you areto answer is: Which cause of death is morelikely? We do not mean more likely for you,we mean more likely in general, in the UnitedStates.
Consider all the people now living in the UnitedStates—children, adults, everyone. Now suppos-ing we randomly picked just one of those peo-ple. Will that person more likely die next yearfrom cause A or cause B ? For example: Dyingin a bicycle accident versus dying from an over-dose of heroin. Death from each cause is re-motely possible. Our question is, which of thesetwo is the more likely cause of death?
For each pair of possible causes of death, Aand B, we want you to mark on your answersheet which cause you think is MORE LIKELY.
Next, we want you to decide how many timesmore likely this cause of death is, as com-pared with the other cause of death given inthe same item. The pairs we use vary widelyin their relative likelihood. For one pair, youmay think that the two causes are equally likely.If so, you should write the number 1 in thespace provided for that pair. Or, you may thinkthat one cause of death is 10 times, or 100times, or even a million times as likely as theother cause of death. You have to decide: Howmany times as likely is the more likely causeof death? Write the number in the space pro-vided. If you think it's twice as likely, write 2.If it's 10 thousand times as likely, write 10,000,and so forth.
In the instructions and at the top of the answersheet we drew a logarithmic scale labeled withboth numbers and words for all powers of 10 from1 to 1,000,000. The scale ended in an arrow to in-dicate that the scale continued. The instructionscontinued:
The scale is there to give you an idea of thekinds of numbers you might want to use. Youdon't have to use exactly those numbers. Youcould write 75 if you think that the more likelycause of death is 75 times more likely thanthe other cause, or 500, if you think that themore likely cause of death is 500 times morelikely than the other.
For some pairs, you may believe that one causeof death is just a little bit more likely thanthe other cause of death. For this situation, youwill have to use a decimal point in your answer:
1.1 means that the more likely cause is 10%more likely than the other cause.
1.2 means 20% more likely.1.5 means 50% more likely, or half again as
likely.1.8 means 80% more likely.
2 means twice as likely, which is the same as100% more likely.
2.5 means two and a half times as likely.
In addition, the following glossary was providedto insure that the subjects understood what wasincluded in some possibly ambiguous categories:
All accidents: includes any kind of accidentalevent; excludes diseases and natural disasters(floods, tornadoes, etc.).All cancer: includes leukemia.Cancer of the digestive system: includes cancerof stomach, alimentary tract, esophagus, and in-testines.
1 For convenience, these frequencies are referredto in this article as the true frequencies, althoughwe recognize that they are statistical estimates.

JUDGED FREQUENCY OF LETHAL EVENTS 555
Excess cold: freezing to death or death by ex-posure.Nonvenomous animal: dogs, bears, etc.Venomous bite or sting: caused by snakes, bees,wasps, etc.
Results
Accuracy. Two measures were computedfor each pair of causes of death: the per-centage of subjects who correctly selectedthe more likely item and the geometricmean of the subjects' ratio judgments. Forany subject who did not correctly selectthe more likely cause of death, the inverseof the judged ratio was used in calculatingthe geometric mean. For example, death byfireworks is more frequent than death frommeasles. If a subject said measles was 5times more likely to cause death than fire-works, the inverse, .2, was used. The twosummary measures, percentage correct andthe geometric mean of the ratio judgments,are shown for all 106 pairs for both groupsof subjects in Table 2.
Examination of Table 2 illustrates themany, often severe, misconceptions held byboth the college students and the leaguemembers. For example, even though strokecauses 85% more deaths than all accidentscombined (pair 37, true ratio = 1.85), only20% of the students and 23% of the leaguemembers judged stroke to be more likely.The geometric mean of the ratio judgmentswas only .04 for the students, indicating thaton the average, they believed that accidentswere 25 times (1 •*• .04) more frequent.Tornadoes were seen by the student sub-jects as more frequent killers than asthma,even though the latter is 20 times more likely(pair 61). Death by lightning was judgedless likely than death by botulism eventhough it is 52 times more frequent (pair71). Death by asthma was judged onlyslightly more frequent than death by botu-lism (pair 91), even though it is over 900times more frequent! Accidental deathswere reported by the students to be aboutas likely as death from disease despite a trueratio of 15.4 for diseases over accidents(pair 69).
Some errors were in the opposite direc-tion: A large percentage of subjects knew
o
to0+-C<Du
s.
too
so
80
70
60
50
40
30
20
10
0
' ' ' ' i '. '+ 1 «A '
•• • b *' t • / • 1. • . . ' « • f
tt •
• . .
* •• •
i".*
* t*;r *t* •••A
• ••
-i ] , , i i ,
1 2 5 10 20 90 100 1000 IOPOO 100000
True Ratio
Figure 2. Percentage of student subjects who cor-rectly identified the more likely cause of death asa function of true ratio for 101 paired causes ofdeath.
which cause of death was more likely, butthe ratios given were far too large. For ex-ample, death by a motor vehicle accident isonly 1.4 times more likely than death fromdiabetes (pair 25), not 356 r;times morelikely (the students' geometric mean) or100 times more likely (league members).
Subjects' ability to detect the more likelyevent was not quite as bad as these exam-ples suggest. They were generally able toidentify the more frequent cause of deathwhen the true ratio was 2:1 or greater.Below 2:1, however, discrimination wasoften poor, as shown in Figures 2 and 3,which compare the percentage of correctdiscriminations with the log true ratio forthe two groups of subjects (101 pairs, ex-cluding smallpox).
Accuracy as measured by percentage cor-rect was slightly higher for events withgreater true frequency. The partial corre-lation between percentage correct and logfrequency of the less likely event, holdingtrue ratio constant, was .24 (z = 2.48, one-tailed p < .01) for the college students and.19 («= 1.62, one-tailed p < .06) for theleague members. Since greater true fre-quency typically implies greater exposure,these are surprisingly low correlations. They

556 LICHTENSTEIN ET AL.
Table 2Results of Paired-Comparison Judgments for Causes of Death
Pairno.
123456789
10111213141516171819202122232425262728293031323334353637383940414243444546474849505152535455565758596061626364656667686970717273
Less likely
SmallpoxSmallpoxSmallpoxSmallpoxSmallpoxMeaslesFireworksLightningExcess coldAsthmaLeukemiaAccidental fallsHomicideBreast cancerLung cancerStomach cancerTornadoFloodHepatitisElectrocutionPoisoningLeukemiaAccidental fallsSuicideDiabetesLung cancerStrokePoisoning by vitaminsLightningFloodPregnancy, etc.AppendicitisTuberculosisTuberculosisLeukemia* ''Breast cssfferAll accidentsAll cancerPoisoning by vitaminsPolioNonvenomous animalSyphilisPregnancy, etc.Motor-train collisionMotor-train collisionTuberculosisEmphysemaDiabetesMeaslesSmallpox vaccinationVenomous bite/stingLightningHepatitisHepatitisPoisoningTuberculosisEmphysemaLung cancerMeaslesPolioTornadoNonvenomous animalHepatitisAppendicitisMotor-train collisionPoisoningTuberculosisDiabetesAll accidentsPoisoning by vitaminsBotulismWhooping coughVenomous bite/sting
More likely
BotulismMeaslesSmallpox vaccinationPolioHeart diseaseFireworksSmallpox vaccinationNonvenomous animalSyphilisFirearm accidentAccidental fallsEmphysemaSuicideDiabetesStomach cancerAll accidentsNonvenomous animalExcess coldElectrocutionMotor-train collisionTuberculosisEmphysemaSuicideDiabetesMotor vehicle accidentAll accidentsAll cancerBotulismFloodSyphilisAppendicitisAsthmaFire and flamesDrowningBreast cancerLung cancerStrokeHeart diseaseMeaslesTornadoHepatitisFirearm accidentFirearm accidentFire and flamesDrowningHomicideAll accidentsStrokeVenomous bite/stingTornadoPregnancy, etc.ElectrocutionFire and flamesDrowningSuicideDiabetesStrokeHeart diseaseTornadoExcess coldAsthmaPoisoningLeukemiaHomicideBreast cancerMotor vehicle accidentLung cancerHeart diaseseAll diseasesVenomous bite /stingLightningHepatitisFirearm accident
Rate ofless
likely
000002.43
52163920
7,1008,5009,200
15,20037,00046,600
44100330500
1,2507,1008,500
12,00019,00037,000
102,000.5
52100220440
1,8001,8007,100
15,20055,000
160,000.5
8.363
200220740740
1,80010,60019,000
2.44
23.552
330330
1,2501,800
10,60037,000
2.48.3
4463
330440740
1,2501,800
19,00055,000
.517.2
23.5
Trueratio
————
1.251.331.211.231.201.201.251.301.251.251.191.431.631.521.481.441.491.411.581.421.491.572.001.922.002.002.092.002.002.142.431.852.254.805.305.245.505.004.864.865.115.195.379.79
11.009.369.62
10.9010.909.60
10.569.629.73
18.319.620.919.821.520.920.521.620.618.915.447.052.045.846.8
% correct
Students
77602664972836557280464132232590203745452647582599818368855717508167588220556671846662676791889165847788676870538181686342957591709585975775378885
LWV
88865674973529588178643930274487213238521247513196907582877310719283607123687486907768907791958468918292787173907495707968957997839499977979459187
Geometric mean
Students
5.541.52.08
2.781,130.0
.27.47.71
5.9311.0
.78.65.19.13.31
28.1.10.51.61
1.16.19.58
1.58.09
356.011.121.0
4.0818.6
1.74.10
1.0010.52.981.486.42.04.89
2.504.269.764.382.142.451.97
25.226929.3
1.6816.87.27
23.14.224.555.501.47
10.53.715.631.64.36
17.112.572.74.90
38823.3
1271.624.04
.307.669.94
LWV
18.316.0
1.085.90
13,263.44.29
1.8923.714.12.45
.45
.14
.14
.8129.4
.15
.34.44
2.40.03
1.02.64.20
99.634.78.20
14.014.16.60.07
6.6538.919.32.982.74.13
1.885.45
18.015.116.66.6614.2
7.1772.9
10746.6
3.1122.711.626.611.27.802.59
14.710.224.44.676.053.53
64.914.7
10520.9
304145206
11.616.5
.3212.435.7

JUDGED FREQUENCY OF LETHAL EVENTS 557
Table 2 (continued)
Pairno.
7475767778798081828384858687888990919293949596979899
100101102103104105106
Less likely
Venomous bite/stingSyphilisPregnancy, etc.ElectrocutionAsthmaLeukemiaPoisoning by vitaminsMeaslesWhooping coughFloodExcess coldSyphilisAppendicitisDrowningFire and flamesAccidental fallsPoisoning by vitaminsBotulismBotulismWhooping coughPolioFloodExcess coldBotulismMeaslesFireworksPolioTornadoNonvenomous animalPoisoning by vitaminsBotulismFireworksSmallpox vaccination
More likely
PoisoningHomicideSuicideMotor vehicle accidentStomach cancerHeart diseaseLightningPregnancy, etc.Motor-train collisionHomicideBreast cancerDiabetesStomach cancerHeart diseaseHeart diseaseAll diseaseElectrocutionAsthmaFirearm accidentLeukemiaAccidental fallsStrokeAH cancerEmphysemaMotor vehicle accidentMotor vehicle accidentStrokeHeart diseaseAll diseaseStomach cancerStrokeHeart diseaseHeart disease
Rate ofless
likely
23.5200220500920
7,100.5
2.47.2
100163200440
3,6003,6008,500
.5117.28.3
100163
12.438.3
4463
.5134
Trueratio
53.246.054.554.050.450.7
10492
103929394
105100100100
1,000920
1,100983
1,0241,020
98210,60011,2509,000
12,2898.182
13,47692,800
102,000120,00090,000
% correct
Students
788681978690508485918064899293918559889493899586969595959892969699
LWV
83827999909961799594957195959490867594999590999499979997
100999599
100
Geometric mean
Students
5.2131.714.8
53936.433.8
1.4513.415.281.726.7
2.3630.256.979.7
32430.7
1.5029.945.217.543.4
1,49024
1,0701,430
164348
5,600103106
1,5303,610
LWV
11.344.212.7
90943.4
1842.009.44
70.1294255
4.5283.7
272252614
27.79.29
189166198186
4,337190
2,7655,2682,2652,396
33,521578468
5,77912,244
Note. LWV = subjects who were members of the League of Women Voters.
reflect the fact that our subjects were notmuch better at judging the relative fre-quency of death from high-frequency pairssuch as all cancer versus heart disease (pair38) than they were at judging low-fre-quency pairs such as poisoning by vitaminsversus botulism (pair 28).
The geometric means of the likelihoodjudgments were only moderately related tothe true ratios of frequencies, as shown inFigures 4 and 5 (101 pairs, excluding^smallpox). For example, the college stu-dents produced mean ratios in the range of100:1 to 500:1 for pairs with true ratiosas small as 1.5:1 and as large as 100,000:1! Conversely, pairs having true ratios ofabout 2:1 had geometric mean judgmentsranging from 25:1 in the wrong directionto over 300:1 in the right direction! Thegeometric means were somewhat more ac-curate for the league members but stillwere far from optimal. The correlation be-tween log geometric mean judged ratio andlog true ratio was .69 for the students and
,75 for the league members. The regressionlines (shown as dashed lines in Figures 4and 5) were both too flat.
[•,' * t •.• . •. • . •• • * •
oO
oh_
CL 30
I Z 5 10 20 50 100 1000
True Ratioicpoo loopoo
Figure 3. Percentage of League of Women Voterswho correctly identified the more likely cause ofdeath as a function of true ratio for 101 pairedcauses of death.

558 LICHTENSTEIN ET AL.
10,000
a
100
so
2010
s
2
I
.6
2.1
slope" -37ontilog of intercept • 1.40
20 50 100
.True Ratio
1000 10,000 lOOpOO
Figure 4. Geometric means of student subjects'ratio judgments as a function of true ratio for 101paired causes of death.
Secondary bias. The regression linesshown in Figures 4 and 5 capture what wewill call primary bias: a tendency to under-estimate large ratios. In addition, the datashowed a secondary bias: Different pairswith the same ratio had quite differentjudged ratios. One measure of this second-ary bias is the signed difference betweenthe log geometric mean for a pair and itslog geometric mean as predicted by the re-gression equation. (This measure is equiva-lent to the vertical distance between a pointin Figure 4 or 5 and the dashed regressionline.) A positive value indicates that theratio judgments for that pair were largerelative to the general relationship betweenthe judged ratio and the true ratio. A nega-tive value indicates relative underestimationor estimation in the wrong direction. Asmeasured by these residual values, second-ary bias was highly consistent across thetwo groups of subjects: The between-groups correlation of the residuals was .90(over 101 pairs). Further analysis of sec-ondary bias will be presented later in thearticle.
Consistency. Even though they were
often inaccurate, subjects' mean responsesrevealed a consistent subjective ordering forthe causes of death. There were 18 triads(involving 29 of the 41 causes of death)of the form A vs. B, B vs. C, A vs. C withinthe 106 pairs (for example, all accidentspaired with stroke, stroke paired with em-physema, and emphysema paired with allaccidents). For such triads, we asked Werethe choice percentages transitive? and Werethe geometric means consistent? The an-swer to both these questions was yes forthe triad described above. Eighty percentof the students said all accidents were morelikely than stroke (geometric mean likeli-hood ratio = 26.3), 81% said stroke wasmore likely than emphysema (geom. meanlikelihood ratio = 10.5), and 88% said allaccidents were more likely than emphysema(geom. mean likelihood ratio = 269). Thesedata exhibit strong stochastic transitivity,2
in that the percentage of subjects judgingall accidents more likely than emphysemawas the largest of the three percentages.The consistency of the geometric means isshown by the similarity of the third mean(269) to the product of the first two means(276). Thus, the group showed a clear sub-jective ordering: emphysema < stroke < allaccidents. The true order, however, is em-physema < all accidents < stroke. Theseresults are typical of all 36 triads analyzed(18 triads each for college students andleague members). The choice percentagesexhibited weak stochastic transitivity forevery triad; strong stochastic transitivitywas satisfied for 27 out of 36 triads.
The consistency of the ratio judgmentswas measured by comparing the log of thegeometric mean ratio for pair A:C in each
2 Three levels of stochastic transitivity may bedistinguished (cf. Coombs, Dawes, & Tversky,1970, p. 156). For any three stimuli, x, y, and z,assume that p ( x , y) ^ 1/2 (i.e., that the propor-tion choosing x over y is greater than or equalto .5) and lhat p(y, s) S 1/2. Then strong sto-chastic transitivity requires that p(x, z) i max[p(x, y } , p(y, s ) } , moderate stochastic transi-tivity requires that p(x, z) ;> min [p(x, y),P(y, *) ]> while weak stochastic transitivity re-quires only that p(x, z} > 1/2.

JUDGED FREQUENCY OF LETHAL EVENTS 559
triad with the log of the product of the geo-metric mean ratios for A: B and B: C. Therelationship was linear with r — .99 (slope= 1.10; antilog of intercept = .83) for thecollege students and r = .97 (slope = 1.05;antilog of intercept = 1.09) for the leaguemembers. These results suggest that as agroup, these subjects exhibited an intervalscale of subjective frequency.
Between-groups comparisons. The re-sponses of the students and the league mem-bers were highly similar. Across all 106pairs, the correlation between the twogroups was .93 for both percentage correctand geometric mean judged ratio. The highcorrelation between the two groups' second-ary bias residuals is further evidence of thissimilarity. The league members had a some-what higher percentage correct than the stu-dents (M — 76.8 vs. 71.3); their percentagecorrect was higher for 80 pairs, equal for 5pairs, and lower for 21 pairs (sign test;p < .001). For the ratio judgments, how-ever, the league members did not performsignificantly better than the students; thegeometric mean of their ratio judgmentswas closer to the true ratio for only 62 ofthe 106 pairs (sign test; z = 1.65, p > .10).
Individual performance. The perform-ance of individual subjects was rather vari-able. Percent correct ranged between 56%and 84% for the students and between 60%and 89% for the league members. Analysisof the correlations between log judged ratioand log true ratio over 101 items indicatedthat few individuals showed any appreciableability to perform the ratio-estimation task.These correlations ranged between —.11and .72 (Mdn = .45) for students and be-tween .10 and .80 (Mdn — .51) for leaguemembers.
Further insight into the level of individualsubjects' performance was obtained by cal-culating an error ratio, defined as the ratioof the judgment to the truth, or vice versa,whichever was greater than 1. A subjectwho always gave a judged ratio off by afactor of 10, that is, either 10 times as largeor a tenth as large as the true ratio, wouldhave a mean error ratio of 10. The medianstudent subject erred by a factor of 22.5
IOQOOO
lopoo
0)tng8-<u
OL
iCD
100
so
2010
5
: r
r« .75slope» .70
antilog of intercept» 2.O3
5 10 20 50 100 10,000 loopoo
True RatioFigure 5. Geometric means of League of WomenVoters subjects' ratio judgments as a function oftrue ratio for 101 paired causes of death.
(range = 7-556), while the median leaguemember erred, on the average, by a factor of17.6 (range = 5-2,693).
An analysis of transitive triads was alsodone separately for each subject. The me-dian number of transitive triads (out of 18)was 17 for each group. Only 27% of thesubjects in both groups showed more thanone intransitivity, while 44% (students)and 49% (league members) were alwaystransitive. Thus, the strong internal con-sistency found in the group means was alsofound in the judgments of individuals.
Experiment 2: Paired-ComparisonJudgments of Words and Occupations
In order to test whether the primary re-sults of Experiment 1 were unique to theset of stimuli used, Experiment 1 was re-peated using pairs of words and pairs ofoccupations as stimuli.
Method
Stimuli. The list of words studied is shownin Table 3, along with their frequency of occur-
560 LICHTENSTEIN ET AL.
rence per 10° words of English text. These fre-quencies represent an average from two separatesources. One source, the Lorge magazine count(Thorndike & Lorge, 1944), analyzed frequenciesfrom a sample of about a million words from eachof five major magazines between the years 1927and 1938. The second source (Kucera & Francis,1967) analyzed 500 samples of about 200 wordseach, taken from a wide variety of materials,ranging from newspapers to scientific journals andfrom popular romantic fiction to abstruse philo-sophical discussions. For the words in Table 3, thefrequencies estimated by the two sources agreedclosely. From this list, 100 pairs of words wereselected, with true ratios ranging from 1.10 (ofvs. to) to 6,126 (the vs. cork).
The list of occupations studied is shown inTable 4, along with their frequency of occurrenceamong 10" employed U.S. civilian citizens. Thesefrequencies were derived from a report compiledby the U.S. Bureau of the Census (1972). Fromthe list, 95 pairs were selected, with true ratiosranging from 1.15 (garbage collector vs. uphols-terer) to 1,229 (registered nurse vs. lay mid-wife).
Subjects and instructions. The subjects werecollege students recruited via a campus news-
Table 3Master List of Words
Word
theofandtointhatheforwithonfromwhenouttimetwoafterpeopleagainoncenexthalfresultmusiccouplehitprouddulltentcorkjugbun
Rate/106
61,26034,71629,83425,89219,03211,48310,2469,1187,3006,7304,0442,8072,5651,7511,3681,152
821730578455358222182125104
70462610
72
IOO
90
80
70
0) 60 p
OO 50
£ 40O
CL 30
20
. I
5 10 20 SO 100 1000 10000
True RatioFigure 6. Percentage of subjects who correctlyidentified the more likely cause of death as a func-tion of true ratio for 100 pairs of words.
paper advertisement and paid for their participa-tion. A group of 111 subjects judged the wordpairs, and a different group of 118 individualsjudged occupations. The instructions for wordsand occupations paralleled those for causes ofdeath. For pairs of words, the subjects wereasked to judge which word is more likely to besampled at random from common writing (maga-zines and books, fiction, nonfiction, scientific, non-scientific, etc.) in the United States, and to indi-cate how many times more likely the more fre-quent word is than the other word in the pair.For occupations, subjects were asked to indicatewhether an employed U.S. citizen picked at ran-dom is more likely to be working as an A or aB, and how many times more likely the morefrequent occupation is than the other occupationin the pair.
Results
Accuracy. Figures 6 and 7 show the re-lationship between percentage correct andtrue ratio, and geometric mean ratio judg-ments are plotted against true ratio in Fig-ures 8 and 9.s
For true ratios of 5:1 or greater, per-centage correct was considerably higher for
s The tables on which these figures are basedmay be obtained from the authors.

JUDGED FREQUENCY OF LETHAL EVENTS 561
words than for occupations; below 5:1 therewas no difference. For true ratios largerthan 2:1, both words and occupations weremore accurately discriminated than werecauses of death (compare Figures 6 and 7with Figure 2). For true ratios <2:1,there were again numerous errors of dis-crimination.
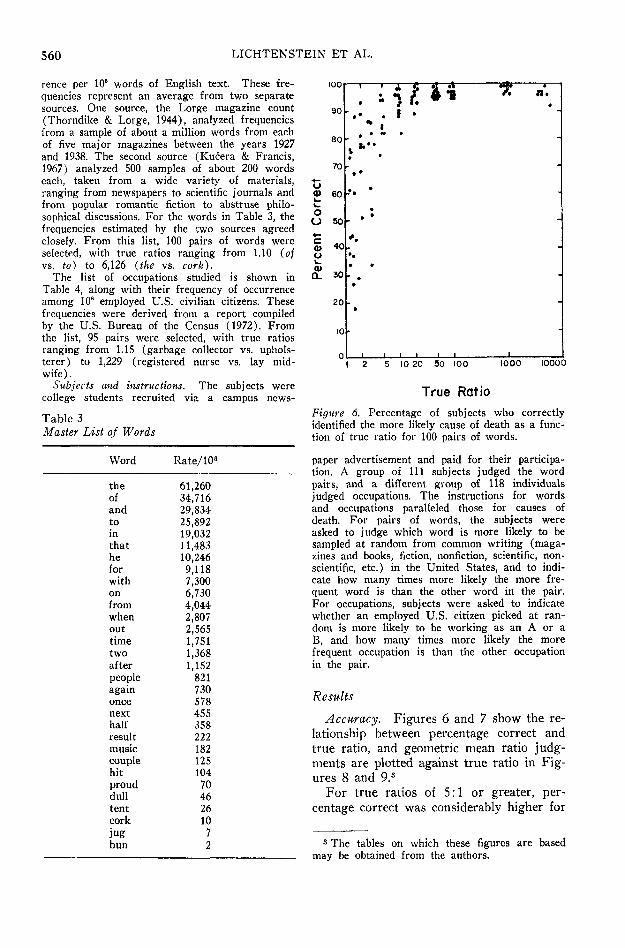
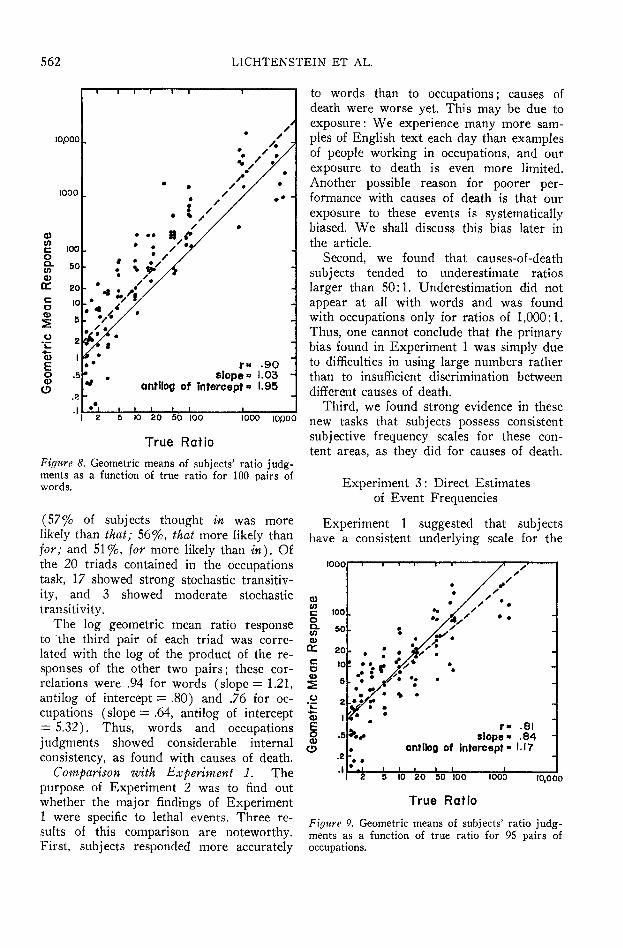
Geometric mean judged ratios for wordsand occupations were considerably closer tothe corresponding true ratios than werejudged ratios for causes of death, as may beseen by comparing Figures 8 and 9 (wordsand occupations) with Figure 4 (causes ofdeath). The correlation between judged andtrue ratios was higher for words (.90) thanfor occupations (.81), but since the scatterabout the regression line is not notably less,this effect may be attributed to the greaterrange of true ratios for words. As shown inFigures 8 and 9, the slope of the regressionline for occupations was somewhat flat, butwords showed a slope near unity, which,taken with the intercept of 1.95, indicated asystematic tendency toward overestimation.4
Consistency. The consistency of subjec-
Table 4Master List of Occupations
Oo
100
90'
80
70
60
50
40
30
20
10
I 5 I I L I
. . • t * •* ••• ; « ;• . * . * • •. : « • . ,
- • : •
-•»
.'.
1 2 5 10 20 50 100 IOOO
True RatioFigure 7. Percentage of subjects who correctlyidentified the more likely cause of death as a func-tion of true ratio for 95 pairs of occupations.
Occupation Rate/108
Secretary 3,529,680Elementary or secondary school
teacher 3,155,206Retail sales clerk 2,967,880Truck driver 1,802,169Waiter or waitress 1,331,616Registered nurse 1,083,800Auto mechanic 1,051,250College or university teacher 635,138Electrician 611,935Telephone operator 531,655Physician 436,322Lawyer 339,829Letter carrier 329,866Bus driver 308,205Bartender 246,584Computer programmer 210,750Librarian 159,172Baker 142,634Bulldozer operator 115,537Garbage collector 93,290Upholsterer 81,118Architect 73,418Dietitian 52,422Airline purser, steward, or stewardess 43,891Air traffic controller 33,040Airline pilot or copilot 32,787Psychiatrist 28,191Veterinarian 25,387Motion picture projectionist 20,198Judge 16,001FBI special agent 10,320Rabbi 8,491Embalmer 6,203EEC technician 3,919Jockey 2,065Nuclear reactor operator 1,568Lay midwife 882
tive ordering of the stimuli was sought byanalyzing the triads in the words and occu-pations pairs. Of the 39 triads containedin the words task, 28 showed strong sto-chastic transitivity, 10 showed moderatestochastic transitivity, and one was intransi-tive. The one intransitive triad involvedthree pairs for which consensus was lacking
* Carroll (1971), who elicited direct (magni-tude) estimates of 60 words (12 of which wereused here), found a correlation of .92 betweenassessed and actual values. His regression linehad a slope of .58.
562 LICHTENSTEIN ET AL.
lopoo
1000
03in
ItoOJITcD
100
50
20
10
5
.^ 2
Oo>O
r» -90slope" 1.03 -
antilog of intercept» 1.95
5 10 20 50 100
True Ratio
1000 lopoo
Figure 8. Geometric means of subjects' ratio judg-ments as a function of true ratio for 100 pairs ofwords.
(57% of subjects thought in was morelikely than that; 56%, that more likely thanfor; and 51%, for more likely than in). Ofthe 20 triads contained in the occupationstask, 17 showed strong stochastic transitiv-ity, and 3 showed moderate stochastictransitivity.
The log geometric mean ratio responseto the third pair of each triad was corre-lated with the log of the product of the re-sponses of the other two pairs; these cor-relations were .94 for words (slope = 1.21,antilog of intercept = .80) and .76 for oc-cupations (slope = .64, antilog of intercept= 5.32). Thus, words and occupationsjudgments showed considerable internalconsistency, as found with causes of death.
Comparison with Experiment 1. Thepurpose of Experiment 2 was to find outwhether the major findings of Experiment1 were specific to lethal events. Three re-sults of this comparison are noteworthy.First, subjects responded more accurately
to words than to occupations; causes ofdeath were worse yet. This may be due toexposure: We experience many more sam-ples of English text each day than examplesof people working in occupations, and ourexposure to death is even more limited.Another possible reason for poorer per-formance with causes of death is that ourexposure to these events is systematicallybiased. We shall discuss this bias later inthe article.
Second, we found that causes-of-deathsubjects tended to underestimate ratioslarger than 50:1. Underestimation did notappear at all with words and was foundwith occupations only for ratios of 1,000:1.Thus, one cannot conclude that the primarybias found in Experiment 1 was simply dueto difficulties in using large numbers ratherthan to insufficient discrimination betweendifferent causes of death.
Third, we found strong evidence in thesenew tasks that subjects possess consistentsubjective frequency scales for these con-tent areas, as they did for causes of death.
Experiment 3: Direct Estimatesof Event Frequencies
Experiment 1 suggested that subjectshave a consistent underlying scale for the
1000
<D
£ .00p
SOQ.COQ>o: 20OCD
10
T" .81slope' .84
antilog of intercept • 1-17
_ _ _5 10 20 50 100 1000
True Ratio
10,000
Figure 9. Geometric means of subjects' ratio judg-ments as a function of true ratio for 95 pairs ofoccupations.

JUDGED FREQUENCY OF LETHAL EVENTS 563
frequency of lethal events, although thatscale deviates markedly from the statisti-cally correct one. Unfortunately, the incom-plete paired-comparison design used in Ex-periment 1 did not permit the subjectivescale to be uncovered for all events. Whenthe judged relative frequencies for a givenpair were in error, it was difficult to deter-mine whether judgments were biased forone, the other, or both members of the pair.Experiment 3 elicited direct estimates toclarify the nature of the biases for individuallethal events.
Method
The subjects were 74 respondents to an adver-tisement in the University of Oregon campusnewspaper. Each subject was assigned to one oftwo groups. One group of 40 subjects was toldthat the frequency of deaths in the U.S. due tomotor vehicle accidents was 50,000 per year(MVA group). Using this value as a standard,they were asked to estimate the frequency for theother 40 lethal events shown in Table 1. The re-maining 34 subjects (Group E) were given thestandard of 1,000 deaths by electrocution. Theglossary used in Experiment 1, which definedsome of the events, was provided. The 41 eventswere listed in alphabetical order on a single sheet.Subjects were encouraged to erase and changeanswers to make the relative frequencies of theentire set consistent with their best opinions.
Since there were about 205,000,000 persons inthe United States when the data were collected,the rates per 108 shown in Table 1 were multi-plied by 2.05 to provide statistical frequenciesagainst which to compare subjects' judgments.The standards given to the subjects, 1,000 forelectrocutions and 50,000 for motor vehicle acci-dents, were close to these computed statisticalfrequencies (1,025 and 55,350, respectively).
Results
The data for one subject from GroupMVA and two subjects from Group E wereexcluded from all analyses because theygave unreasonably high estimates (the sumof their estimates for all 41 causes of deathexceeded 50,000,000, whereas the sum ofthe statistical frequencies is 3,553,004). An-other subject was excluded from Group Ebecause of unusually low responses. All ofthis subject's responses were below 1,000(the value of the standard); 38 of 40 re-
sponses were less than 100. As a result ofthese exclusions, the data presented beloware based on 39 subjects in Group MVAand 31 subjects in Group E.
Because arithmetic means tend to be un-duly influenced by occasional extreme val-ues, the present results are based on thegeometric means of the estimates. The useof medians leads to essentially the same re-sults. For both groups, the correlation be-tween log geometric mean and log medianwas .99 (for Group MVA, slope = 1.01,antilog of intercept = .97; for Group E,slope = 1.00, antilog of intercept = 1.17).
The log geometric mean direct estimatesfor Groups E and MVA were highly cor-related (r=.98). However, as shown inTable 5, the geometric means for the MVAgroup were larger than those for Group Efor 34 of 41 causes (sign test; p < .01).This difference may be due to MVA sub-jects anchoring on a larger standard thanthat presented to E subjects. (The two col-umns in Table 5 labeled ratio of fudged topredicted will be discussed later in thearticle.)
Accuracy. Figures 10 and 11 show thegeometric mean judgments plotted againstthe true rates (excluding smallpox). Thebest-fitting quadratic curves are also shown.For both groups, quadratic equations pro-vided a significantly better fit (p < .01) tothe data than linear equations. For theMVA group, the correlation between thelog geometric mean responses and the pre-dictions from the quadratic equation was.92; the linear correlation was .89. ForGroup E the correlations were .93 (qua-dratic) and .91 (linear).
Although the log geometric mean esti-mates correlated highly with the true fre-quency, these correlations, calculated overa true frequency range of over 800,000, donot indicate substantial accuracy. Large es-timation errors were evident, as with thepaired-comparison judgments. For exam-ple, as Table 5 indicates, accidental deathwas again judged about equal in frequencyto all diseases (although death from diseaseis 15 times more likely), cancer was judgedto be about twice as frequent as heart dis-

564 LICHTENSTEIN ET AL.
Table 5Results from Direct Estimates
MVA
Cause
SmallpoxPoisoning by vitaminsBotulismMeaslesFireworksSmallpox vaccinationWhooping coughPolioVenomous bite or stingTornadoLightningNonvenomous animalFloodExcess coldSyphilisPregnancy, childbirth, and abortionInfectious hepatitisAppendicitisElectrocutionMotor-train collisionAsthmaFirearmsPoisoningTuberculosisFire and flamesDrowningLeukemiaAccidental fallsHomicideEmphysemaSuicideBreast cancerDiabetesMotor vehicle accidentLung cancerStomach cancerAll accidentsStrokeAll cancerHeart diseaseAll disease
Rate per2.05 X 10s
012568
IS174890
107129205334410451677902
1,0251,5171,8862,2552,5633,6907,3807,380
14,55517,42518,86021,73024,60031,16038,95055,35075,85095,120
112,750209,100328,000738,000
1,740,450
Geometricmean
8823737933133138
171202535688128298863468717
1,932907880586793769
1,6231,318
9663,8141,9892,8072,5858,4413,0096,6753,6072,138
50,000"9,7234,878
86,53710,66847,52325,90080,779
Ratio ofjudged topredicted
1.271.971.391.54.17.69.80
1.671.82.32.71
1.77.81
1.152.981.191.03.65.74.65
1.26.96.59
1.62.85.81.68
2.10.69
1.42.66.34
6.341.00.43
6.77.54
1.70.49.75
Electrocution
Geometricmean
3744888577145147
233463
64102627211338935328416
1,000»598333
1,114778448
2,9181,4252,2202,7683,6912,6963,2802,4361,019
33,8849,8062,209
91,2854,737
43,77221,50397,701
Ratio ofjudged topredicted
1.161.961.471.26
.22
.62
.551.852.86
.37
.542.71
.731.052.78.80.87
1.96.95.47
1.42.92.43
1.86.91.92
1.031.30.86.97.61.22
5.761.33.26
9.32.31
2.00.51
1.14
Note. MVA = motor vehicle accident.* Standard.
ease (the reverse is true), floods wereestimated to take more lives than asthma(asthma is 9 times more likely), diabeteswas seen as only half as frequent as fire andflames, homicides were judged almost asfrequent as stroke and so on.
The errors evident in the direct estimates
were partitioned into primary and secondarycomponents, as was done with the paired-comparison judgments in Experiment 1.The primary bias was an overestimation oflow-frequency events and underestimationof high-frequency events by both groups.As shown by the quadratic curve in Figure

JUDGED FREQUENCY OF LETHAL EVENTS 565
<DCOco
100,000
10,0000)
o 10000>
u•- 100+-0>
oQ) 10
10 100 1000 10,000 loopoo 1,000,000
True FrequencyFigure 10. Geometric means (GM) of ratio judgments by motor vehicle accident group sub-jects as a. function of true frequency (TF). (Curved line is best-fitting quadratic: log GM =.07 [log TFP + .03 log TF + 2.27.)
10, the crossover point for Group MVAwas at a true rate of about 800; all eventswith frequencies lower than that were over-estimated, and all above that point wereunderestimated. For Group E (see Figure11) the crossover point was less clear; itoccurred around a true rate of 250.
Secondary bias. Deviations from the re-gression curves were quite similar for thetwo groups (see Figures 10 and 11). Thecorrelation between the two groups' residualvalues (i.e., the vertical distance betweeneach point and the regression curve) was.91 across the 40 items (excluding small-pox), indicating a consistent secondary biasabove and beyond the primary bias evi-
denced by the regression curves. The anti-logs of these residuals are shown in Table5, in the columns labeled ratio of judged topredicted. Some of the items with large re-siduals are labeled on the two figures. Thesimilarity between the two groups of sub-jects, relative to their own regression lines,is striking. Frequency of death due to allaccidents, motor vehicle accidents, preg-nancy, flood, tornado, and cancer was rela-tively overestimated by both groups. Deathdue to smallpox vaccination, diabetes, light-ning, heart disease, tuberculosis, and asthmawas relatively underestimated by both.
Comparison with Experiment 1. Over-all, there is a close relationship between the

566 LICHTENSTEIN ET AL.
10 100 1000 lopoo toopoo ipoo.ooo
True FrequencyFigure 11. Geometric means (GM) of ratio judgments by electrocution group subjects as afunction of true frequency (TF). (Curved line is best-fitting quadratic: log GM = .OS (logTF)2 + .22 log TF + 1.58.)
direct estimates of the present experimentand the paired-comparison results of Ex-periment 1. From the geometric means ofthe direct estimates one can compute ratiosfor each of the 106 pairs studied in Experi-ment 1. The logs of these derived ratioswere highly correlated with the logs of thegeometric mean frequency ratios from Ex-periment 1 (college students) : r — .94 forthe MVA group and .93 for the E group(across all 106 pairs).
Neither the judged ratios from Experi-ment 1 nor the ratios derived from thedirect estimates of the present experimentwere consistently closer to the true ratios.The judged ratios from Experiment 1 were
less accurate when the true ratio was low(< 10:1) and more accurate when the trueratio was high (;> 10:1).
Individual performance. For each sub-ject the correlation between log responseand log true rate was calculated across the40 stimuli (excluding smallpox). Individ-uals in Group E showed a range from .61to .92 and a median of .77. Within GroupMVA, correlations ranged from .28 to .90;the median was .66. Again, these correla-tions do not indicate substantial accuracy.Subjects who could make only the roughestdiscriminations, for example, knowing thatdeath from botulism or lightning is lesslikely than death from all cancer or all acci-

JUDGED FREQUENCY OF LETHAL EVENTS 567
Table 6Ratings on Eight Predictor Variables
Indirect
Cause
SmallpoxPoisoning by vitaminsBotulismMeaslesFireworksSmallpox vaccinationWhooping coughPolioVenomous bite or stingTornadoLightningNonvenomous animalFloodExcess coldSyphilisPregnancy, abortion,
and childbirthInfectious hepatitisAppendicitisElectrocutionMotor-train collisionAsthmaFirearm accidentPoisoning solid/liquidTuberculosisFire and flamesDrowningLeukemiaAccidental fallsHomicideEmphysemaSuicideBreast cancerDiabetesMotor vehicle accidentLung cancerStomach cancerAll accidentsStrokeAll cancerHeart diseaseAll disease
Range of scaleM
Death
2.201.232.822.072.431.301.482.492.413.462.342.303.662.622.51
3.072.032.002.903.031.623.893.022.714.073.823. 563.184.693.024.003.032.374.694.152.894.443.874.544.284.481-53.04
Suffer-ing
2.481.432.823.002.851.711.952.872.973.752.382.894.052.933.67
3.842.772.672.692.853.133.873.053.134.153.233.383.544.333.363.664.333.494.714.213.084.643.984.594.344.491-53.35
Direct
Death
1.021.001.031.051.101.031.001.151.051.071.051.031.121.151.07
1.131.121.101.211.231.181.441.101.101.201.691.361.311.391.311.741.381.312.031.821.592.051.952.382.152.251-31.35
Suffer-ing
1.331.071.362.411.561.411.381.772.151.381.231.821.561.571.79
2.032.022.301.571.282.411.671.611.611.711.681.232.431.231.751.712.002.392.611.661.592.432.182.342.102.441-31.80
News-paperfre-
quency
000000000
3614400
000501830
9447
115
2781
2900
29830
715122549
111l-oo42.4
News-paperinches
000000000
153.5.8
33.841.800
000
42.20
1.928.217.90
320.7247
14.8124.8
5042.91.1
356.700
1440.535.90
2861.4130.7188.5303.4727.11-00
295.5
Catas-trophe
1.3511.491111114.511.0115.571.201
1.011112.1211.021.031.081.731.0711.031.0611111.64111.701111.191-M
1.31
Condi-tion-ality
5.874.36
10.321.813.73
.713.844.816.846.25
10.063.196.52
10.155.19
4.577.793.53
15.8114.872.07
10.3410.817.68
10.5817.6515.004.79
18.3211.0317.239.396.458.97
14.2611.876.97
11.7613.1613.008.00
0-208.77
dents, would show high correlations.
Experiment 4: Experience and Bias
Experiments 1 and 3 demonstrated thatthe frequencies of some lethal events areconsistently misjudged. In hopes of learning
more about the nature of these errors andbiases, Experiment 4 examined people'sdirect and indirect experiences with theseevents and some of the events' special char-acteristics. Eight different characteristicswere assessed for each lethal event and thenused to predict the errors found in Experi-
568 LICHTENSTEIN ET AL.
ments 1 and 3. Four of the measures as-sessed how much experience subjects feelthey have had with the different causes ofdeath. Two measures reflected the frequencywith which causes of death appear in news-paper articles. The final measure reflectedthe degree to which the various causes ofdeath were judged to be catastrophic (in-flicting simultaneous multiple casualties)and lethal (inevitably producing death forpeople suffering from the condition).
Method
Experience ratings. A new group of 61 subjectsrecruited through the University of Oregon cam-pus newspaper was asked to rate each of the 41causes of death according to their personal ex-periences with the event as a cause of death andsuffering.
Two ratings of indirect experience were ob-tained by asking subjects to indicate how oftenthey had heard about the event via the media(newspapers, magazines, radio, television, etc.) as(a) a cause of death and (b) a cause of suffering(but not death). Ratings were made on a 5-pointscale whose extreme categories were never (codedas 1) and often (coded as 5).
Subjects' direct experience with the 41 eventsas causes of death were elicited by having themcheck one of the following three statements foreach event: At least one close friend or relative
has died from this (Code 3) ; someone I know(other than a close friend or relative) has diedfrom this (Code 2) ; no one I know has died fromthis (Code 1). Direct experience with these eventsas causes of suffering was elicited with similarquestions, with the word died replaced by thephrases suffered (but not died).
Thus, each subject provided four ratings foreach of the 41 events. These were ratings of (a)indirect death (coded 1 to 5), (b) indirect suffer-ing (coded 1 to 5), (c) direct death (coded 1 to3), and (d) direct suffering (coded 1 to 3).
Ncivspapcr coverage. The news media providetwo kinds of information about causes of death.One, as noted earlier, is reports of statistical anal-yses (Figure 1). The other, far more prevalent,is the day-to-day reporting of fatalities as theyhappen. The latter is likely to be biased towardviolent and catastrophic events (see, for example,Arlen's [1975] survey of television's treatment ofdeath). Because of the potential importance ofmedia exposure, we supplemented people's ratingsof their indirect (media) experiences with a sur-vey of newspaper reports. The local daily news-paper (the Eugene Register-Guard) was ex-amined on all days of alternative months for ayear, starting with January 1, 1975 (for a total of184 days). Two tallies were made for each causeof death: the total number of deaths reported andthe square inches of reporting devoted to thedeaths (excluding photographs).
Catastrophe ratings. Economist Theodore Berg-strom (Note 2) has asked whether catastrophicevents with multiple victims in close geographicand temporal proximity will be judged as more
Table 7Direct Estimates Correlation Matrix
Variable 10 11 12 13
1. MVALGM2. E LGM3. MVA group residuals4. E group residuals5. Log true frequency
6. Indirect death
7. Indirect suffering
8. Direct death
9. Direct suffering
10. News frequency
11. News inches
12. Catastrophe
13. Conditional death
.98 —
.40 .35 —
.36 .38 .91 —
.89 .91 .00 .00
.85 .86 .45 .48
.86 .86 .46 .44
.90 .88 .19 .19
.52 .50 .22 .16
.56 .54 .59 .56
.45 .41 .45 .36
-.03 .02 .29 .40
.47 .51 .04 .08
.74
.76
.82
.46
.33
.29
-.12
.54 .65 .37 .47 -.28 .10 .30 -.07
Note. MVA = motor vehicle accident; E = electrocution; LGM = log geometric mean.

JUDGED FREQUENCY OF LETHAL EVENTS 569
likely than events that take as many lives but ina less spectacular, one-at-a-time fashion. He hy-pothesized that catastrophes are more spectacularand thus more memorable, a speculation in keep-ing with availability considerations. On the otherhand, the more frequent instances of noncatas-trophic events may lead them to be judged moreaccurately, whereas casualties from catastrophicevents may be underestimated because of theirmassed presentation (Hintzman, 1976). To assesscatastrophic potential, 13 employees of the OregonResearch Institute were asked to estimate the av-erage number of people who die from a singlefatal episode of each of the 41 causes of death.
Conditional death ratings. In Experiments 1and 3 subjects appeared to underestimate (rela-tive to the regression line) the frequencies ofdeaths due to events that are common in nonfatalform, such as smallpox vaccination and asthma.One possible explanation of this error is thatsubjects confused P(event xjdeath) with P(death|event x) and failed to appreciate the importanceof base rates (Tversky & Kahneman, 1974; Bar-Hillel, Note 3). Consider the question of whethera randomly selected death is more likely to bedue to smallpox or smallpox vaccination. Thisquestion calls for comparing P(smallpox)death)with P(smallpox vaccination]death), the latterbeing statistically greater. However, subjects maybe relying on P( death [smallpox) and P(death[smallpox vaccination) to answer such questions.If the base rates for the two events are discrepant(there are many more smallpox vaccinations thancases of smallpox), the resulting judgments will bein error.
To explore the role of this characteristic, 31college students were asked to rate the proba-bility of death given that one suffered from orexperienced each condition. The ratings were madeon a scale from 0 (surely won't die) to 20 (surelywill die).
Results
Mean values. Mean values for the sixsubjective scales and the two newspapermeasures are shown in Table 6. As onewould expect, subjects reported greater ex-perience with these events as causes of suf-fering than as causes of death. The mostfrequently experienced event was motorvehicle accidents, while the lowest ratingswere given to poisoning by vitamins.
During 184 days of newspaper reporting,19 of the listed causes of death were nevermentioned. Some of these 19 causes arequite frequent: cancer of the digestive sys-tem, diabetes, breast cancer, and tubercu-losis. In contrast, the eighth most frequentlyreported cause of death in the newspapers,
tornadoes, is in fact relatively rare. The re-ported tornado deaths may represent alldeaths from this cause in the United Statesduring the dates covered. Note also thathomicide, which is 23% less frequent thansuicide, was reported 9.6 times as often,with 15 times as much space devoted to it.B
Few of the listed causes of death wereclassed as catastrophic in terms of thejudged number of people dying on a singleoccasion. Flood, tornado, and motor vehicle/train collisions led the catastrophe ratings.
The conditional death ratings seem rea-sonable. The lowest rating was given tosmallpox vaccination, while the highest wasto homicide, followed by drowning. Somechronic diseases—asthma, diabetes, syphilis,and tuberculosis—were rated below theoverall mean of 8.77, but emphysema (11.03)and heart disease (13.00) were both ratedwell above the mean.
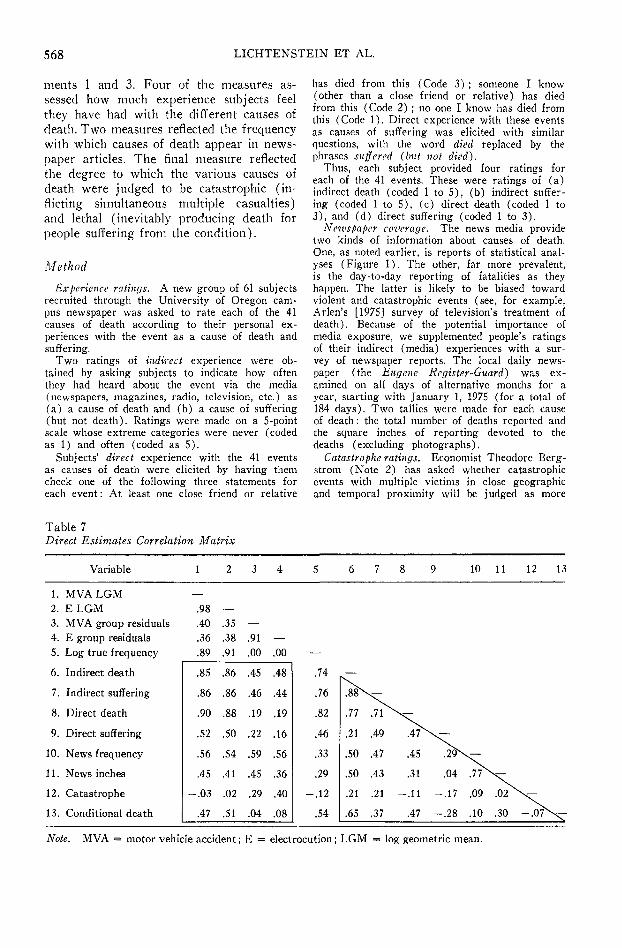
Correlations: direct estimates. Correla-tional analyses were performed to deter-mine whether the eight measures predict thejudgments and biases found in Experiment3. Two aspects of the direct-estimate datawere predicted from the eight character-istics : (a) the log geometric mean responseto the 40 lethal events (excluding small-pox) and (b) the index of secondary biasused in Experiment 3 (the signed differencebetween the log geometric mean of thejudged frequencies and the log geometricmean predicted by the quadratic regressioncurves shown in Figures 9 and 10).
Table 7 shows the intercorrelation matrixfor the four response variables (log geo-metric mean frequencies and residuals forGroup MVA and for Group E), the truefrequency, and the eight predictor variables.The lower left rectangle of correlations in-dicates the predictive power of the eight in-dependent variables. Three of the four ex-perience ratings showed strong correlationswith the four response variables. Note thatthese ratings correlated more highly with
5 This result may be even more extreme thanit appears, since there is good reason to supposethat the official records we used to establish "true"rates underestimate the frequency of suicide.

570 LICHTENSTEIN ET AL.
the subjects' responses than with the truefrequencies. The ratings of direct sufferingshowed only moderate correlations withsubjects' responses.
News frequency and news inches werealso modestly good predictors of the re-sponse variables. They were poorly corre-lated with true frequency, demonstratingthe biased view of reality that newspaperspresent." The catastrophe ratings showedquite low correlations with all other varia-bles. This may be due, in part, to the lackof variance in these ratings; over half wereequal to 1.0, and only 10 of 41 were greaterthan 1.08. Finally, conditional death ratingswere moderately correlated with the geo-metric mean responses, but not with theresiduals.
The correlations among the eight predic-tor measures are also shown in Table 7.Indirect death, indirect suffering, and directdeath ratings showed fairly high intercor-relations but lower correlations with directsuffering. The two newspaper measureswere highly intercorrelated. However, thesenewspaper measures correlated only mod-erately with the indirect death ratings, eventhough the instructions for the latter taskemphasized newspaper coverage.
The direct estimates made by the subjectsin Experiment 3 may have been biased be-cause they were influenced by past experi-ence with indirect sources of information(such as newspapers), which themselveswere biased. We suspected that ratings ofdirect experience might be less biased and,therefore, might provide more accurate es-timates of the true frequencies than did thedirect estimates of frequency. This hypothe-sis was tested and was not supported. Al-though the direct death ratings did correlatemore highly with the true frequency (r =.82) than did any of the other predictormeasures, the direct estimates of Experi-ment 3 did even better (r = .89 and .91).
Correlations: paired comparisons. Simi-lar correlational analyses were performedrelating the eight measures with the paired-comparison judgments of Experiment 1.To do this, a difference score was formedon each measure for each of the 101 pairs
(excluding smallpox) by subtracting thescore associated with the less likely cause ofdeath from the score associated with themore likely cause of death. These differencescores were then correlated with four de-pendent variables (the log geometric meanresponses and the index of secondary biasused in Experiment 1, for students and forleague members), with the log true ratio,and with each other. The resulting correla-tion matrix is not shown here, because itwas quite similar to Table 7.
As with the direct-estimate data, theratio of the direct death ratings correlatedwith true ratio more highly (r — .62) thandid any of the other predictor measures.However, it could not successfully be sub-stituted for the judged ratios of Experiment1 in an attempt to improve accuracy, sincethe judged ratios were even more highlycorrelated with true ratio (r = .69 for stu-dents and .75 for league members).
Regression analyses predicting responsesand biases. To bring greater clarity to thismass of correlations, eight stepwise regres-sions were performed. Four of these anal-yses predicted the log geometric mean re-sponses of the four separate groups ofsubjects: students' paired comparisons,league members' paired comparisons, GroupE's direct estimates, and Group MVA's di-rect estimates. The other four stepwise re-gression analyses predicted secondary bias(the residuals from the correlations of eachof these four groups with the statistical fre-quencies).
The predictor variables for each of thestepwise regressions were the eight mea-sures previously described, using differencesbetween 101 pairs to predict the paired-comparison data or 40 mean ratings to pre-dict the direct estimates and their residuals.
Because of the instability of stepwise re-gression solutions with highly intercorre-lated predictors, our primary criterion forvariable selection was replicability. Onlyvariables that entered the equations for bothleague and student subjects in Experiment
6 Similar evidence of bias in another newspapermay be found in Combs and Slovic (Note 4).

JUDGED FREQUENCY OF LETHAL EVENTS 571
Table 8Variables Emerging from Stepwise Multiple Regressions in Both Replications
Dependent variables
Log geometric mean Residuals
Paired comparisons Direct estimates Paired comparisons Direct estimates
Indirect sufferingDirect death
Indirect sufferingDirect deathNews frequency
Indirect deathDirect deathConditional death"
News frequencycatastrophe
• Negative weight.
1 or both Group E and Group MVA in Ex-periment 2 are discussed. Table 8 lists thevariables that emerged from both groups ofsubjects. The inclusion criterion was an Fto enter7 of 3.0 or greater. The log geo-metric means were highly predictable, withRs ranging from .88 to .96 using just threeof the eight predictors. The residuals werealso predictable, with Rs ranging from .64to .80 using the variables selected by thestepwise regression.
Two variables, indirect suffering and di-rect death, did most of the job of predictingthe subjects' log geometric mean responsesfor both paired comparisons and direct esti-mates. The regressions on the residualsshow a more mixed pattern. For the re-siduals from the paired-comparison data,three predictors were common to both thestudent and league data: indirect death, di-rect death, and conditional death. Condi-tional death had a negative weight becauseof its low correlation with the dependentvariable and its high correlation with in-direct death. For the prediction of residualsfrom the direct estimates, news frequencyand catastrophe ratings were the only pre-dictors that were significant in both groups.In view of the highly skewed distributionsof these two measures, it is somewhat sur-prising to see them emerge as valid predic-tors. However, news frequency correlatedwith direct-estimate residuals higher thandid any other single predictor. Of the 7causes of death with catastrophe ratings of1.5 or greater, six (all accidents, motor ve-hicle accidents, flood, botulism, tornado, andfire and flames) were among the 10 causesof death with the highest residuals (i.e., the
10 most overestimated causes of death, rela-tive to the regression line).
The above analyses indicate that mea-sures tapping the availability of informationabout causes of death do a good job of pre-dicting subjects' judgments of the frequen-cies and relative frequencies of these causesof death. Further, we have shown that theconsistent errors people make (the second-ary bias) can be predicted from salient fea-tures of the events such as their catastrophicnature and from ratings of experience withthe lethal events made by a different groupof subjects.
Experiment 5: Debiasing
Experiments 1 and 3 showed that sub-jects make severe and consistent errors injudging the frequency or relative frequencyof lethal events. Experiment 5 was designedto see if subjects could correct these errorswhen they were told the hypothesized causesof the errors. Emphasis was placed on thesecondary bias and its possible causes: un-even newspaper coverage and the effects ofimaginability and memorability.
Study 5A
Method
In Study 5A, subjects made paired comparisonsfor 31 of the 106 pairs of Experiment 1. Twenty-one of these pairs were severely misjudged inExperiment 1 (either the percentage correct was
7 An "F to enter" tests the significance of theincrease in the proportion of explained varianceachieved by including an additional variable in theregression equation.

572 LIGHTEN STEIN ET AL.
less than 60% or the geometric mean was off bya factor of 9 or more). The geometric means ofthe remaining 10 were estimated moderately well(within a factor of l.S). The present study wasconducted with a college student population simi-lar to that in Experiment 1 and with the sameinstructions except that one group, the debiasinggroup (re = 30), was given the following specialinformation:
Note: In a previous study of this kind wefound that, for some pairs, the relative likeli-hoods were greatly misperceived. Sometimesthe ratio of the more likely to the less likelyitem was judged to be much greater than itreally was. In other cases the ratio was judgedmuch too small or even in the wrong direction;that is, the less likely item was judged to bemore likely.
We believe that when people estimate theselikelihoods, they do so on the basis of a) howeasy it is to imagine someone dying from sucha cause, b) how many instances of such an eventthey can remember happening to someone theyknow, c) publicity about such events in thenews media, or d) special features of the eventthat make it stand out in one's mind.
Reliance on imaginability, memorability, andmedia publicity, although often useful, can leadto large errors in judgment. When events aredisproportionately imaginable or memorable, theyare likely to be overestimated. When they arerather unmemorable or unpublicized or other-wise undistinguished, they are likely to be under-estimated. Events such as ulcers that are com-mon, but usually non-fatal, may also be under-estimated because people tend to imagine orremember them in their non-fatal form.
Try not to let your own judgments be biased byfactors such as imaginability, memorability, ormedia publicity.
A control group (» —22) also judged the 31 pairswithout receiving any special instructions.
Results
Examination of percentage correct re-vealed no evidence for debiasing. The origi-nal subjects (Experiment 1) were best on9 pairs, the control subjects were best on12 pairs, and the debiasing group subjectswere best on 10 pairs.
A further search for improvement in thedata of Study 5A can be made by compar-ing the ratio judgments of these two newgroups of subjects either with the true ra-tios (under the assumption that the in-
structions exhorted the subjects to comecloser to the truth) or with the ratios pre-dicted from the regression analysis of theoriginal subjects (under the assumptionthat the instructions emphasized the natureof the secondary bias, not the primary bias).No evidence for effective debiasing can beseen under either comparison. For geo-metric means, when the comparison is madeto the true ratio, the original group wasbest on 12 pairs, the controls on 6 pairs,and the debiasing group on 13 pairs. Whencompared with the predicted ratios, theoriginal group was best on 12 pairs, thecontrol group on 7, and the debiasing groupon 12. Looking only at the 21 pairs thatwere originally judged poorly, there is stillno evidence of improvement in the debias-ing group. Even those pairs on which thedebiasing group did best showed only mod-est improvement. For example, death bydiabetes is 95 times more likely than deathby syphilis. The debiasing group was "su-perior" in giving a geometric mean responseof 9.7 rather than the original group's geo-metric mean of 2.4. Death by stroke is102,000 times more likely than death bybotulism. The value predicted by the regres-sion analysis of the original subjects was1,002. Those original subjects showed astrong secondary bias; their geometric meanresponse was 106. The debiasing groupgave a mean response of 135.
MethodStudy 5B
A second debiasing study was undertaken toprovide subjects even more opportunity for usingknowledge of the secondary biases to improvetheir performance. The subjects, drawn from thesame student population, were shown 19 pairs ofevents. The instructions indicated that each ofthese pairs had been seriously misjudged in anearlier experiment (which was the case). Foreach pair, the subjects were given the responsefrom Experiment 1 and were asked to improve it,that is, to give a new response that they thoughtwould be closer to the true ratio.
The instructions for a debiasing group of 29subjects included a discussion of the presumedsources of error, illustrated with several examplesshowing the possible effects of personal experi-ence, media publicity, imaginability, and the likeon previous subjects' judgments. A control group

JUDGED FREQUENCY OF LETHAL EVENTS 573
of 27 subjects did not receive this additionaldiscussion.
The instructions read as follows. Brackets in-dicate material shown only to the debiasing group.
We recently studied the ability of University ofOregon students to judge the likelihood of vari-ous causes of death in the United States.
For example, subjects were given a pair ofevents such as:
A. Measles,B. Tornado.
They were asked: Which causes more deathsannually in the U.S., A or B? They were alsoasked to estimate how many times more likelythe more frequent cause of death was comparedto the less frequent of the two.
We found that, for some pairs, the relative like-lihoods were greatly misjudged. Sometimes theratio of the more likely to the less likely itemwas judged much too small or even in the wrongdirection; that is, the less likely item wasjudged to be more likely.
[We believe that when people estimate thesefrequencies, they do so on the basis of a) howeasy it is to imagine someone dying from sucha cause, b) how many instances of such an eventthey can remember happening to someone theyknow, c) publicity about such events in the newsmedia, or d) special features of the event thatmake it stand out in one's mind.][When events are disproportionately imaginableor memorable, they are likely to be overesti-mated. When they are rather unmemorable orunpublicized or otherwise undistinguished, theyare likely to be underestimated. Events such asaccidental falls, that are common but usuallynon-fatal, may also be underestimated becausepeople tend to imagine or remember them intheir non-fatal form.]On the following pages there are 19 pairings ofdeath-producing events. The relative likelihoodof the more common to the less common eventwas greatly misperceived in each of these pairs.[We want to see whether you can reduce themagnitude of the errors for these pairs. To dothis think about how factors such as mediacoverage or ease of imagining or rememberingthe event as a cause of death are likely to workto bias the judgments for each of the pairs.]Here are some examples to illustrate the task:
PreviousAnswer
YourAnswer
A. Hepatitis B 4.SSB. Drowning
The average subject chose B as more likelyand judged it to be 4.55 times more likely thanA. Which would you choose and what ratiowould you give?
Actually, the correct answer is B and the trueratio is 10.9 to 1. We see that the average sub-ject overestimated Hepatitis relative to Drown-ing. [Maybe this is because of the special at-tention given by the media to Hepatitis, espe-cially in relation to abuse of hypodermic needles.]
Try this one:
A. LeukemiaB. Accidental Falls
PreviousAnswer
A 1.30
YourAnswer
The average subject thought death from leu-kemia was 30% more common (ratio 1.30 to1) than death from falls. However, death fromfalls is really 20% more frequent. So the correctanswer is B with a ratio of 1.20. [The error maystem from the dramatic nature of leukemia andthe greater amount of media publicity it re-ceives, or it may stem from the fact that acci-dental falls are common but usually non-fatal.]
For a final example, consider:
A. Poisoning by solidor liquid
B. Tuberculosis
PreviousAnswer
A 5.26
YourAnswer
The average subject thought death by poisoningwas 5.26 times more likely than death from tu-berculosis. However, death from tuberculosis isreally 44% more frequent than death from poi-soning so the correct answer is B with a ratioof 1.44. [Again, it is easy to see how mediapublicity regarding poisoning and the dramaticnature of the event could cause subjects to over-estimate it compared to the drab, undramatic,perhaps old-fashioned disease, tuberculosis.]
Note that a ratio of 1.20 means 20% morelikely, 1.50 means 50% more likely, 1.80 means
more likely, etc.For each pair, write the letter of the item youthink is a more likely cause of death and giveyour judgment about how many times morefrequent the more frequent item is.
Results
The special instructions given to the de-biasing group had no effect on performance.Neither the debiasing group nor the controlgroup was able to improve consistently uponthe mean responses given by subjects inExperiment 1. For each pair, we calculatedthe percentage of subjects in the debiasinggroup and in the control group whose re-sponses were closer to the true ratio than

574 LICHTENSTEIN ET AL.
was the geometric mean of the original Ex-periment 1 group. We also calculated thepercentage of subjects in both groups whoseresponses were closer to the ratio predictedfrom the Experiment 1 regression line (i.e.,who had smaller secondary bias). In everycase the percentage closer to the true ratiowas equal to the percentage closer to theregression line. The average percentage ofimproved answers was only 53.8% for theexperimental group (range of 21%-82%)and 52.4% for the control group (rangeof 37%-70%). The experimental groupshowed a better improvement percentagethan the control group on 10 pairs, the con-trol group was better for 8 pairs, and therewas a tie on 1 pair.
Discussion
Psychological Significance
As in laboratory studies, our subjects ex-hibited some competence in judging fre-quency. Frequency estimates for causes ofdeath, words, and occupations generally in-creased with increases in true frequency;similarly, the discriminability of causes in-creased with the ratio of their statisticalfrequencies. Furthermore, our subjects' as-sessments of the frequencies of causes ofdeath, both direct estimates and paired com-parisons, correlated more highly with thetrue answers than did any other measures,such as newspaper reportage and ratings ofdirect experience with the causes of death.
Despite the sensitivity of judgments totrue frequency, the overall accuracy of bothpaired comparisons and direct estimates offrequency was quite poor. Unless the truefrequencies of a pair of lethal events dif-fered by more than a factor of two, therewas no guarantee that subjects could cor-rectly indicate which was more frequent.Large errors were present in the judgedratios for many pairs of events. The highcorrelations between direct estimates andtrue frequency across almost a million-to-one range of the latter variable are deceptive.Large errors were present in these esti-mates, much as with the paired-comparisonjudgments.
Primary bias. Experiments 1 and 3 dem-onstrated a strong primary bias, consistingof overestimation of low frequencies andunderestimation of both high frequenciesand large ratios, much as has been foundbefore by Attneave (1953), Teigen (1973),and others (Poulton, 1973). We consideredand rejected two possible reasons for thisprimary bias. One is that subjects avoidusing extremely high (or low) numbers inmaking their responses. The absence of suchbiases with the words and occupations tasksof Experiment 2 makes this hypothesis im-plausible. Second, the underestimation ofhigh ratios in Experiment 1 was not simplyan artifact of averaging correct and incor-rect answers. This is shown by the per-sistence of the effect for pairs in whichnearly everyone got the correct answer.
Another possible explanation of the pri-mary bias is that it results from anchoring:Subjects first choose some representativevalue and then adjust upward or downwardaccording to whatever considerations seemrelevant to the case at hand. Studies of an-choring and adjustment procedures haveshown that such adjustments tend to beinsufficient (Lichtenstein & Slovic, 1971;Tversky & Kahneman, 1974). A number oflaboratory studies of frequency estimationcan be interpreted as showing a tendencyto anchor on the average frequency in thelists learned (see Rowe & Rose, 1977). In-sufficient adjustment would produce tooflat a curve, a finding often noted in labora-tory studies (see Hintzman, 1976). Per-haps the clearest evidence of anchoring maybe found in Experiment 3, in which the onetrue frequency given to the subjects couldeasily have served as an anchor value. GroupMVA, who were given a high anchor(50,000), generally assigned higher valuesto the items than did Group E, whose an-chor value was 1,000.
In the paired-comparison tasks no suchclear-cut anchor was provided. Nonetheless,Poulton (1968) has shown that in magni-tude-estimation studies, the subjective mag-nitude of the first stimulus presented servesas an anchor for subsequent judgments.This view is supported by Carroll's (1971)
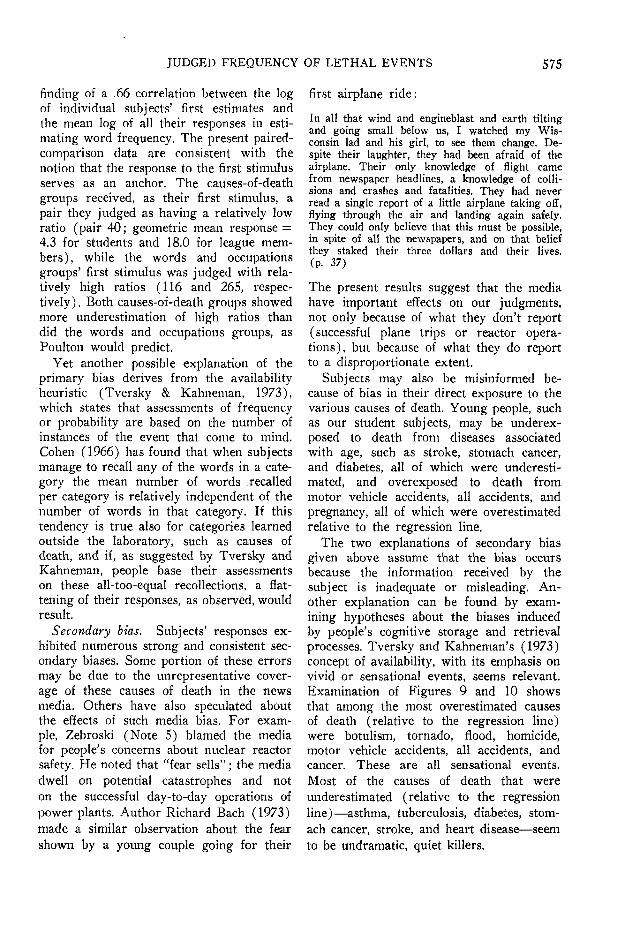
JUDGED FREQUENCY OF LETHAL EVENTS 575
finding of a .66 correlation between the logof individual subjects' first estimates andthe mean log of all their responses in esti-mating word frequency. The present paired-comparison data are consistent with thenotion that the response to the first stimulusserves as an anchor. The causes-of-deathgroups received, as their first stimulus, apair they judged as having a relatively lowratio (pair 40; geometric mean response =4.3 for students and 18.0 for league mem-bers), while the words and occupationsgroups' first stimulus was judged with rela-tively high ratios (116 and 265, respec-tively ). Both causes-of-death groups showedmore underestimation of high ratios thandid the words and occupations groups, asPoulton would predict.
Yet another possible explanation of theprimary bias derives from the availabilityheuristic (Tversky & Kahneman, 1973),which states that assessments of frequencyor probability are based on the number ofinstances of the event that come to mind.Cohen (1966) has found that when subjectsmanage to recall any of the words in a cate-gory the mean number of words recalledper category is relatively independent of thenumber of words in that category. If thistendency is true also for categories learnedoutside the laboratory, such as causes ofdeath, and if, as suggested by Tversky andKahneman, people base their assessmentson these all-too-equal recollections, a flat-tening of their responses, as observed, wouldresult.
Secondary bias. Subjects' responses ex-hibited numerous strong and consistent sec-ondary biases. Some portion of these errorsmay be due to the unrepresentative cover-age of these causes of death in the newsmedia. Others have also speculated aboutthe effects of such media bias. For exam-ple, Zebroski (Note 5) blamed the mediafor people's concerns about nuclear reactorsafety. He noted that "fear sells"; the mediadwell on potential catastrophes and noton the successful day-to-day operations ofpower plants. Author Richard Bach (1973)made a similar observation about the fearshown by a young couple going for their
first airplane ride:
In all that wind and engineblast and earth tiltingand going small below us, I watched my Wis-consin lad and his girl, to see them change. De-spite their laughter, they had been afraid of theairplane. Their only knowledge of flight camefrom newspaper headlines, a knowledge of colli-sions and crashes and fatalities. They had neverread a single report of a little airplane taking off,flying through the air and landing again safely.They could only believe that this must be possible,in spite of all the newspapers, and on that beliefthey staked their three dollars and their lives,(p. 37)
The present results suggest that the mediahave important effects on our judgments,not only because of what they don't report(successful plane trips or reactor opera-tions), but because of what they do reportto a disproportionate extent.
Subjects may also be misinformed be-cause of bias in their direct exposure to thevarious causes of death. Young people, suchas our student subjects, may be underex-posed to death from diseases associatedwith age, such as stroke, stomach cancer,and diabetes, all of which were underesti-mated, and overexposed to death frommotor vehicle accidents, all accidents, andpregnancy, all of which were overestimatedrelative to the regression line.
The two explanations of secondary biasgiven above assume that the bias occursbecause the information received by thesubject is inadequate or misleading. An-other explanation can be found by exam-ining hypotheses about the biases inducedby people's cognitive storage and retrievalprocesses. Tversky and Kahneman's (1973)concept of availability, with its emphasis onvivid or sensational events, seems relevant.Examination of Figures 9 and 10 showsthat among the most overestimated causesof death (relative to the regression line)were botulism, tornado, flood, homicide,motor vehicle accidents, all accidents, andcancer. These are all sensational events.Most of the causes of death that wereunderestimated (relative to the regressionline)—asthma, tuberculosis, diabetes, stom-ach cancer, stroke, and heart disease—seemto be undramatic, quiet killers.
576 LICHTENSTEIN ET AL.
Some of the evidence of secondary biasis inconsistent with previous laboratory find-ings. One such finding is that more concreteand imaginable words are judged to be lesslikely than equally frequent abstract words(e.g., Ghatala & Levin, 1976). While wehad no direct measure of imaginability, onemight assume that catastrophic events andthose more heavily reported in the mediatend to be more concrete and imaginable.However, all three of these surrogate mea-sures of imaginability (catastrophe, newsfrequency, and news inches) were positivelycorrelated with the residuals (for bothpaired comparisons and direct estimates).Thus, in this sense imaginable events tendedto be judged more likely, as predicted byavailability considerations.
Another difference between the presentresearch and previous studies is found withcatastrophic causes of death whose occur-rences tend to be massed rather than dis-tributed over time. Laboratory studies(e.g., Rowe & Rose, 1977) have consist-ently found that massing the occurrencesof a word in a learned list tends to decreaseits estimated frequency. Two explanationsoffered for this effect (Hintzman, 1976) are(a) encoding variability—spaced repetitionsare more likely to receive differential cod-ing than massed items—and (b) deficientprocessing of massed items. In the currentexperiments, catastrophic (massed) eventstended to be overestimated relative to theregression line. One key difference betweenthe usual laboratory experiments and thepresent study is that the former do not usestimuli that become sensational or emo-tionally charged when massed. Such specialcharacteristics may lead to extra processing,rather than to deficient processing, for cata-strophic causes of death.
When we have been able to compare thepresent results with previous laboratorywork, we have found about as many mis-matches as matches. The present study isbased on material our subjects have learnedin the real world; in most other laboratorywork, the subjects were tested on materialthey had learned in the laboratory. Mand-ler (Note 6) has speculated on this dif-
ference :
In terms of presentation of to-be-remembered ma-terial, the laboratory experiment fails—in com-parison with the real world—with respect tothree major problems: Frequency, salience, andcontext. The laboratory experiments fail with re-spect to frequency because the typical event thatan individual must recall or recognize in everydaylife has been encountered anywhere from a fewto thousands of times; in the laboratory we lookat the few and rarely look at the thousands.Salience must be of interest because encoding op-erations in the real world typically take placewith particular attention to the relevance or sali-ence of a particular event to other aspects of themental apparatus; we encode what is important,while in the laboratory we are required to encodewhat is unimportant. Furthermore, the context ofreal world memory involves not simply a restrictednumber of materials presented in the laboratory,together with a computer or a memory drum,but rather the larger context of the individual'scurrent plans and intentions, geographic location,and social conditions, (pp. 3-4)
Improving Judgments
One question raised by this study is howto improve intuitive judgments of fre-quency. We did not attempt here to correctthe primary (overestimation/underestima-tion) bias. Work by Teigen (1973) sug-gests that this can be done by asking peopleto allocate frequencies as percentages of thetotal rather than having them estimate ab-solute numbers. This technique, however,might not prove helpful when (as withcauses of death) the largest frequency isover a million times larger than the smallestfrequency. It would be exceedingly difficultfor subjects to express ratios even as highas 3,000:1 (as they did in the presentstudy) using a percentage response mode.Statistical correction, using regression equa-tions, might be the best way to correct theprimary bias.
Since the secondary bias observed hereseems linked to availability, we hoped toreduce that bias by informing subjectsabout its probable source. This informationwas not useful. The failure of such frontalattacks to eliminate biases (see also Fisch-hoff, 1977) suggests some directed restruc-turing of judgment tasks may be necessary.For example, Selvidge (1972) proposed

JUDGED FREQUENCY OF LETHAL EVENTS 577
having people make probability and fre-quency judgments on a scale in which otherfamiliar events serve as marker points. Incomposing such a scale, great care wouldhave to be taken to use only events whosesubjective ordering fits their true ordering.Beyth-Marom and Fischhoff (1977) haveshown that requiring people to work hard toproduce specific examples of classes ofevents before estimating the frequencies ofthe classes can partially reduce availabilitybias. Another promising suggestion comesfrom Armstrong, Denniston, and Gordon(1975), who found that numerical estimatescan be improved by having estimators de-compose the original question into a seriesof subquestions about which they are moreknowledgeable and whose answers leadlogically to the estimate of interest. For ex-ample, an answer to the question "Howmany people were killed in motor vehicleaccidents in the United States in 1970?"might be improved by having people answerthe following related questions: (a) Whatis the population of the U.S.? (b) Howmany automobile trips does the averageU.S. citizen take in a year? (c) What isthe probability of a fatal injury on any par-ticular trip? From the answers to thesequestions, one can calculate an answer tothe original question.
Societal Implications
Economist Frank Knight once observedthat "We are so built that what seems rea-sonable to us is likely to be confirmed byexperience or we could not live in the worldat all" (Knight, 1921, p. 227). But the pres-ent study and a growing body of other re-search (e.g., Kunreuther et al, 1978; Slo-vic, Kunreuther, & White, 1974; Kates,Note 1) indicate that in the evaluation ofrisks and hazards, Knight's optimistic as-sessment of human capabilities is wrong.People do not have accurate knowledge ofthe risks they face. As our society putsmore and more effort into the regulationand control of these risks (banning cycla-mates in food, lowering highway speedlimits, paying for emergency coronary-careequipment, etc.), it becomes increasingly
important that these biases be recognizedand, if possible, corrected. Improved pub-lic education is needed before we can expectthe citizenry to make reasonable public-policy decisions about societal risks (Slovic,Fischhoff, & Lichtenstein, 1976; Slovic etal., 1974). And the experts who guide andinfluence these policies should be aware thatwhen they rely on their own experience,memory, and common sense, they, too, maybe susceptible to bias.
We have, by necessity, studied sources ofjudgmental error in situations for which goodestimates of true frequency exist. But our so-ciety must often make judgments about haz-ardous activities for which adequate statisticaldata is lacking, such as recombinant DNA re-search or nuclear waste disposal. We suspectthat the biases found here (overestimation ofrare events, underestimation of likely events,and an undue influence of drama or vivid-ness) may be operating, indeed, may evenbe amplified, in such situations.
Reference Notes
1. Kates, R. W. Hasard and choice perceptions inflood plain management (Research Paper No.78). Chicago: University of Chicago, Depart-ment of Geography, 1962.
2. Bergstrorn, T. C. Preference and choice inmatters of life and death. In J. Hirshleifer, T.Bergstrorn, & E. Rappoport, Applying cost-benefit concepts to projects which alter humanmortality. (Rep. UCLA-ENG 7478). Los An-geles : University of California, School of En-gineering and Applied Science, 1974.
3. Bar-Hillel, M. The base-rate fallacy in proba-bility judgments (Rep. 77-4). Eugene, Oreg.:Decision Research, 1977.
4. Combs, B., & Slovic, P. Causes of death: Biasednewspaper coverage and biased judgments. Un-published manuscript, 1978. (Available fromDecision Research, 1201 Oak St., Eugene, Ore-gon 97401.)
5. Zebroski, E. L. Attainment of balance in risk-benefit perceptions. In D. Okrent (Ed.), Risk-benefit methodolgy and application: Some pa-pers presented at the Engineering FoundationWorkshop, Asilomar, Calif. (Rep. UCLA-ENG 7598). Los Angeles: University of Cali-fornia, School of Engineering and Applied Sci-ence, 1974.
6. Mandler, G. Memory research reconsidered: Acritical review of traditional methods and dis-tinctions (Rep. No. 64). San Diego: University

578 LIECHTENSTEIN ET AL.
of California, Center for Human InformationProcessing, 1976.
References
Arlen, M. J. The cold, bright charms of immor-tality. The New Yorker, January 27, 197S, pp.73-78.
Armstrong, J. S., Denniston, W. B., & Gordon,M. M. The use of the decomposition principle inmaking judgments. Organisational Behavior andHuman Performance, 1975, 14, 257-263.
Attneave, F. Psychological probability as a func-tion of experienced frequency. Journal of Ex-perimental Psychology, 1953, 46, 81-86.
Bach, R. Nothing by chance. The American Way,1973, 6, 32-38.
Beyth-Marom, R., & Fischhoff, B. Direct mea-sures of availability and frequency judgments.Bulletin of the Psychonomic Society, 1977, 9,236-238.
Burton, I., Kates, R. W., & White, G. F. Theenvironment as hazard. New York: OxfordUniversity Press, 1978.
Carroll, J. B. Measurement properties of subjec-tive magnitude estimates of word frequency.Journal of Verbal Learning and Verbal Be-havior, 1971, 10, 722-729.
Cohen, B. H. Some-or-none characteristics of cod-ing behavior. Journal of Verbal Learning andVerbal Behavior, 1966, 5, 182-187.
Coombs, C. H., Dawes, R. M., & Tversky, A.Mathematical psychology: An elementary intro-duction. Englewood Cliffs, NJ.: Prentice-Hall,1970.
Estes, W. K. The cognitive side of probabilitylearning. Psychological Review, 1976, 83, 37-64.
Fischhoff, B. Perceived informativeness of facts.Journal of Experimental Psychology: HumanPerception and Performance, 1977, 3, 349-358.
Ghatala, E. S., & Levin, J. R. Phenomenal back-ground frequency and the concreteness/imageryeffect in verbal discrimination learning. Memory& Cognition, 1976, 4, 302-306.
Hintzman, D. L. Apparent frequency as a functionof frequency and the spacing of repetitions.Journal of Experimental Psychology, 1969, 80,139-145.
Hintzman, D. L. Repetition and memory. In G. H.Bower (Ed.), The psychology of learning andmotivation: Advances in research and theory.New York: Academic Press, 1976.
Hintzman, D. L. The psychology of learning andmemory. San Francisco: Freeman, 1977.
Howell, W. C. Representation of frequency inmemory. Psychological Bulletin, 1973, 80, 44-53.
Kates, R. W. Risk assessment of environmentalhazard. Chichester, England: Wiley, 1978.
Knight, F. H. Risk, uncertainty, and profit. NewYork: Houghton-Mifflin, 1921.
Kucera, H., & Francis, W. N. Computationalanalysis of present-day American English. Prov-idence. R.I.: Brown University Press, 1967.
Kunreuther, H., Ginsberg, R., Miller, L., Sagi, P.,Slovic, P., Borkin, B., & Katz, N. Disaster in-surance protection: Public policy lessons. NewYork: Wiley, 1978.
Lichtenstein, S., & Slovic, P. Reversals of prefer-ence between bids and choices in gambling de-cisions. Journal of Experimental Psychology,1971, 89, 46-55.
Peterson, C. R., & Beach, L. R. Man as an in-tuitive statistician. Psychological Bulletin, 1967,68, 29-46.
Postman, L. Short-term memory and incidentallearning. In A. W. Melton (Ed.), Categories ofhuman learning. New York: Academic Press,1964.
Poulton, E. C. The new psychophysics: Six mod-els for magnitude estimation. PsychologicalBulletin, 1968, 69, 1-19.
Poulton, E. C. Unwanted range effects from usingwithin-subject experimental designs. Psycho-logical Bulletin, 1973, 80, 113-121.
Rowe, E. J., & Rose, R. J. Effects of orientingtask, spacing of repetitions, and list context onjudgments of frequency. Memory & Cognition,1977, 5, 505-512.
Selvidge, J. Assigning probabilities to rare events.Unpublished doctoral dissertation, Harvard Uni-versity, 1972.
Slovic, P., Fischhoff, B., & Lichtenstein, S. Cog-nitive processes and societal risk taking. In J. S.Carroll & J. W. Payne (Eds.), Cognition andsocial behavior. Hillsdale, NJ.: Erlbaum, 1976.
Slovic, P., Kunreuther, H., & White, G. Deci-sion processes, rationality and adjustment tonatural hazards. In G. F. White (Ed.), Naturalhazards: Local, national and global. New York:Oxford University Press, 1974.
Teigen, K. H. Number and percentage estimatesin sequential tasks. Perceptual and Motor Skills,1973, 36, 1035-1038.
Thorndike, E. L., & Lorge, I. The teacher's wordbook of 30,000 words. New York: ColumbiaUniversity, Teachers College, Bureau of Publi-cations, 1944.
Tversky, A., & Kahneman, D. Availability: Aheuristic for judging frequency and probability.Cognitive Psychology, 1973, 5, 207-232.
Tversky, A., & Kahneman, D. Judgment under un-certainty: Heuristics and biases. Science, 1974,185, 1124-1131.
Underwood, B. J. Attributes of memory. Psycho-logical Review, 1969, 76, 559-573.
U.S. Bureau of the Census, Census of population:1970. Occupation by industry. Final ReportPC(2)-7C. Washington, D.C.: U.S. GovernmentPrinting Office, 1972.
White, G. F. (Ed.). Natural hazards: Local, na-tional and global. New York: Oxford Univer-sity Press, 1974.
Received January 17, 1978Revision received June 23, 1978 •