Journal of Constructional Steel Research - ترجمه...
12
A buckling model for the stability design of steel columns with intermediate gravity loads Lip H. Teh a, ⁎, Benoit P. Gilbert b a School of Civil, Mining & Environmental Engineering, University of Wollongong, Australia b Griffith School of Engineering, Griffith University, Australia abstract article info Article history: Received 10 June 2015 Received in revised form 25 October 2015 Accepted 26 October 2015 Available online 6 November 2015 Keywords: Buckling model Column design Drive-in rack Effective length Notional load Stability design This paper points out an accurate buckling model for determining the flexural effective length of a steel column subjected to intermediate gravity loads, for applications in the 2D second-order elastic analysis based design procedure. The proposed buckling model has “notional” horizontal restraints where equivalent horizontal forces have been applied, and can be readily programmed into a structural analysis/design software. Thirty columns having various end restraints and subjected to concentrated gravity loads within their unsupported lengths are analysed to demonstrate the merits of the proposed buckling model. It is shown that, in most of the cases analysed, the proposed buckling model leads to more liberal column capacities compared to the use of the unity effective length factor or the buckling model described in the European drive-in rack design code. The more liberal capacities are very close to the ultimate loads determined through second-order plastic-zone analysis. Crown Copyright © 2015 Published by Elsevier Ltd. All rights reserved. 1. Introduction This paper is concerned with the stability design of steel columns subjected to intermediate gravity loads within their unsupported lengths, based on 2D second-order elastic analysis where the columns are assumed to have an initial out-of-plumb. Columns with intermedi- ate gravity loads include mill building columns and drive-in rack uprights, shown in Figs. 1 and 2, respectively. A three-dimensional view of an unloaded drive-in rack is shown in Fig. 3. In steel storage rack design standards [1–4], the use of equivalent horizontal forces in lieu of explicit modelling of initial out-of-plumb (and connector loose- ness) is a well-accepted practice. The equivalent horizontal forces are simply the product of the applied gravity loads and the prescribed initial out-of-plumb, as illustrated in Fig. 4, which is adopted from the European adjustable pallet racking code [1]. The concept of equivalent horizontal forces is predated by the notional load approach found in the literature [5–7], which aims to capture the initial out-of-plumb (P–Δ), initial crookedness (P–δ) and residual stress effects on the member forces at the ultimate limit state via the application of notional horizontal loads in a second-order analy- sis. However, the equivalent horizontal forces in the storage rack design standards correspond more closely to the notional horizontal loads specified in the current structural steel design standards [8–9], which principally model the frame's initial out-of-plumb only, although Section 3.3.2.1 of the Australian storage racking standard [4] attempts to account for inelasticity via a minimum value of the initial out-of- plumb that is greater for the second-order elastic analysis than for the second-order inelastic analysis. The notional load approach has been promoted as a method that enables the use of the “actual unsupported length” of a column in its sta- bility design check. With regard to regular rectangular frames, extensive discussions regarding effective lengths and the notional load approach can be found in the literature [10–16]. Surovek and White [13] proposed the “modified elastic approach”, which forms the basis of the highly successful “Direct Analysis Method” described in the current AISC Spec- ification for Structural Steel Buildings [9]. They stated that the LRFD- based notional load approach [7] had a limitation in that the moments produced by the notional horizontal loads are distributed through the system based on the elastic stiffness, causing the lateral load resisting part that has the largest elastic stiffness to receive a higher portion of the notional load effects regardless of the level of the axial load and subsequent inelasticity of individual beam-columns. However, this observation does not apply to certain structures such as the drive-in rack shown in Fig. 2. First, in general the stiffness is quite uniform throughout the drive-in rack system since the uprights are of the same size. Furthermore, the uprights within a down-aisle plane of bending generally carry the same design load. Second, in most cases the main lateral load resisting system is the spine bracing located in one down-aisle plane (most often at the back) that functions in conjunction with the plan bracing Journal of Constructional Steel Research 117 (2016) 243–254 ⁎ Corresponding author at: School of Civil, Mining & Environmental Engineering, University of Wollongong, Wollongong, NSW 2522, Australia. E-mail address: [email protected] (L.H. Teh). http://dx.doi.org/10.1016/j.jcsr.2015.10.019 0143-974X/Crown Copyright © 2015 Published by Elsevier Ltd. All rights reserved. Contents lists available at ScienceDirect Journal of Constructional Steel Research
Transcript of Journal of Constructional Steel Research - ترجمه...

Journal of Constructional Steel Research 117 (2016) 243–254
Contents lists available at ScienceDirect
Journal of Constructional Steel Research
A buckling model for the stability design of steel columns withintermediate gravity loads
Lip H. Teh a,⁎, Benoit P. Gilbert ba School of Civil, Mining & Environmental Engineering, University of Wollongong, Australiab Griffith School of Engineering, Griffith University, Australia
⁎ Corresponding author at: School of Civil, Mining &University of Wollongong, Wollongong, NSW 2522, Austr
E-mail address: [email protected] (L.H. Teh).
http://dx.doi.org/10.1016/j.jcsr.2015.10.0190143-974X/Crown Copyright © 2015 Published by Elsevie
a b s t r a c t
a r t i c l e i n f oArticle history:Received 10 June 2015Received in revised form 25 October 2015Accepted 26 October 2015Available online 6 November 2015
Keywords:Buckling modelColumn designDrive-in rackEffective lengthNotional loadStability design
This paper points out an accurate buckling model for determining the flexural effective length of a steel columnsubjected to intermediate gravity loads, for applications in the 2D second-order elastic analysis based designprocedure. The proposed bucklingmodel has “notional” horizontal restraints where equivalent horizontal forceshave been applied, and can be readily programmed into a structural analysis/design software. Thirty columnshaving various end restraints and subjected to concentrated gravity loads within their unsupported lengths areanalysed to demonstrate the merits of the proposed buckling model. It is shown that, in most of the casesanalysed, the proposed buckling model leads to more liberal column capacities compared to the use of theunity effective length factor or the buckling model described in the European drive-in rack design code. Themore liberal capacities are very close to the ultimate loads determined through second-order plastic-zoneanalysis.
Crown Copyright © 2015 Published by Elsevier Ltd. All rights reserved.
1. Introduction
This paper is concerned with the stability design of steel columnssubjected to intermediate gravity loads within their unsupportedlengths, based on 2D second-order elastic analysis where the columnsare assumed to have an initial out-of-plumb. Columns with intermedi-ate gravity loads include mill building columns and drive-in rackuprights, shown in Figs. 1 and 2, respectively. A three-dimensionalview of an unloaded drive-in rack is shown in Fig. 3. In steel storagerack design standards [1–4], the use of equivalent horizontal forces inlieu of explicit modelling of initial out-of-plumb (and connector loose-ness) is a well-accepted practice. The equivalent horizontal forces aresimply the product of the applied gravity loads and the prescribed initialout-of-plumb, as illustrated in Fig. 4, which is adopted from theEuropean adjustable pallet racking code [1].
The concept of equivalent horizontal forces is predated by thenotional load approach found in the literature [5–7], which aims tocapture the initial out-of-plumb (P–Δ), initial crookedness (P–δ) andresidual stress effects on the member forces at the ultimate limit statevia the application of notional horizontal loads in a second-order analy-sis. However, the equivalent horizontal forces in the storage rack designstandards correspond more closely to the notional horizontal loadsspecified in the current structural steel design standards [8–9], which
Environmental Engineering,alia.
r Ltd. All rights reserved.
principally model the frame's initial out-of-plumb only, althoughSection 3.3.2.1 of the Australian storage racking standard [4] attemptsto account for inelasticity via a minimum value of the initial out-of-plumb that is greater for the second-order elastic analysis than for thesecond-order inelastic analysis.
The notional load approach has been promoted as a method thatenables the use of the “actual unsupported length” of a column in its sta-bility design check.With regard to regular rectangular frames, extensivediscussions regarding effective lengths and the notional load approachcan be found in the literature [10–16]. Surovek andWhite [13] proposedthe “modified elastic approach”, which forms the basis of the highlysuccessful “Direct Analysis Method” described in the current AISC Spec-ification for Structural Steel Buildings [9]. They stated that the LRFD-based notional load approach [7] had a limitation in that the momentsproduced by the notional horizontal loads are distributed through thesystem based on the elastic stiffness, causing the lateral load resistingpart that has the largest elastic stiffness to receive a higher portion ofthe notional load effects regardless of the level of the axial load andsubsequent inelasticity of individual beam-columns. However, thisobservation does not apply to certain structures such as the drive-inrack shown in Fig. 2.
First, in general the stiffness is quite uniform throughout the drive-inrack system since the uprights are of the same size. Furthermore, theuprights within a down-aisle plane of bending generally carry thesame design load. Second, in most cases the main lateral load resistingsystem is the spine bracing located in one down-aisle plane (mostoften at the back) that functions in conjunction with the plan bracing
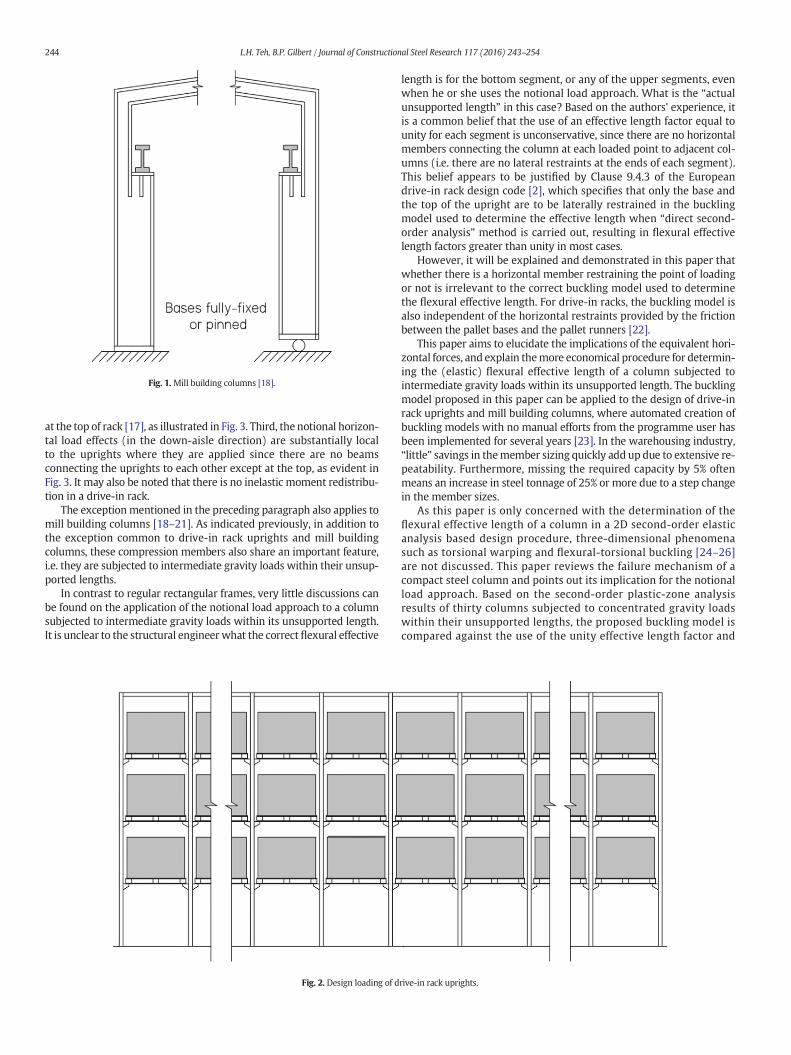
Fig. 1. Mill building columns [18].
244 L.H. Teh, B.P. Gilbert / Journal of Constructional Steel Research 117 (2016) 243–254
at the top of rack [17], as illustrated in Fig. 3. Third, the notional horizon-tal load effects (in the down-aisle direction) are substantially localto the uprights where they are applied since there are no beamsconnecting the uprights to each other except at the top, as evident inFig. 3. It may also be noted that there is no inelastic moment redistribu-tion in a drive-in rack.
The exception mentioned in the preceding paragraph also applies tomill building columns [18–21]. As indicated previously, in addition tothe exception common to drive-in rack uprights and mill buildingcolumns, these compression members also share an important feature,i.e. they are subjected to intermediate gravity loads within their unsup-ported lengths.
In contrast to regular rectangular frames, very little discussions canbe found on the application of the notional load approach to a columnsubjected to intermediate gravity loads within its unsupported length.It is unclear to the structural engineer what the correct flexural effective
Fig. 2. Design loading of d
length is for the bottom segment, or any of the upper segments, evenwhen he or she uses the notional load approach. What is the “actualunsupported length” in this case? Based on the authors' experience, itis a common belief that the use of an effective length factor equal tounity for each segment is unconservative, since there are no horizontalmembers connecting the column at each loaded point to adjacent col-umns (i.e. there are no lateral restraints at the ends of each segment).This belief appears to be justified by Clause 9.4.3 of the Europeandrive-in rack design code [2], which specifies that only the base andthe top of the upright are to be laterally restrained in the bucklingmodel used to determine the effective length when “direct second-order analysis” method is carried out, resulting in flexural effectivelength factors greater than unity in most cases.
However, it will be explained and demonstrated in this paper thatwhether there is a horizontal member restraining the point of loadingor not is irrelevant to the correct buckling model used to determinethe flexural effective length. For drive-in racks, the buckling model isalso independent of the horizontal restraints provided by the frictionbetween the pallet bases and the pallet runners [22].
This paper aims to elucidate the implications of the equivalent hori-zontal forces, and explain themore economical procedure for determin-ing the (elastic) flexural effective length of a column subjected tointermediate gravity loads within its unsupported length. The bucklingmodel proposed in this paper can be applied to the design of drive-inrack uprights and mill building columns, where automated creation ofbuckling models with no manual efforts from the programme user hasbeen implemented for several years [23]. In the warehousing industry,“little” savings in themember sizing quickly add up due to extensive re-peatability. Furthermore, missing the required capacity by 5% oftenmeans an increase in steel tonnage of 25% or more due to a step changein the member sizes.
As this paper is only concerned with the determination of theflexural effective length of a column in a 2D second-order elasticanalysis based design procedure, three-dimensional phenomenasuch as torsional warping and flexural-torsional buckling [24–26]are not discussed. This paper reviews the failure mechanism of acompact steel column and points out its implication for the notionalload approach. Based on the second-order plastic-zone analysisresults of thirty columns subjected to concentrated gravity loadswithin their unsupported lengths, the proposed buckling model iscompared against the use of the unity effective length factor and
rive-in rack uprights.

Fig. 3. Three-dimensional view of a drive-in rack.
245L.H. Teh, B.P. Gilbert / Journal of Constructional Steel Research 117 (2016) 243–254
the buckling model prescribed in Clause 9.4.3 of the European drive-in rack design code [2].
2. How a (compact) steel column reaches its ultimate load capacity
The failure mechanism of a steel column may appear to be a simpletopic, but its fundamental has sometimes eluded practitioners andresearchers in the field. A steel column, no matter how slender it is,does not reach its ultimate load-carrying capacity when it buckles elas-tically, but after the critical cross-section has yielded sufficiently undercombined compression and bending. Fig. 5, adapted from Gere andTimoshenko [27], shows that a column that has buckled elastically isable to sustain increased loading beyond the elastic buckling load Pe.
Curve A in the figure denotes the load-deflection path of an elastic,geometrically perfect column following its bifurcation. Curve B denotesthat of an elastic, initially crooked column. The softening responseexhibited by this curve is due to the P–δ effect. In each of the twocases, as long as the column remains elastic, it can always sustain in-creased loading since the column's resistance increases with increasingdeformations to the extent that it equilibrates the applied load.
However, in reality, a (compact) steel column that buckles elasticallywould soon reach its ultimate load-carrying capacity as it encountersmember instability due to (partial) yielding of the critical cross-section under combined compression and bending. For a simplysupported column such as that shown in Fig. 5(a), the bendingmomentat mid-span (the critical cross-section) results from the so-called P–δ
Fig. 4. Equivalent horizontal forces [1].
effect. At the ultimate limit state, any further increase in the bendingresistance of the mid-span due to increasing deformation could onlymatch the increase in the P–δ effect if the applied load P decreases(while the displacement δ increases disproportionately).
As an aside, the failure mechanism described in the preceding para-graph is sometimes simplified into the formation of a plastic hinge at thecritical cross-section [5], or into a cross-section failure (which may bedue to local or distortional buckling), which is implicit in Clause 9.4.2of FEM 10.2.07 [2]. According to this clause, only the cross-sectionstrength check is required if the second-order elastic analysis accountsfor the member's initial crookedness in addition to the initial out-of-plumb. Such a procedure may be justified if the member is stocky orbent in substantial double curvature as the cross-section strengthgoverns the design in these cases. It is optimistic otherwise since itignores the member instability described in the preceding paragraphunless the notional load or initial imperfection is calibrated [5].
Real steel columns are invariably subject to initial crookedness, so asteel column typically follows the path denoted by Curve C in Fig. 5(b).
Fig. 5. Behaviour and strength of a compact steel column [27].

Fig. 6. Two equivalent columns.
246 L.H. Teh, B.P. Gilbert / Journal of Constructional Steel Research 117 (2016) 243–254
In any case, the ultimate load capacity of a column of a given section de-pends largely on its effective length Le, while the variation in themagni-tudes of the initial crookedness δ0 typically encountered in practise hasrelatively insignificant effects on the ultimate capacity, as demonstratedby Teh and Clarke [28] for a square hollow section. The cantilevered andsimply supported columns in Fig. 6 have essentially the same ultimateload if they are composed of the same section. Based on this premise,column curves are used in steel structures design standards [8–9,29],where these curves may be represented by mathematical functions.The member compression capacity of an initially crooked column is de-termined from its effective length and the relevant column curve,whichis typically derived for the simply supported condition (for which theeffective length factor is unity).
Fig. 7. Diagrams of a cantilevered co
3. Implication of the notional horizontal load
As illustrated in Fig. 4, the equivalent horizontal forces prescribed insteel design standards [1–3,8–9]model the frame's initial out-of-plumb.It has also been established by Clarke and Bridge [6] that the bendingmoments in the columns resulting from the application of the equiva-lent horizontal forces are virtually equal to those due to the initial out-of-plumb.
As indicated in the preceding section, the ultimate load Pu of an axi-ally loaded cantilevered column such as that shown in Fig. 6(a) can bedetermined directly from the relevant column curve and its effectivelength, which is twice its actual length, i.e. Pu = Pc(Le = 2L2). Viewedas an equivalent simply supported column having a length twice its
lumn at the ultimate limit state.

Fig. 9. Column curve of SHS 203 × 6.3 (without residual stresses and strain hardening).
247L.H. Teh, B.P. Gilbert / Journal of Constructional Steel Research 117 (2016) 243–254
actual length, shown in Fig. 6(b), no interaction equation between axialforce and bending moment needs to be considered in determining itsultimate load capacity.
The free body, axial force and bending moment diagrams of thecantilevered column at the ultimate limit state, the latter two drawnfor the assumed straight configuration, are shown in Fig. 7. The bendingmoment Mu at the column base, which is due to the P–Δ effect, canbe “reasonably” found through a second-order elastic analysis wherethe initial out-of-plumb Δ0 of the cantilevered column is modelled,either explicitly or via an equivalent horizontal force. Viewed in thismanner, it is clear that the column fails by the interaction between theaxial force and the bendingmoment, and its capacity can be determinedusing the appropriate interaction equation. For bi-symmetric I-sections,and rectangular and square hollow sections that are compact, AS 4100[8] specifies the following interaction equation where the ultimatemomentMu is given as
Mu ¼ Ms 1−1þ βm
2
� �3" #
1−Pu
Pc0
� �þ 1:18
1þ βm
2
� �3ffiffiffiffiffiffiffiffiffiffiffiffiffiffiffiffiffiffiffiffiffi1−
Pu
Pc0
� �s( )
ð1Þ
in which Ms. is the section moment capacity, and βm is the ratio ofthe smaller to the larger end moment, taken as positive when the col-umn is bent in double curvature. The compression capacity Pc′ isdiscussed in the next paragraph. The capacity factor ϕ given in the de-sign standard [8] has been omitted from Eq. (1). Interested readersmay consult references [30–31] for the derivation and application ofthe design equation.
It is obvious that, for the cantilevered column, the compressioncapacity Pc′ in Eq. (1) must be greater than the ultimate load Pu =Pc(Le = 2L2). In fact, the structural steel design standards [8–9] specifythat the compression capacity Pc′ to be used in the interaction equationis equal to Pc(Le= L2), i.e. the effective length factor is unitywhether themember is braced or unbraced at both ends.
The exposition in the preceding paragraph should resolve the doubtamong drive-in rack designers whether an effective length factor ofunity can be safely applied to, say, the bottom segment of an uprightwhen equivalent horizontal forces are included in the second-orderanalysis. In fact, as will be demonstrated later in this paper, the use of
Fig. 8. Problem 4.1.
an effective length factor equal to unity in the interaction equation canbe quite conservative in certain cases. The more correct procedure fordetermining the flexural effective length of a column segment is toapply a “notional” horizontal restraint where an equivalent horizontalforce has been applied, in the buckling model. Fig. 8(b) depicts thebuckling model for the cantilevered column, which would result in aneffective length factor close to 0.7 (equal to 0.699 in three significantfigures).
The notional horizontal restraint should be imposed onto the buck-ling model since the interaction equation is used to check the second-order bending moment resulting from the P-Δ effect. In other words,the destabilising effect due to the absence of a lateral restraint hasbeen represented in the second-order analysis, and should not be dupli-cated in the bucklingmodel to determine the effective length and there-fore Pc′ in Eq. (1). However, the implication of amplifying the bendingmoments due to the initial out-of-plumb (or equivalent horizontalforces) is lesswell appreciated in the literature, as reflected in the buck-ling model prescribed or allowed by certain standards [2,8].
As far as computer analysis programmes such as RAD [23] are con-cerned, a notional horizontal restraint can be automatically imposedonto the buckling model at any node where an equivalent horizontalforce has been applied in the second-order elastic analysis.
In addition to the member stability check represented by Eq. (1), AS4100 [8] requires that the member is checked against cross-sectionstrength, which, for a compact rectangular or square hollow section, isrepresented by
Mu ¼ 1:18Ms 1−Pu
Py
� �ð2Þ
in which Py is the squash load. However, as mentioned earlier, thecross-section strength check only governs stocky columns and thosebent in substantial double curvature. The capacity factor ϕ is omittedfrom the equation.
Table 1Results for cantilevered columns with ξ = 0.002.
Case L (mm) Pua (kN) Method A(Le = L)
Method B(Le = 0.7L)
Pc′ (kN) Pua/Pud Pc′ (kN) Pua/Pud
4.1.1 3000 1289 1802 0.94 1841 0.944.1.2 6000 394 1323 0.98 1689 0.984.1.3 9000 180 684 0.99 1238 0.99

Fig. 10. Elastic and inelastic load-deflection graphs of cantilevered columns.
248 L.H. Teh, B.P. Gilbert / Journal of Constructional Steel Research 117 (2016) 243–254
4. Demonstration problems
All the columns analysed in this paper are composed of square hol-low section (SHS) 203 × 6.3. This sectionwas selected for three reasons.First, the issues of local, distortional, minor/major axis and flexural-torsional buckling are irrelevant to the square hollow section, ensuringproper evaluations of the alternative methods used to determine theflexural effective length. Second, an interaction equation that accountsfor the bending moment gradient, namely Eq. (1), is available for asquare hollow section, enabling a more rigorous comparison of the
Table 2Results for cantilevered columns with ξ = 0.004 in the elastic analysis.
L (mm) Pua (kN) Method A (Le = L) Method B (Le = 0.7L)
Pc′ (kN) Pua/Pud Pc′ (kN) Pua/Pud
3000 1289 1802 1.05 1841 1.046000 394 1323 1.02 1689 1.019000 180 684 1.01 1238 1.01
Fig. 11. Problem 4.2.
various buckling models considered in this paper. Third, simplysupported columns of various lengths composed of this section hadbeen tested and analysed by Key and Hancock [32], who provided thefinite strip analysis results including that neglecting residual stresses.The finite element models used in the present plastic-zone analyses[33] could therefore be verified and employed with confidence.
The square hollow section has an area of 4818 mm2 and a secondmoment of area equal to 3.06 × 107 mm4. The slenderness ratios L/r inthe following problems range from 37 to 113.
For the purpose of this paper, the square hollow section was as-sumed to have a uniform yield stress of 395 MPa, which is the same asthe flange yield stress in the analytical model of Key and Hancock[32]. No residual stresses nor strain hardening was assumed. Thedemonstration column models had an initial out-of-plumb ξ = 0.002in both the second-order plastic and elastic analyses unless noted other-wise. However, no initial crookedness was modelled in the second-order elastic analyses as per the standard practice, while an initialcrookedness δ0 of L/1000 was invariably modelled in the plastic-zoneanalyses, the direct results of which are taken to be the correct ones.
In the following discussion, Method A refers to the use of the unityeffective length factor to determine the compression capacity Pc′ thatis entered into Eq. (1), and Method B refers to the use of the presentbuckling model, in which notional horizontal restraints are imposedwhere the equivalent horizontal forces have been applied. The effectivelength factors in Method B are therefore invariably smaller than inMethod A, often significantly so.
The third method, called Method C, uses the buckling modeldescribed in Clause 9.4.3 of FEM 10.2.07 [2]. The buckling model isonly relevant to the columns subjected to intermediate gravity loads
Table 3Results for columns with fixed bases and elastic restraints at the loading point.
Case L (mm) Kt′ Kr′ Pua (kN) Method A(Le = L)
Method B(Fig. 11b)
Pc′ (kN) Pua/Pud Pc′ (kN) Pua/Pud
4.2.1 5000 1 1 1633 1560 1.06 1807 0.97 (0.93)4.2.2 3 1 1777 1.14 0.994.2.3 3 3 1778 1.14 1817 0.984.2.4 7500 1 1 1022 949 1.12 1680 1.01 (0.99)4.2.5 3 1 1384 1.46 0.95 (0.93)4.2.6 3 3 1438 1.52 1720 0.95 (0.91)
Note: If the cross-section strength governs, the professional factor resulting from Eq. (1) isgiven in brackets.

Fig. 12. Elastic and inelastic load-deflection graphs of 7500-mm columns.
Table 4Results for propped columns with elastic rotational restraints.
Case L (mm) Kt′ Kr′ Pua (kN) Method A(Le = L)
Method B(Fig. 11b)
Pc′ (kN) Pua/Pud Pc′ (kN) Pua/Pud
4.2.7 5000 ∞ 0 1775 1560 1.14 1764 1.014.2.8 3 1835 1.18 1817 1.014.2.9 7500 0 1532 949 1.61 1498 1.024.2.10 3 1741 1.83 1720 1.01
249L.H. Teh, B.P. Gilbert / Journal of Constructional Steel Research 117 (2016) 243–254
within its unsupported length, and is shown in the following sub-sections where applicable.
Having determined the effective length of a column or columnsegment, the compression capacity Pc′ to be entered into Eq. (1) isread from the column curve shown in Fig. 9. This curve has been derivedthrough a series of plastic-zone analyses of simply supported columnshaving lengths ranging from 100 mm to 18,000 mm. Each of thesecolumns was assumed to have an initial crookedness δ0 of L/1000.
Fig. 13. Prob
4.1. Cantilevered columns axially loaded at the top
This simple structure, depicted in Fig. 8(a), is included in this paperto demonstrate that Eq. (1) is not unduly conservative. This aspect isimportant since, in the following subsections, it will be asserted thatthe use of an effective length factor equal to unity (Method A), andthe buckling model described in Clause 9.4.3 of FEM 10.2.07 [2] that isused in Method C, lead to significant conservatism in the design ofcertain columns.
The buckling model used to determine the effective lengths in thepresent method (Method B) is depicted in Fig. 8(b), which results inan effective length factor equal to 0.7.
Table 1 lists the professional factors Pua/Pud of Methods A and B for3000, 6000 and 9000 mm long columns. The variable Pua denotes theultimate load obtained by the second-order plastic-zone analysis, andPud is the ultimate load capacity determined through second-order elas-tic analysis in conjunction with Eqs. (1) and (2), which depends on theeffective length used to read Pc΄ from the column curve.
It can be seen from Table 1 that, for a cantilevered column axiallyloaded at the top, significant differences in the assumed effective length
lem 4.3.

Table 5Results for columns with one intermediate gravity load.
Case Kr′bot Kt′top Kr′top Pua(kN)
Method A Method B Method C
Pc′(kN)
Pua/Pud Pc′(kN)
Pua/Pud Pc′(kN)
Pua/Pud
4.3.1 0 ∞ 0 1203 1324 1.07 1600 1.02 1098 1.184.3.2 1 ∞ 1 1765 1.33 1721 1.03 1624 1.09
Table 6Additional results for columns with one intermediate gravity load.
Case Kr′bot Kt′top Kr′top Pua(kN)
Method A Method B Method C
Pc′(kN)
Pua/Pud Pc′(kN)
Pua/Pud Pc′(kN)
Pua/Pud
4.3.3 3 ∞ 3 1806 1324 1.36 1756 1.03 1706 1.064.3.4 1 1 1 771 1.02 1645 1.02 1626 1.024.3.5 1 3 1 1182 1.04 1653 1.02 1626 1.024.3.6 ∞ 3 ∞ 1368 1.10 1743 1.01 1743 1.01
Table 7Results for columns with two equally spaced gravity loads.
Case Kr′bot Kt′top Kr′top Pua(kN)
Method A Method B Method C
Pc′(kN)
Pua/Pud Pc′(kN)
Pua/Pud Pc′(kN)
Pua/Pud
4.4.1 1 1 1 400 1560 1.05 1716 1.05 996 1.054.4.2 ∞ 0 ∞ 484 1.03 1773 1.03 1389 1.034.4.3 1 ∞ 1 1092 1.00 1727 1.00 996 1.15
Table 8Additional results for columns with two equally spaced gravity loads.
Case Kr′bot Kt′top Kr′top Pua(kN)
Method A Method B Method C
Pc′(kN)
Pua/Pud Pc′(kN)
Pua/Pud Pc′(kN)
Pua/Pud
4.4.4 ∞ 3 ∞ 778 1560 1.04 1774 1.04 1389 1.054.4.5 3 ∞ 3 1396 1.01 1757 0.99 1234 1.15
250 L.H. Teh, B.P. Gilbert / Journal of Constructional Steel Research 117 (2016) 243–254
factors do not lead to noticeably different ultimate load capacities Pud.For the 3000-mm column, the compression capacity Pc′ entered intoEq. (1) for the unity effective length factor is only 2% lower than thatfor the effective length factor of 0.7. For the other two columns, the rea-sons are twofold. First, a given percentage difference in the compressioncapacities Pc′ translate to a much smaller one in the available momentcapacities Mu given by Eq. (1). Second, in the proximity of the ultimateload Pu, the second-order bendingmoment increasesmuchmore rapid-ly than the applied load.
However, when eithermethod is used, the ultimate load capacity Puaof the 3000-mm column is overestimated by more than 5% (Case 4.1.1in Table 1). The reason is that the second-order bending momentat the ultimate limit state, which is the result of the P–Δ effect, isunderestimated by the second-order elastic analysis. The elastic dis-placement of the 3000-mm column is about 30% less than the inelasticdisplacement at the ultimate limit state, as evident in Fig. 10. For eachcase shown in Fig. 10, the elastic curve is somewhat stiffer than theinelastic one, which is plotted thicker, due to the neglect of initial
Fig. 14. Prob
crookedness in the former and, for Case 4.1.1, subsequent inelasticityin the latter.
According to AS/NZS 4084 [4], theminimum initial out-of-plumb ξ isequal to 0.004 when second-order elastic analysis is performed, and0.002 when second-order inelastic analysis is used. Table 2 shows theprofessional factors of both methods when ξ = 0.004 is used in thesecond-order elastic analysis.
The results shown in Tables 1 and 2 may appear to be inconsistentwith each other as the professional factors vary in the opposite wayswith respect to the column slenderness. However, Clarke and Bridge[6] have found that, for the second-order elastic analysis based designprocedure to exactly match the plastic-zone analysis results, the re-quired notional horizontal load increases with the column slenderness.There is therefore no inconsistency in the professional factors betweenTables 1 and 2.
In any case, Table 1 demonstrates that the use of Eqs. (1) and (2) inconjunction with an initial out-of-plumb ξ=0.002 in the second-orderelastic analysis does not lead to conservatism for the SHS columns
lem 4.4.

Fig. 15. Problem 4.5.
Table 9Results for columns with unequally spaced gravity loads.
Case Kr′bot Pua (kN) Method A Method B Method C
Pc′ (kN) Pua/Pud Pc′ (kN) Pua/Pud Pc′ (kN) Pua/Pud
4.5.1 0 630 949 0.99 1767 0.99 603 1.114.5.2 3 1394 1802 0.96 1781 0.96 1279 1.13
251L.H. Teh, B.P. Gilbert / Journal of Constructional Steel Research 117 (2016) 243–254
analysed in the presentwork. Thisfindingmeans that the two equationsare unlikely to be the source of any significant conservatism found in thefollowing examples.
4.2. Columns with fixed bases and elastic restraints at the loading point
The example depicted in Fig. 11(a) is interesting in that it demon-strates the conservatism of the unity effective length factor approach
Fig. 16. Prob
(Method A) in a certain case where the actual (elastic) effective lengthfactor of the column is 1.0. Method B uses the buckling model depictedin Fig. 11(b).
This example also illustrates the consequence of using the sameinitial out-of-plumb in the second-order plastic and elastic analyses,which does not vary monotonically with the column slenderness.Another feature of this example is that, except for Cases 4.2.2 and4.2.3 listed in Table 3, the cross-section strength represented byEq. (2) governs when the proposed method (Method B) is used todetermine the compression capacity Pc′ to be entered into Eq. (1).
The normalised translational spring stiffness Kt′ in Table 3 andsubsequent tables is defined as
Kt0 ¼ ktL
3
3EIð3Þ
in which E is the column's elastic modulus and I is its second mo-ment of area. Therefore, a value ofKt′=1.0 implies that the cantileveredcolumn is translationally restrained by another identical (unloaded)column that is connected at the top via a pin-ended link.
The normalised rotational spring stiffness Kr′ is defined as
Kr0 ¼ krL
6EIð4Þ
An empty cell in Table 3 means that it has the same value as theabove cell. This convention applies to all tables in this paper.
Table 3 shows that, even for Case 4.2.4, where the actual (elastic)effective length factor is equal to 1.0, the use of the unity effective lengthfactor leads to some conservatism. The conservatism quickly escalatesas the translational restraint increases. Note that the columns (ξ =0.002) sway rather significantly under axial compression alone, asevident from the load-deflection graphs plotted in Fig. 12.
It can be seen fromTable 3 that, even if the same initial out-of-plumbξ = 0.002 is used in both the second-order plastic and elastic analyses,the use of the proposed buckling model depicted in Fig. 11(b) inconjunction with Eqs. (1) and (2) does not lead to over-optimistic ca-pacities bymore than 5%. This outcome is despite the 27% underestima-tion of the tip displacement at the ultimate limit state (and therefore theP–Δ effect) of Case 4.2.5 by the second-order elastic analysis, as evidentin Fig. 12. For each case shown in Fig. 12, the elastic curve is noticeablystiffer than the inelastic one, which is plotted thicker.
Additional analysis results involving propped columns are shown inTable 4. It can be seen that Method A resulted in similar levels of
lem 4.6.

Table 10Results for columns subjected to a clockwise primary bending moment.
Case Kr′bot Kt′top Kr′top Pua(kN)
Method A Method B Method C
Pc′(kN)
Pua/Pud Pc′(kN)
Pua/Pud Pc′(kN)
Pua/Pud
4.6.1 0 ∞ 0 564 1324 1.02 1600 0.97 1098 1.094.6.2 1 ∞ 1 861 1.17 1721 1.04 1624 1.07
Table 11Results for columns subjected to a counter-clockwise primary bending moment.
Case Kr′bot Kt′top Kr′top Pua(kN)
Method A Method B Method C
Pc′(kN)
Pua/Pud Pc′(kN)
Pua/Pud Pc′(kN)
Pua/Pud
4.6.3 0 ∞ 0 575 1324 1.08 1600 1.02 1098 1.154.6.4 1 ∞ 1 874 1.22 1721 1.09 1624 1.11
252 L.H. Teh, B.P. Gilbert / Journal of Constructional Steel Research 117 (2016) 243–254
conservatism to those shown in Table 3. The proposedMethod B, on theother hand, is consistently accurate for the propped columns.
4.3. Columns with one intermediate gravity load
The example depicted in Fig. 13(a) has a loading arrangement thatmay be encountered in mill building columns, and shows cases whereMethods A and C are alternately overconservative while Method B,which uses the bucklingmodel depicted in Fig. 13(b), is consistently ac-curate. The bucklingmodel used byMethod C, described in Clause 9.4.3of FEM 10.2.07 [2], is shown in Fig. 13(c). The “actual unsupportedlength” in Method A is the loaded length Lb.
For the columns considered in Table 5, the second-order analysismodel shown in Fig. 13(a) coincides with the buckling model depictedin Fig. 13(c).
Table 5 shows that, for the pin-ended column (Case 4.3.1), the buck-ling model described in Clause 9.4.3 of FEM 10.2.07 [2] and used inMethod C leads to an underestimation of the ultimate load capacityby almost 20%. For the column with elastic rotational restraints (Case4.3.2), the use of the unity effective length factor underestimates samebymore than 30%. On the other hand, Method B is consistently accuratefor both columns.
Additional analysis results for columns each of which is subjected toa gravity load within its unsupported length are shown in Table 6.Method B is again consistently accurate for all columns.
Fig. 17. Professional fact
4.4. Columns with two equally spaced gravity loads
The example depicted in Fig. 14(a) has a loading arrangement thatmay be encountered in drive-in racks. The three methods of determin-ing the effective length are compared across three different restraintconditions at the bottom and the top. Method A invariably uses thelength of each segment, 5000 mm, as the effective length. Method Buses the buckling model depicted in Fig. 14(b), while Method C usesthat in Fig. 14(c).
Table 7 shows that, for the first two columns, the threemethods givethe same results despite the differences in the compression capacity Pc′determined from the column curve. However, for the largest capacitycolumn, Method C underestimates the ultimate load capacity by 15%.
Two additional analysis results for this example are shown inTable 8.
4.5. Columns with two unequally spaced gravity loads
The example depicted in Fig. 15(a) has two unequally spaced gravityloads, and is interesting in that Method A determines the middle seg-ment of the column without rotational restraint (Case 4.5.1 in Table 9)to be critical while Method B and C invariably determine the bottomsegment to be critical for both cases shown in Table 9. For Case 4.5.1,Method C determines the effective length factor of the bottom segmentto be 3.2. Method A uses each segment length as its effective length,Method B uses the buckling model depicted in Fig. 15(b), and MethodC uses that depicted in Fig. 15(a) minus the horizontal loads.
Although Methods A and B do not always determine the samesegment to be critical, they yield essentially the same results that areaccurate within 5%. On the other hand, Method C underestimates theultimate load capacities by more than 10%.
4.6. Columns subjected to primary bending moments
All the preceding examples involve columns that are loaded concen-trically, and are therefore subjected to secondary bending momentsonly due to the column's initial out-of-plumb and deflection (in addi-tion to axial compression). The example depicted in Fig. 16(a) is sub-jected to a primary bending moment due to a 200-mm eccentricity ofthe axial load P. Depending on the eccentricity direction, the primarybending moment may act clockwise or counter-clockwise.
The “actual unsupported length” inMethod A is the loaded length Lb.Method B uses the bucklingmodel shown in Fig. 16(b), while Method Cuses that shown in Fig. 16(c).
ors of all methods.

Fig. 18. Box charts of professional factors.
253L.H. Teh, B.P. Gilbert / Journal of Constructional Steel Research 117 (2016) 243–254
It can be seen from Tables 10 and 11 that, whether the primarybending moment acts in the clockwise or counter-clockwise direction,the proposed Method B is consistently accurate with errors less than10%. In contrast, Methods A and C lead to errors of 15% or more insome cases.
4.7. Summary of analysis results
The professional factors of the three methods for the columnsanalysed in the present work are plotted in Fig. 17. The plots of themethods which are applied to a particular case are aligned vertically.Note that Method C is not relevant to the first thirteen cases, and theresults in Table 2 obtained using an initial out-of-plumb ξ equal to0.004 in the second-order elastic analysis are not included. The statisti-cal performance of the three methods are described by the box chart inFig. 18. Their summary values are given in Table 12.
5. Conclusions
The notional load approach, in conjunction with second-orderelastic analysis, was conceived in order to allow the use of the “actualunsupported length” of a column in its stability design check. However,in structural engineering practice, it is unclear what the unsupportedlength is for a segment of a column with intermediate gravity loadswhere no lateral restraints exist. The European drive-in rack designcode prescribes a buckling model that mostly results in effective lengthfactors greater than unity. This paper points out that, in the context ofsecond-order elastic analysis based design procedure, not only theeffective length factor of a segment without lateral restraints at bothends needs not be greater than unity, it can even be significantly lessthan unity.
It is explained that, since the destabilising effect due to the absenceof a lateral restraint has been represented in the second-order analysisthat incorporates the notional horizontal load (or the equivalent hori-zontal force), a notional horizontal restraint should be imposed ontothe buckling model in determining the effective length to be used inthe interaction equation.
Table 12Mean professional factors.
Method Pua/Pud
Mean COV
A 1.15 0.12B 1.00 0.03C 1.09 0.05
Based on the results of plastic-zone analysis incorporating an initialout-of-plumb equal to 0.002, it was found that, while the actual (inelas-tic) effective length factor of a cantilevered column is 2.0, the use of thebraced effective length factor equal to 0.7 in conjunction with thesecond-order elastic analysis incorporating an initial out-of-plumbequal to 0.004 still led to a slightly conservative result. When an initialout-of-plumb equal to 0.002 was used in the elastic analysis, the bracedeffective length factor gave essentially the same results as the unityeffective length factor, which are close to the plastic-zone analysisresults.
It is demonstrated through thirty examples involving columnssubjected to concentrated gravity loads within their unsupportedlengths that the proposed buckling model can lead to designs that aremore economical than the use of the unity effective length factor orthe buckling model described in the European drive-in rack designcode. Automatically imposing notional horizontal restraints onto thebuckling model where equivalent horizontal forces have been appliedin the second-order analysis can be implemented in a computerprogramme without much difficulty, with potentially significantsavings in the total cost of the drive-in racking system or mill buildingcolumns.
Acknowledgement
The authors would like to thank the Australian Research Council forsupporting the second author through the Discovery Early CareerResearcher Award (Project ID: DE140100212).
References
[1] ECS, Steel Static Storage Systems — Adjustable Pallet Racking Systems, EN 15512,European Committee for Standardization, 2009.
[2] ERF, The Design of Drive-in and Drive-through Racking, FEM 10.2.07, EuropeanRacking Federation, 2012.
[3] RMI, Specification for the Design, Testing and Utilization of Industrial Steel StorageRacks, ANSI MH16.1–2012, Rack Manufacturers Institute, 2012.
[4] SA, Steel Storage Racking, AS 4084, Standards Australia, 2012.[5] J.Y. Liew, D.W. White, W.F. Chen, Notional-load plastic-hinge method for frame
design, J. Struct. Eng. 120 (1994) 1434–1453.[6] M.J. Clarke, R.Q. Bridge, The notional load approach for the design of frames,
Research Report No. R718, School of Civil and Mining Engineering, University ofSydney, 1995.
[7] ASCE, Effective Length and Notional Load Approaches for Assessing Frame Stability:Implications for American Steel Design, Technical Committee on Load and Resis-tance Factor Design, American Society of Civil Engineers, 1997.
[8] SA, Steel Structures, AS 4100-1998. Standards Australia, 1998.[9] AISC, Specification for Structural Steel Buildings, ANSI/AISC 360-10, American Insti-
tute of Steel Construction, 2010.[10] D.W. White, M.J. Clarke, Design of beam-columns in steel frames. 1. Philosophies
and procedures, J. Struct. Eng. 123 (12) (1997) 1556–1564.[11] D.W. White, M.J. Clarke, Design of beam-columns in steel frames. 2. Comparison of
standards, J. Struct. Eng. 123 (12) (1997) 1565–1575.[12] D.W.White, J.F. Hajjar, Accuracy and simplicity of alternative procedures for stability
design of steel frames, J. Constr. Steel Res. 42 (3) (1997) 209–261.[13] A.E. Surovek, D.W. White, Alternative approaches for elastic analysis and design of
steel frames. I: Overview, J Struct Eng 130 (8) (2004) 1186–1196.[14] A.E. Surovek, D.W. White, Alternative approaches for elastic analysis and design of
steel frames II: verification studies, J Struct Eng 130 (8) (2004) 1197–1205.[15] G.S. Tong, G. Xing, A comparative study of alternative approaches for stability design
of steel frames, Adv. Struct. Eng. 10 (4) (2007) 455–466.[16] G.S. Tong, L. Zhang, G.R. Xiang, Inelastic storey-buckling factor of steel frames, J.
Constr. Steel Res. 65 (2009) 443–451.[17] B.P. Gilbert, K.J.R. Rasmussen, Drive-in steel storage racks I: stiffness tests and 3D
load-transfer mechanisms, J. Struct. Eng. 138 (2) (2012) 135–147.[18] D.J. Fraser, R.Q. Bridge, Buckling of stepped crane columns, J. Constr. Steel Res. 16 (1)
(1990) 23–38.[19] R.A. MacCrimmon, D.J. Laurie-Kennedy, Load and resistance factor design and
analysis of stepped crane columns in industrial buildings, Engl. J. 34 (4) (1997)26–37.
[20] J.A. Schmidt, Design of mill building columns using notional loads, Engl. J. 38 (2)(2001) 90–99.
[21] J. Vasquez, R. Riddell, A simple stepped-column buckling model and computer algo-rithm, Engl. J. 48 (1) (2011) 19–30.
[22] B.P. Gilbert, L.H. Teh, R.X. Badet, K.J.R. Rasmussen, Influence of pallets on the behav-iour and design of steel drive-in racks, J. Constr. Steel Res. 97 (2014) 10–23.
[23] Dematic Pty Ltd, Rack Analysis & Design (RAD) — User's Manual Version 6.9, 2009.

254 L.H. Teh, B.P. Gilbert / Journal of Constructional Steel Research 117 (2016) 243–254
[24] L.H. Teh, G.J. Hancock, M.J. Clarke, Analysis and design of double-sided high-risesteel pallet rack frames, J. Struct. Eng. 130 (7) (2004) 1011–1021.
[25] C. Bernuzzi, A. Pieri, V. Squadrito, Warping influence on the static design ofunbraced steel storage pallet racks, Thin-Walled Struct. 79 (2014) 71–82.
[26] C. Bernuzzi, A. Gobetti, G. Gabbianelli, M. Simoncelli, Unbraced pallet rack design inaccordance with European practice–part 1: selection of the method of analysis,Thin-Walled Struct. 86 (2015) 185–207.
[27] J.M. Gere, S.P. Timoshenko, Mechanics of Materials, Chapman & Hall, London, 1991.[28] L.H. Teh, M.J. Clarke, Plastic-zone analysis of 3D steel frames using beam elements, J.
Struct. Eng. 125 (11) (1999) 1328–1337.
[29] SA/SNZ, Cold-formed Steel Structures, AS/NZS 4600:2005. Standards Australia/Stan-dards New Zealand, 2005.
[30] R.Q. Bridge, N.S. Trahair, Limit state design rules for steel beam-columns SteelConstruction, Aust. Ins. Steel Constr. 21 (1987) 2–11.
[31] N.S. Trahair, M.A. Bradford, The Behaviour and Design of Steel Structures, E & FNSpon, 1998.
[32] P.W. Key, G.J. Hancock, A theoretical investigation of the column behaviour of cold-formed square hollow sections, Thin-Walled Struct. 16 (1993) 31–64.
[33] Strand7, User Manual — Release 2.4.4, G + D Computing Pty Ltd, 2010.