Journal of Cleaner Production · Phosphoric acid is, after sulphuric acid, the most important...
9
Environmental impacts of phosphoric acid production using di-hemihydrate process: a Belgian case study Sandra Belboom a, * , Carl Sz € ocs b , Ang elique L eonard a a Department of Chemical Engineering, PEP's, University of Li ege, 3 All ee de la Chimie, 4000 Li ege, Belgium b Prayon SA, 144 Rue Joseph Wauters, 4480 Engis, Belgium article info Article history: Received 17 September 2014 Received in revised form 29 June 2015 Accepted 29 June 2015 Available online 7 July 2015 Keywords: Phosphoric acid Life cycle assessment (LCA) Fertilizer grade Purified grade Wet process Di-hemihydrate abstract This paper undertakes an environmental evaluation of phosphoric acid production, using industrial data from Prayon SA in Belgium. Phosphoric acid is produced using the wet di-hemihydrate process also called Central Prayon process. Both grades of phosphoric acid are evaluated: fertilizer and purified grades. Specificities of this plant are highlighted and improvements of the process in terms of energy and facilities integration through years are quantified as environmental benefits. The implementation on site of two sulphuric acid production facilities and their energetic integration allow a reduction of climate change impact of 80%. Results also show the importance of phosphogypsum valorisation which is sold for the main part in this case study. Concerning the purified grade, this specific process has been compared to the thermal process, using Best Available Techniques (BAT) values for the modelling. It shows a reduced environmental impact for the wet process in the majority of categories studies. © 2015 Elsevier Ltd. All rights reserved. 1. Introduction Phosphoric acid is, after sulphuric acid, the most important mineral acid produced in the world. It is mainly consumed during the manufacturing of phosphate fertilizers or for direct use as acid. The use as fertilizer, which represents 80% of the overall use, re- quires a lower grade of purity than the second use (European Commission and Joint Research Centre, 2007). Phosphorus, tradi- tionally expressed as P 2 O 5 in the fertilizer industry, is the second nutrient consumed in the world after nitrogen. Its consumption achieved 41.8 Mt (as P 2 O 5 ) in 2013 and is expected to reach 45.9 Mt P 2 O 5 in 2018 (Heffer and Prud'homme, 2014). Phosphate fertilizer is usually produced from phosphate rocks and/or com- mercial phosphoric acid (Kool et al., 2012). Worldwide phosphoric acid production capacity was 41.6 Mt P 2 O 5 in 2004. In Europe, the production capacity of this acid is about 3.08 Mt P 2 O 5 (European Commission and Joint Research Centre, 2007). Two production processes are available: the wet and the thermal one. The thermal process uses elemental phosphorus produced from phosphate rocks but has been abandoned in the majority of Euro- pean countries due to the high energy requirement (European Fertilizer Manufacturers' Association, 2000). This process is still employed in countries as China or Kazakhstan. The quality of this acid is higher than the one required for fertilizer production as it allows the production of a defluorinated and purified phosphoric acid. Therefore, the most common process for commercial phos- phoric acid production, for 95% of the total phosphoric acid in EU, is the wet one but its main flaw is the coproduction of phosphogyp- sum, considered as one of the main hazards of wet-production of phosphoric acid (European Fertilizer Manufacturers' Association, 2000). This commercial phosphoric acid can be upgraded to a pu- rified grade after solvent extraction (European Commission and Joint Research Centre, 2007). To our knowledge, few papers related to the environmental impacts of commercial phosphoric acid production have been published and none was found about the purified acid produced from the wet process. A paper of Kapustenko et al. (2009) focused on the energy improvement and optimisation of the phosphoric acid production but without showing associated environmental impacts. The Ecoinvent report explains how databases have been List of abbreviations: BAT, Best Available Technique; CTUh, Comparative Toxic Units for humans; DHH process, Di-hemihydrate process; EU, European Union; IEA, International Energy Agency; ILCD, International Life Cycle Data; ISO, International Standardization Organization; kt/a, kilotonnes per year; LCA, Life Cycle Assessment; Mt, Mega tonne; PM, Particulate matter; US, United States. * Corresponding author. Tel.: þ32 43664584; fax: þ32 43664435. E-mail address: [email protected] (S. Belboom). Contents lists available at ScienceDirect Journal of Cleaner Production journal homepage: www.elsevier.com/locate/jclepro http://dx.doi.org/10.1016/j.jclepro.2015.06.141 0959-6526/© 2015 Elsevier Ltd. All rights reserved. Journal of Cleaner Production 108 (2015) 978e986
Transcript of Journal of Cleaner Production · Phosphoric acid is, after sulphuric acid, the most important...

lable at ScienceDirect
Journal of Cleaner Production 108 (2015) 978e986
Contents lists avai
Journal of Cleaner Production
journal homepage: www.elsevier .com/locate/ jc lepro
Environmental impacts of phosphoric acid production usingdi-hemihydrate process: a Belgian case study
Sandra Belboom a, *, Carl Sz€ocs b, Ang�elique L�eonard a
a Department of Chemical Engineering, PEP's, University of Li�ege, 3 All�ee de la Chimie, 4000 Li�ege, Belgiumb Prayon SA, 144 Rue Joseph Wauters, 4480 Engis, Belgium
a r t i c l e i n f o
Article history:Received 17 September 2014Received in revised form29 June 2015Accepted 29 June 2015Available online 7 July 2015
Keywords:Phosphoric acidLife cycle assessment (LCA)Fertilizer gradePurified gradeWet processDi-hemihydrate
List of abbreviations: BAT, Best Available TechniqUnits for humans; DHH process, Di-hemihydrate procInternational Energy Agency; ILCD, International LifeStandardization Organization; kt/a, kilotonnes per yeaMt, Mega tonne; PM, Particulate matter; US, United S* Corresponding author. Tel.: þ32 43664584; fax: þ
E-mail address: [email protected] (S. Belboom).
http://dx.doi.org/10.1016/j.jclepro.2015.06.1410959-6526/© 2015 Elsevier Ltd. All rights reserved.
a b s t r a c t
This paper undertakes an environmental evaluation of phosphoric acid production, using industrial datafrom Prayon SA in Belgium. Phosphoric acid is produced using the wet di-hemihydrate process alsocalled Central Prayon process. Both grades of phosphoric acid are evaluated: fertilizer and purifiedgrades. Specificities of this plant are highlighted and improvements of the process in terms of energy andfacilities integration through years are quantified as environmental benefits. The implementation on siteof two sulphuric acid production facilities and their energetic integration allow a reduction of climatechange impact of 80%. Results also show the importance of phosphogypsum valorisation which is sold forthe main part in this case study. Concerning the purified grade, this specific process has been comparedto the thermal process, using Best Available Techniques (BAT) values for the modelling. It shows areduced environmental impact for the wet process in the majority of categories studies.
© 2015 Elsevier Ltd. All rights reserved.
1. Introduction
Phosphoric acid is, after sulphuric acid, the most importantmineral acid produced in the world. It is mainly consumed duringthe manufacturing of phosphate fertilizers or for direct use as acid.The use as fertilizer, which represents 80% of the overall use, re-quires a lower grade of purity than the second use (EuropeanCommission and Joint Research Centre, 2007). Phosphorus, tradi-tionally expressed as P2O5 in the fertilizer industry, is the secondnutrient consumed in the world after nitrogen. Its consumptionachieved 41.8 Mt (as P2O5) in 2013 and is expected to reach45.9 Mt P2O5 in 2018 (Heffer and Prud'homme, 2014). Phosphatefertilizer is usually produced from phosphate rocks and/or com-mercial phosphoric acid (Kool et al., 2012). Worldwide phosphoricacid production capacity was 41.6 Mt P2O5 in 2004. In Europe, theproduction capacity of this acid is about 3.08 Mt P2O5 (European
ue; CTUh, Comparative Toxicess; EU, European Union; IEA,Cycle Data; ISO, Internationalr; LCA, Life Cycle Assessment;tates.32 43664435.
Commission and Joint Research Centre, 2007). Two productionprocesses are available: the wet and the thermal one.
The thermal process uses elemental phosphorus produced fromphosphate rocks but has been abandoned in the majority of Euro-pean countries due to the high energy requirement (EuropeanFertilizer Manufacturers' Association, 2000). This process is stillemployed in countries as China or Kazakhstan. The quality of thisacid is higher than the one required for fertilizer production as itallows the production of a defluorinated and purified phosphoricacid. Therefore, the most common process for commercial phos-phoric acid production, for 95% of the total phosphoric acid in EU, isthe wet one but its main flaw is the coproduction of phosphogyp-sum, considered as one of the main hazards of wet-production ofphosphoric acid (European Fertilizer Manufacturers' Association,2000). This commercial phosphoric acid can be upgraded to a pu-rified grade after solvent extraction (European Commission andJoint Research Centre, 2007).
To our knowledge, few papers related to the environmentalimpacts of commercial phosphoric acid production have beenpublished and none was found about the purified acid producedfrom the wet process. A paper of Kapustenko et al. (2009) focusedon the energy improvement and optimisation of the phosphoricacid production but without showing associated environmentalimpacts. The Ecoinvent report explains how databases have been

S. Belboom et al. / Journal of Cleaner Production 108 (2015) 978e986 979
modelled for both US and Morocco sites at the commercial grade(Primas and Capello, 2004). Bojarski et al. (2008) modelled the wetphosphoric acid production process, varying the destiny of phos-phogypsum and using data from a real process plant located inGreece. Two other papers compared wet and thermal processes forphosphate fertilizer production. The first one is based on the singlesuperphosphate production (Silva and Kulay, 2003) and the secondone compared from an environmental point of view the fusedmagnesium phosphate and the triple superphosphate (Silva andKulay, 2005). Both plants are situated in Brazil. All previous pa-pers are focused on wet production using hemi or dihydrate pro-cesses. By-product phosphogypsum is then awastewhich is usuallystacked or dumped into the sea. For each tonne of phosphoric acid(P2O5) produced, about four to five tonnes of phosphogypsum areproduced: mass ratio of phosphogypsum (PG) side product tophosphoric acid produced, z(PG/P2O5) ¼ 4e5. Impurities containedin phosphate rocks as e.g. cadmium (Cd), mercury (Hg), heavymetals, and some radioactive elements, are partly recovered fromthe phosphogypsum. Due to its volume and the type and level ofimpurities in the phosphogypsum, it constitutes an environmentalchallenge to handle (European Commission and Joint ResearchCentre, 2007). Furthermore, in Europe, disposal to the sea isforbidden and land disposal must be used. Some prevention mea-sures can be conducted to avoid environmental pollution butanother way of dealing with this problem is to improve the qualityof phosphogypsum, allowing its use in construction, agriculture orindustrial sectors. The valorisation of phosphogypsum is easier if itstransportation cost is low.
A Belgian company, called Prayon SA, already valorises a highpart of its phosphogypsum (85%), mainly in the plaster industry. Ituses a wet process with di-hemihydrate recrystaliszation type(called DHH process or Central Prayon process) with double stagefiltration (European Commission and Joint Research Centre, 2007)which allows a sufficient purity of the phosphogypsum for furthervalorisation. For fertilizer grade phosphoric acid, only the wet routeis used and the Prayon processes are applied for more than 50% ofthe worldwide production. Concerning the purified phosphoricacid production, the Prayon process represents about 5% of theworldwide production, with a P2O5 capacity of 180 kt/a, but thisproduction is equal to 85% of the European production.
This paper will conduct the environmental life cycle assessmentof phosphoric acid production at both fertilizer and purified gradesto get a more accurate view of environmental impacts of this pro-duction, using di-hemihydrate process which has not beenmodelled yet in literature. Results of environmental impacts rela-tive to this di-hemihydrate process will be compared to the thermalproduction process, especially for the purified grade of phosphoricacid. This paper will also draw some clues of improvement toreduce environmental impacts of phosphoric acid production.
2. Materials and methods
2.1. Goal definition
Environmental impacts of phosphoric acid production at bothfertilizer and purified grades, produced in Belgian industrial plantof Prayon SA, are assessed using attributional LCA methodologyclassified as Situation C from the ILCD handbook (EuropeanCommission e Joint Research Centre e Institute for Environmentand Sustainability, 2010). They are calculated using both ILCD2011 midpoint (European Commission e Joint Research Centre e
Institute for Environment and Sustainability, 2011) and ReCiPe2008 (Goedkoop et al., 2009) methods. The first one is recom-mended by the ILCD handbook and regroups the most relevantmethods to assess the environmental impact in each studied
impact category. The last one regroups bothmidpoint and endpointapproaches and is relevant to evaluate separately the environ-mental impact of mineral and fossil fuel depletion which cannot beperformed using the first method.
This study is made in accordance with the ISO standards 14040(International Organization for Standardization (ISO), 2006a) and14044 (International Organization for Standardization (ISO),2006b) and tends to answer these questions: “Does purifiedgrade phosphoric acid from wet process achieve better environ-mental results than the one produced with thermal process?”,“What are the environmental hotspots of commercial phosphoricacid production?” and “What are the clues of improvement toreduce environmental impacts of phosphoric acid (H3PO4) andtherefore environmental impacts of P2O5 fertilizers?”.
2.2. Scope definition
The functional unit of P2O5 (1 t) means that specific (divided bymass) quantities are used for both fertilizer and purified phosphoricacid grades. Boundaries of thewet production process, presented inFig. 1, include eight main stages: (1) production of so-called weakphosphoric acid, (2) concentration and production of fertilizergrade phosphoric acid, (3) production of special grade intended forpurification and internally called D01, (4) effluents from those threefirst steps, (5) oxidation of previous acid, (6) extraction per solvent,(7) defluorination step and (8) effluents due to steps (5)e(7). Pro-duction of fertilizer grade acid includes steps (1), (2) and a fractionof (4) while production of purified acid goes from step (1) to step(8).
All information relative to allocation factors, data quality andsource or exclusion criteria are explained in the paragraph 2.3.
2.3. Life cycle inventory analysis
Inventory concerning wet process is based on specific data forBelgium collected in the Prayon industrial plant located in Engisduring the year 2012 (Prayon SA, 2012b). The nature and thequantity of each consumption and emission are specific to the plantand relative to primary data. To model these consumptions, com-mercial Ecoinvent databases v2.2 (Swiss Centre for Life CycleInventories, 2010), were used as the goal of the paper was not tomodel in details each chemical production. Inventory relative tothermal process is based on the Best Available Techniques(European Commission and Joint Research Centre, 2007) as no in-dustrial data were directly available.
2.3.1. Phosphoric acid production
2.3.1.1. Phosphoric acid production in Prayon Engis. In Engis, thewetprocess and more specifically the di-hemihydrate recrystallizationprocess (called DHH process or Central Prayon process) with doublestage filtration (European Commission and Joint Research Centre,2007) is used to produce phosphoric acid following both nextsteps. First, the tri-calcium phosphate present in the phosphaterock is attacked by sulphuric acid to produce phosphoric acid andan insoluble salt as co-product. Then, the co-product is filtered fromthe phosphoric acid H3PO4. The previous reaction is limited by aninsoluble layer of CaSO4 but can be minimised by recirculation ofphosphoric acid which allows the solubilisation as mono calciumphosphate which becomes calcium sulphate after precipitationwith sulphuric acid. Equations (1)e(3) present simplified chemicalreactions between rocks and sulphuric acid (European Commissionand Joint Research Centre, 2007; European FertilizerManufacturers' Association, 2000).

Fig. 1. Scheme of defluorinated and purified phosphoric acid production: consumptions and important steps.
S. Belboom et al. / Journal of Cleaner Production 108 (2015) 978e986980
Ca3ðPO4Þ2 þ 3H2SO4/2H3PO4 þ 3CaSO4 (1)
Ca3ðPO4Þ2 þ 4H3PO4/3CaðH2PO4Þ2 (2)
3CaðH2PO4Þ2 þ 3H2SO4/3CaSO4 þ 6H3PO4 (3)
A scheme of di-hemihydrate process is presented in Fig. 2. Themain advantages of this process are that the yield is high andreaches an efficiency of 98% in P2O5 as well as it allows the valor-isation of the phosphogypsum (European Commission and JointResearch Centre, 2007).
In order to produce phosphoric acid, suitable phosphate rockscan be found all over the world with a composition varying with
Fig. 2. Overview of the Di-Hemihydrate (DHH) recrystallization process with double-s
their geological origin. The supply of phosphate rock in Europe isprovided mainly by Morocco and Russia. The majority of ores forPrayon study case comes fromRussia and contain about 39% of P2O5
as mass fraction (European Commission and Joint Research Centre,2007; Prayon SA, 2012b). The mining of rock requires an energycomprised between 0.5 GJ/t and 2.8 GJ/t of rock (Kool et al., 2012).In our study, as specific databases are not available for Russianrocks, we use Ecoinvent databases where the required energy is1.15 GJ/t of Moroccan rock and 1.29 GJ/t of American rock, which isin the range published.
Inventory relative to the production of 1 t P2O5 in both fertilizerand purified grades phosphoric acid are presented in Table 1(Prayon SA, 2012b). This table presents the total of specific energyrequired by the plant for the production of the functional unit as
tage filtration based on European Commission and Joint Research Centre (2006).
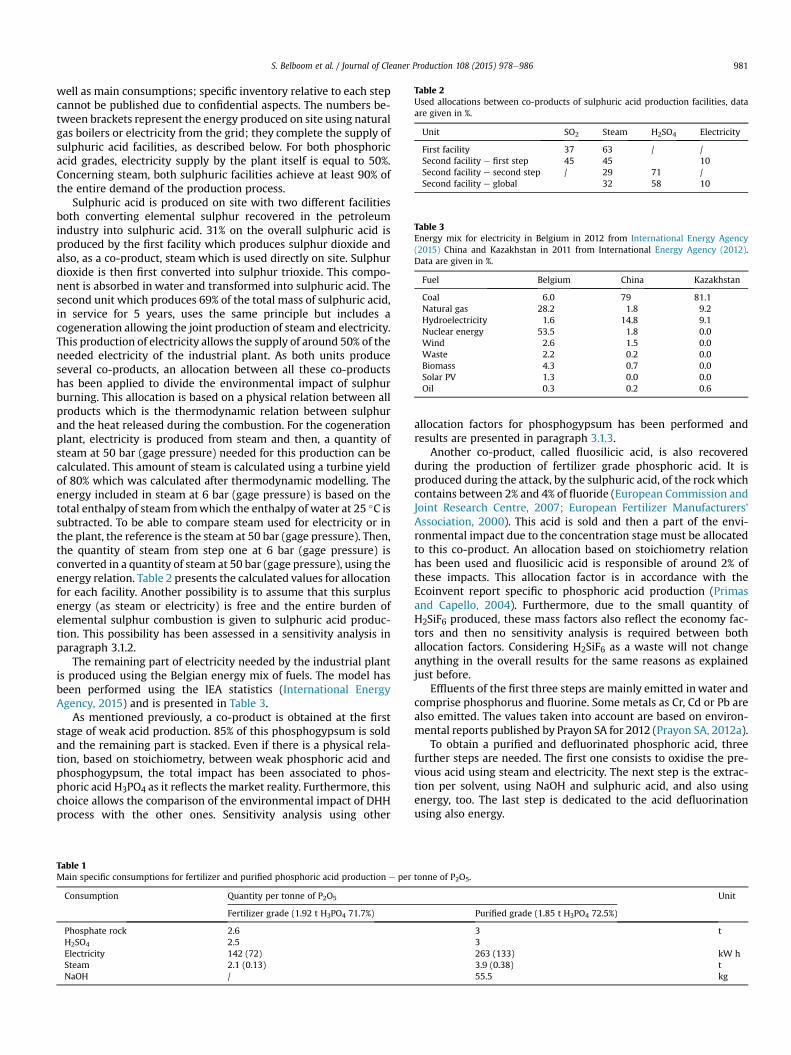
Table 2Used allocations between co-products of sulphuric acid production facilities, dataare given in %.
Unit SO2 Steam H2SO4 Electricity
First facility 37 63 / /Second facility e first step 45 45 10Second facility e second step / 29 71 /Second facility e global 32 58 10
Table 3Energy mix for electricity in Belgium in 2012 from International Energy Agency(2015) China and Kazakhstan in 2011 from International Energy Agency (2012).Data are given in %.
Fuel Belgium China Kazakhstan
Coal 6.0 79 81.1Natural gas 28.2 1.8 9.2Hydroelectricity 1.6 14.8 9.1Nuclear energy 53.5 1.8 0.0Wind 2.6 1.5 0.0Waste 2.2 0.2 0.0Biomass 4.3 0.7 0.0Solar PV 1.3 0.0 0.0Oil 0.3 0.2 0.6
S. Belboom et al. / Journal of Cleaner Production 108 (2015) 978e986 981
well as main consumptions; specific inventory relative to each stepcannot be published due to confidential aspects. The numbers be-tween brackets represent the energy produced on site using naturalgas boilers or electricity from the grid; they complete the supply ofsulphuric acid facilities, as described below. For both phosphoricacid grades, electricity supply by the plant itself is equal to 50%.Concerning steam, both sulphuric facilities achieve at least 90% ofthe entire demand of the production process.
Sulphuric acid is produced on site with two different facilitiesboth converting elemental sulphur recovered in the petroleumindustry into sulphuric acid. 31% on the overall sulphuric acid isproduced by the first facility which produces sulphur dioxide andalso, as a co-product, steam which is used directly on site. Sulphurdioxide is then first converted into sulphur trioxide. This compo-nent is absorbed in water and transformed into sulphuric acid. Thesecond unit which produces 69% of the total mass of sulphuric acid,in service for 5 years, uses the same principle but includes acogeneration allowing the joint production of steam and electricity.This production of electricity allows the supply of around 50% of theneeded electricity of the industrial plant. As both units produceseveral co-products, an allocation between all these co-productshas been applied to divide the environmental impact of sulphurburning. This allocation is based on a physical relation between allproducts which is the thermodynamic relation between sulphurand the heat released during the combustion. For the cogenerationplant, electricity is produced from steam and then, a quantity ofsteam at 50 bar (gage pressure) needed for this production can becalculated. This amount of steam is calculated using a turbine yieldof 80% which was calculated after thermodynamic modelling. Theenergy included in steam at 6 bar (gage pressure) is based on thetotal enthalpy of steam fromwhich the enthalpy of water at 25 �C issubtracted. To be able to compare steam used for electricity or inthe plant, the reference is the steam at 50 bar (gage pressure). Then,the quantity of steam from step one at 6 bar (gage pressure) isconverted in a quantity of steam at 50 bar (gage pressure), using theenergy relation. Table 2 presents the calculated values for allocationfor each facility. Another possibility is to assume that this surplusenergy (as steam or electricity) is free and the entire burden ofelemental sulphur combustion is given to sulphuric acid produc-tion. This possibility has been assessed in a sensitivity analysis inparagraph 3.1.2.
The remaining part of electricity needed by the industrial plantis produced using the Belgian energy mix of fuels. The model hasbeen performed using the IEA statistics (International EnergyAgency, 2015) and is presented in Table 3.
As mentioned previously, a co-product is obtained at the firststage of weak acid production. 85% of this phosphogypsum is soldand the remaining part is stacked. Even if there is a physical rela-tion, based on stoichiometry, between weak phosphoric acid andphosphogypsum, the total impact has been associated to phos-phoric acid H3PO4 as it reflects the market reality. Furthermore, thischoice allows the comparison of the environmental impact of DHHprocess with the other ones. Sensitivity analysis using other
Table 1Main specific consumptions for fertilizer and purified phosphoric acid production e per
Consumption Quantity per tonne of P2O5
Fertilizer grade (1.92 t H3PO4 71.7%)
Phosphate rock 2.6H2SO4 2.5Electricity 142 (72)Steam 2.1 (0.13)NaOH /
allocation factors for phosphogypsum has been performed andresults are presented in paragraph 3.1.3.
Another co-product, called fluosilicic acid, is also recoveredduring the production of fertilizer grade phosphoric acid. It isproduced during the attack, by the sulphuric acid, of the rock whichcontains between 2% and 4% of fluoride (European Commission andJoint Research Centre, 2007; European Fertilizer Manufacturers'Association, 2000). This acid is sold and then a part of the envi-ronmental impact due to the concentration stage must be allocatedto this co-product. An allocation based on stoichiometry relationhas been used and fluosilicic acid is responsible of around 2% ofthese impacts. This allocation factor is in accordance with theEcoinvent report specific to phosphoric acid production (Primasand Capello, 2004). Furthermore, due to the small quantity ofH2SiF6 produced, these mass factors also reflect the economy fac-tors and then no sensitivity analysis is required between bothallocation factors. Considering H2SiF6 as a waste will not changeanything in the overall results for the same reasons as explainedjust before.
Effluents of the first three steps are mainly emitted inwater andcomprise phosphorus and fluorine. Some metals as Cr, Cd or Pb arealso emitted. The values taken into account are based on environ-mental reports published by Prayon SA for 2012 (Prayon SA, 2012a).
To obtain a purified and defluorinated phosphoric acid, threefurther steps are needed. The first one consists to oxidise the pre-vious acid using steam and electricity. The next step is the extrac-tion per solvent, using NaOH and sulphuric acid, and also usingenergy, too. The last step is dedicated to the acid defluorinationusing also energy.
tonne of P2O5.
Unit
Purified grade (1.85 t H3PO4 72.5%)
3 t3263 (133) kW h3.9 (0.38) t55.5 kg

Table 4Specific consumptions for P2O5 equivalent production using thermal process.
Consumption Average quantity per tonne of P2O5 Unit
Phosphate rock 3.2 tClay 0.25Coke 0.55Process water 40 m3
Cooling water 120Electricity 5850 kW h
S. Belboom et al. / Journal of Cleaner Production 108 (2015) 978e986982
2.3.1.2. Phosphoric acid production using thermal process.Production of purified and defluorinated phosphoric acid can alsobe achieved using the thermal process. This process consists inproducing elemental phosphorus from phosphate rock and thenoxidising it into P2O5, which is hydrated to obtain phosphoric acid.The reaction due to the passage of grinded phosphate rock, mixedwith a slurry consisting of water, clay, carbon and various wastestreams containing phosphorus through a furnace can be sum-marised by Equation (4). This reaction produces elemental phos-phorus, carbon monoxide and a liquid slag (European Commissionand Joint Research Centre, 2007; European FertilizerManufacturers' Association, 2000).
2Ca3ðPO4Þ2 þ 6SiO2 þ 10C/P4 þ 10COþ 6CaSiO3 (4)
The efficiency of phosphorus recovery is equal to 94%. The nextstep of phosphoric acid production is the oxidation of elementalphosphorus with the air to P2O5. This reaction is exothermic andthe heat release is used for high temperature steam generation. TheP2O5 produced by oxidation is contacted with diluted phosphoricacid and reacts with the water content to produce phosphoric acid.Reactions are described by equations (5) and (6).
P4 þ 5O2/2P2O5 (5)
P2O5 þ 3H2O/2H3PO4 (6)
Thermal process for phosphoric acid production in Europeancountries is now only performed in Czech Republic and Poland(European Commission and Joint Research Centre, 2007). Currently,this process is widely used in China and Kazakhstan, which are themain producers of thermal process phosphoric acid.
As no specific values are available for the modelling of thethermal process, average values from the Best Available Techniques(BAT) for the manufacture of large volume Inorganic Chemicals e
Ammonia, fertilizers and acids, concerning consumptions are usedand shown in Table 4 (European Commission and Joint ResearchCentre, 2007). Due to this non-specificity of data, uncertaintiesrelative to inventory can appear but the results of environmentalimpacts obtained will be treated as a range of accessible values forthermal process and not as absolute values. Mass of needed phos-phate rocks is given by the stoichiometry of the process so a weakuncertainty is then associated to this value. Information relative toemissions and energy consumptions should be considered as anaccessible range of values.
For electricity generation, energy mixes relative to China andKazakhstan have been modelled using the IEA values presented inTable 3 (International Energy Agency, 2012). Energy mix has beenmodelled with 50% for each electricity type considering a produc-tion in both countries.
3. Results and discussion
3.1. Results
Fig. 3 presents a breakdown of the results for ILCD 2011 envi-ronmental impact categories of our study. It presents the impor-tance of specific consumption or emission for the product atfertilizer grade using wet process in Prayon SA. The overall processhas been divided between 8 contributions: “phosphate” whichrefers to phosphate rock mining, “H2SO4” which is relative to sul-phuric acid production on site, “emissions in the air” specific to theplant, “emissions in water” due to process effluents, “steam”whichis produced on site using sulphuric acid facilities or natural gasboilers, “electricity” produced on site or supplied by the grid,“chemicals” which refer to all chemicals consumptions of the
process and finally “transport” which is relative to the phosphaterock and chemicals transportation. Fig. 4 compares both productionprocesses for purified phosphoric acid, using Prayon specific dataand BAT based thermal process data. Results relative to mineral andfossil fuel depletion categories modelled with ReCiPe 2008 methodare added in both figures. Categories of ILCD 2011 method do notexpress directly the impact of fossil fuel consumption, which is animportant factor for interpretation especially with energetic pro-cesses. Absolute values of impacts for each category are presentedin Table 5 and are commented in further paragraphs.
Concerning fertilizer grade acid, the contribution of phosphateconsumption includingmining and beneficiation for fertilizer gradeproduction achieves between 4% of the total impact for (h) acidi-fication category and 65% for (o) mineral, fossil and renewable re-sources depletion. In the majority of categories, it reaches around30% of the total impact. Transportation of phosphate and chemicalsimpact is not negligible and achieves more than 10% except in (e)particulate matter formation, (h) acidification and (o) mineral,fossil and renewable energy depletion. Sulphuric acid and steamreach together 76% of the (e) particulate matter formation impactand 86% for the (h) acidification impact. Emissions in water,composed of mainly phosphate obtain 82% of the total impact of (j)freshwater eutrophication.
Production of wet process purified phosphoric acid leads tospecific environmental impacts around 1.5 times higher than thefertilizer grade for the 1 t of P2O5 contained in the final product.Production of fertilizer grade acid achieves, depending on impactcategory, 54e73% of the total impact of purified acid. Previous in-formation concerning the importance of preliminary steps for fer-tilizer grade is still available for purified grade.
Production of purified thermal process phosphoric acid,assumed to be produced both in China and Kazakhstan, givesenvironmental impacts at least 7 times higher for (a) climatechange and (q) fossil fuel consumption, and 6 times higher for (e)particulate matter formation than the wet process, as shown inFig. 4. Wet process leads to higher emissions in (j) freshwatereutrophication category compared to thermal process. Electricityproduction and consumption included in the thermal processinduce 90% of the total impact in all categories.
3.1.1. Benefits of the second facility of sulphuric acid productionIn 2009, production of sulphuric acid was performed using
exclusively the first production facility. The first facility was notable to supply the overall consumption of sulphuric acid and thenthe remaining part was bought on the market. Supply of electricitywas obtained using exclusively the grid and the required steamusing natural gas boilers. Environmental impacts of this situationhave been assessed and compared with the current situation.Without the second facility, results show an increase of 10% for (j)freshwater eutrophication impact but around 80% for (a) climatechange category. The implementation of a second facility allowingco-generation and then energy integration allows a non-negligiblereduction in terms of environmental impacts in all impactcategories.

Fig. 3. Characterization results of environmental impacts for fertilizer grade phosphoric acid: importance of flows.
Fig. 4. Comparison between wet and thermal processes for purified acid production: characterization stage of environmental impacts.
S. Belboom et al. / Journal of Cleaner Production 108 (2015) 978e986 983

Table 5Specific environmental values for P2O5 using wet (fertilizer and purified grades) and thermal processes.
Category Quantity and symbol Unit Usual unit Fertilizer grade (1 t P2O5) Purified grade (1 t P2O5)
Wet Thermal BAT
Climate change Mass of CO2 equivalent, meq (CO2) kg kgeq CO2 626 950 7365Human toxicity Comparative Toxic Units for humans CTUh CTUh 1.07 10�4 2 10�4 1.27 10�3
Particulate matter formation Mass of particulates 2.5 equivalent, meq (PM2.5) kg kgeq PM 2.5 1.78 2.63 16.2Acidification Equivalent acidification amount, neq (Hþ) mol moleq Hþ 28.7 43.4 83Freshwater eutrophication Mass of phosphorus equivalent, meq (P) kg kgeq P 1.1 1.5 1.04Land use Mass of carbon deficit, meq (C) kg kg C deficit 1394 1927 10 197Fossil depletion Mass of oil equivalent, meq (oil) kg kgeq oil 187 293 2193
Table 6Allocation factors for weak phosphoric acid and phosphogypsum. Data are given in%.
Product Waste Stoichiometry Price
Weak H3PO4 100 49 95.3Phosphogypsum 0 51 4.7
S. Belboom et al. / Journal of Cleaner Production 108 (2015) 978e986984
3.1.2. Sensitivity analysis e allocation for sulphuric acid productionIn this study, an allocation has been used between sulphuric
acid or sulphur dioxide, steam and electricity. This analysis is basedon a physical relation given by thermodynamic values. Anotherpossibility is to allocate the overall impact to sulphuric acid, basedon the fact that it is the wanted product. Electricity and steamjointly produced are assumed to be free of burdens and then used inall facilities without any environmental impact. Fig. 5 presentsvariation of results for the main case and the sensitivity analysis.
In that case, a reduction in the total impact of the purifiedphosphoric acid is obtained for impact categories considered butvalue changes are comprised between 0.2% for (o) mineral, fossiland renewable energy depletion and 10.7% for (h) acidificationwitha majority of variations inferior to 5%. Using thermodynamic allo-cation is then relevant in our case, as all co-products are used fortheir energy content, relative to the thermodynamic values.
3.1.3. Sensitivity analysis e allocation for phosphogypsumIn this study, the unavoidable co-product, phosphogypsum, has
been considered as a waste, assuming that the overall impact of the
Fig. 5. Comparison between allocation on sulphur or no
first step (weak phosphoric acid production) is only related to themain product. Another possibility is to divide this impact betweenphosphogypsum and phosphoric acid using different allocationfactors which are presented in Table 6. Only the valorised part ofphosphogypsum has been used in the calculation of these factors.
The physical relation, recommended by ISO standards leads toan environmental impact for weak phosphoric acid step divided by2 which does not reflect the reality of the market. Concerning theeconomic allocation, the results obtained are quite the same as theones used in the main text which confirms the robustness of thischoice. A variation of around 5% for the weak phosphoric produc-tion step leads to a total variation lower than 5% for each impact
t: characterization stage of environmental impacts.

S. Belboom et al. / Journal of Cleaner Production 108 (2015) 978e986 985
category concerning purified phosphoric acid. If the physical allo-cation is used, the overall impact for each category is reduced by atleast 10% for (j) eutrophication category and reaches more than 20%for (a) global warming, (b) ozone layer depletion and (q) fossil fueldepletion categories. Thus, practically, phosphogypsum wasconsidered in this work as a waste, with no allocation at all, whichis really the case for nearly all other phosphoric acid factories in theworld.
Compared to other wet production processes in the world,where the quality of phosphogypsum does not allow its use, the di-hemihydrate process avoids the stack of phosphogypsum or itsdisposal in the sea and then reduces the emissions in water due toleachates and also the land needed. This environmental improve-ment is very important, especially in countries where areas arelimited due to high population density as it is the case in Belgium.
3.2. Discussion
Production of phosphoric acid using wet di-hemihydrate pro-cess has as main advantage the valorisation of a high share of theproduced phosphogypsum. As mentioned in literature, it is gener-ally well accepted that the destiny of phosphogypsum and itsassociated leachates are the main environmental hazards in phos-phoric acid process and should be handled with care to avoid higheutrophication impact (Bojarski et al., 2008; Silva and Kulay, 2005).Even if the phosphogypsum is not as economically profitable asphosphoric acid, its valorisation avoids disposal costs.
Phosphate rock mining and use induce one third of the (a)climate change impact as well as in (q) fossil fuel and (p) mineraldepletion categories. Its transportation from mines to the produc-tion plant is also an important factor. Silva and Kulay (2005)highlighted this factor in the case of H3PO4 produced in Brazil forglobal warming potential, ozone layer depletion, human toxicityand freshwater aquatic ecotoxicity categories. This is explained bythe important distance between ore processing units and produc-tion sites with sometimes more than 700 km as it is the case in ourstudy (Silva and Kulay, 2005). Concerning (j) freshwater eutrophi-cation, emissions of phosphate are the main contributor of thiscategory but in the Brazilian case (Silva and Kulay, 2003, 2005),they are due to phosphogypsum being disposed in open areas andleading to leachates compared to our study case where emissionsonly come from the production process.
Thanks to both sulphuric acid production facilities integrated onthe site at Prayon, the part of fossil fuel used for energy generationas steam or electricity is reduced. Using an allocation factor forsulphuric acid facilities and their co-products is not significantlydifferent from not using it; the results are similar from one case tothe other which confirms the robustness of our choice. Further-more, the implementation of the second sulphuric acid facility al-lows a reduction of grid electricity about 50%. The steam producedwith natural gas boilers constitutes maximum 10% of the overalldemand of the site. The total consumption of sulphuric acid iscompletely supplied by the plant which allows a high reduction ofthe environmental impacts of fertilizer and purified grades phos-phoric acid. The production of sulphuric acid has been cited as adeterminant factor for GHG emissions in the manufacture ofphosphate fertilizer (Kongshaug, 1998; Wood and Cowie, 2004).
The comparison between purified wet and thermal phosphoricacids leads to the environmental benefit for the wet process. Theelectricity consumption (see Tables 1 and 4) of the thermal processreaches the highest part of the impact in all impact categories. Theenergy mix of electricity, mainly composed of coal in countries asChina or Kazakhstan, is responsible of this important impact. Thehigh energy consumption has been often evocated as the mainreason to abandon this process in Europe followed by the handling
of slags and dust (European Commission and Joint Research Centre,2007; European Fertilizer Manufacturers' Association, 2000).
This study case highlights the importance of phosphate rocksand their transportation from Russia to Belgium in the total impact.Producers of phosphoric acid have generally no influence on thisimpact, due to the geographical position of the rocks and economicreasons. Type of transportation, here mainly performed by boat, isalso important. The lorry transport should be avoided as much aspossible for environmental and economic purposes. Even if di-hemihydrate process for phosphoric acid production requires so-phisticated materials of construction and also a close customer forphosphogypsum, this process avoids the disposal of phosphogyp-sum and its implementation in new plants could be driven by thesecost benefits but also thanks to its flexibility to rock source(European Commission and Joint Research Centre, 2007). Further-more, the sulphuric acid production on site, coupled with acogeneration facility, has improved the process in a non-negligibleway especially in (a) climate change category. Heat recovery and itstransformation in facilities is a key point for acid phosphoric pro-cess improvement.
4. Conclusions
The life cycle assessment methodology, in accordance with theISO standards, is applied to wet di-hemihydrate process also calledCentral Prayon process for fertilizer and purified grades phosphoricacid. The purified phosphoric acid is compared with thermal acidand results show a reduction in all impact categories when usingwet process instead of thermal one, excepted for (i) eutrophication.
Using di-hemihydrate process for phosphoric acid productionavoids the disposal of phosphogypsum and allows its use, in thiscase, in plaster industry. This permits a reduction of environmentalimpacts e.g. in (i) eutrophication due to the avoidance of leachatesor sea disposal but also the reduction of the area of occupied landwhich is an important factor especially in countries where availablespace is limited.
Sulphuric acid production is, after the valorisation of phos-phogypsum, the main parameter in the environmental impact ofphosphoric acid production. The excess heat produced jointlywith the sulphuric acid allows an energy recovery in terms ofheat and electricity which reduces in a significant way theenvironmental impacts of phosphoric acid production. Theimplementation five years ago of a modern sulphuric acid pro-duction plant achieving a cogeneration process permits areduction of 80% of (a) climate change impact. The energy inte-gration coupled with the valorisation of co-products is then thebest way to reduce environmental impacts of a high energyconsuming chemical.
As the environmental impacts of fertilizer and purified grades ofphosphoric acid for Belgium are now available, the next step of thisstudy will be the evaluation of the environmental impacts ofphosphate salts. This study will highlight the hotspots of this pro-duction and gives clues of improvement in an environmental pointof view.
As the fertilizers are one of the main important factor in theagricultural sector, which is also related to numerous products ofour daily life, it is important to get an accurate value of the envi-ronmental impacts of their production.
As wet process is used worldwide for the production of fertilizergrade phosphoric acid, and as Prayon processes represent around50% of the production, this study can help in modelling otherspecific industrial plants. Then, only specific data concerningelectricity mix, sulphuric acid production or specific regulations(e.g. the sea disposal of phosphogypsum is forbidden in Europewhich is not the case in other continents) would be necessary to

S. Belboom et al. / Journal of Cleaner Production 108 (2015) 978e986986
model the fertilizer grade or purified phosphoric acid production inanother location in the world.
References
Bojarski, A.D., Guill�en-Gos�albez, G., Jim�enez, L., Espu~na, A., Puigjaner, L., 2008. Lifecycle assessment coupled with process simulation under uncertainty forreduced environmental impact: application to phosphoric acid production. Ind.Eng. Chem. Res. 47, 8286e8300.
European Commission e Joint Research Centre e Institute for Environment andSustainability, 2010. International Reference Life Cycle Data System (ILCD)Handbook e General Guide for Life Cycle Assessment e Detailed Guidance, firsted. Publications Office of the European Union, Luxembourg. March 2010. EUR24708 EN e Accessible from: http://eplca.jrc.ec.europa.eu/uploads/ILCD-Handbook-General-guide-for-LCA-DETAILED-GUIDANCE-12March2010-ISBN-fin-v1.0-EN.pdf. (accessed June 2015).
European Commission e Joint Research Centre e Institute for Environment andSustainability, 2011. International Reference Life Cycle Data System (ILCD)Handbook e Recommendations for Life Cycle Impact Assessment in the Euro-pean Context, first ed. Publications Office of the European Union, Luxemburg.November 2011. EUR 24571 EN e Accessible from: http://eplca.jrc.ec.europa.eu/uploads/ILCD-Recommendation-of-methods-for-LCIA-def.pdf. (accessed June2015).
European Commission, Joint Research Centre, 2007. Reference Document on BestAvailable Techniques for the Manufacture of Large Volume Inorganic Chemicalse Ammonia. Integrated Pollution Prevention and Control Sevilla, Spain. Acidsand Fertilizers e Accessible from: http://eippcb.jrc.ec.europa.eu/reference/BREF/lvic_aaf.pdf (accessed June 2015).
European Fertilizer Manufacturers' Association, 2000. Booklet No. 4 of 8: produc-tion of phosphoric acid. In: EFMA (Ed.), Best Available Techniques for PollutionPrevention and Control in the European Fertilizer Industry. Accessible from:http://www.productstewardship.eu/fileadmin/user_upload/user_upload_prodstew/documents/Booklet_nr_4_Production_of_Phosphoric_Acid.pdf(accessed June 2015) Belgium.
Goedkoop, M., Heijungs, R., Huijbregts, M., De Schryver, A., Struijs, J., van Zelm, R.,2009. In: Milieu, Ruimte en (Ed.), ReCiPe 2008 e a Life Cycle Impact AssessmentMethod Which Comprises Harmonised Category Indicators at the Midpoint andthe Endpoint Level. Acessible from: http://www.lcia-recipe.net/file-cabinet/ReCiPe_main_report_REVISED_13-07-2012.pdf?attredirects¼0 (accessed June2015).
Heffer, P., Prud'homme, M., 2014. Fertilizer outlook 2014e2018. In: (IFA), I.F.I.A (Ed.),82nd IFA Annual Conference, Sydney (Australia). Accessible from: www.fertilizer.org/.../2014_ifa_sydney_summary.pdf (accessed June 2015).
International Energy Agency, 2012. Statistics: electricity and heat for 2011. Acces-sible from: http://www.iea.org/statistics/statisticssearch/ (accessed June 2015).
International Energy Agency, 2015. Statistics e Belgium: electricity and heat for2012. Accessible from: http://www.iea.org/statistics/statisticssearch/report/?country¼BELGIUM&product¼electricityandheat&year¼2012 (accessed June2015).
International Organization for Standardization (ISO), 2006a. ISO 14040: Environ-mental Management e Life Cycle Assessment e Principles and Framework. ISO.
International Organization for Standardization (ISO), 2006b. ISO 14044: Environ-mental Management e Life Cycle Assessment e Requirements and Guidelines.ISO.
Kapustenko, P., Boldyryev, S., Arsenyeva, O., Khavin, G., 2009. The use of plate heatexchangers to improve energy efficiency in phosphoric acid production. J. Clean.Prod. 17, 951e958.
Kongshaug, G., 1998. Energy consumption and greenhouse gas emissions in fertil-izer production. In: Hydro Agri Europe (Ed.), Technical Report, Norway.
Kool, A., Marinussen, M., Blonk, H., 2012. In: Blonk Consultants (Ed.), LCI Data forthe Calculation Tool Feedprint for Greenhouse Gas Emissions of Feed Produc-tion and Utilization e GHG Emissions of N, P and K Fertilizer Production.Accessible from: http://www.blonkconsultants.nl/upload/pdf/PDV%20rapporten/fertilizer_production%20D03.pdf (accessed June 2015).
Prayon SA, 2012a. Environmental Report e Emissions in Air and Water for 2012 e
Engis Site (in French).Prayon SA, 2012b. Specific Data for Commercial and Purified Phosphoric Acid
Production e Engis Site. Non Published Industrial Data (in French).Primas, A., Capello, C., 2004. Life Cycle Inventories of Chemicals e Phosphoric Acid,
pp. 530e563. Ecoinvent Report.Silva, G.A., Kulay, L.A., 2003. Application of life cycle assessment to the LCA case
studies single superphosphate production. Int. J. Life Cycle Assess. 8, 209e214.Silva, G.A., Kulay, L.A., 2005. Environmental performance comparison of wet and
thermal routes for phosphate fertilizer production using LCA e a Brazilianexperience. J. Clean. Prod. 13, 1321e1325.
Swiss Centre for Life Cycle Inventories, 2010. The Life Cycle Inventory Data Version2.2.
Wood, S., Cowie, A., 2004. A Review of Greenhouse Gas Emission Factors for Fer-tiliser Production, IEA Bioenergy Task 38. Research and Development Division,State Forests of New South Wales and Cooperative Research Centre forGreenhouse Accounting.