Journal of Business Ethics A 21st Century Assessment of Values
60
21 st Century Values 1 In-press: Journal of Business Ethics A 21 st Century Assessment of Values across the Global Workforce David A. Ralston, University of Oklahoma, USA Carolyn P. Egri, Simon Fraser University, Canada Emmanuelle Reynaud, IAE d'Aix-en-Provence, France Narasimhan Srinivasan, University of Connecticut, USA Olivier Furrer, Radboud University Nijmegen, The Netherlands David Brock, Ben-Gurion University, Israel Ruth Alas, Estonia Business School, Estonia Florian Wangenheim, Technische Universitaet Muenchen, Germany Fidel León Darder, University of Valencia, Spain Kamel Mellahi, University of Sheffield, UK Charlotte Karam, American University of Beirut, Lebanon Christine Kuo, Yuan-Ze University, Taiwan Vojko Potocan, University of Maribor, Slovenia Audra I. Mockaitis, Victoria University of Wellington, New Zealand Erna Szabo, Johannes Kepler Universität, Austria Jaime Ruiz Gutiérrez, Universidad de los Andes, Colombia Andre Pekerti, University of Auckland, New Zealand Arif Butt, Lahore University of Management Sciences, Pakistan Ian Palmer, University of Technology Sydney, Australia Irina Naoumova, University of Hartford, USA Tomasz Lenartowicz, Florida Atlantic University, USA Arunas Starkus, CIBER-Vilnius, Lithuania Vu Thanh Hung, National Economics University, Vietnam Tevfik Dalgic, University of Dallas, USA Mario Molteni, Catholic University of Milan, Italy María Teresa de la Garza Carranza, Instituto Tecnológico de Celaya, México Isabelle Maignan, VU University Amsterdam, Netherlands Francisco B. Castro, CEMPRE- Universidade do Porto, Portugal Yong-lin Moon, Seoul National University, South Korea Jane Terpstra-Tong, Monash University, Malaysia Marina Dabic, University of Zagreb, Croatia Yongjuan Li, Chinese Academy of Science, China Wade Danis, Georgia State University, USA Maria Kangasniemi, University of Kuopio, Finland Mahfooz Ansari, University of Lethbridge, Canada Liesl Riddle, George Washington University, USA Laurie Milton, University of Calgary, Canada Philip Hallinger, Hong Kong Institute of Education, China
Transcript of Journal of Business Ethics A 21st Century Assessment of Values
21st Century Values 1
In-press: Journal of Business Ethics
A 21st Century Assessment of Values across the Global Workforce
David A. Ralston, University of Oklahoma, USA
Carolyn P. Egri, Simon Fraser University, Canada
Emmanuelle Reynaud, IAE d'Aix-en-Provence, France
Narasimhan Srinivasan, University of Connecticut, USA
Olivier Furrer, Radboud University Nijmegen, The Netherlands
David Brock, Ben-Gurion University, Israel
Ruth Alas, Estonia Business School, Estonia
Florian Wangenheim, Technische Universitaet Muenchen, Germany
Fidel León Darder, University of Valencia, Spain
Kamel Mellahi, University of Sheffield, UK
Charlotte Karam, American University of Beirut, Lebanon
Christine Kuo, Yuan-Ze University, Taiwan
Vojko Potocan, University of Maribor, Slovenia
Audra I. Mockaitis, Victoria University of Wellington, New Zealand
Erna Szabo, Johannes Kepler Universität, Austria
Jaime Ruiz Gutiérrez, Universidad de los Andes, Colombia
Andre Pekerti, University of Auckland, New Zealand
Arif Butt, Lahore University of Management Sciences, Pakistan
Ian Palmer, University of Technology Sydney, Australia
Irina Naoumova, University of Hartford, USA
Tomasz Lenartowicz, Florida Atlantic University, USA
Arunas Starkus, CIBER-Vilnius, Lithuania
Vu Thanh Hung, National Economics University, Vietnam
Tevfik Dalgic, University of Dallas, USA
Mario Molteni, Catholic University of Milan, Italy
María Teresa de la Garza Carranza, Instituto Tecnológico de Celaya, México
Isabelle Maignan, VU University Amsterdam, Netherlands
Francisco B. Castro, CEMPRE- Universidade do Porto, Portugal
Yong-lin Moon, Seoul National University, South Korea
Jane Terpstra-Tong, Monash University, Malaysia
Marina Dabic, University of Zagreb, Croatia
Yongjuan Li, Chinese Academy of Science, China
Wade Danis, Georgia State University, USA
Maria Kangasniemi, University of Kuopio, Finland
Mahfooz Ansari, University of Lethbridge, Canada
Liesl Riddle, George Washington University, USA
Laurie Milton, University of Calgary, Canada
Philip Hallinger, Hong Kong Institute of Education, China
21st Century Values 2
Detelin Elenkov, University of Tennessee, USA
Ilya Girson, University of Westminster, UK
Modesta Gelbuda, Aalborg University, Lithuania
Prem Ramburuth, University of New South Wales, Australia
Tania Casado, University of São Paulo, Brazil
Ana Maria Rossi, Clinica De Stress E Biofeedback, Brazil
Malika Richards, Pennsylvania State University – Berks, USA
Cheryl Van Deusen, University of North Florida, USA
Ping-Ping Fu, Chinese University of Hong Kong, China
Paulina Man Kei Wan, Lingnan University, Hong Kong
Moureen Tang, Lingnan University, Hong Kong
Chay-Hoon Lee, Keppel Offshore and Marine, Singapore
Ho-Beng Chia,, National University of Singapore, Singapore
Yongquin Fan, Nanjing Technical University, Singapore
Alan Wallace, retired, USA
Running head: 21st century individual and societal values
21st Century Values 3
A 21st Century Assessment of Values across the Global Workforce
ABSTRACT
This paper provides current Schwartz Values Survey (SVS) data from samples of business managers and
professionals across 50 societies that are culturally and socio-economically diverse. We report the society
scores for SVS values dimensions for both individual-level and societal-level analyses. At the individual-
level, we report on the ten circumplex values sub-dimensions and two sets of values dimensions
(collectivism and individualism; openness to change, conservation, self-enhancement, and self-
transcendence). At the societal -level, we report on the values dimensions of embeddedness, hierarchy,
mastery, affective autonomy, intellectual autonomy, egalitarianism, and harmony. For each society, we
report the Cronbach’s α statistics for each values dimension scale to assess their internal consistency
(reliability) as well as report interrater agreement analyses to assess the acceptability of using aggregated
individual level values scores to represent country values. We also examined whether societal
development level is related to systematic variation in the measurement and importance of values. Thus,
the contributions of our evaluation of the SVS values dimensions are two-fold. First, we identify the SVS
dimensions that have cross-culturally internally reliable structures and within-society agreement for
business professionals. Second, we report the society cultural values scores developed from 21st century
data that can be used as macro-level predictors in multi-level and single-level international business
research.
Keywords: cultural values, international management, Schwartz Values Survey

21st Century Values 4
A 21st Century Assessment of Values across the Global Workforce
The purpose of this paper is to report on the Schwartz Values Survey (Schwartz, 1992, 1994a, 2006)
which has become an increasingly prevalent personal and cultural values instrument in business ethics
and international business research (Knafo et al., 2011). At the individual level, the SVS has been used to
study the influence of personal values orientations on: moral behavior (Bond and Chi, 1997), attitudes
towards corporate social responsibility (Shafer et al., 2007), pro-environmental attitudes and behavior
(Nordlund and Garvill, 2002; Schultz et al., 2005; Schultz and Zelezny, 1998, 1999), fair trade
consumption (Doran, 2009), trust in institutions (Devos et al., 2002), diversity attitudes (Feather, 2004;
Sawyerr et al., 2005), and gender differences (Prince-Gibson and Schwartz: 1998; Schwartz and Rubel,
2005). At the societal level, SVS-based cultural values have been used to study cross-national differences
in moral inclusiveness (Schwartz, 2007), corporate governance (Licht et al., 2005), democratization and
social attitudes (Schwartz, 2006), work ideologies (Schwartz, 1999), allocation of rewards in
organizations (Fischer et al., 2007), and cultural distance in international trade (Ng et al., 2007).
In addition to the Schwartz Values Survey, there are other cultural values frameworks and measures
with perhaps the three best known being those developed by Hofstede (1980, 2001), the GLOBE project
(House et al., 2004), and Inglehart’s (1997) World Values Survey. Hofstede’s cultural values dimensions
were initially derived from 1967-73 surveys of IBM employees in 40 countries and extended in 1982 to
include 50 countries and three regions. Hofstede’s cultural values have been used in studies on a diversity
of topics such as business ethics and corruption (e.g., Husted, 1999, 2000, Scholtens and Dam, 2007),
environmental performance (Husted, 2005; Peng and Lin, 2009), and personal moral philosophy and
ethical attitudes (Forsyth et al., 2008; Franke and Nadler, 2008). The GLOBE societal values dimensions
(House et al., 2004) substantially followed the Hofstede values framework with an expanded set of seven
values and practices. Based on 1995-97 surveys of middle managers in 62 societies, GLOBE values
scores for 60 societal cultures have been used in cross-national studies of corruption and bribery (e.g., Li
et al., 2008; Martin et al., 2007; Parboteeah et al., 2005) and organizational commitment (Fischer and
Mansell, 2009).The World Values Survey societal-level cultural values are derived from general
21st Century Values 5
population surveys in 97 countries (Inglehart , 1997) and have been used to study societal attitudes related
to modernization and democratization (e.g., Inglehart and Welzel, 2005, 2010) and cross-national
differences in personal moral philosophy (Forsyth et al., 2008). In the international business literature,
there have been conceptual and methodological critiques of the cultural values frameworks developed by
Hofstede (e.g., McSweeney, 2002; Oyserman et al., 2002) and the GLOBE project (e.g., Hofstede, 2010;
Peterson and Castro, 2006; Taras, Steel and Kirkman, 2010; Tung and Verbeke, 2010).
However, our purpose is not to debate the relative merits of these alternative options to the SVS in the
study of values. Instead, our purpose is to report data on the SVS which we believe is a sound
theoretically grounded measure to cross-culturally assess values at the individual-level. Based on subsets
of 220 samples (university students and primarily schoolteachers) in 73 countries (Schwartz , 2006),
Schwartz and colleagues have conducted a number of studies to validate the structure of individual-level
and societal-level values models (e.g., Fischer et al., 2010; Schwartz, 1992, 1994a, 2006; Schwartz and
Boehnke, 2004). As will be discussed later in this paper, the internal consistency (scale reliability) of the
derived SVS values measures for different individual samples has not been comprehensively reported,
and often only pooled sample reliabilities have been published. For international business researchers
considering using the SVS instrument in their studies, there are two essential questions to be addressed.
First, how internally consistent are the SVS values measures for samples other than university students
and primarily schoolteachers? Second, how well do the SVS values measures perform in different societal
contexts? For international business researchers considering using Schwartz’s societal-level cultural
values scores in macro-level or multilevel research, one challenge is that country values scores have
changed over time and reported differently for samples (Licht et al., 2007; Schwartz, 1994a; Schwartz and
Bardi, 1997; Schwartz and Ros, 1995).
In this paper, we address these concerns by reporting scores for the individual-level and societal-level
values dimensions of the Schwartz Values Survey (Schwartz, 1992) for 50 societies based on samples of
managers and professionals in the workforce. All data were collected between 2000 and 2008. In addition,
all respondents were born, raised for the majority of their childhood/adolescence (first 15 years), and live
21st Century Values 6
in the countries where they were sampled. Respondents who did not meet these criteria were excluded
from the dataset. This important cultural demographic was not considered in the development of cultural
values scores by Hofstede (1980, 2001) or the GLOBE project (House et al., 2004). Thus, the respondents
in our society samples clearly reflect the values of the societal culture that they are representing. For each
Schwartz Values Survey (SVS) dimension, we report the raw mean scores, within-subject standardized
mean scores, and rankings based on the standardized means for societies. We present analyses of the
internal consistency of measures and the level of within-group agreement to support the use of aggregated
values scores for societies. We also investigate the extent to which the internal consistency, within-society
agreement, and importance of these three sets of values are related to societal context, i.e., level of
socioeconomic development, polity, and governance.
The contributions of this paper are twofold. First, we assess the construct reliability (using
Cronbach’s α) of various SVS values dimensions across 50 societies for a different sampled population
(businesspersons) than the samples (university students and schoolteachers) used to construct these values
dimensions (Schwartz, 1992, 1994a, 1994b, 1999, 2006). As such, we provide evidence regarding the
cross-cultural generalizability of various SVS values dimensions for the segment of national populations
who are of most interest to international business and comparative management researchers. Second, for
those SVS dimensions that do work well, we provide researchers with 21st century data to use as reference
points and/or predictor variables in single-level and multi-level studies of other IB phenomena. In sum,
the primary contribution of this paper is providing society values data that should prove helpful to an
array of colleagues engaged in international business research.
In the remainder of this paper, we first present a summary overview of the development of the
Schwartz Values Survey and review how it has been utilized to develop various individual-level and
societal-level values frameworks. Our review includes societal context factors that may influence the
measurement and importance level of the SVS values dimensions. We then describe the methodology to
assess the internal consistency of the SVS values dimensions for our 50-society sample of business
managers and professionals. Following the presentation of results, we provide an interpretation of

21st Century Values 7
findings with recommendations for future research.
An Overview of the Evolution and Development of the SVS
While certainly not the first to study individual values, Rokeach (1973) has been credited as being the
‘Father of values research’ due to the significant contribution that he made to this field of study. From his
body of work in the area of individual values emerged the 36-item Rokeach Values Survey (RVS)
measuring 18 terminal (end states) goals and 18 instrumental (means of behavior) goals (Rokeach, 1967).
For cross-cultural researchers, a key limitation of the RVS is that the development and validation of the
RVS was confined to the U.S. In response to this limitation, Schwartz and Bilsky (1987, 1990) led the
way by adapting the RVS from a U.S.-based measure to one that can be used cross-culturally. They also
drew on the work of the Chinese Culture Connection (1987) who developed the Chinese Values Survey
(CVS) to reflect the unique cultural values of East Asian societies. Their efforts ultimately resulted in the
56-item Schwartz Values Survey (SVS), with one item later added. Table 1 presents the 57 SVS items,
the 36 RVS items, and the 40 CVS items. The present study uses the 45 SVS items found valid for cross-
cultural comparisons (Schwartz, 1992, 1994b) and which are identified in bold italic font in the table. Of
these 45 cross-culturally valid SVS items, 35 items came from the RVS and/or CVS, with the other 10
items being unique to the SVS.
Insert Table 1 about here
The SVS items have been used to identify values dimensions at both the individual-level (Schwartz,
1992, 1994b, 2005; Schwartz and Boehnke, 2004; Schwartz and Sagiv, 1995) and the societal-level
(Schwartz, 1994a, 1999, 2006). In the remainder of this section, we describe the structures of both the
individual-level and societal-level SVS dimensions, and discuss previous validation studies.
At the individual-level, there are 10 values sub-dimensions: power, achievement, hedonism,
stimulation, self-direction, universalism, benevolence, tradition, conformity and security. Using a 20-
country sample and smallest space analysis (a form of multidimensional scaling), Schwartz (1992)
initially determined a modified quasi-circumplex model structure with tradition values being peripheral to
21st Century Values 8
conformity values. This theorized values model structure representing a motivational continuum has been
generally supported in subsequent studies using multidimensional scaling and other exploratory methods
with university student and schoolteacher from up to 67 nations (e.g., Bardi and Schwartz, 2003; Fontaine
et al., 2008; Schwartz, 2005; Schwartz and Sagiv, 1995) as well as by Schwartz and Boehnke’s (2004)
confirmatory factor analysis using aggregated samples from 27 countries. However, Perrinjaquet et al.’s
(2007) multi-group CFA model validation study using French and Swiss general population samples
found weak construct and discriminant validity for the 10 values model. Further, Fontaine et al. (2008) 38
country study found systematic patterning of inequivalence in values model structures with structural
deviations from the overall structure being smaller for student samples than for teacher samples, and
negatively related to societal development level.
Schwartz and colleagues have generally reported the internal consistency of the 10 SVS values scales
in terms of aggregated country samples and ranges. For instance, Schwartz (2005) reported that for a
dataset consisting of 212 samples, the range of Cronbach’s α was .61 (tradition) to .75 (universalism) with
an average of α = .68. For their 64-country sample of university students, Schwartz and Rubel (2005)
reported a range of α = .55 (tradition) to .73 (universalism) with an average of α = .67. However, Spini’s
(2003) finding of scalar and reliability inequivalence for the 10 SVS values (tested separately) using
student samples from 21 countries indicates cross-national variation in the internal consistency of these
measures. Whereas Perrinjaquet et al. (2007) found that the tradition values measure had low scale
reliabilities for French and Swiss general population samples (respectively, α = .41, α = .52), the tradition
values measure had an acceptable reliability (α = .62) for Australian students (Feather, 2004).
The SVS values sub-dimensions have been classified into two sets of individual-level higher-order
values dimensions. One set of two higher-order individual-level dimensions consists of collectivism
(benevolence, tradition, and conformity) and individualism (power, achievement, hedonism, stimulation,
and self-direction) (see Ralston et al., 2008). The other set of four higher-order values are aligned as two
bi-polar dimensions in the Schwartz values model: openness to change (stimulation and self-direction)
versus conservation (conformity, tradition, and security), and self-enhancement2 (power, achievement,
21st Century Values 9
and hedonism) versus self-transcendence (universalism and benevolence) dimensions (Schwartz, 1992,
1994b). Empirical support for partitioning the Schwartz values model into alternative higher-order values
dimensions has been found in model validation studies (Fontaine et al., 2008; Perrinjaquet et al., 2007;
Schwartz and Boehnke, 2004; Schwartz and Sagiv, 1994). Cross-cultural research using higher-order
values dimensions have generally reported acceptable Cronbach’s α for individual countries ranging from
.57 (openness to change) to .86 (self-transcendence) (Schultz and Zelezny, 1998), and all six dimensions
above .66 (Ralston et al., 2008).
At the societal-level, the SVS items have been allocated to seven types of cultural values dimensions
that form three higher-order dimensions in a circumplex model (Schwartz, 1994a, 1999, 2006). These
societal-level values dimensions relate to the basic societal issues of: relations between the individual and
group (embeddedness1 vs. affective autonomy/intellectual autonomy); the assurance of responsible social
behavior (hierarchy vs. egalitarianism); and humankind’s role in the social and natural world (mastery vs.
harmony). The initial model validation study (Schwartz, 1994a) was based on student and teacher data
from 38 countries (1988-92) and used the following procedure. First, the mean ratings for the 45 values
items were calculated for each country sample, and then sample level item correlations were calculated
for the MDS analyses to determine the pattern of intercorrelations among values across countries that
identified the seven cultural values dimensions. To account for cultural differences in scale use, country
values dimension scores were adjusted by the difference between the country mean for all SVS items and
the approximate international mean (4.00). This cultural values model structure was confirmed in
Schwartz’s (1999) replication study with additional 1993 samples (students from 40 countries and
teachers from 44 countries) that developed country cultural profiles of the relative importance of various
cultural values for each country. Similar model validation procedures have been used in more recent SVS
studies with larger datasets of 70 and 72 cultural groups in 67 countries (respectively, Schwartz, 2006,
2009). To support the aggregation of student and teacher subsamples, Schwartz (2006) reports within-
country correlation analyses between various demographic subsamples (e.g., students vs. teachers,
gender, and age group). Later studies have calculated country-level cultural values scores using within-
21st Century Values 10
subject mean-centered SVS items (Schwartz, 2006), and within-group (country) mean-centered scores
(Licht et al., 2007).
Schwartz and colleagues (Schwartz, 1994a, 1999, 2006; Fischer et al., 2010) have consistently found
support for his theorized cultural values model using MDS exploratory analytic techniques. However, the
internal consistency of the societal-level dimensions at country and individual levels has not been
reported. Tentative support for the aggregation of individual-level SVS data to culture values scores was
provided by Fischer et al.’s (2007) 6-country study that found the average interrater agreement statistic
across all items and countries was .57 (awg) for employee samples. Societal-level culture values
dimensions scores have been published for different subsets of student and teacher samples (Schwartz,
1994a; Schwartz and Bardi, 1997; Schwartz and Ros, 1995) with the most inclusive being scores for
teacher samples in 51 countries based on 1988-98 data collections (Licht et al., 2007). Differences in
country-level scores and relative country rankings between early and more recent publications could be
attributed to changes in scale items for five of the seven dimensions (e.g., Schwartz, 1999, 2006) and
changes in calculating adjustments for cross-cultural differences in response style.
Systematic Variation in the Measurement and Importance of SVS Values Dimensions
Previous research indicates that there is systematic cross-national variation in the measurement
properties of and importance accorded to various SVS values dimensions. As earlier mentioned, Fontaine
et al. (2008) found that societal development level (socioeconomic and socio-political) was positively
related to the validity of the 10 values sub-dimensions model. Schwartz and Sagie (2000) also showed
that in general, socioeconomic development and democratization are positively related to the importance
accorded to the values in the openness to change and self-transcendence dimensions (plus hedonism) but
negatively related to the importance of conservation and self-enhancement values (nonsignificant for
achievement).
Using reflect scores for the bipolar societal-level dimensions, Schwartz (2006) found that both
socioeconomic development and democratization were positively related to autonomy vs. embeddedness,
and egalitarianism vs. hierarchy values. Whereas the harmony vs. mastery dimension was positively
21st Century Values 11
related to socioeconomic development, there was no significant relationship with democratization. Licht
et al. (2007) identified that societal governance (rule of law, non-corruption, voice and accountability) is
positively related to affective autonomy, intellectual autonomy, and egalitarianism; and negatively related
to embeddedness and hierarchy. Only the governance facet of voice and accountability had a significant
relationship with harmony (positive) and mastery (negative) values.
METHODS
Samples
The 50 societies included in this study are identified in Table 2. We present the sample descriptive
information of individual (age and gender) and organizational (respondent position, company size and
industry) demographics for each society. The society samples range in size from 70 to 350 respondents.
When we had more than 350 respondents for a society, we used SPSS random sampling to select 350
respondents in order to have reasonably similar sample sizes across societies.
Insert Table 2 about here
All respondents were raised in the society which they represented. All respondents were part of the
business community of their country. Data were collected either through a mail survey or prior to
management/employee development programs. While differing modes of data collection were used, in
order to maintain sampling integrity and consistency across samples, all respondents were provided
anonymity, were voluntary participants in the survey, and were instructed that there were no right or
wrong answers.
In respect to previous SVS-based values model validation studies, for studies concerned with the
individual-level values model, our sample has 27 of the 38 countries in Fontaine et al.’s (2008) study, and
17 of the 27 countries in Schwartz and Boehnke’s (2004) study. For the societal-level values dimensions,
we have 41 societies in common with Schwartz’s (2006) 72-country validation study using combined
university student and teacher data; and 34 countries in common with Licht et al.’s (2007) 51-country
teacher sample scores. In respect to geographic representation, the Schwartz studies (Licht et al., 2007;
21st Century Values 12
Schwartz, 2006) generally have more samples from countries in Europe and Africa, whereas the present
study has more samples from countries in the Middle East region. Compared to other cultural values
frameworks, 36 of our societies are represented in the GLOBE project (House et al., 2004), 45 societies in
the World Values Survey (Inglehart and Welzel, 2005), and 48 societies in Hofstede (2001).
Instrument and Measures
All respondents completed the questionnaire in their native language, with the exception of India
where the English-language survey was used, per the norm for India. We used standard translation–back-
translation procedures for each society’s survey questionnaire (Brislin, 1970). This involved one
individual translating the questionnaire from English to the other language, and then a second individual
back-translating the questionnaire into English. The two translators resolved any translation differences,
and employed a third party to assist when necessary.
Items. The Schwartz Values Survey initially consisted of 56 items, of which 45 are considered cross-
culturally valid (Schwartz, 1992, 1994b). Although a 57th item was later added to expand the Hedonism
dimension from two to three items (Schwartz and Boehnke, 2004), we did not include this 57th SVS item
for the sake of consistency, since some of our samples were collected prior to this addition to the SVS
instrument (per Fischer et al., 2010). Thus, our analyses are based on the 45 cross-culturally valid items
identified in the 56-item instrument (Schwartz, 1992).
Per Schwartz (1994a), instructions to respondents for completing the SVS were as follows:
In this questionnaire you are to ask yourself: "What values are important to ME as guiding
principles in MY life, and what values are less important to me?" There are two lists of
values on the following pages. These values come from different cultures. In the
parentheses following each value is an explanation that may help you to understand its
meaning.
Please rate how important each value is for you as a guiding principle in your life. Use the
rating scale below:
0--means the value is not at all important, it is not relevant as a guiding principle for you.
3--means the value is important.
6--means the value is very important.
The higher the number (0,1,2,3,4,5,6), the more important the value is as a guiding
principle in YOUR life.
21st Century Values 13
-1 is for rating any values opposed to the principles that guide you.
7 is for rating a value of supreme importance as a guiding principle in your life; ordinarily
there are no more than two such values.
In the space before each value, write the number (-1,0,1,2,3,4,5,6,7) that indicates the
importance of that value for you, personally. Try to distinguish as much as possible
between the values by using all the numbers. You will, of course, need to use numbers
more than once.
As previously noted, the SVS items have been allocated to values dimensions in different ways for
individual-level and societal-level dimension scales.
Individual-level values dimensions. The individual-level Schwartz values model identifies ten sub-
dimensions which are then used to form two alternative sets of higher-order dimensions (Schwartz, 1992,
1994b; Schwartz and Boehnke, 2004; Schwartz and Sagiv, 1994). The ten individual-level values sub-
dimensions consist of: power (4 items), achievement (4 items), hedonism (2 items), stimulation (3 items),
self-direction (5 items), universalism (8 items), benevolence (5 items), tradition (5 items), conformity (4
items) and security (5 items). Appendix A provides the description and item allocation for the ten values
sub-dimensions.
The allocation of the ten values sub-dimensions to higher-order values dimensions are as follows. In
the Schwartz values model, the first set of two higher-order individual-level dimensions are: collectivism
(benevolence, tradition, and conformity; 14 items) and individualism (power, achievement, hedonism,
stimulation, and self-direction; 18 items) (Ralston et al., 2008).The second set of four higher-order
dimensions are: openness to change (stimulation and self-direction; 8 items), conservation (conformity,
tradition, and security; 14 items), self-enhancement (power, achievement, and hedonism; 10 items), and
self-transcendence (universalism and benevolence; 13 items). Appendix B provides descriptions of these
higher-order dimensions.
Societal-level values dimensions. The societal-level values model consists of seven values
dimensions: embeddedness (15 items), hierarchy (4 items), mastery (8 items), affective autonomy (4
items), intellectual autonomy (4 items), egalitarianism (6 items), and harmony (4 items) (Schwartz, 2006).
Appendix C provides the description and item allocation for the seven societal-level dimensions.
21st Century Values 14
Analyses
For each values dimension identified in the previous section, we report the raw mean score and the
scale reliability (Cronbach’s α) statistic by society. Systematic cross-cultural differences in scale response
styles (e.g., extreme, mid-point, acquiescence, and disacquiescence response biases) may result in raw
observed scores being unrelated to the true score of an individual (Fischer, 2004; Harzing, 2006; Johnson
et al., 2005). Therefore, we also present the within-subject standardized means and identify the rank-order
for each society based on the standardized means. The procedure for calculating the within-subject
standardized scores (ipsatization) was as follows. For each individual respondent, the overall mean and
standard deviation across all SVS items were calculated. Then, individuals’ scores for each values
dimension were converted to within-subject standardized scores using the following equation: y’ = (x –
µindividual) / σindividual where, y’= within-subject standardized score for a values dimension, x = individual’s
raw score for a values dimension, µindividual = individual’s overall mean score for all SVS items, and
σindividual = individual’s overall standard deviation of item scores for all SVS items. The resulting
standardized score represents the relative importance of a values dimension for an individual (positive or
negative) with the mean across variables averaging to zero. For the 50 societies in this study, we
calculated the society rank order based on the standardized scores for each set of values dimensions (1 =
highest to 50 = lowest).
The individual society data for the SVS values dimensions’ means, Cronbach’s α statistics,
standardized means, and rank-order of standardized means are provided in Appendices D, E, and F. To
justify aggregating individual-level data for the use of society-level scores in research, within-group
interrater agreement needs to be established (cf Fischer et al., 2009; LeBreton and Senter, 2008). Hence,
we estimated Brown and Hauenstein’s (2005) awg(J) interrater agreement (IRA) statistic for the values
dimensions (using scale item raw scores) for each society. We calculated the society mean, standard
deviation, and range of the awg(J) statistics, as well as distribution of acceptability levels. Whereas Brown
and Hauenstein (2005) recommended an awg(J) > .70 as the cutoff for acceptable level of IRA, Fischer et
21st Century Values 15
al. (2007) proposed that the agreement level cutoff of .60 or higher suggested for small group research is
too stringent for nation-level samples. Further, LeBreton and Senter (2008) proposed revised standards
for interpreting IRA estimates with .71 or higher representing strong agreement, .51 to .70 representing
moderate agreement, .31 to .50 representing weak agreement, and .30 or less representing a lack of
agreement. Given this disparity in recommended IRA cutoffs, we used the following categories for awg(J)
levels: strong agreement (.70 or higher), moderate agreement ( subdivided into .60 to .69, and .51 to .59),
weak agreement (.31 to .50), and lack of agreement (.00 to .30). Society measures with IRA levels
generally viewed as unacceptable (.50 and less) are identified in Appendices D to F with bold italic font
for mean (raw) scores.
Correlation Analyses. We conducted correlation analyses to examine relationships between societal
context (socioeconomic development, polity, and societal governance) and the scale reliability, within-
group agreement, and importance scores of the three sets of values dimensions. Socioeconomic
development was measured by the United Nations’ Human Development Index (http://hdrstats.undp.org/)
which is a composite index based on life expectancy, educational attainment, and GDP per capita
(purchasing power parity). Polity (democratization) was measured using the Polity IV composite measure
(Marshall et al., 2010) which rates countries on a scale of strongly autocratic (-10) to strongly democratic
(+10). Polity ratings are not provided for Hong Kong and Macau so a reduced sample (N = 48) was used
for this analysis. Societal governance was measured by the World Bank’s Worldwide Governance
Indicators (www.worldbank.org/wbi/governance) that consist of six dimensions (voice and accountability,
political stability, government effectiveness, regulatory quality, rule of law, and control of corruption).
Following Globerman and Shapiro (2003), we conducted a principal component analysis for estimates for
the six dimensions and used the score for the one identified factor (Eigenvalue = 5.23, 87% variance
explained). For each measure, we used the scores for the year each society’s data was collected.
RESULTS
Internal Consistency of the Values Sub-dimensions and Dimensions Measures
Table 3 presents the 50-society summary analyses of scale reliabilities (Cronbach’s α) for the
21st Century Values 16
individual-level and societal-level values dimension. We present the means, standard deviations, and
range of scale reliabilities, as well as the distribution of society scale reliabilities in three categories of
acceptability with α > .70 denoting the general threshold of acceptability, .69 > α > .60 denoting
acceptable reliabilities for exploratory research, and α < .59 as unacceptable reliabilities (Hair et al.,
1998). The individual society results of the scale reliability analysis (mean, range, and number of reliable
scales using the α > .60 cutoff) for the individual-level and societal-level measures are presented in Table
4. In the remainder of this section, we use both sets of data to present our findings for each set of SVS
values measures.
Insert Tables 3 and 4 about here
Individual-Level Values Sub-dimensions. As shown in Table 3, the average scale reliability for the 50
societies across the 10 values sub-dimensions ranged from α = .52 for hedonism to α = .77 for
universalism, with the remaining values dimensions averaging between α = .60 and α = .66. The 2-item
hedonism scale was problematic with 68% of the societies having scale reliabilities below .59 and only
6% being .70 or higher3. Other sub-dimensions with a substantial number of unacceptable scale
reliabilities were security (48%), self-direction (38%), and tradition (48%).
Examination of the individual society results in Table 4 shows that there were acceptable scale
reliabilities for all 10 SVS values sub-dimensions for 8 societies (Canada, Germany, Lebanon, Macau,
Peru, South Africa, Turkey, and UK). For an additional 32 societies, the majority of these measures were
reliable (9 scales for 7 societies, 8 scales for 8 societies, and 7 scales for 12 societies, 6 scales for 5
societies). For 10 societies, five or fewer sub-dimensions had acceptable scale reliabilities. None of these
10 measures had acceptable scale reliabilities for Egypt, only one scale was reliable for Algeria, and two
were reliable for Malaysia and the UAE. Three societies had four reliable measures (Cuba, Spain, and
Thailand) while another three societies had five reliable measures (Bulgaria, China, South Korea).
Individual-Level Values Dimensions. We assessed the scale reliabilities for two sets of individual-
level values dimensions. As shown in Table 3, both collectivism and individualism were highly reliable
21st Century Values 17
measures across the 50 societies with average alpha values of .82 and .84, respectively. For all societies,
these two measures had acceptable scale reliabilities with the lowest being α = .73 for collectivism and α
= .69 for individualism. In respect to the second set of individual-level values dimensions, the scale
reliabilities for openness to change, conservation, self-enhancement, and self-transcendence are at
acceptable levels across the 50 societies with average Cronbach’s α values of .74, .80, .78, and .82,
respectively. For both conservation and self-transcendence values, all society scale reliabilities were in
the acceptable range (i.e., .69 or higher for conservation, .64 or higher for self-transcendence). The large
majority of societies had acceptable scale reliabilities for openness to change (94%) and self-enhancement
(96%). The individual society results in Table 4 show that Egypt and the UAE had unacceptable scale
reliabilities for both the openness to change and self-enhancement dimensions, and that Algeria also had
an unacceptable scale reliability for the openness to change dimension. In sum, these analyses indicate
that the higher-order values dimensions are consistently much more reliable measures than the values sub-
dimension measures.
Societal-Level Values Dimensions. There were mixed results for the seven societal-level values
dimensions of embeddedness, hierarchy, mastery, affective autonomy, intellectual autonomy,
egalitarianism, and harmony. As shown in Table 3, the average scale reliability for the 50 societies across
these seven values dimensions ranged from unacceptable levels for hierarchy (α = .51) and intellectual
autonomy (α = .56) to acceptable levels for the others.3 The embeddedness measure (α = .81) was reliable
for all 50 societies (α > .70), whereas only two societies had unacceptable scale reliabilities for the
egalitarianism (Egypt, UAE), mastery (Egypt, Thailand) and harmony (Egypt, UAE) measures. For the
affective autonomy measure, 80% of societies (40) had acceptable scale reliabilities. The hierarchy scale
was problematic with only 18% of societies having acceptable scale reliabilities. The intellectual
autonomy dimension was marginal with only 48% of the societies having acceptable scale reliabilities.
Table 4 identifies that six societies (Australia, Canada, Costa Rica, Hong Kong, Peru, and Taiwan)
had acceptable scale reliabilities for all seven societal-level values dimensions. For 35 societies, the
majority of these measures were reliable (6 scales for 19 societies and 5 scales for 16 societies). Marginal
21st Century Values 18
results were obtained for six societies which had four reliable measures. This set of dimension measures
were not supported for three societies with only three reliable scales for Thailand, and two reliable scales
for Egypt and the UAE. In sum, these results indicate that across the 50 societies in this study, the most
reliable societal-level values dimensions are egalitarianism, embeddedness, harmony, and mastery, with
affective autonomy having variable reliability. We found the hierarchy and intellectual autonomy scales
to be generally unreliable measures.
In that Schwartz (2006) developed the societal-level dimensions using country-level mean item scores
(within-subject centered), we also calculated scale reliabilities using society means of the within-subject
standardized item scores (N = 50). These analyses yielded scale reliabilities that were lower than the 50-
society average reliabilities: embeddedness (α = .60), hierarchy (.49), mastery (.20), affective autonomy
(.33), intellectual autonomy (.50), egalitarianism (.67), and harmony (.64). Examination of the item
intercorrelations showed negatively correlated items for the hierarchy, affective autonomy, intellectual
autonomy, and mastery measures.
Within-Society Agreement for the Values Sub-dimensions and Dimensions Scores
Table 5 provides the summary results of analyses examining the within-society interrater agreement
statistics (awg(J)) for each set of values sub-dimensions and dimensions. Per Brown and Hauenstein (2005)
and LeBreton and Senter (2008), acceptable levels of interrater agreement (IRA) are generally considered
to be .60 or higher.
For the 10 individual-level sub-dimensions, the 50-society average awg(J) statistics ranged from .53
(tradition) to .68 (benevolence) with the average across items and societies being .61. Measures that had
relatively more unacceptable IRA levels (i.e., awg(J) < .50) were tradition (38% of societies), power (26%),
stimulation (18%), security (14%), and hedonism (12%). Of the 50 societies, 52% had acceptable IRA
levels (awg(J) > .51) for all 10 sub-dimensions, with an additional 42% having between 6 and 9 sub-
dimensions with acceptable IRA levels. Societies with a low number of sub-dimensions with acceptable
IRA levels included: Algeria (0), Bulgaria (4), and Venezuela (5).
For the first set of two individual-level values dimensions, the average awg(J) statistic was .61, and
21st Century Values 19
90% of societies had acceptable IRA levels for both collectivism and individualism. For the second set of
individual-level values dimensions, the range of awg(J) statistics was .58 (conservation) to .64 (self-
transcendence). Measures with relatively more unacceptable IRA levels were conservation (16% of
societies) and self-enhancement (12% of societies). Of the 50 societies, 82% had acceptable IRA levels
for all four of these dimensions, and 8% had 3 dimensions with acceptable IRA levels. Across both sets of
values dimensions (6 dimensions in total), societies with a low number of acceptable IRA levels included:
Algeria (0), Bulgaria (2), Mexico (2), and Venezuela (3).
For the 7 societal-level values dimensions, the range of awg(J) statistics was .56 (hierarchy) to .65
(egalitarianism, intellectual autonomy) with the average across items and societies being .61. Measures
with relatively more unacceptable IRA levels were hierarchy (24%), harmony (14%), and affective
autonomy (12%). Of the 50 societies, 70% had acceptable IRA levels for all 7 dimensions, and 18% had 6
dimensions, and 6% had 5 or 4 dimensions with acceptable IRA levels. Societies with a low number of
values dimensions with acceptable IRA levels included: Algeria (0), Venezuela (2), and Mexico (3).
In sum, these IRA results provide general support for the aggregation of individual-level dimension
scores to the society level and other researchers’ use of the scores presented in this paper. However, it
should be noted that scores for Algeria and to a lesser extent Bulgaria, Mexico, and Venezuela, should be
regarded with caution.
Insert Table 5 about here
Societal influences on scale reliabilities, within-group agreement, and values scores
Table 6 presents results of correlation analyses examining relationships between three facets of
societal development (socioeconomic, polity, and governance) and the reliability, within-group
agreement, and importance scores for the three sets of values dimensions. On average, the reliability of
the individual-level values sub-dimension measures was positively related to socioeconomic development
(r = .36, p < .05; 5 sub-dimensions significant), polity (r = .49, p < .001; 8 sub-dimensions significant),
and governance (r = .33, p < .05; 5 sub-dimensions significant). Societal development had the most
21st Century Values 20
influence on the scale reliabilities for the five measures of power, achievement, hedonism, stimulation,
self-direction values, and was unrelated to the reliability of the benevolence and tradition measures. For
the remaining values, polity was positively related to the reliability of the universalism, conformity and
security measures, while governance was positively related to the reliability of the conformity measure.
For the six individual-level values dimensions, on average, scale reliability was significantly related to
polity level (r = .50, p < .001; 5 dimensions significant) but not to socioeconomic development or
governance (respectively, r = .20, 1 dimension significant; r = .20, two dimensions significant). For the
seven societal-level dimensions (excluding the revised hierarchy scale), on average, scale reliability was
strongly related to polity (r = .51, p < .001; 6 dimensions significant) and less strongly related to
socioeconomic development and governance (respectively, r = .29, p < .05; r = .25, p < .10; both with
only affective autonomy significant). .
Insert Table 6 about here
On average, within-group interrater agreement (awg(J)) of the individual-level values sub-dimension
measures was positively related to socioeconomic development (r = .24, p < .10; 4 sub-dimensions
significant) and governance (r = .41, p < .01; 8 sub-dimensions significant), and unrelated to polity (r = -
.07, one sub-dimension marginally significant). For both the individual-level and societal-level values
dimensions, within-group agreement was strongly related to governance (respectively, r = .40, r = .42, p <
.01), and unrelated to polity (r = -.10, r = -.07). Overall, socioeconomic development was marginally
related to within-group agreement for the societal-level dimensions (r = .24, p < .10; 3 dimensions
significant) but not to the individual-level dimensions (r = .23, 2 dimensions significant).
In respect to the importance attributed to various values, we found very similar results for the total
sample (N=50) and for the reduced samples of societies that had acceptable levels of scale reliability and
within-group interrater agreement. Similar results were also found across the three facets of societal
development (socioeconomic development, polity, governance). In respect to the individual-level values
sub-dimensions, societal development level is generally positively related to the importance of hedonism,
21st Century Values 21
self-direction, and benevolence values; negatively related to power, tradition, and conformity values, and
unrelated to achievement, stimulation, universalism, and security values. Overall, these findings are
consistent with those of Schwartz and Sagie (2000) with the exception that they found significant positive
correlations for stimulation and universalism.
For the individual-level values dimensions, societal development is positively related to the
importance individualism, openness to change, and self-transcendence values; and negatively related to
collectivism and conservation values. The nonsignificant correlations for self-enhancement values can be
attributed to different findings for component sub-dimensions (negative corrrelations for power, positive
for hedonism, and nonsignificant for achievement). In respect to the societal-level values dimensions,
societal development level is positively related to the importance of affective autonomy, intellectual
autonomy, and egalitarianism values, and negatively related to the importance of embeddedness and
hierarchy values, while not significantly related to mastery and harmony values. These findings are
consistent with those of Licht et al. (2007) for three facets of societal governance with two exception
(voice and accountability was negative related to mastery and positively related to harmony).
DISCUSSION AND CONCLUSIONS
Whereas the Schwartz Values Survey was developed and validated with samples consisting primarily
of university students and schoolteachers (e.g., Schwartz, 1992, 1994b, 2006; Schwartz and Boehnke,
2004), the samples for this study consisted entirely of business professionals. Given the number of
dimensions for which we did not find support with our business professionals data, we also note that
previous research has shown substantive differences between students and business professionals that
draws into question the use of students as surrogates for business professionals in international business
research (Bello et al., 2009). As such, our data and findings provide a potentially more accurate view of
the SVS values dimensions for studying professional workforces around the world.
Our analyses using samples of business managers and professionals in 50 societies yielded mixed
support for the internal consistency of the SVS values dimension measures articulated by Schwartz and
his colleagues (e.g., Schwartz, 1992, 1994a, 1994b, 1999, 2006; Schwartz and Boehnke, 2004; Schwartz
21st Century Values 22
and Sagiv, 1994). Of the 10 individual-level sub-dimensions, we found a high level of cross-national
internal consistency for the universalism measure, and acceptable reliabilities for another five sub-
dimensions (power, achievement, stimulation, benevolence, and conformity) for 74% or more of the
societies. Consistent with previous SVS cross-national research (e.g., Perrinjaquet et al., 2007; Schwartz
2005, Schwartz and Rubel, 2005), the tradition measure had low reliabilities for a substantial proportion
of societies (38%). In addition, our findings indicate substantial cross-national variation in the internal
consistency of the self-direction and security measures, and that the hedonism measure, in both its two
item and three item forms, is a generally unreliable measure (Spini, 2003). These findings bring into
question the validity of the 10-values circumplex model (Schwartz, 1992) for business professionals
samples that are more demographically and occupationally diverse than the student and schoolteacher
samples that were used to develop this values model (cf Fontaine et al., 2008). Thus, an implication of
these findings for future business research is that cross-national individual-level research based on the full
set of 10 values sub-dimensions is a relatively high risk proposition. The individual society results
showed that there were only eight societies for which all 10 sub-dimensions had high enough scale
reliabilities for statistical analyses. However, researchers may be interested in testing relationships for a
subset of these values sub-dimensions, especially if survey questionnaire length is a concern. As such, our
individual society results provide guidance as to which are the more internally consistent measures in
different societal contexts. For example, our analyses showed cross-national robustness for the
universalism value which has been found to be related to business ethics topics such as attitudes towards
CSR (e.g., Shafer et al., 2007) and environmental concern (e.g., Schultz and Zelezny, 1998, 1999).
Alternatively, our analyses identified that five values sub-dimensions (power, achievement, hedonism,
stimulation, self-direction) are less often reliable, especially in countries with lower levels of
socioeconomic and sociopolitical development.
In contrast, our analyses support the cross-national construct reliability of both sets of individual-level
higher-order values dimensions: (1) collectivism and individualism; and (2) openness to change,
conservation, self-enhancement, and self-transcendence. Of these, the collectivism and individualism
21st Century Values 23
dimensional set had the stronger support, which is a finding consistent with the importance attributed to
these dimensions in other cross-cultural values instruments (Oyserman et al., 2002). Interestingly,
although Schwartz (1992, 1994) initially conceptualized the four higher-order dimensions as a way to
more simply describe the value structure, subsequent model validation studies have identified significant
intercorrelations among the values within these higher-order groupings (e.g., Perrinjaquet et al., 2007;
Schwartz and Boehnke, 2004). One proposal from these studies is for researchers to use higher-order
values dimensions that are conceptually meaningful. Our study findings provide empirical support for this
recommendation in respect to the two sets of higher-order values dimensions that were examined.
In regards to the seven societal-level values dimensions, we found general support for the cross-
national internal consistency of four dimensions (embeddedness, mastery, egalitarianism, and harmony),
and to a lesser extent for the affective autonomy dimension. However, our analyses revealed significant
internal consistency problems for the intellectual autonomy and hierarchy dimensions, with the latter also
having unacceptable interrater agreement levels for 24% of the societies. Schwartz (1999, 2006) theorized
these two cultural values dimensions as anchors for two of the three higher-order values dimensions in the
circumplex societal values model. As such, our findings draw into question the validity of Schwartz’s
societal-level values model for working adults in the business sector. These findings for the societal-level
dimensions, in conjunction with the very positive findings for the individual-level higher-order values
dimensions, raise the question: Is there a need for a societal-level cultural values model?
Fischer et al. (2010) addressed this question using SVS student (66 countries) and teacher (53
countries) data. While they found substantial similarity between individual-level and country-level
cultural values structures, the degree of overall similarity did not attain a (near-perfect) level of structural
isomorphism indicating interchangeable structures at the two levels. Subsequent analyses found that some
of this variation was attributable to country level sample size and structural shifts in some individual
items (particularly for the teacher samples). One recommendation was that analyses with new data are
needed to confirm these findings. They also proposed testing the predictive validity (and usefulness) of
the individual-level and societal-level values constructs by conducting analyses with country scores for
21st Century Values 24
both the 10 individual-level values and the 7 societal-level cultural values in single level and multi-level
research. In this paper, we support this proposal for future research by providing a full complement of
values sub-dimension and dimension scores for 50 diverse societies. In addition to testing the relative
merits of each of Schwartz’s (1992, 2006) values models, we encourage the use of these data to
investigate a wide variety of research questions concerned with the influence of cultural values at both
individual and societal levels. In this regard, we provide preliminary findings concerning relationships
between societal context (socioeconomic development, polity, and governance) and the values
orientations of businesspersons.
Concluding Comments
We have presented a 21st century assessment of the values of business professionals across a wide
range of cultures and geographic areas. We did so by investigating the internal consistency and within-
group agreement of SVS dimensional sets to determine their appropriateness for 50 societies of interest to
international business researchers. These analyses indicate the SVS values measures that might best be
avoided when studying the values orientations of business professionals. There have been a number of
issues raised regarding other cultural values frameworks (cf Tung and Verbeke, 2010), and in respect to
previously published SVS cultural values (e.g., Licht et al., 2007; Schwartz, 1994, 2006), we identified
concerns regarding the relevance of the cultural values perspectives of students and schoolteachers for
international business research endeavours. Hence, we view an important contribution of this assessment
of work values to be the identification of the higher-order, individual-level dimensions as two sets of
measures that can be used as referencing points and predictor variables for future multi-level, as well as
single-level, cross-cultural research in international business.
21st Century Values 25
NOTES
1
Whereas Schwartz (1994a, 1999) initially labeled this societal-level values dimension as conservatism,
he subsequently changed the label to embeddedness (e.g., Schwartz, 2006). Thus, we used the term
embeddedness in this paper.
2 We followed the lead of Smith et al. (1996) by allocating hedonism to the self-enhancement dimension,
while Schwartz (1992) suggested that it could relate to both self-enhancement and openness to change.
3 For the 27 societies of this study that had the 57th item (self-indulgence), the 2-item hedonism mean
scale reliability was α = .53 (s.d. = .08) with 6 societies having scale reliabilities .60 or higher. For the
3-item hedonism scale, the mean scale reliability was α = .58 (s.d. = .10) with 12 societies having scale
reliabilities .60 or higher. For 8 societies the additional item increased the scale reliability to .60 or
higher, while for 2 societies the scale reliability decreased to less than .60.
21st Century Values 26
REFERENCES
Bardi, A. and S.H. Schwartz: 2003, ‘Values and Behavior: Strength and Structure of Relations’,
Personality and Social Psychology Bulletin 29, 1207–1220.
Bello, D., K. Leung, L. Radebaugh, R. Tung and A. Van Witteloostuijn: 2009, ‘From the Editors: Student
Samples in International Business Research’, Journal of International Business Studies 40, 361-364.
Bond, M. H. and V. M.-Y. Chi: 1997, ‘Values and Moral Behavior in Mainland China’, Psychologia 40,
251–264.
Brislin, R. W.: 1970, ‘Back-translation for Cross-cultural Research’. Journal of Cross-Cultural
Psychology 92, 185-216.
Brown, R.D. and N.M.A. Hauenstein: 2005, ‘Interrater Agreement Reconsidered: An Alternative to rwg
Indices’, Organizational Research Methods 8, 165-184.
Chinese Culture Connection: 1987, ‘Chinese Values and the Search for Culture-free Dimensions of
Culture’, Journal of Cross-Cultural Psychology 18, 143-164.
Devos, T., D. Spini and S. H. Schwartz: 2002, ‘Conflicts Among Human Values and Trust in
Institutions’, British Journal of Social Psychology 41, 481–494.
Doran, C.: 2009, ‘The Role of Personal Values in Fair Trade Consumption’, Journal of Business Ethics
84, 549-563.
Feather, N. T.: 2004, ‘Value Correlates of Ambivalent Attitude Toward Gender Relations’, Personality
and Social Psychology Bulletin 30, 3–12.
Fischer, R.: 2004, ‘Standardization to Account for Cross-cultural Response Bias: A Classification of
Score Adjustment Procedures and Review of Research in JCCP’, Journal of Cross-Cultural
Psychology 35, 263-282.
Fischer, R.: 2009, ‘Where Is Culture in Cross Cultural Research? An Outline of a Multilevel Research
Process for Measuring Culture as a Shared Meaning System’, International Journal of Cross
Cultural Management, 9, 25-29.
21st Century Values 27
Fischer, R., M.C. Ferreira, E.M.L. Assmar, P. Redford and C. Harb: 2005, ‘Organizational Behaviour
across Cultures: Theoretical and Methodological Issues for Developing Multilevel Frameworks
Involving Culture’, International Journal of Cross Cultural Management 5, 27–48.
Fischer, R. and A. Mansell: 2009, ‘Commitment Across Cultures: A Meta-analytical Approach. Journal
of International Business Studies 40, 1339-1358.
Fischer, R., P.B. Smith, B. Richey, M.C. Ferreira, M. C., E.M.L. Assmar, J. Maes and S. Stump: 2007,
‘How Do Organizations Allocate Rewards? The Predictive Validity of National Values, Economic
and Organizational Factors Across Six Nations’, Journal of Cross-Cultural Psychology 38, 3-18.
Fischer, R., C.-M. Vauclair, J.R.J. Fontaine and S.H. Schwartz: 2010, ‘Are Individual-Level and Country-
Level Value Structures Different? Testing Hofstede’s Legacy with the Schwartz Value Survey’,
Fontaine, J.R.J., Y.H. Poortinga, L. Delbeke and S.H. Schwartz: 2008, ‘Structural Equivalence of the
Values Domain Across Cultures: Distinguishing Sampling Fluctuations From Meaningful Variation’,
Journal of Cross-Cultural Psychology 39, 345-365.
Forsyth, D., E. O’Boyle and M. McDaniel: 2008, ‘East Meets West: A Meta-Analytic Investigation of
Cultural Variations in Idealism and Relativism’, Journal of Business Ethics 83, 813-833.
Franke, G. R., and S.S. Nadler: 2008, ‘Culture, Economic Development, and National Ethical Attitudes’,
Journal of Business Research 61, 254-264.
Globerman, S. and D. Shapiro: 2003, ‘Governance Infrastructure and US Foreign Direct Investment’,
Journal of International Business Studies 34, 1899-1919.
Hair, J.F., R.L. Tatham, R.E. Anderson, and W. Black: 1998, Multivariate Data Analysis, 5th ed.,
(Prentice Hall, Upper Saddle River, NJ).
Harzing, A.-W.: 2006, ‘Response Styles in Cross-national Survey Research: A 26-Country Study’,
International Journal of Cross Cultural Management 6, 243-266.
Hofstede, G.: 1980, Culture's Consequences: International Differences in Work-related Values,. (Sage
Publications, Newbury Park, CA).
Hofstede, G.: 2001, Culture's Consequences: Comparing Values, Behaviours, Institutions, and

21st Century Values 28
Organizations Across Nations (2nd ed.), (Sage Publications, Thousand Oaks, CA).
Hofstede, G.: 2010, ‘The GLOBE Debate: Back to Relevance’, Journal of International Business Studies
41, 1339-1346.
House, R.J., P.J. Hanges, M. Javidan, P.W. Dorfman, and V. Gupta (Eds): 2004, Culture, Leadership and
Organizations: The GLOBE Study of 62 Societies, (Sage Publications, Thousand Oaks, CA).
Husted, B.W.: 1999, ‘Wealth, Culture, and Corruption’, Journal of International Business Studies 30,
339–360.
Husted, B.W.: 2000, ‘The Impact of National Culture on Software Piracy’, Journal of Business Ethics
26(3), 197–211.
Husted, B.W.: 2005, ‘Culture and Ecology: A Cross-National Study of the Determinants of
Environmental Performance’, Management International Review 45(3), 349–371.
Inglehart, R.: 1997, Modernization and Postmodernization: Cultural, Economic and Political Change in
43 Societies, (Princeton University Press, Princeton, NJ).
Inglehart, R. and C. Welzel: 2005, Modernization, Cultural Change, and Democracy: The Human
Development Sequence, (Cambridge University Press, NY).
Inglehart, R. and C. Welzel: 2010, ‘Changing Mass Priorities: The Link between Modernization and
Democracy’, Perspectives on Politics 8(2), 551-567
Johnson, T., P. Kulesa, I. Llc,Y.I. Cho and S. Shavitt: 2005, ‘The Relation Betwween Culture and
Response Styles: Evidence from 19 Countries’, Journal of Cross-Cultural Psychology 36, 264-277.
Knafo, A., S. Roccas and L. Sagiv: 2011, ‘The Value of Values in Cross-Cultural Research: A Special
Issue in Honor of Shalom Schwartz’, Journal of Cross-Cultural Psychology 42,178-185.
LeBreton, J.M. and J.L. Senter, Jenell L.: 2008, Answers to 20 Questions About Interrater Reliability and
Interrater Agreement’, Organizational Research Methods 11, 815-852.
Li, J., J. Moy, K. Lam and W.L. Chris Chu: 2008, ‘Institutional Pillars and Corruption at the Societal
Level’, Journal of Business Ethics 83, 327-339.
Licht, A.N., C. Goldschmidt and S.H Schwartz: 2005, ‘Culture, Law, and Corporate Governance’,
21st Century Values 29
International Review of Law and Economics 25, 229-255.
Licht, A.N., C. Goldschmidt and S.H. Schwartz: 2007, ‘Culture Rules: The Foundations of the Rule of
Law and Other Norms of Governance’, Journal of Comparative Economics 35(4), 659-688.
Marshall, M.G., K. Jaggers and T.R. Gurr: 2010, ‘Polity IV Project: Political Regime Characteristics and
Transitions, 1800-2009’. Available at: http://www.systemicpeace.org/polity/polity4.htm.
Martin, K. D., J.B. Cullen, J.L. Johnson, and K.P. Parboteeah: 2007, ‘Deciding to Bribe: A Cross-level
Analysis of Firm and Home Country Influences on Bribery Activity’, Academy of Management
Journal 50, 1401-1422.
McSweeney, B.: 2002, ‘Hofstede’s Model of National Cultural Differences and Their Consequences: A
Triumph of Faith – a Failure of Analysis’, Human Relations 55(1), 89-118.
Ng, S. I., J.A. Lee and G.N. Soutar: 2007, ‘Are Hofstede's and Schwartz's Value Frameworks
Congruent?’, International Marketing Review 24, 164-180.
Nordlund, A. M. and J. Garvill: 2002, ‘Value Structures Behind Proenvironmental Behavior’,
Environment and Behavior 34, 740–756.
Oyserman, D., H.M. Coon and M. Kemmelmeier: 2002, ’Rethinking Individualism and Collectivism:
Evaluation of Theoretical Assumptions and Meta-analyses’, Psychological Bulletin 128, 3-72.
Parboteeah, K. P., J.W. Bronson and J.B. Cullen: 2005, ‘Does National Culture Affect Willingness to
Justify Ethically Suspect Behaviors? A Focus on the GLOBE National Culture Scheme’,
International Journal of Cross Cultural Management 5, 123-137.
Peng, Y.-S. and S.-S. Lin: 2009, ‘National Culture, Economic Development, Population Growth and
Environmental Performance: The Mediating Role of Education,’ Journal of Business Ethics 90, 203-
219.
Perrinjaquet, A., O. Furrer, J.-C. Usunier, G. Cestre and P. Valette-Florence: 2007, ‘A Test of the Quasi-
circumplex Structure of Human Values’, Journal of Research in Personality 41, 820-840.
21st Century Values 30
Peterson, M. F. and S.L. Castro: 2006, ‘Measurement Metrics at Aggregate Levels of Analysis:
Implications for Organization Culture Research and the GLOBE Project’, Leadership Quarterly 17,
506−521.
Prince-Gibson, E. and S. H. Schwartz: 1998, ‘Value Priorities and Gender’, Social Psychology Quarterly
61, 49–67.
Ralston, D.A., D.A. Holt, R.H. Terpstra, and K.C. Yu: 2008, ‘The Impact of National Culture and
Economic Ideology on Managerial Work Values: A Study of the United States, Russia, Japan, and
China’, Journal of International Business Studies 39, 8-26.
Rokeach, M.: 1967, Values Survey, (Halgren Tests, Sunnyvale, CA).
Rokeach, M.: 1973, The Nature of Human Values, (Free Press, New York).
Sawyerr, O. O., J. Strauss and J. Yan: 2005, ‘Individual Value Structure and Diversity Attitudes: The
Moderating Effects of Age, Gender, Race, and Religiosity’, Journal of Managerial Psychology 20,
498–521.
Scholtens, B. and L. Dam: 2007, ‘Cultural Values and International Differences in Business Ethics’,
Journal of Business Ethics 75, 273-284.
Schwartz, S. H.: 1992, ‘Universals in the Content and Structure of Values: Theory and Empirical Tests in
20 Countries’, in M. Zanna (ed.), Advances in Experimental Social Psychology, Vol. 25, (Academic
Press, New York), pp. 1-65.
Schwartz, S. H.: 1994a, ‘Beyond Individualism/Collectivism: New Cultural Dimensions of Values’, in U.
Kim, H. C. Triandis, C. Kagitcibasi, S. Choi and G. Yoon (eds.), Individualism and Collectivism:
Theory, Method, and Applications, (Sage Publications, Thousand Oaks, CA), pp. 85-119.
Schwartz, S. H.: 1994b, ‘Are There Universal Aspects in the Structure and Contents of Human Values?’,
Journal of Social Issues 50(4), 19-45.
Schwartz, S. H.: 1999, ‘A Theory of Cultural Values and Some Implications For Work’, Applied
Psychology: An International Review 48, 23-47.
Schwartz, S. H.: 2005, ‘Robustness and Fruitfulness of a Theory of Universals in Individual Human

21st Century Values 31
Values’, in A. Tamayo and J. B. Porto (Eds.), Valores e Comportamento nas Organizações, (Vozes,
Petrópolis, Brazil), pp. 56-95.
Schwartz, S.H.: 2006, ‘A Theory of Cultural Value Orientations: Explication and Applications’,
Comparative Sociology, 5, 137-182.
Schwartz, S. H.: 2007, ‘Universalism Values and the Inclusiveness of Our Moral Universe’, Journal of
Cross-Cultural Psychology 38, 711-728.
Schwartz, S.H.: 2009, ‘Culture Matters: National Value Cultures, Sources and Consequences’, in R.S.
Wyer, C. Chiu and Y. Hong (Eds.), Understanding Culture: Theory, Research, and Application,
(Psychology Press, New York), pp. 127-150.
Schwartz, S.H. and A. Bardi: 1997, ‘Influences of Adaptation to Communist Rule on Value Priorities in
Eastern Europe’, Political Psychology 18(2), 386-410.
Schwartz, S. H. and W. Bilsky: 1987, ‘Toward a Universal Psychological Structure of Human Values’,
Journal of Personality and Social Psychology 53, 550–562.
Schwartz, S.H. and W. Bilsky, W.: 1990, ‘Toward a Theory of the Universal Content and Structure of
Values: Extensions and Cross-Cultural Replications’, Journal of Personality and Social Psychology
58, 878-891.
Schwartz, S. H. and K. Boehnke: 2004, ’Evaluating the Structure of Human Values with Confirmatory
Factor Analysis’, Journal of Research in Personality 38, 230-255.
Schwartz, S.H. and S. Huismans: 1995, ‘Value Priorities and Religiosity in Four Western Religions’,
Social Psychology Quarterly 58, 88–107.
Schwartz, S. H., and M. Ros: 1995, ‘Values in the West: A Theoretical and Empirical Challenge to the
Individualism Collectivism Cultural Dimension’, World Psychology 1, 91-122.
Schwartz, S. H. and T. Rubel: 2005, ‘Sex Differences in Value Priorities: Cross-Cultural and
Multimethod Studies’, Journal of Personality and Social Psychology 89, 1010–1028.
Schwartz, S. H. and G. Sagie: 2000, ‘Value Consensus and Importance: A Cross-National Study’, Journal
of Cross Cultural Psychology 31, 465-497.
21st Century Values 32
Schwartz, S. H. and L. Sagiv, L.: 1995, ’Identifying Culture-Specifics in the Content and Structure of
Values’, Journal of Cross-Cultural Psychology 26, 92–116.
Schultz, P. W., V.V. Gouveia, L.D. Cameron, G. Tankha, P. Schmuck and M. Franek: 2005, ‘Values and
Their Relationship to Environmental Concern and Conservation Behavior’, Journal of Cross-
Cultural Psychology 36, 457-475.
Schultz, P. W. and L. Zelezny: 1998, ‘Values and Proenvironmental Behavior’, Journal of Cross-Cultural
Psychology 29, 540–558.
Schultz, P.W. and L.C. Zelezny: 1999, ‘Values as predictors of environmental attitudes: Evidence for
consistency across 14 countries’, Journal of Environmental Psychology 19, 255-265.
Shafer, W., K. Fukukawa and G. Lee: 2007, ‘Values and the Perceived Importance of Ethics and Social
Responsibility’, Journal of Business Ethics 70, 265-284.
Smith, P. B., S. Dugan, and F. Trompenaars: 1996, ‘National Culture and the Values of Organizational
Employees: A Dimensional Analysis Across 43 Nations’, Journal of Cross-Cultural Psychology, 27,
231-264.
Spini, E.: 2003, ‘Measurement Equivalence of 10 Value Types from the Schwartz Value Survey Across
21 Countries’, Journal of Cross-Cultural Psychology 34, 3-23.
Taras, V., P. Steel and B.L. Kirkman: 2010, ‘Negative Practice–Value Correlations in the GLOBE Data:
Unexpected Findings, Questionnaire Limitations and Research Directions’, Journal of International
Business Studies 41, 1330-1338.
Tung, R.L. and A.Verbeke: 2010, ‘Beyond Hofstede and GLOBE: Improving the Quality of Cross-
cultural Research’, Journal of International Business Studies 41, 1259-1274.
21st Century Values
33
TABLE 1
Evolution of the Schwartz Values Survey from the Rokeach Values Survey and the Chinese Values Survey
Schwartz Values Survey1 (57-items) Rokeach Values Survey
2 (36-items) Chinese Values Survey
3 (40-items)
1 Equality (equal opportunity for all) Equality (brotherhood, equal opportunity for all) -----
2 Inner harmony (at peace with myself) Inner harmony (freedom from inner conflict) -----
3 Social power (control over others, dominance) ----- -----
4 Pleasure (gratification of desires) Pleasure (an enjoyable and leisurely life) -----
5 Freedom (freedom of action and thought) Freedom (independence, free choice) -----
6 A spiritual life (emphasis on spiritual, not material matters) ----- -----
7 Sense of belonging (feeling that others care about me) ----- -----
8 Social order (stability of society) ----- Ordering relationships by status and
observing this order
9 An exciting life (stimulating experiences) An exciting life (a stimulating, active life) -----
10 Meaning in life (a purpose in life) ----- -----
11 Politeness (courtesy, good manners) Polite (courteous, well-mannered) Courtesy
12 Wealth (material possessions, money) A comfortable life (a prosperous life) Wealth
13 National security (protection of my nation from my enemies) National security (protection from attack) -----
14 Self respect (belief in one's own worth) Self-respect (self-esteem) -----
15 Reciprocation of favors (avoidance of indebtedness) ----- Reciprocation of greetings, favours, and
gifts
16 Creativity (uniqueness, imagination) Imaginative (daring, creative) -----
17 A world at peace (free of war and conflict) A world at peace (free of war and conflict) -----
18 Respect for tradition (preservation of time-honored customs) ----- Respect for tradition
19 Mature love (deep emotional and spiritual intimacy) Mature love (sexual and spiritual intimacy) -----
20 Self-discipline (self-restraint, resistance to temptation) Self-controlled (restrained, self-disciplined) Personal steadiness and stability
21 Detachment (detachment from worldly concerns) ----- -----
22 Family security (safety for loved ones) Family security (taking care of loved ones) -----
23 Social recognition (respect, approval by others) Social recognition (respect, admiration) -----
24 Unity with nature (fitting into nature) ----- -----
25 A varied life (life filled with challenge, novelty and change) ----- -----
26 Wisdom (a mature understanding of life) Wisdom (a mature understanding of life) -----
27 Authority (the right to lead or command) ----- -----
28 True friendship (close, supportive friends) True friendship (close companionship) A close, intimate friend
21st Century Values
34
TABLE 1 (continued)
Schwartz Values Survey
1 (57-items) Rokeach Values Survey
2 (36-items) Chinese Values Survey
3 (40-items)
29 A world of beauty (beauty of nature and the arts) A world of beauty (beauty of nature and the arts) -----
30 Social justice (correcting injustice, care for the weak) ----- Sense of righteousness
31 Independent (self-reliant, self-sufficient) Independent (self-sufficient) -----
32 Moderate (avoiding extremes of feeling and action) ----- Moderation, following the middle way
33 Loyal (faithful to my friends, group) ----- -----
34 Ambitious (hard working, aspiring) Ambitious (hardworking, aspiring) Industry (working hard)
35 Broad-minded (tolerant of different ideas and beliefs) Broadminded (open-minded) -----
36 Humble (modest, self-effacing) ----- Humbleness
37 Daring (seeking adventure, risk) ----- Prudence (carefulness) {REVERSE}
38 Protecting the environment (preserving nature) ----- -----
39 Influential (having an impact on people and events) ----- -----
40 Honoring of parents and elders (showing respect) ----- Filial piety
41 Choosing own goals (selecting own purposes) ----- Self-cultivation
42 Healthy (not being sick physically or mentally) ----- -----
43 Capable (competent, effective, efficient) Capable (competent, effective) -----
44 Accepting my portion in life (submitting to life's circumstances)
----- Contentedness with one’s position in life
45 Honest (genuine, sincere) Honest (sincere, truthful) Resistance to corruption / Sincerity
46 Preserving my public image (preserving my "face") ----- Protecting or saving your “face”
47 Obedience (dutiful, meeting obligations) Obedient (dutiful, respectful) -----
48 Intelligent (logical, thinking) Intellectual (intelligent, reflective) -----
49 Helpful (working for the welfare of others) Helpful (working for the welfare of others) -----
50 Enjoying life (enjoying food, sex, leisure, etc.) ----- -----
51 Devout (holding to religious faith and belief) ----- -----
52 Responsible (dependable, reliable) Responsible (dependable, reliable) Trustworthiness
53 Curious (interested in everything, exploring) ----- -----
54 Forgiving (willing to pardon others) Forgiving (willing to pardon others) Tolerance of others / Kindness (forgiveness, compassion)
55 Successful (achieving goals) A sense of accomplishment (lasting contribution) -----
56 Clean (neat, tidy) Clean (neat, tidy) -----
57 Self-indulgent (doing pleasant things) ----- ----- ----- Cheerful (lighthearted, joyful) -----
----- Courageous (standing up for your beliefs) ----- ----- Happiness (contentedness) -----
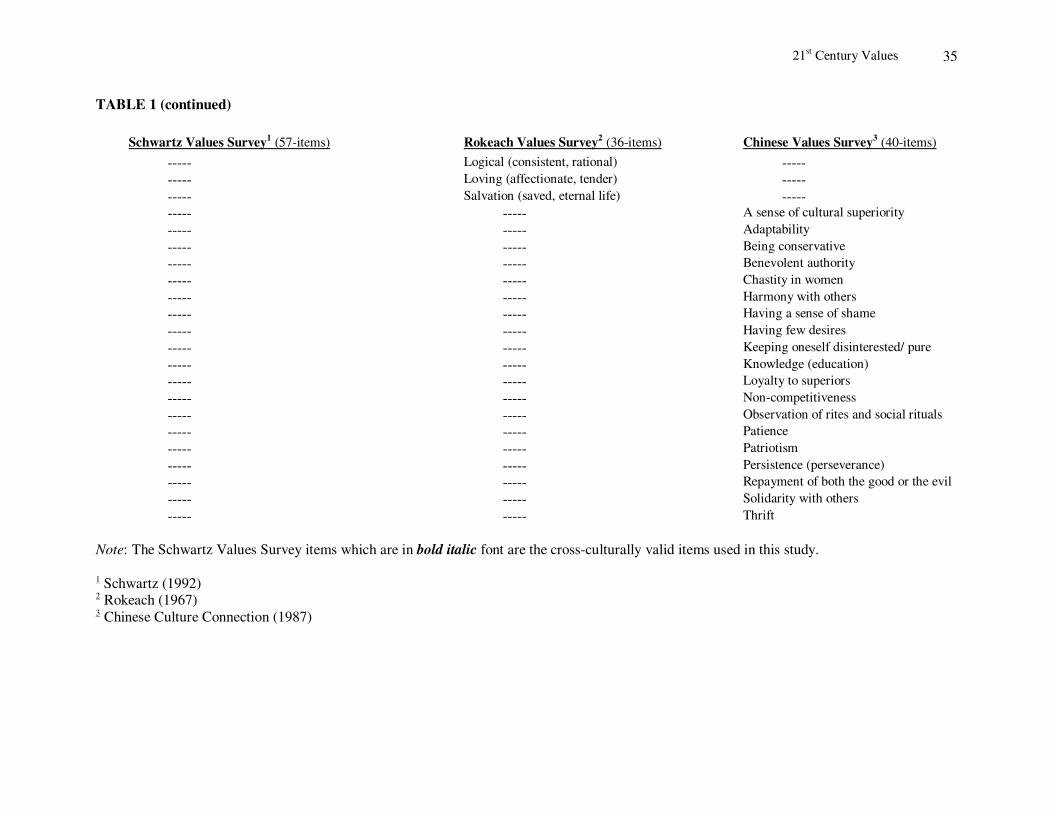
21st Century Values
35
TABLE 1 (continued)
Schwartz Values Survey
1 (57-items) Rokeach Values Survey
2 (36-items) Chinese Values Survey
3 (40-items)
----- Logical (consistent, rational) ----- ----- Loving (affectionate, tender) ----- ----- Salvation (saved, eternal life) ----- ----- ----- A sense of cultural superiority
----- ----- Adaptability
----- ----- Being conservative
----- ----- Benevolent authority
----- ----- Chastity in women
----- ----- Harmony with others
----- ----- Having a sense of shame
----- ----- Having few desires
----- ----- Keeping oneself disinterested/ pure
----- ----- Knowledge (education)
----- ----- Loyalty to superiors
----- ----- Non-competitiveness
----- ----- Observation of rites and social rituals
----- ----- Patience
----- ----- Patriotism
----- ----- Persistence (perseverance)
----- ----- Repayment of both the good or the evil
----- ----- Solidarity with others
----- ----- Thrift
Note: The Schwartz Values Survey items which are in bold italic font are the cross-culturally valid items used in this study.
1 Schwartz (1992) 2 Rokeach (1967) 3 Chinese Culture Connection (1987)
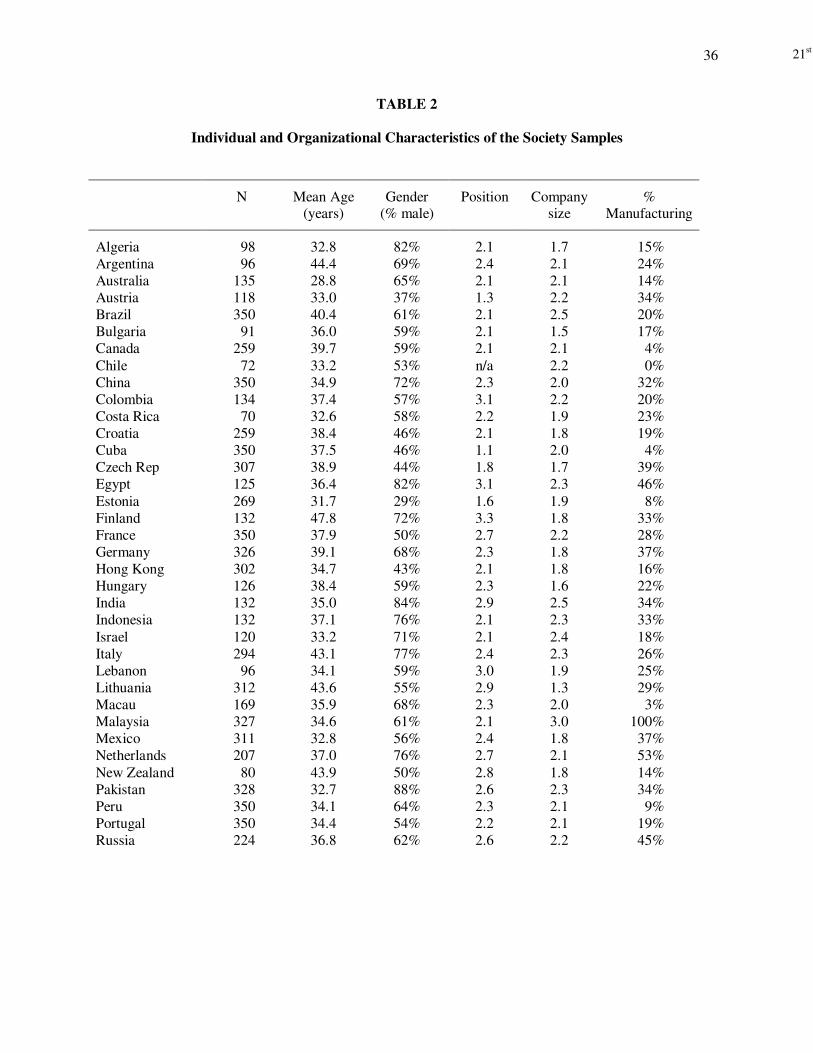
21st Century Values36
TABLE 2
Individual and Organizational Characteristics of the Society Samples
N Mean Age (years)
Gender (% male)
Position Company size
% Manufacturing
Algeria 98 32.8 82% 2.1 1.7 15%
Argentina 96 44.4 69% 2.4 2.1 24%
Australia 135 28.8 65% 2.1 2.1 14%
Austria 118 33.0 37% 1.3 2.2 34%
Brazil 350 40.4 61% 2.1 2.5 20%
Bulgaria 91 36.0 59% 2.1 1.5 17%
Canada 259 39.7 59% 2.1 2.1 4%
Chile 72 33.2 53% n/a 2.2 0%
China 350 34.9 72% 2.3 2.0 32%
Colombia 134 37.4 57% 3.1 2.2 20%
Costa Rica 70 32.6 58% 2.2 1.9 23%
Croatia 259 38.4 46% 2.1 1.8 19%
Cuba 350 37.5 46% 1.1 2.0 4%
Czech Rep 307 38.9 44% 1.8 1.7 39%
Egypt 125 36.4 82% 3.1 2.3 46%
Estonia 269 31.7 29% 1.6 1.9 8%
Finland 132 47.8 72% 3.3 1.8 33%
France 350 37.9 50% 2.7 2.2 28%
Germany 326 39.1 68% 2.3 1.8 37%
Hong Kong 302 34.7 43% 2.1 1.8 16%
Hungary 126 38.4 59% 2.3 1.6 22%
India 132 35.0 84% 2.9 2.5 34%
Indonesia 132 37.1 76% 2.1 2.3 33%
Israel 120 33.2 71% 2.1 2.4 18%
Italy 294 43.1 77% 2.4 2.3 26%
Lebanon 96 34.1 59% 3.0 1.9 25%
Lithuania 312 43.6 55% 2.9 1.3 29%
Macau 169 35.9 68% 2.3 2.0 3%
Malaysia 327 34.6 61% 2.1 3.0 100%
Mexico 311 32.8 56% 2.4 1.8 37%
Netherlands 207 37.0 76% 2.7 2.1 53%
New Zealand 80 43.9 50% 2.8 1.8 14%
Pakistan 328 32.7 88% 2.6 2.3 34%
Peru 350 34.1 64% 2.3 2.1 9%
Portugal 350 34.4 54% 2.2 2.1 19%
Russia 224 36.8 62% 2.6 2.2 45%
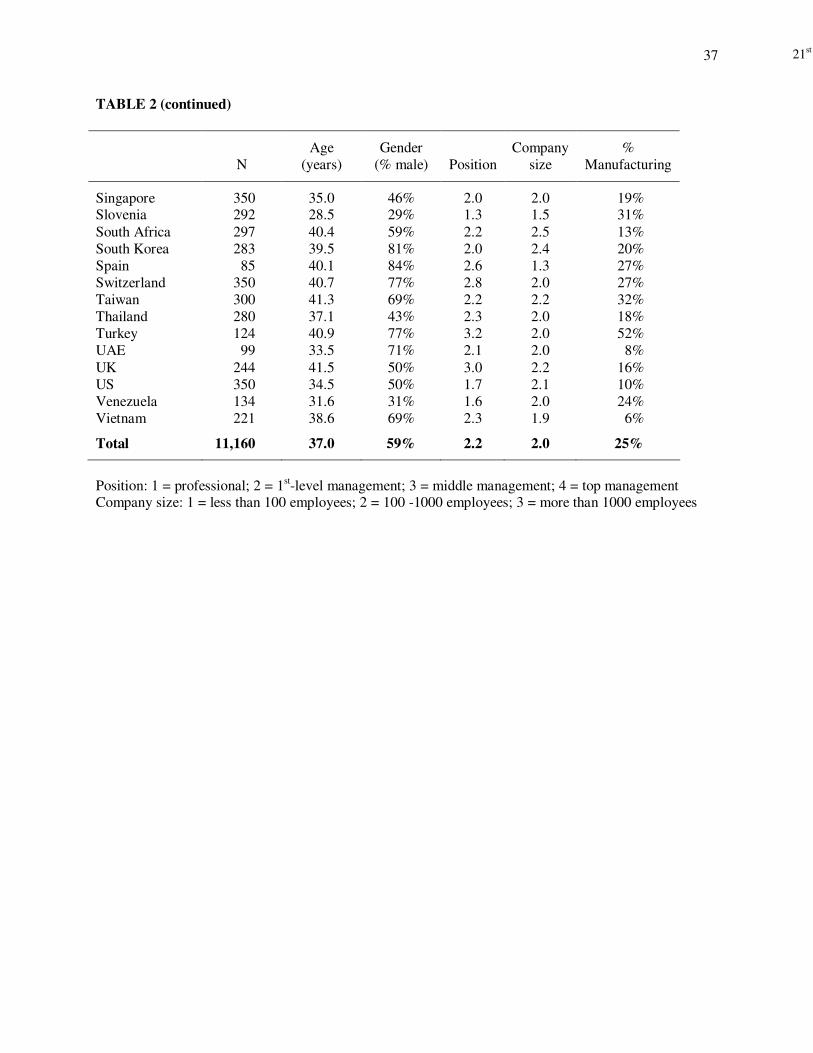
21st Century Values37
TABLE 2 (continued)
N
Age
(years)
Gender
(% male) Position
Company
size
%
Manufacturing
Singapore 350 35.0 46% 2.0 2.0 19% Slovenia 292 28.5 29% 1.3 1.5 31%
South Africa 297 40.4 59% 2.2 2.5 13%
South Korea 283 39.5 81% 2.0 2.4 20%
Spain 85 40.1 84% 2.6 1.3 27%
Switzerland 350 40.7 77% 2.8 2.0 27%
Taiwan 300 41.3 69% 2.2 2.2 32%
Thailand 280 37.1 43% 2.3 2.0 18%
Turkey 124 40.9 77% 3.2 2.0 52%
UAE 99 33.5 71% 2.1 2.0 8%
UK 244 41.5 50% 3.0 2.2 16%
US 350 34.5 50% 1.7 2.1 10%
Venezuela 134 31.6 31% 1.6 2.0 24%
Vietnam 221 38.6 69% 2.3 1.9 6%
Total 11,160 37.0 59% 2.2 2.0 25%
Position: 1 = professional; 2 = 1st-level management; 3 = middle management; 4 = top management
Company size: 1 = less than 100 employees; 2 = 100 -1000 employees; 3 = more than 1000 employees
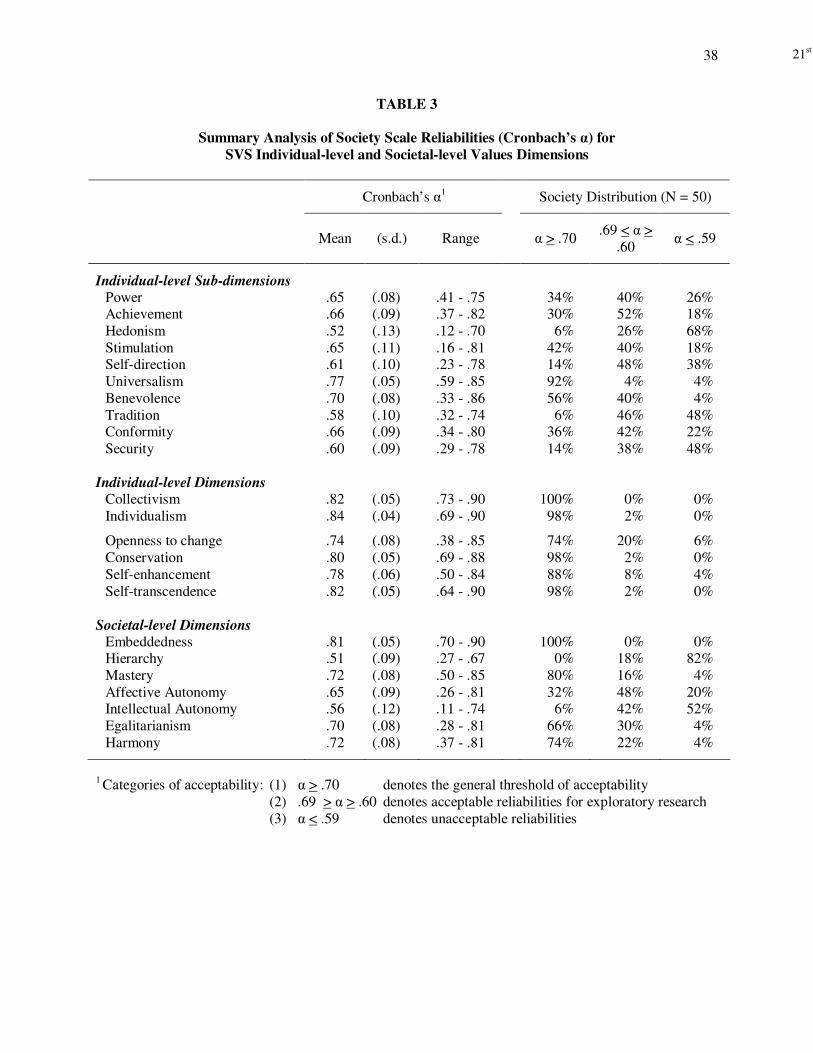
21st Century Values38
TABLE 3
Summary Analysis of Society Scale Reliabilities (Cronbach’s α) for
SVS Individual-level and Societal-level Values Dimensions
Cronbach’s α1 Society Distribution (N = 50)
Mean (s.d.) Range α > .70
.69 < α >
.60 α < .59
Individual-level Sub-dimensions
Power .65 (.08) .41 - .75 34% 40% 26% Achievement .66 (.09) .37 - .82 30% 52% 18%
Hedonism
.52 (.13) .12 - .70 6% 26% 68%
Stimulation .65 (.11) .16 - .81 42% 40% 18% Self-direction .61 (.10) .23 - .78 14% 48% 38%
Universalism .77 (.05) .59 - .85 92% 4% 4%
Benevolence .70 (.08) .33 - .86 56% 40% 4%
Tradition .58 (.10) .32 - .74 6% 46% 48% Conformity .66 (.09) .34 - .80 36% 42% 22%
Security .60 (.09) .29 - .78 14% 38% 48%
Individual-level Dimensions
Collectivism .82 (.05) .73 - .90 100% 0% 0%
Individualism .84 (.04) .69 - .90 98% 2% 0%
Openness to change .74 (.08) .38 - .85 74% 20% 6%
Conservation .80 (.05) .69 - .88 98% 2% 0%
Self-enhancement .78 (.06) .50 - .84 88% 8% 4%
Self-transcendence .82 (.05) .64 - .90 98% 2% 0%
Societal-level Dimensions
Embeddedness .81 (.05) .70 - .90 100% 0% 0% Hierarchy .51 (.09) .27 - .67 0% 18% 82%
Mastery .72 (.08) .50 - .85 80% 16% 4%
Affective Autonomy .65 (.09) .26 - .81 32% 48% 20% Intellectual Autonomy .56 (.12) .11 - .74 6% 42% 52%
Egalitarianism .70 (.08) .28 - .81 66% 30% 4%
Harmony
.72 (.08) .37 - .81 74% 22% 4%
1 Categories of acceptability: (1) α > .70 denotes the general threshold of acceptability
(2) .69 > α > .60 denotes acceptable reliabilities for exploratory research
(3) α < .59 denotes unacceptable reliabilities

21st Century Values
39
TABLE 4
Summary Scale Reliability Analysis for Societies: Individual-level and Societal-level Values
Individual-level Values Societal-level Values
10 Values Sub-dimensions1
Collectivism and Individualism
Openness to change, Conservation,
Self-enhancement,
Self-transcendence
Embeddedness, Hierarchy, Mastery, Affective Autonomy,
Intellectual Autonomy, Egalitarianism, Harmony
α
Mean
α
Range
Number
α > .60
α
Mean
α
Range
Number
α > .60
α
Mean
α
Range
Number
α > .60
α
Mean
α
Range
Number
α > .60
Algeria .50 (.32 - .68) 1 .75 (.73- .77) 2 .68 (.56 - .78) 3 .58 (.46 - .70) 4
Argentina .70 (.58 - .85) 9 .89 (.88 - .89) 2 .84 (.79 - .89) 4 .74 (.58 - .86) 6
Australia .69 (.53 - .82) 8 .86 (.85 - .87) 2 .82 (.79 - .84) 4 .71 (.62 - .83) 7
Austria .65 (.51 - .74) 8 .81 (.77 - .84) 2 .78 (.75 - .81) 4 .65 (.46 - .79) 5
Brazil .64 (.55 - .80) 7 .82 (.80 - .84) 2 .78 (.69 - .84) 4 .67 (.51 - .79) 5
Bulgaria .59 (.40 - .82) 5 .79 (.74 - .84) 2 .72 (.69 - .76) 4 .63 (.36 - .76) 6
Canada .70 (.64 - .79) 10 .86 (.86 - .86) 2 .82 (.77 - .84) 4 .72 (.60 - .85) 7
Chile .62 (.27 - .83) 7 .83 (.77 - .88) 2 .81 (.76 - .85) 4 .69 (.45 - .86) 6
China .60 (.51 - .73) 5 .77 (.76 - .77) 2 .73 (.67 - .80) 4 .61 (.38 - .78) 4
Colombia .65 (.54 - .78) 7 .85 (.84 - .86) 2 .79 (.66 - .85) 4 .67 (.58 - .84) 6
Costa Rica .65 (.52 - .80) 6 .86 (.86 - .86) 2 .80 (.75 - .84) 4 .70 (.61 - .82) 7
Croatia .62 (.50 - .72) 7 .82 (.80 - .84) 2 .77 (.74 - .80) 4 .65 (.38 - .80) 6
Cuba .60 (.43 - .78) 4 .78 (.78 - .78) 2 .74 (.69 - .82) 4 .63 (.35 - .78) 5
Czech Rep .64 (.52 - .72) 7 .82 (.79 - .85) 2 .78 (.76 - .82) 4 .66 (.49 - .78) 5
Egypt .36 (.12 - .59) 0 .71 (.69 - .73) 2 .57 (.38 - .70) 2 .41 (.11 - .73) 2
Estonia .63 (.39 - .73) 7 .82 (.79 - .85) 2 .76 (.73 - .79) 4 .67 (.54 - .74) 5
Finland .65 (.49 - .80) 7 .83 (.81 - .85) 2 .78 (.71 - .82) 4 .65 (.34 - .79) 5
France .68 (.56 - .82) 8 .83 (.82 - .84) 2 .80 (.69 - .88) 4 .68 (.49 - .87) 5 Germany .69 (.60 - .80) 10 .84 (.82 - .86) 2 .81 (.76 - .86) 4 .71 (.56 - .84) 6
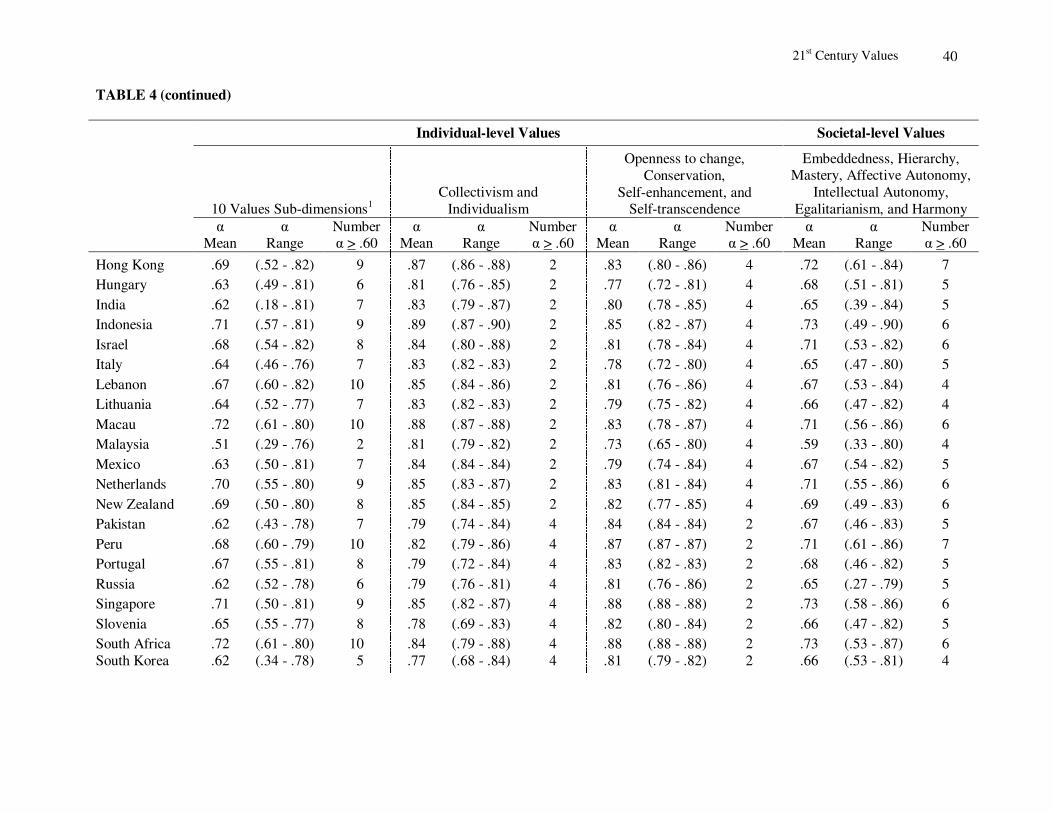
21st Century Values
40
TABLE 4 (continued)
Individual-level Values Societal-level Values
10 Values Sub-dimensions1
Collectivism and
Individualism
Openness to change,
Conservation,
Self-enhancement, and Self-transcendence
Embeddedness, Hierarchy, Mastery, Affective Autonomy,
Intellectual Autonomy,
Egalitarianism, and Harmony
α Mean
α Range
Number α > .60
α Mean
α Range
Number α > .60
α Mean
α Range
Number α > .60
α Mean
α Range
Number α > .60
Hong Kong .69 (.52 - .82) 9 .87 (.86 - .88) 2 .83 (.80 - .86) 4 .72 (.61 - .84) 7
Hungary .63 (.49 - .81) 6 .81 (.76 - .85) 2 .77 (.72 - .81) 4 .68 (.51 - .81) 5
India .62 (.18 - .81) 7 .83 (.79 - .87) 2 .80 (.78 - .85) 4 .65 (.39 - .84) 5
Indonesia .71 (.57 - .81) 9 .89 (.87 - .90) 2 .85 (.82 - .87) 4 .73 (.49 - .90) 6
Israel .68 (.54 - .82) 8 .84 (.80 - .88) 2 .81 (.78 - .84) 4 .71 (.53 - .82) 6
Italy .64 (.46 - .76) 7 .83 (.82 - .83) 2 .78 (.72 - .80) 4 .65 (.47 - .80) 5
Lebanon .67 (.60 - .82) 10 .85 (.84 - .86) 2 .81 (.76 - .86) 4 .67 (.53 - .84) 4
Lithuania .64 (.52 - .77) 7 .83 (.82 - .83) 2 .79 (.75 - .82) 4 .66 (.47 - .82) 4
Macau .72 (.61 - .80) 10 .88 (.87 - .88) 2 .83 (.78 - .87) 4 .71 (.56 - .86) 6
Malaysia .51 (.29 - .76) 2 .81 (.79 - .82) 2 .73 (.65 - .80) 4 .59 (.33 - .80) 4
Mexico .63 (.50 - .81) 7 .84 (.84 - .84) 2 .79 (.74 - .84) 4 .67 (.54 - .82) 5
Netherlands .70 (.55 - .80) 9 .85 (.83 - .87) 2 .83 (.81 - .84) 4 .71 (.55 - .86) 6
New Zealand .69 (.50 - .80) 8 .85 (.84 - .85) 2 .82 (.77 - .85) 4 .69 (.49 - .83) 6
Pakistan .62 (.43 - .78) 7 .79 (.74 - .84) 4 .84 (.84 - .84) 2 .67 (.46 - .83) 5
Peru .68 (.60 - .79) 10 .82 (.79 - .86) 4 .87 (.87 - .87) 2 .71 (.61 - .86) 7
Portugal .67 (.55 - .81) 8 .79 (.72 - .84) 4 .83 (.82 - .83) 2 .68 (.46 - .82) 5
Russia .62 (.52 - .78) 6 .79 (.76 - .81) 4 .81 (.76 - .86) 2 .65 (.27 - .79) 5
Singapore .71 (.50 - .81) 9 .85 (.82 - .87) 4 .88 (.88 - .88) 2 .73 (.58 - .86) 6
Slovenia .65 (.55 - .77) 8 .78 (.69 - .83) 4 .82 (.80 - .84) 2 .66 (.47 - .82) 5
South Africa .72 (.61 - .80) 10 .84 (.79 - .88) 4 .88 (.88 - .88) 2 .73 (.53 - .87) 6
South Korea .62 (.34 - .78) 5 .77 (.68 - .84) 4 .81 (.79 - .82) 2 .66 (.53 - .81) 4
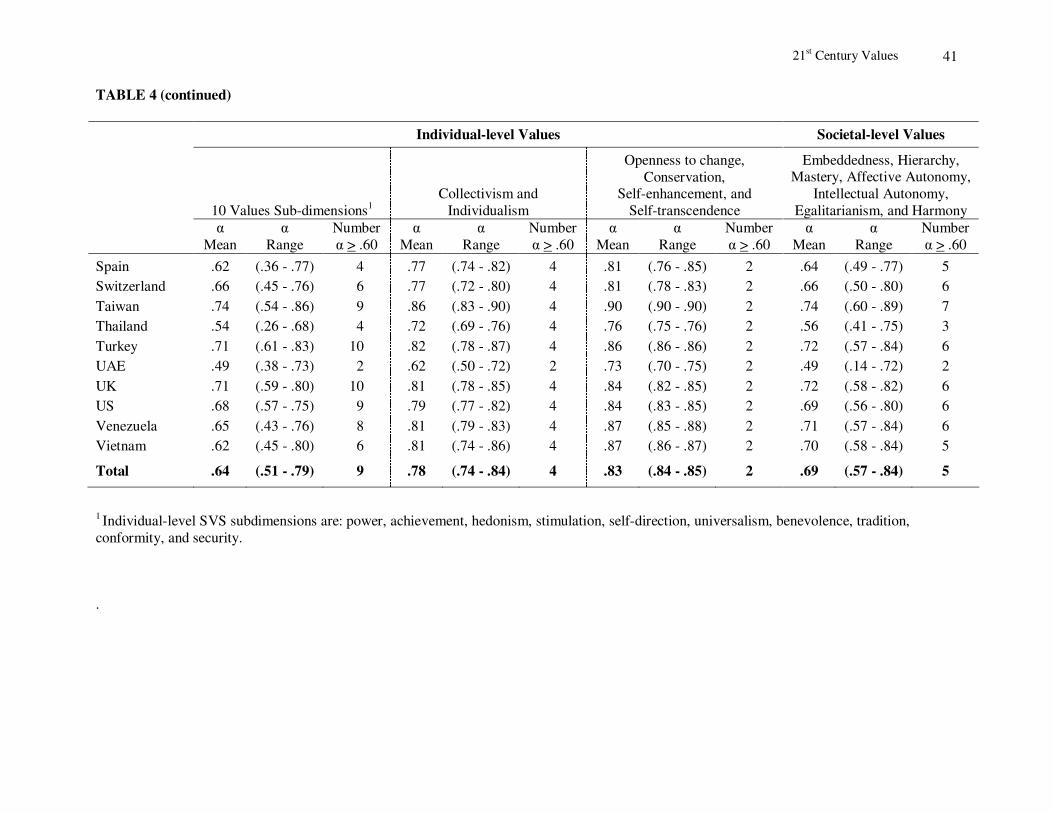
21st Century Values
41
TABLE 4 (continued)
Individual-level Values Societal-level Values
10 Values Sub-dimensions1
Collectivism and
Individualism
Openness to change,
Conservation, Self-enhancement, and
Self-transcendence
Embeddedness, Hierarchy, Mastery, Affective Autonomy,
Intellectual Autonomy,
Egalitarianism, and Harmony
α
Mean
α
Range
Number
α > .60
α
Mean
α
Range
Number
α > .60
α
Mean
α
Range
Number
α > .60
α
Mean
α
Range
Number
α > .60
Spain .62 (.36 - .77) 4 .77 (.74 - .82) 4 .81 (.76 - .85) 2 .64 (.49 - .77) 5
Switzerland .66 (.45 - .76) 6 .77 (.72 - .80) 4 .81 (.78 - .83) 2 .66 (.50 - .80) 6
Taiwan .74 (.54 - .86) 9 .86 (.83 - .90) 4 .90 (.90 - .90) 2 .74 (.60 - .89) 7
Thailand .54 (.26 - .68) 4 .72 (.69 - .76) 4 .76 (.75 - .76) 2 .56 (.41 - .75) 3
Turkey .71 (.61 - .83) 10 .82 (.78 - .87) 4 .86 (.86 - .86) 2 .72 (.57 - .84) 6
UAE .49 (.38 - .73) 2 .62 (.50 - .72) 2 .73 (.70 - .75) 2 .49 (.14 - .72) 2
UK .71 (.59 - .80) 10 .81 (.78 - .85) 4 .84 (.82 - .85) 2 .72 (.58 - .82) 6
US .68 (.57 - .75) 9 .79 (.77 - .82) 4 .84 (.83 - .85) 2 .69 (.56 - .80) 6
Venezuela .65 (.43 - .76) 8 .81 (.79 - .83) 4 .87 (.85 - .88) 2 .71 (.57 - .84) 6
Vietnam .62 (.45 - .80) 6 .81 (.74 - .86) 4 .87 (.86 - .87) 2 .70 (.58 - .84) 5
Total .64 (.51 - .79) 9 .78 (.74 - .84) 4 .83 (.84 - .85) 2 .69 (.57 - .84) 5
1 Individual-level SVS subdimensions are: power, achievement, hedonism, stimulation, self-direction, universalism, benevolence, tradition,
conformity, and security.
.
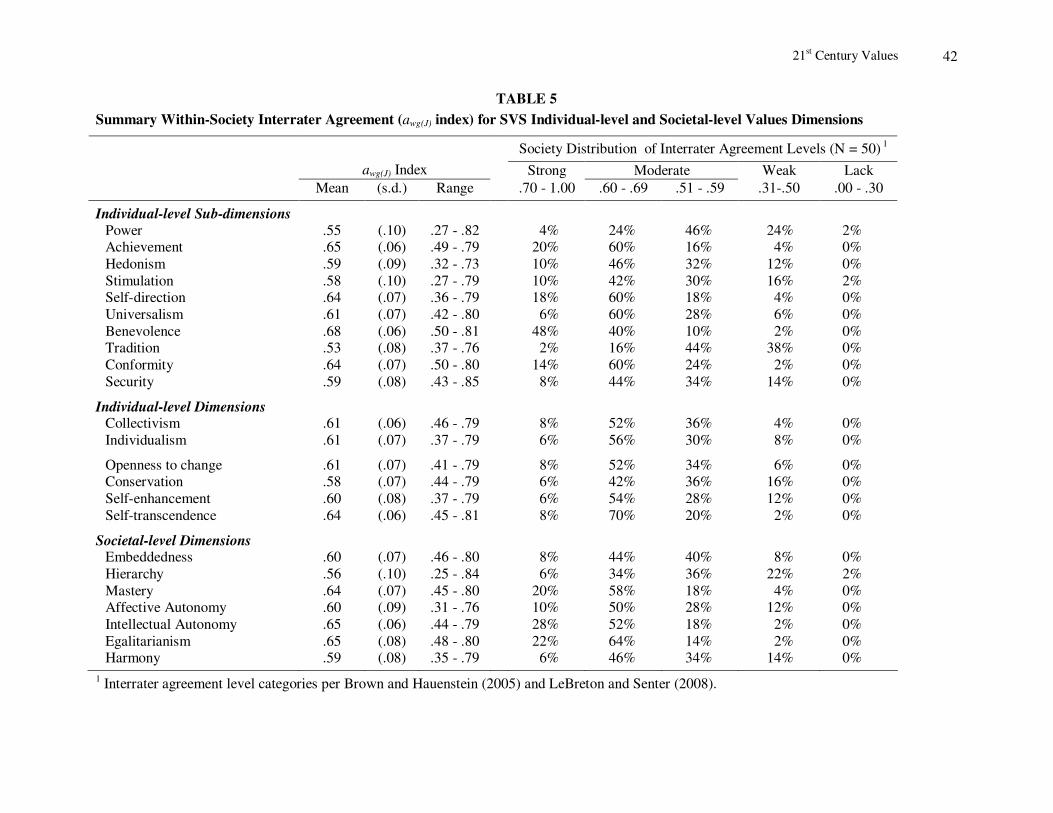
21st Century Values
42
TABLE 5
Summary Within-Society Interrater Agreement (awg(J) index) for SVS Individual-level and Societal-level Values Dimensions
Society Distribution of Interrater Agreement Levels (N = 50) 1
awg(J) Index Strong Moderate Weak Lack
Mean (s.d.) Range .70 - 1.00 .60 - .69 .51 - .59 .31-.50 .00 - .30
Individual-level Sub-dimensions
Power .55 (.10) .27 - .82 4% 24% 46% 24% 2% Achievement .65 (.06) .49 - .79 20% 60% 16% 4% 0%
Hedonism
.59 (.09) .32 - .73 10% 46% 32% 12% 0%
Stimulation .58 (.10) .27 - .79 10% 42% 30% 16% 2% Self-direction .64 (.07) .36 - .79 18% 60% 18% 4% 0%
Universalism .61 (.07) .42 - .80 6% 60% 28% 6% 0%
Benevolence .68 (.06) .50 - .81 48% 40% 10% 2% 0% Tradition .53 (.08) .37 - .76 2% 16% 44% 38% 0%
Conformity .64 (.07) .50 - .80 14% 60% 24% 2% 0%
Security .59 (.08) .43 - .85 8% 44% 34% 14% 0%
Individual-level Dimensions Collectivism .61 (.06) .46 - .79 8% 52% 36% 4% 0%
Individualism .61 (.07) .37 - .79 6% 56% 30% 8% 0%
Openness to change .61 (.07) .41 - .79 8% 52% 34% 6% 0% Conservation .58 (.07) .44 - .79 6% 42% 36% 16% 0%
Self-enhancement .60 (.08) .37 - .79 6% 54% 28% 12% 0%
Self-transcendence .64 (.06) .45 - .81 8% 70% 20% 2% 0%
Societal-level Dimensions Embeddedness .60 (.07) .46 - .80 8% 44% 40% 8% 0%
Hierarchy .56 (.10) .25 - .84 6% 34% 36% 22% 2%
Mastery .64 (.07) .45 - .80 20% 58% 18% 4% 0% Affective Autonomy .60 (.09) .31 - .76 10% 50% 28% 12% 0%
Intellectual Autonomy .65 (.06) .44 - .79 28% 52% 18% 2% 0%
Egalitarianism .65 (.08) .48 - .80 22% 64% 14% 2% 0% Harmony
.59 (.08) .35 - .79 6% 46% 34% 14% 0%
1 Interrater agreement level categories per Brown and Hauenstein (2005) and LeBreton and Senter (2008).
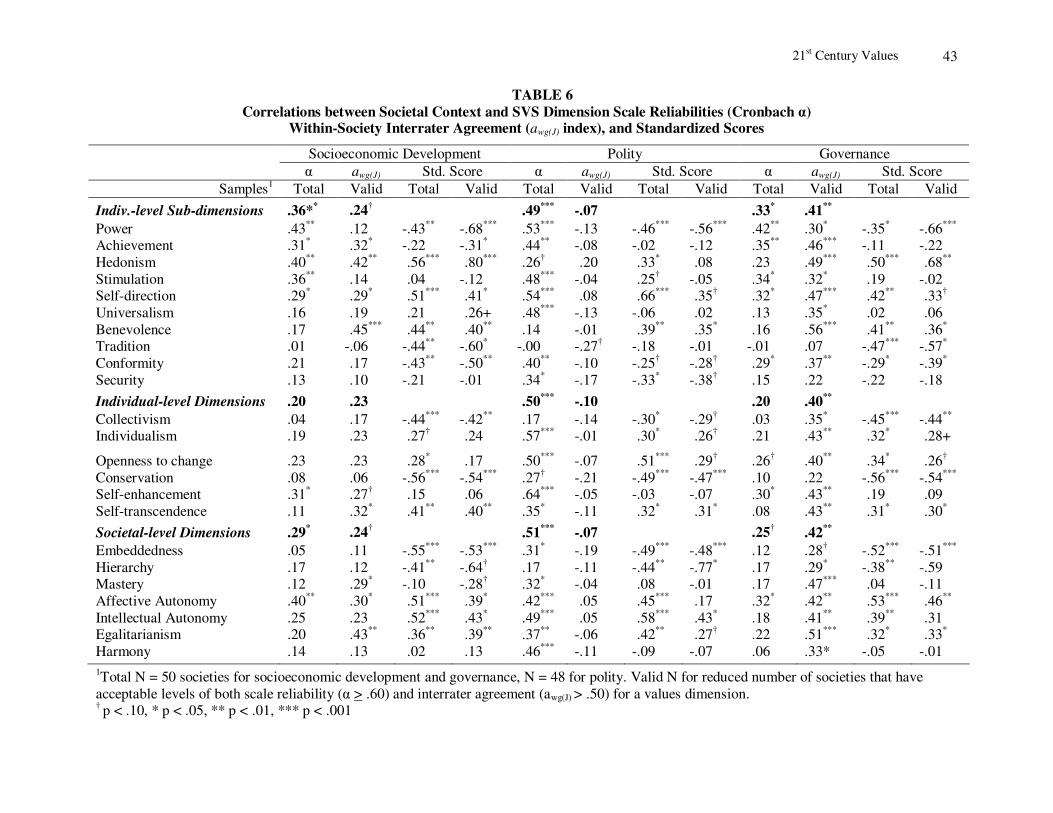
21st Century Values
43
TABLE 6
Correlations between Societal Context and SVS Dimension Scale Reliabilities (Cronbach α) Within-Society Interrater Agreement (awg(J) index), and Standardized Scores
Socioeconomic Development Polity Governance α awg(J) Std. Score α awg(J) Std. Score α awg(J) Std. Score
Samples1
Total Valid Total Valid Total Valid Total Valid Total Valid Total Valid
Indiv.-level Sub-dimensions .36** .24
† .49*** -.07 .33
* .41**
Power .43**
.12 -.43**
-.68***
.53***
-.13 -.46***
-.56***
.42**
.30* -.35
* -.66
***
Achievement .31* .32
* -.22 -.31
* .44
** -.08 -.02 -.12 .35
** .46
*** -.11 -.22
Hedonism .40**
.42**
.56***
.80***
.26† .20 .33
* .08 .23 .49
*** .50
*** .68
**
Stimulation .36**
.14 .04 -.12 .48***
-.04 .25† -.05 .34
* .32
* .19 -.02
Self-direction .29* .29
* .51
*** .41
* .54
*** .08 .66
*** .35
† .32
* .47
*** .42
** .33
†
Universalism .16 .19 .21 .26+ .48***
-.13 -.06 .02 .13 .35* .02 .06
Benevolence .17 .45***
.44**
.40**
.14 -.01 .39**
.35* .16 .56
*** .41
** .36
*
Tradition .01 -.06 -.44**
-.60* -.00 -.27
† -.18 -.01 -.01 .07 -.47
*** -.57
*
Conformity .21 .17 -.43**
-.50**
.40**
-.10 -.25† -.28
† .29
* .37
** -.29
* -.39
*
Security .13 .10 -.21 -.01 .34* -.17 -.33
* -.38
† .15 .22 -.22 -.18
Individual-level Dimensions .20 .23 .50*** -.10 .20 .40
** Collectivism .04 .17 -.44
*** -.42
** .17 -.14 -.30
* -.29
† .03 .35
* -.45
*** -.44
**
Individualism .19 .23 .27† .24 .57
*** -.01 .30
* .26
† .21 .43
** .32
* .28+
Openness to change .23 .23 .28* .17 .50
*** -.07 .51
*** .29
† .26
† .40
** .34
* .26
†
Conservation .08 .06 -.56***
-.54***
.27† -.21 -.49
*** -.47
*** .10 .22 -.56
*** -.54
***
Self-enhancement .31* .27
† .15 .06 .64
*** -.05 -.03 -.07 .30
* .43
** .19 .09
Self-transcendence .11 .32* .41
** .40
** .35
* -.11 .32
* .31
* .08 .43
** .31
* .30
*
Societal-level Dimensions .29* .24
† .51*** -.07 .25
† .42**
Embeddedness .05 .11 -.55***
-.53***
.31* -.19 -.49
*** -.48
*** .12 .28
† -.52
*** -.51
***
Hierarchy .17 .12 -.41**
-.64† .17 -.11 -.44
** -.77
* .17 .29
* -.38
** -.59
Mastery .12 .29* -.10 -.28
† .32
* -.04 .08 -.01 .17 .47
*** .04 -.11
Affective Autonomy .40**
.30* .51
*** .39
* .42
*** .05 .45
*** .17 .32
* .42
** .53
*** .46
**
Intellectual Autonomy .25 .23 .52***
.43* .49
*** .05 .58
*** .43
* .18 .41
** .39
** .31
Egalitarianism .20 .43**
.36**
.39**
.37**
-.06 .42**
.27† .22 .51
*** .32
* .33
*
Harmony .14 .13 .02 .13 .46*** -.11 -.09 -.07 .06 .33* -.05 -.01
1Total N = 50 societies for socioeconomic development and governance, N = 48 for polity. Valid N for reduced number of societies that have
acceptable levels of both scale reliability (α > .60) and interrater agreement (awg(J) > .50) for a values dimension. † p < .10, * p < .05, ** p < .01, *** p < .001
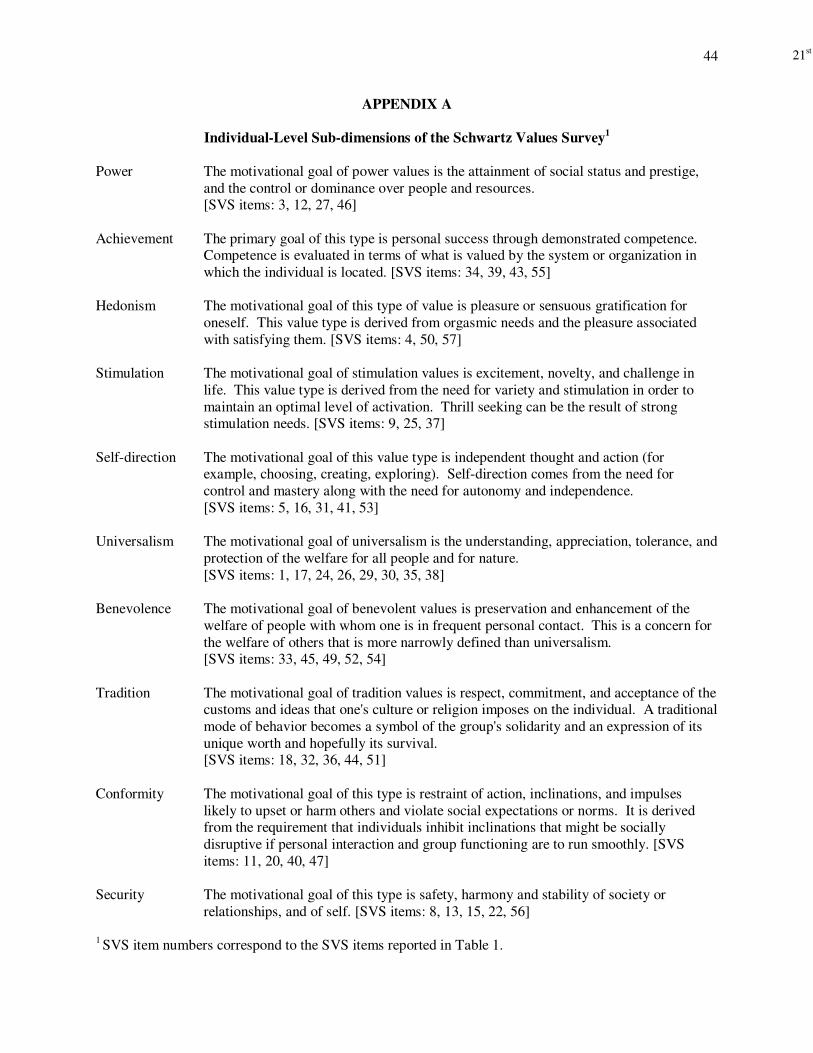
21st Century Values44
APPENDIX A
Individual-Level Sub-dimensions of the Schwartz Values Survey1
Power The motivational goal of power values is the attainment of social status and prestige,
and the control or dominance over people and resources. [SVS items: 3, 12, 27, 46]
Achievement The primary goal of this type is personal success through demonstrated competence. Competence is evaluated in terms of what is valued by the system or organization in
which the individual is located. [SVS items: 34, 39, 43, 55]
Hedonism The motivational goal of this type of value is pleasure or sensuous gratification for
oneself. This value type is derived from orgasmic needs and the pleasure associated
with satisfying them. [SVS items: 4, 50, 57]
Stimulation The motivational goal of stimulation values is excitement, novelty, and challenge in
life. This value type is derived from the need for variety and stimulation in order to
maintain an optimal level of activation. Thrill seeking can be the result of strong stimulation needs. [SVS items: 9, 25, 37]
Self-direction The motivational goal of this value type is independent thought and action (for example, choosing, creating, exploring). Self-direction comes from the need for
control and mastery along with the need for autonomy and independence.
[SVS items: 5, 16, 31, 41, 53]
Universalism The motivational goal of universalism is the understanding, appreciation, tolerance, and
protection of the welfare for all people and for nature.
[SVS items: 1, 17, 24, 26, 29, 30, 35, 38]
Benevolence The motivational goal of benevolent values is preservation and enhancement of the
welfare of people with whom one is in frequent personal contact. This is a concern for
the welfare of others that is more narrowly defined than universalism. [SVS items: 33, 45, 49, 52, 54]
Tradition The motivational goal of tradition values is respect, commitment, and acceptance of the customs and ideas that one's culture or religion imposes on the individual. A traditional
mode of behavior becomes a symbol of the group's solidarity and an expression of its
unique worth and hopefully its survival. [SVS items: 18, 32, 36, 44, 51]
Conformity The motivational goal of this type is restraint of action, inclinations, and impulses
likely to upset or harm others and violate social expectations or norms. It is derived from the requirement that individuals inhibit inclinations that might be socially
disruptive if personal interaction and group functioning are to run smoothly. [SVS
items: 11, 20, 40, 47]
Security The motivational goal of this type is safety, harmony and stability of society or
relationships, and of self. [SVS items: 8, 13, 15, 22, 56]
1 SVS item numbers correspond to the SVS items reported in Table 1.
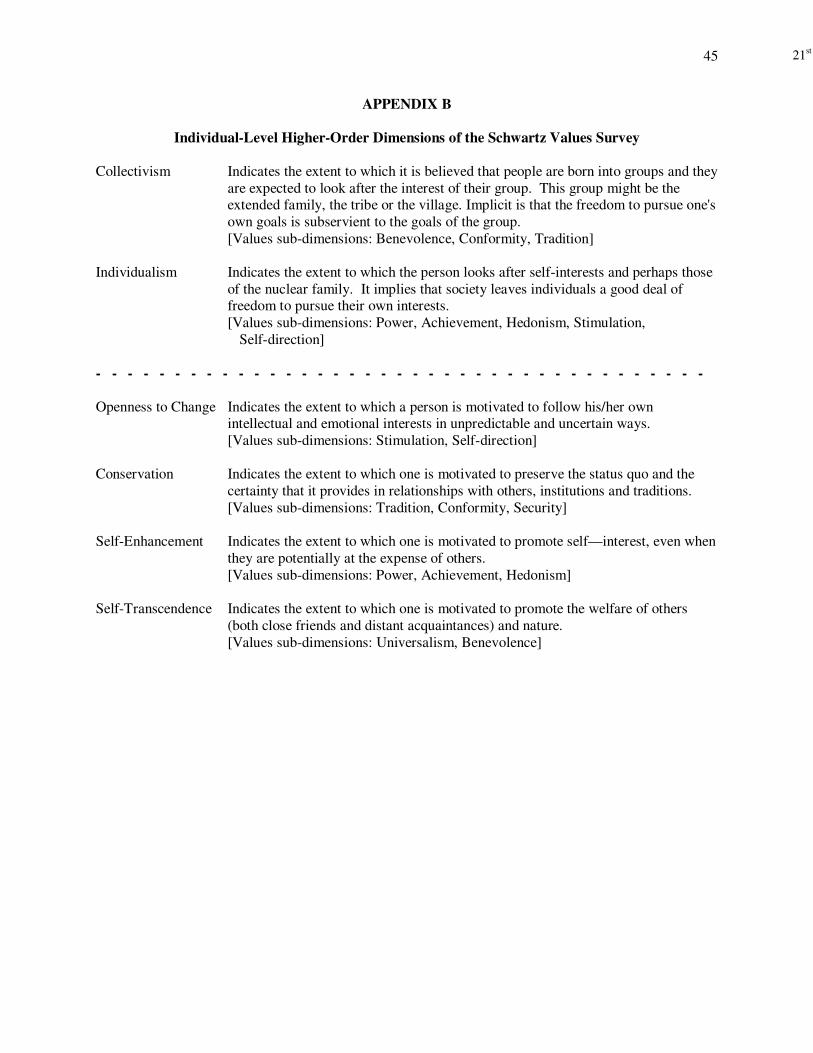
21st Century Values45
APPENDIX B
Individual-Level Higher-Order Dimensions of the Schwartz Values Survey
Collectivism Indicates the extent to which it is believed that people are born into groups and they
are expected to look after the interest of their group. This group might be the extended family, the tribe or the village. Implicit is that the freedom to pursue one's
own goals is subservient to the goals of the group.
[Values sub-dimensions: Benevolence, Conformity, Tradition]
Individualism Indicates the extent to which the person looks after self-interests and perhaps those
of the nuclear family. It implies that society leaves individuals a good deal of freedom to pursue their own interests.
[Values sub-dimensions: Power, Achievement, Hedonism, Stimulation,
Self-direction]
- - - - - - - - - - - - - - - - - - - - - - - - - - - - - - - - - - - - - - -
Openness to Change Indicates the extent to which a person is motivated to follow his/her own intellectual and emotional interests in unpredictable and uncertain ways.
[Values sub-dimensions: Stimulation, Self-direction]
Conservation Indicates the extent to which one is motivated to preserve the status quo and the
certainty that it provides in relationships with others, institutions and traditions.
[Values sub-dimensions: Tradition, Conformity, Security]
Self-Enhancement Indicates the extent to which one is motivated to promote self—interest, even when
they are potentially at the expense of others.
[Values sub-dimensions: Power, Achievement, Hedonism]
Self-Transcendence Indicates the extent to which one is motivated to promote the welfare of others
(both close friends and distant acquaintances) and nature.
[Values sub-dimensions: Universalism, Benevolence]
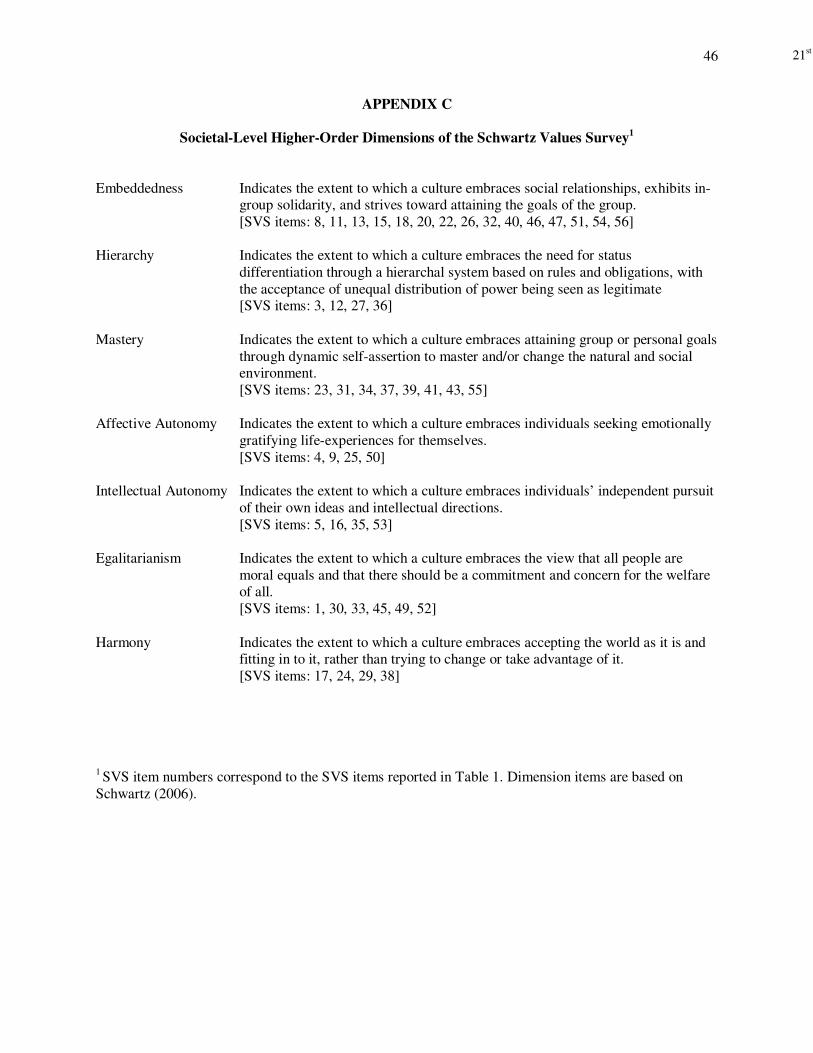
21st Century Values46
APPENDIX C
Societal-Level Higher-Order Dimensions of the Schwartz Values Survey1
Embeddedness Indicates the extent to which a culture embraces social relationships, exhibits in-group solidarity, and strives toward attaining the goals of the group.
[SVS items: 8, 11, 13, 15, 18, 20, 22, 26, 32, 40, 46, 47, 51, 54, 56]
Hierarchy Indicates the extent to which a culture embraces the need for status
differentiation through a hierarchal system based on rules and obligations, with
the acceptance of unequal distribution of power being seen as legitimate [SVS items: 3, 12, 27, 36]
Mastery Indicates the extent to which a culture embraces attaining group or personal goals
through dynamic self-assertion to master and/or change the natural and social environment.
[SVS items: 23, 31, 34, 37, 39, 41, 43, 55]
Affective Autonomy Indicates the extent to which a culture embraces individuals seeking emotionally
gratifying life-experiences for themselves.
[SVS items: 4, 9, 25, 50]
Intellectual Autonomy Indicates the extent to which a culture embraces individuals’ independent pursuit
of their own ideas and intellectual directions.
[SVS items: 5, 16, 35, 53]
Egalitarianism Indicates the extent to which a culture embraces the view that all people are
moral equals and that there should be a commitment and concern for the welfare of all.
[SVS items: 1, 30, 33, 45, 49, 52]
Harmony Indicates the extent to which a culture embraces accepting the world as it is and fitting in to it, rather than trying to change or take advantage of it.
[SVS items: 17, 24, 29, 38]
1 SVS item numbers correspond to the SVS items reported in Table 1. Dimension items are based on
Schwartz (2006).
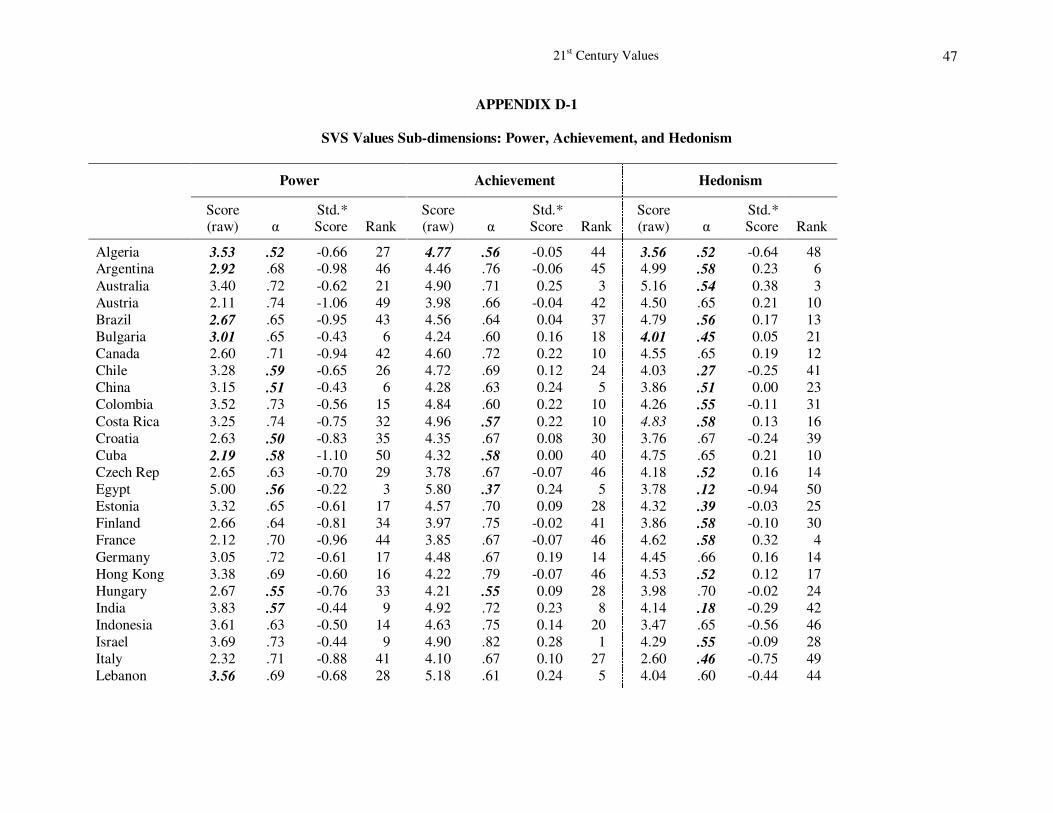
21st Century Values 47
APPENDIX D-1
SVS Values Sub-dimensions: Power, Achievement, and Hedonism
Power Achievement Hedonism
Score (raw) α
Std.* Score Rank
Score (raw) α
Std.* Score Rank
Score (raw) α
Std.* Score Rank
Algeria 3.53 .52 -0.66 27 4.77 .56 -0.05 44 3.56 .52 -0.64 48 Argentina 2.92 .68 -0.98 46 4.46 .76 -0.06 45 4.99 .58 0.23 6
Australia 3.40 .72 -0.62 21 4.90 .71 0.25 3 5.16 .54 0.38 3
Austria 2.11 .74 -1.06 49 3.98 .66 -0.04 42 4.50 .65 0.21 10
Brazil 2.67 .65 -0.95 43 4.56 .64 0.04 37 4.79 .56 0.17 13
Bulgaria 3.01 .65 -0.43 6 4.24 .60 0.16 18 4.01 .45 0.05 21
Canada 2.60 .71 -0.94 42 4.60 .72 0.22 10 4.55 .65 0.19 12
Chile 3.28 .59 -0.65 26 4.72 .69 0.12 24 4.03 .27 -0.25 41
China 3.15 .51 -0.43 6 4.28 .63 0.24 5 3.86 .51 0.00 23
Colombia 3.52 .73 -0.56 15 4.84 .60 0.22 10 4.26 .55 -0.11 31
Costa Rica 3.25 .74 -0.75 32 4.96 .57 0.22 10 4.83 .58 0.13 16
Croatia 2.63 .50 -0.83 35 4.35 .67 0.08 30 3.76 .67 -0.24 39
Cuba 2.19 .58 -1.10 50 4.32 .58 0.00 40 4.75 .65 0.21 10
Czech Rep 2.65 .63 -0.70 29 3.78 .67 -0.07 46 4.18 .52 0.16 14
Egypt 5.00 .56 -0.22 3 5.80 .37 0.24 5 3.78 .12 -0.94 50
Estonia 3.32 .65 -0.61 17 4.57 .70 0.09 28 4.32 .39 -0.03 25
Finland 2.66 .64 -0.81 34 3.97 .75 -0.02 41 3.86 .58 -0.10 30
France 2.12 .70 -0.96 44 3.85 .67 -0.07 46 4.62 .58 0.32 4
Germany 3.05 .72 -0.61 17 4.48 .67 0.19 14 4.45 .66 0.16 14
Hong Kong 3.38 .69 -0.60 16 4.22 .79 -0.07 46 4.53 .52 0.12 17
Hungary 2.67 .55 -0.76 33 4.21 .55 0.09 28 3.98 .70 -0.02 24
India 3.83 .57 -0.44 9 4.92 .72 0.23 8 4.14 .18 -0.29 42
Indonesia 3.61 .63 -0.50 14 4.63 .75 0.14 20 3.47 .65 -0.56 46
Israel 3.69 .73 -0.44 9 4.90 .82 0.28 1 4.29 .55 -0.09 28
Italy 2.32 .71 -0.88 41 4.10 .67 0.10 27 2.60 .46 -0.75 49
Lebanon 3.56 .69 -0.68 28 5.18 .61 0.24 5 4.04 .60 -0.44 44

21st Century Values 48
APPENDIX D-1 (continued)
Power Achievement Hedonism
Score (raw) α
Std.* Score Rank
Score (raw) α
Std.* Score Rank
Score (raw) α
Std.* Score Rank
Lithuania 3.13 .68 -0.48 12 4.14 .60 0.07 32 2.94 .56 -0.59 47 Macau 3.54 .72 -0.41 5 4.40 .79 0.13 21 4.39 .61 0.12 17
Malaysia 3.98 .41 -0.48 12 4.74 .52 0.08 30 4.31 .29 -0.22 35
Mexico 3.22 .65 -0.73 31 4.83 .59 0.13 21 4.25 .50 -0.17 34
Netherlands 2.91 .68 -0.83 35 4.41 .75 0.05 35 5.58 .55 0.74 1
New Zealand 2.24 .72 -1.04 47 4.36 .76 0.16 18 4.26 .50 0.11 19
Pakistan 3.90 .57 -0.43 6 4.76 .66 0.13 21 4.43 .43 -0.09 28
Peru 3.59 .71 -0.61 17 4.98 .63 0.25 3 4.20 .60 -0.22 35
Portugal 2.49 .66 -0.84 39 4.51 .68 0.27 2 3.85 .65 -0.11 31
Russia 3.90 .52 -0.23 4 4.34 .67 0.04 37 3.89 .58 -0.22 35
Singapore 3.25 .74 -0.61 17 4.32 .69 0.06 33 4.00 .50 -0.13 33
Slovenia 3.40 .63 -0.62 21 4.88 .61 0.17 16 4.99 .70 0.23 6
South Africa 2.69 .69 -1.04 47 4.86 .77 0.23 8 4.10 .61 -0.22 35
South Korea 2.99 .68 -0.63 24 4.07 .62 0.04 37 4.71 .42 0.43 2
Spain 2.91 .75 -0.70 29 4.09 .62 -0.07 46 4.36 .45 0.07 20
Switzerland 2.24 .73 -0.85 40 3.91 .68 0.06 33 4.27 .53 0.23 6
Taiwan 3.52 .65 -0.63 24 4.36 .82 -0.04 42 4.51 .54 0.05 21
Thailand 2.95 .59 -0.62 21 3.79 .48 -0.16 50 4.00 .26 -0.05 26
Turkey 4.07 .67 -0.45 11 5.03 .67 0.11 26 4.02 .61 -0.49 45
UAE 4.92 .42 0.03 1 4.93 .53 0.05 35 4.64 .38 -0.24 39
UK 2.43 .71 -0.83 35 4.25 .73 0.21 13 4.27 .70 0.22 9
US 2.81 .67 -0.96 44 4.72 .62 0.17 16 4.93 .68 0.29 5
Venezuela 3.26 .63 -0.83 35 5.00 .66 0.12 24 4.69 .43 -0.05 26
Vietnam 3.94 .72 -0.21 2 4.68 .63 0.18 15 3.79 .45 -0.30 43
Total .69 .68 .51
* within-subject standardized scores.
Note: Bold italic font for ‘Score(raw)’ denotes an unacceptable level of interrater agreement (aWG(J) < .50); Bold italic font for Cronbach’s α score
denotes an α less than 0.60; Society ranks are based on within-subject standardized scores.
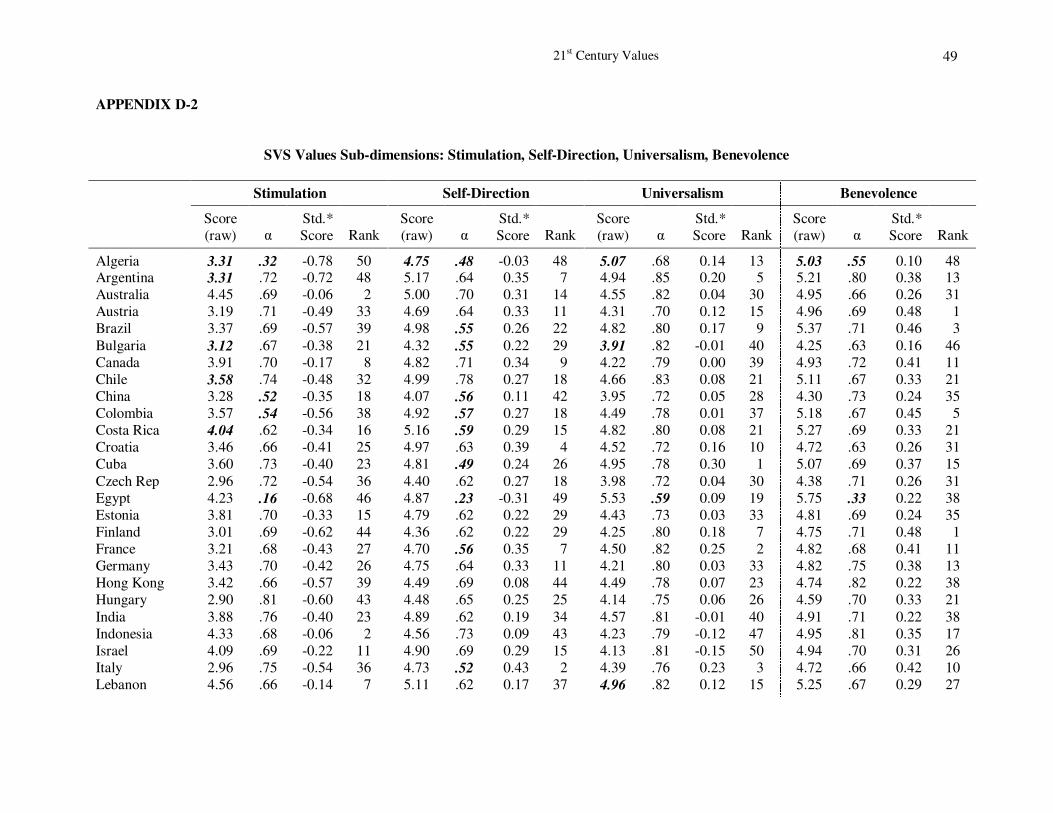
21st Century Values 49
APPENDIX D-2
SVS Values Sub-dimensions: Stimulation, Self-Direction, Universalism, Benevolence
Stimulation Self-Direction Universalism Benevolence
Score
(raw) α Std.*
Score Rank Score
(raw) α Std.*
Score Rank Score
(raw) α Std.*
Score Rank Score
(raw) α Std.*
Score Rank
Algeria 3.31 .32 -0.78 50 4.75 .48 -0.03 48 5.07 .68 0.14 13 5.03 .55 0.10 48 Argentina 3.31 .72 -0.72 48 5.17 .64 0.35 7 4.94 .85 0.20 5 5.21 .80 0.38 13
Australia 4.45 .69 -0.06 2 5.00 .70 0.31 14 4.55 .82 0.04 30 4.95 .66 0.26 31
Austria 3.19 .71 -0.49 33 4.69 .64 0.33 11 4.31 .70 0.12 15 4.96 .69 0.48 1
Brazil 3.37 .69 -0.57 39 4.98 .55 0.26 22 4.82 .80 0.17 9 5.37 .71 0.46 3
Bulgaria 3.12 .67 -0.38 21 4.32 .55 0.22 29 3.91 .82 -0.01 40 4.25 .63 0.16 46
Canada 3.91 .70 -0.17 8 4.82 .71 0.34 9 4.22 .79 0.00 39 4.93 .72 0.41 11
Chile 3.58 .74 -0.48 32 4.99 .78 0.27 18 4.66 .83 0.08 21 5.11 .67 0.33 21
China 3.28 .52 -0.35 18 4.07 .56 0.11 42 3.95 .72 0.05 28 4.30 .73 0.24 35
Colombia 3.57 .54 -0.56 38 4.92 .57 0.27 18 4.49 .78 0.01 37 5.18 .67 0.45 5
Costa Rica 4.04 .62 -0.34 16 5.16 .59 0.29 15 4.82 .80 0.08 21 5.27 .69 0.33 21
Croatia 3.46 .66 -0.41 25 4.97 .63 0.39 4 4.52 .72 0.16 10 4.72 .63 0.26 31
Cuba 3.60 .73 -0.40 23 4.81 .49 0.24 26 4.95 .78 0.30 1 5.07 .69 0.37 15
Czech Rep 2.96 .72 -0.54 36 4.40 .62 0.27 18 3.98 .72 0.04 30 4.38 .71 0.26 31
Egypt 4.23 .16 -0.68 46 4.87 .23 -0.31 49 5.53 .59 0.09 19 5.75 .33 0.22 38
Estonia 3.81 .70 -0.33 15 4.79 .62 0.22 29 4.43 .73 0.03 33 4.81 .69 0.24 35
Finland 3.01 .69 -0.62 44 4.36 .62 0.22 29 4.25 .80 0.18 7 4.75 .71 0.48 1
France 3.21 .68 -0.43 27 4.70 .56 0.35 7 4.50 .82 0.25 2 4.82 .68 0.41 11
Germany 3.43 .70 -0.42 26 4.75 .64 0.33 11 4.21 .80 0.03 33 4.82 .75 0.38 13
Hong Kong 3.42 .66 -0.57 39 4.49 .69 0.08 44 4.49 .78 0.07 23 4.74 .82 0.22 38
Hungary 2.90 .81 -0.60 43 4.48 .65 0.25 25 4.14 .75 0.06 26 4.59 .70 0.33 21
India 3.88 .76 -0.40 23 4.89 .62 0.19 34 4.57 .81 -0.01 40 4.91 .71 0.22 38
Indonesia 4.33 .68 -0.06 2 4.56 .73 0.09 43 4.23 .79 -0.12 47 4.95 .81 0.35 17
Israel 4.09 .69 -0.22 11 4.90 .69 0.29 15 4.13 .81 -0.15 50 4.94 .70 0.31 26
Italy 2.96 .75 -0.54 36 4.73 .52 0.43 2 4.39 .76 0.23 3 4.72 .66 0.42 10
Lebanon 4.56 .66 -0.14 7 5.11 .62 0.17 37 4.96 .82 0.12 15 5.25 .67 0.29 27
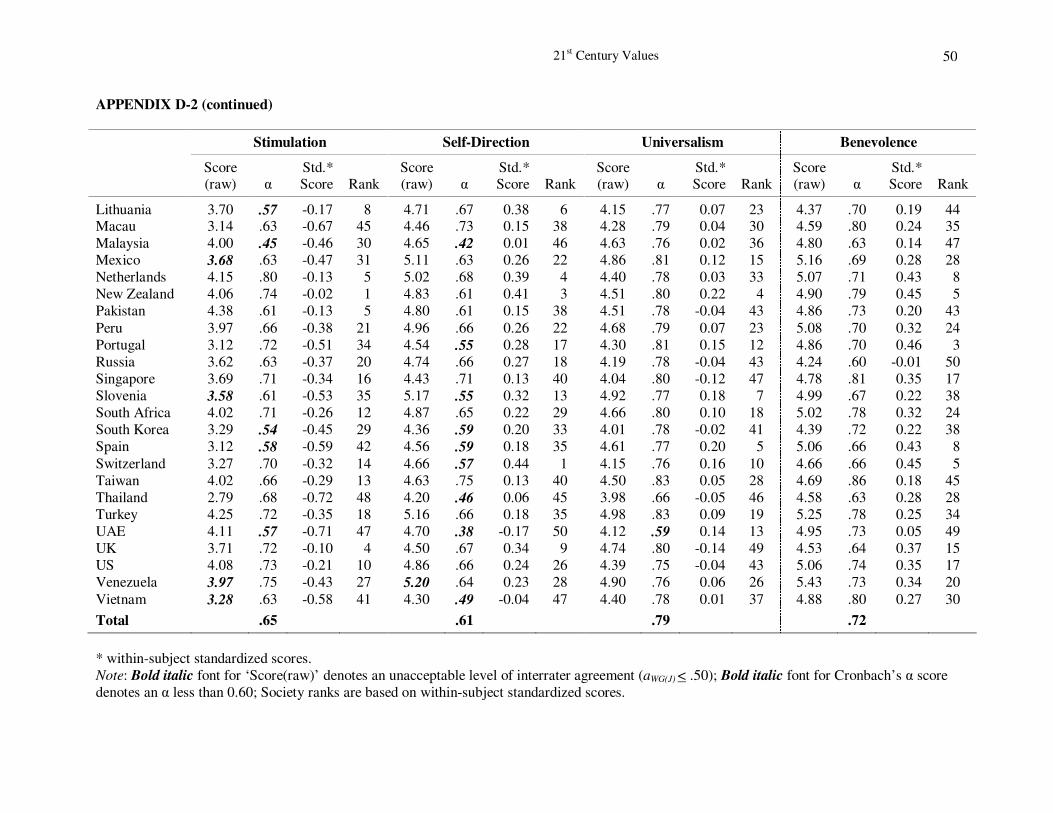
21st Century Values 50
APPENDIX D-2 (continued)
Stimulation Self-Direction Universalism Benevolence
Score (raw) α
Std.* Score Rank
Score (raw) α
Std.* Score Rank
Score (raw) α
Std.* Score Rank
Score (raw) α
Std.* Score Rank
Lithuania 3.70 .57 -0.17 8 4.71 .67 0.38 6 4.15 .77 0.07 23 4.37 .70 0.19 44 Macau 3.14 .63 -0.67 45 4.46 .73 0.15 38 4.28 .79 0.04 30 4.59 .80 0.24 35
Malaysia 4.00 .45 -0.46 30 4.65 .42 0.01 46 4.63 .76 0.02 36 4.80 .63 0.14 47
Mexico 3.68 .63 -0.47 31 5.11 .63 0.26 22 4.86 .81 0.12 15 5.16 .69 0.28 28
Netherlands 4.15 .80 -0.13 5 5.02 .68 0.39 4 4.40 .78 0.03 33 5.07 .71 0.43 8
New Zealand 4.06 .74 -0.02 1 4.83 .61 0.41 3 4.51 .80 0.22 4 4.90 .79 0.45 5
Pakistan 4.38 .61 -0.13 5 4.80 .61 0.15 38 4.51 .78 -0.04 43 4.86 .73 0.20 43
Peru 3.97 .66 -0.38 21 4.96 .66 0.26 22 4.68 .79 0.07 23 5.08 .70 0.32 24
Portugal 3.12 .72 -0.51 34 4.54 .55 0.28 17 4.30 .81 0.15 12 4.86 .70 0.46 3
Russia 3.62 .63 -0.37 20 4.74 .66 0.27 18 4.19 .78 -0.04 43 4.24 .60 -0.01 50
Singapore 3.69 .71 -0.34 16 4.43 .71 0.13 40 4.04 .80 -0.12 47 4.78 .81 0.35 17
Slovenia 3.58 .61 -0.53 35 5.17 .55 0.32 13 4.92 .77 0.18 7 4.99 .67 0.22 38
South Africa 4.02 .71 -0.26 12 4.87 .65 0.22 29 4.66 .80 0.10 18 5.02 .78 0.32 24
South Korea 3.29 .54 -0.45 29 4.36 .59 0.20 33 4.01 .78 -0.02 41 4.39 .72 0.22 38
Spain 3.12 .58 -0.59 42 4.56 .59 0.18 35 4.61 .77 0.20 5 5.06 .66 0.43 8
Switzerland 3.27 .70 -0.32 14 4.66 .57 0.44 1 4.15 .76 0.16 10 4.66 .66 0.45 5
Taiwan 4.02 .66 -0.29 13 4.63 .75 0.13 40 4.50 .83 0.05 28 4.69 .86 0.18 45
Thailand 2.79 .68 -0.72 48 4.20 .46 0.06 45 3.98 .66 -0.05 46 4.58 .63 0.28 28
Turkey 4.25 .72 -0.35 18 5.16 .66 0.18 35 4.98 .83 0.09 19 5.25 .78 0.25 34
UAE 4.11 .57 -0.71 47 4.70 .38 -0.17 50 4.12 .59 0.14 13 4.95 .73 0.05 49
UK 3.71 .72 -0.10 4 4.50 .67 0.34 9 4.74 .80 -0.14 49 4.53 .64 0.37 15
US 4.08 .73 -0.21 10 4.86 .66 0.24 26 4.39 .75 -0.04 43 5.06 .74 0.35 17
Venezuela 3.97 .75 -0.43 27 5.20 .64 0.23 28 4.90 .76 0.06 26 5.43 .73 0.34 20
Vietnam 3.28 .63 -0.58 41 4.30 .49 -0.04 47 4.40 .78 0.01 37 4.88 .80 0.27 30
Total .65 .61 .79 .72
* within-subject standardized scores.
Note: Bold italic font for ‘Score(raw)’ denotes an unacceptable level of interrater agreement (aWG(J) < .50); Bold italic font for Cronbach’s α score
denotes an α less than 0.60; Society ranks are based on within-subject standardized scores.
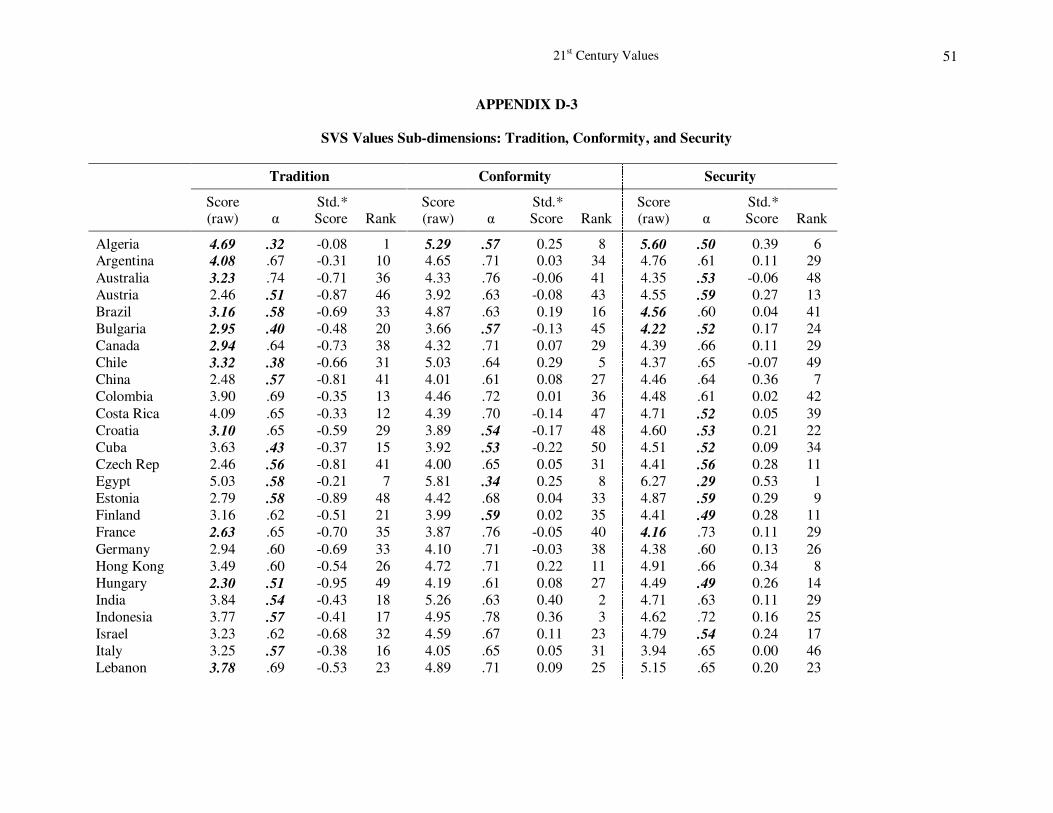
21st Century Values 51
APPENDIX D-3
SVS Values Sub-dimensions: Tradition, Conformity, and Security
Tradition Conformity Security
Score (raw) α
Std.* Score Rank
Score (raw) α
Std.* Score Rank
Score (raw) α
Std.* Score Rank
Algeria 4.69 .32 -0.08 1 5.29 .57 0.25 8 5.60 .50 0.39 6 Argentina 4.08 .67 -0.31 10 4.65 .71 0.03 34 4.76 .61 0.11 29
Australia 3.23 .74 -0.71 36 4.33 .76 -0.06 41 4.35 .53 -0.06 48
Austria 2.46 .51 -0.87 46 3.92 .63 -0.08 43 4.55 .59 0.27 13
Brazil 3.16 .58 -0.69 33 4.87 .63 0.19 16 4.56 .60 0.04 41
Bulgaria 2.95 .40 -0.48 20 3.66 .57 -0.13 45 4.22 .52 0.17 24
Canada 2.94 .64 -0.73 38 4.32 .71 0.07 29 4.39 .66 0.11 29
Chile 3.32 .38 -0.66 31 5.03 .64 0.29 5 4.37 .65 -0.07 49
China 2.48 .57 -0.81 41 4.01 .61 0.08 27 4.46 .64 0.36 7
Colombia 3.90 .69 -0.35 13 4.46 .72 0.01 36 4.48 .61 0.02 42
Costa Rica 4.09 .65 -0.33 12 4.39 .70 -0.14 47 4.71 .52 0.05 39
Croatia 3.10 .65 -0.59 29 3.89 .54 -0.17 48 4.60 .53 0.21 22
Cuba 3.63 .43 -0.37 15 3.92 .53 -0.22 50 4.51 .52 0.09 34
Czech Rep 2.46 .56 -0.81 41 4.00 .65 0.05 31 4.41 .56 0.28 11
Egypt 5.03 .58 -0.21 7 5.81 .34 0.25 8 6.27 .29 0.53 1
Estonia 2.79 .58 -0.89 48 4.42 .68 0.04 33 4.87 .59 0.29 9
Finland 3.16 .62 -0.51 21 3.99 .59 0.02 35 4.41 .49 0.28 11
France 2.63 .65 -0.70 35 3.87 .76 -0.05 40 4.16 .73 0.11 29
Germany 2.94 .60 -0.69 33 4.10 .71 -0.03 38 4.38 .60 0.13 26
Hong Kong 3.49 .60 -0.54 26 4.72 .71 0.22 11 4.91 .66 0.34 8
Hungary 2.30 .51 -0.95 49 4.19 .61 0.08 27 4.49 .49 0.26 14
India 3.84 .54 -0.43 18 5.26 .63 0.40 2 4.71 .63 0.11 29
Indonesia 3.77 .57 -0.41 17 4.95 .78 0.36 3 4.62 .72 0.16 25
Israel 3.23 .62 -0.68 32 4.59 .67 0.11 23 4.79 .54 0.24 17
Italy 3.25 .57 -0.38 16 4.05 .65 0.05 31 3.94 .65 0.00 46
Lebanon 3.78 .69 -0.53 23 4.89 .71 0.09 25 5.15 .65 0.20 23
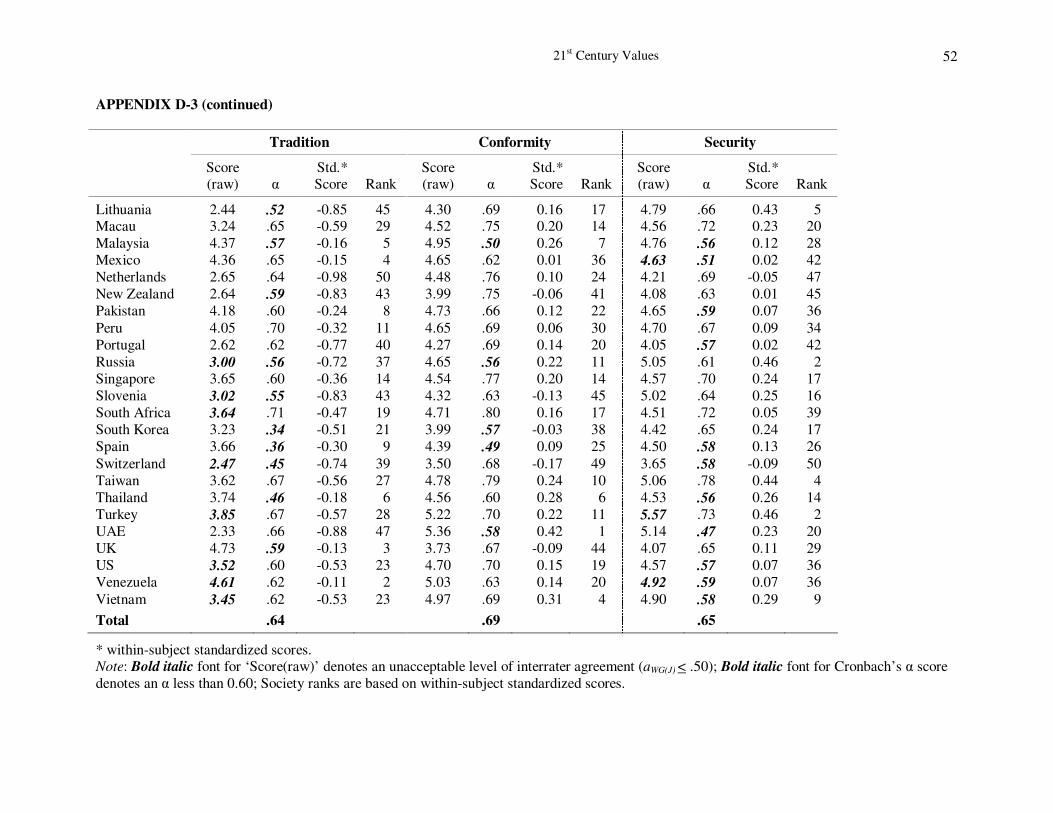
21st Century Values 52
APPENDIX D-3 (continued)
Tradition Conformity Security
Score (raw) α
Std.* Score Rank
Score (raw) α
Std.* Score Rank
Score (raw) α
Std.* Score Rank
Lithuania 2.44 .52 -0.85 45 4.30 .69 0.16 17 4.79 .66 0.43 5 Macau 3.24 .65 -0.59 29 4.52 .75 0.20 14 4.56 .72 0.23 20
Malaysia 4.37 .57 -0.16 5 4.95 .50 0.26 7 4.76 .56 0.12 28
Mexico 4.36 .65 -0.15 4 4.65 .62 0.01 36 4.63 .51 0.02 42
Netherlands 2.65 .64 -0.98 50 4.48 .76 0.10 24 4.21 .69 -0.05 47
New Zealand 2.64 .59 -0.83 43 3.99 .75 -0.06 41 4.08 .63 0.01 45
Pakistan 4.18 .60 -0.24 8 4.73 .66 0.12 22 4.65 .59 0.07 36
Peru 4.05 .70 -0.32 11 4.65 .69 0.06 30 4.70 .67 0.09 34
Portugal 2.62 .62 -0.77 40 4.27 .69 0.14 20 4.05 .57 0.02 42
Russia 3.00 .56 -0.72 37 4.65 .56 0.22 11 5.05 .61 0.46 2
Singapore 3.65 .60 -0.36 14 4.54 .77 0.20 14 4.57 .70 0.24 17
Slovenia 3.02 .55 -0.83 43 4.32 .63 -0.13 45 5.02 .64 0.25 16
South Africa 3.64 .71 -0.47 19 4.71 .80 0.16 17 4.51 .72 0.05 39
South Korea 3.23 .34 -0.51 21 3.99 .57 -0.03 38 4.42 .65 0.24 17
Spain 3.66 .36 -0.30 9 4.39 .49 0.09 25 4.50 .58 0.13 26
Switzerland 2.47 .45 -0.74 39 3.50 .68 -0.17 49 3.65 .58 -0.09 50
Taiwan 3.62 .67 -0.56 27 4.78 .79 0.24 10 5.06 .78 0.44 4
Thailand 3.74 .46 -0.18 6 4.56 .60 0.28 6 4.53 .56 0.26 14
Turkey 3.85 .67 -0.57 28 5.22 .70 0.22 11 5.57 .73 0.46 2
UAE 2.33 .66 -0.88 47 5.36 .58 0.42 1 5.14 .47 0.23 20
UK 4.73 .59 -0.13 3 3.73 .67 -0.09 44 4.07 .65 0.11 29
US 3.52 .60 -0.53 23 4.70 .70 0.15 19 4.57 .57 0.07 36
Venezuela 4.61 .62 -0.11 2 5.03 .63 0.14 20 4.92 .59 0.07 36
Vietnam 3.45 .62 -0.53 23 4.97 .69 0.31 4 4.90 .58 0.29 9
Total .64 .69 .65
* within-subject standardized scores. Note: Bold italic font for ‘Score(raw)’ denotes an unacceptable level of interrater agreement (aWG(J) < .50); Bold italic font for Cronbach’s α score
denotes an α less than 0.60; Society ranks are based on within-subject standardized scores.
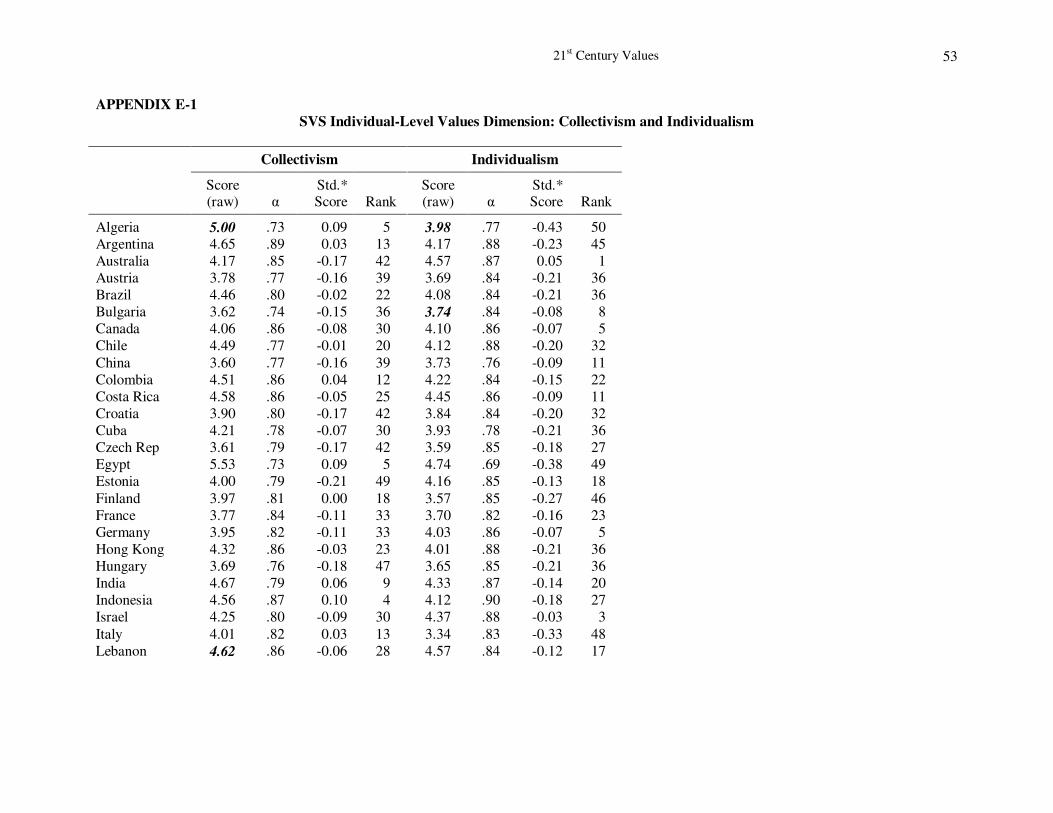
21st Century Values 53
APPENDIX E-1
SVS Individual-Level Values Dimension: Collectivism and Individualism
Collectivism Individualism
Score (raw) α
Std.* Score Rank
Score (raw) α
Std.* Score Rank
Algeria 5.00 .73 0.09 5 3.98 .77 -0.43 50
Argentina 4.65 .89 0.03 13 4.17 .88 -0.23 45
Australia 4.17 .85 -0.17 42 4.57 .87 0.05 1
Austria 3.78 .77 -0.16 39 3.69 .84 -0.21 36
Brazil 4.46 .80 -0.02 22 4.08 .84 -0.21 36
Bulgaria 3.62 .74 -0.15 36 3.74 .84 -0.08 8
Canada 4.06 .86 -0.08 30 4.10 .86 -0.07 5
Chile 4.49 .77 -0.01 20 4.12 .88 -0.20 32
China 3.60 .77 -0.16 39 3.73 .76 -0.09 11
Colombia 4.51 .86 0.04 12 4.22 .84 -0.15 22
Costa Rica 4.58 .86 -0.05 25 4.45 .86 -0.09 11
Croatia 3.90 .80 -0.17 42 3.84 .84 -0.20 32
Cuba 4.21 .78 -0.07 30 3.93 .78 -0.21 36
Czech Rep 3.61 .79 -0.17 42 3.59 .85 -0.18 27
Egypt 5.53 .73 0.09 5 4.74 .69 -0.38 49
Estonia 4.00 .79 -0.21 49 4.16 .85 -0.13 18
Finland 3.97 .81 0.00 18 3.57 .85 -0.27 46
France 3.77 .84 -0.11 33 3.70 .82 -0.16 23
Germany 3.95 .82 -0.11 33 4.03 .86 -0.07 5
Hong Kong 4.32 .86 -0.03 23 4.01 .88 -0.21 36
Hungary 3.69 .76 -0.18 47 3.65 .85 -0.21 36
India 4.67 .79 0.06 9 4.33 .87 -0.14 20
Indonesia 4.56 .87 0.10 4 4.12 .90 -0.18 27
Israel 4.25 .80 -0.09 30 4.37 .88 -0.03 3
Italy 4.01 .82 0.03 13 3.34 .83 -0.33 48
Lebanon 4.62 .86 -0.06 28 4.57 .84 -0.12 17
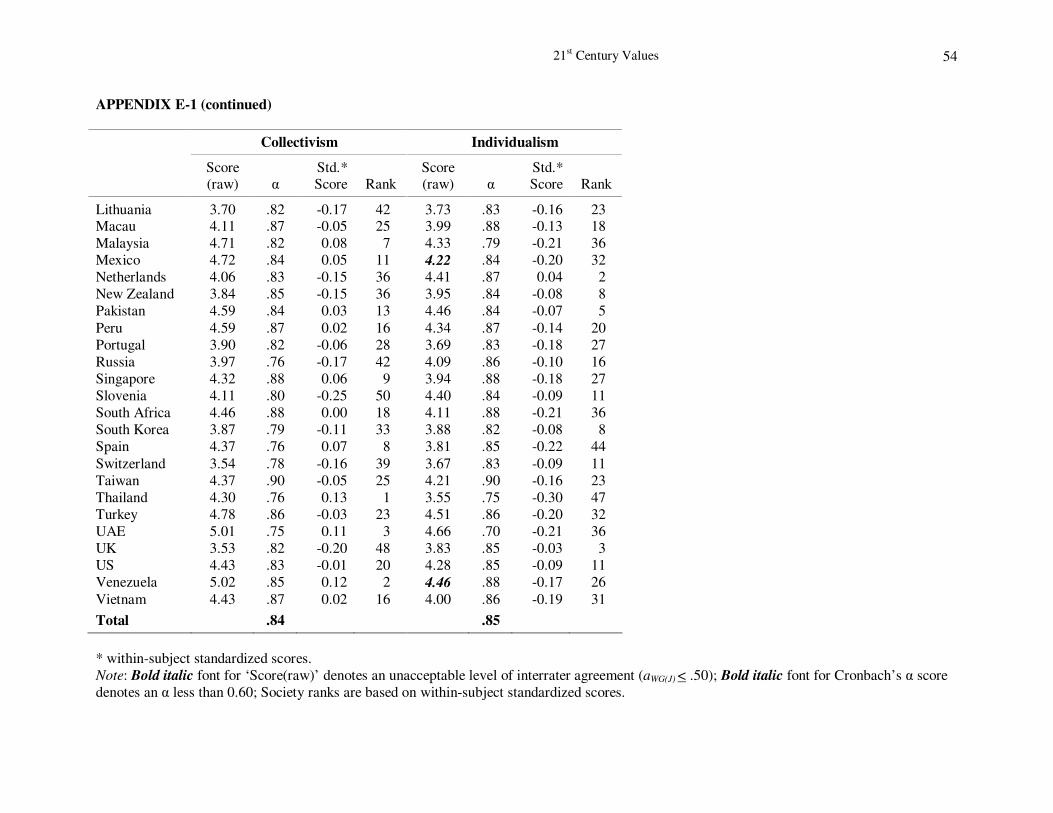
21st Century Values 54
APPENDIX E-1 (continued)
Collectivism Individualism
Score (raw) α
Std.* Score Rank
Score (raw) α
Std.* Score Rank
Lithuania 3.70 .82 -0.17 42 3.73 .83 -0.16 23 Macau 4.11 .87 -0.05 25 3.99 .88 -0.13 18
Malaysia 4.71 .82 0.08 7 4.33 .79 -0.21 36
Mexico 4.72 .84 0.05 11 4.22 .84 -0.20 32
Netherlands 4.06 .83 -0.15 36 4.41 .87 0.04 2
New Zealand 3.84 .85 -0.15 36 3.95 .84 -0.08 8
Pakistan 4.59 .84 0.03 13 4.46 .84 -0.07 5
Peru 4.59 .87 0.02 16 4.34 .87 -0.14 20
Portugal 3.90 .82 -0.06 28 3.69 .83 -0.18 27
Russia 3.97 .76 -0.17 42 4.09 .86 -0.10 16
Singapore 4.32 .88 0.06 9 3.94 .88 -0.18 27
Slovenia 4.11 .80 -0.25 50 4.40 .84 -0.09 11
South Africa 4.46 .88 0.00 18 4.11 .88 -0.21 36
South Korea 3.87 .79 -0.11 33 3.88 .82 -0.08 8
Spain 4.37 .76 0.07 8 3.81 .85 -0.22 44
Switzerland 3.54 .78 -0.16 39 3.67 .83 -0.09 11
Taiwan 4.37 .90 -0.05 25 4.21 .90 -0.16 23
Thailand 4.30 .76 0.13 1 3.55 .75 -0.30 47
Turkey 4.78 .86 -0.03 23 4.51 .86 -0.20 32
UAE 5.01 .75 0.11 3 4.66 .70 -0.21 36
UK 3.53 .82 -0.20 48 3.83 .85 -0.03 3
US 4.43 .83 -0.01 20 4.28 .85 -0.09 11
Venezuela 5.02 .85 0.12 2 4.46 .88 -0.17 26
Vietnam 4.43 .87 0.02 16 4.00 .86 -0.19 31
Total .84 .85
* within-subject standardized scores.
Note: Bold italic font for ‘Score(raw)’ denotes an unacceptable level of interrater agreement (aWG(J) < .50); Bold italic font for Cronbach’s α score
denotes an α less than 0.60; Society ranks are based on within-subject standardized scores.
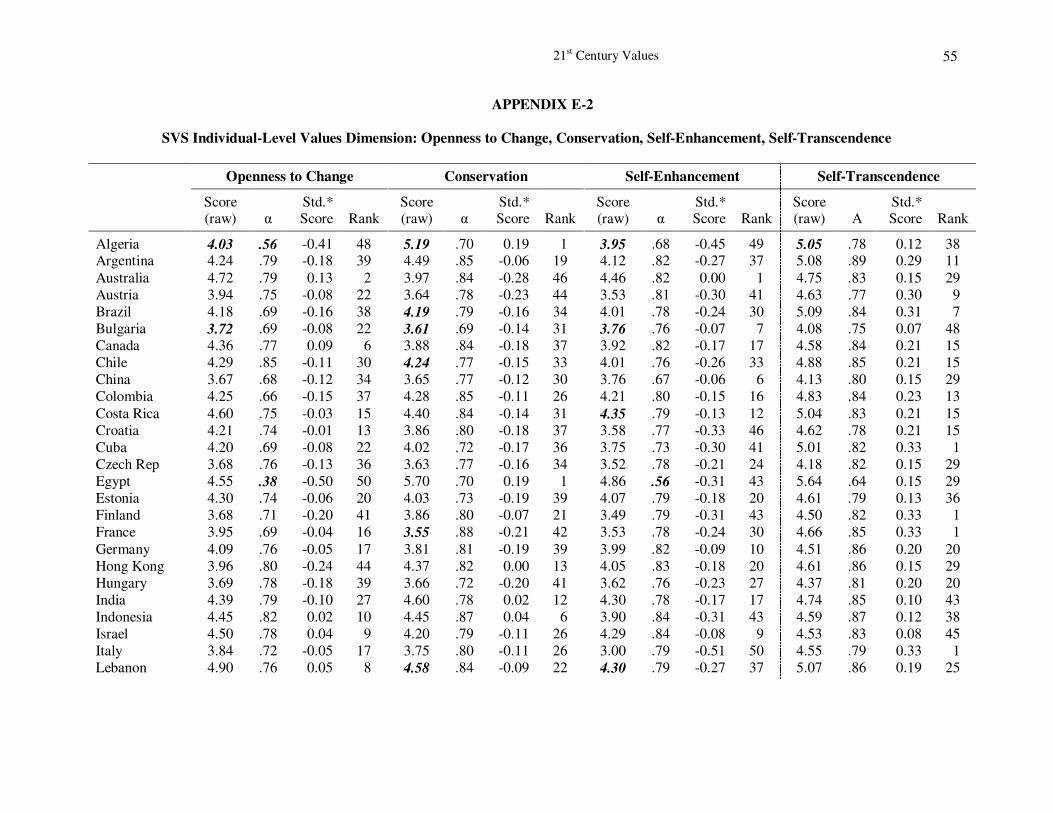
21st Century Values 55
APPENDIX E-2
SVS Individual-Level Values Dimension: Openness to Change, Conservation, Self-Enhancement, Self-Transcendence
Openness to Change Conservation Self-Enhancement Self-Transcendence
Score (raw) α
Std.* Score Rank
Score (raw) α
Std.* Score Rank
Score (raw) α
Std.* Score Rank
Score (raw) Α
Std.* Score Rank
Algeria 4.03 .56 -0.41 48 5.19 .70 0.19 1 3.95 .68 -0.45 49 5.05 .78 0.12 38 Argentina 4.24 .79 -0.18 39 4.49 .85 -0.06 19 4.12 .82 -0.27 37 5.08 .89 0.29 11
Australia 4.72 .79 0.13 2 3.97 .84 -0.28 46 4.46 .82 0.00 1 4.75 .83 0.15 29
Austria 3.94 .75 -0.08 22 3.64 .78 -0.23 44 3.53 .81 -0.30 41 4.63 .77 0.30 9
Brazil 4.18 .69 -0.16 38 4.19 .79 -0.16 34 4.01 .78 -0.24 30 5.09 .84 0.31 7
Bulgaria 3.72 .69 -0.08 22 3.61 .69 -0.14 31 3.76 .76 -0.07 7 4.08 .75 0.07 48
Canada 4.36 .77 0.09 6 3.88 .84 -0.18 37 3.92 .82 -0.17 17 4.58 .84 0.21 15
Chile 4.29 .85 -0.11 30 4.24 .77 -0.15 33 4.01 .76 -0.26 33 4.88 .85 0.21 15
China 3.67 .68 -0.12 34 3.65 .77 -0.12 30 3.76 .67 -0.06 6 4.13 .80 0.15 29
Colombia 4.25 .66 -0.15 37 4.28 .85 -0.11 26 4.21 .80 -0.15 16 4.83 .84 0.23 13
Costa Rica 4.60 .75 -0.03 15 4.40 .84 -0.14 31 4.35 .79 -0.13 12 5.04 .83 0.21 15
Croatia 4.21 .74 -0.01 13 3.86 .80 -0.18 37 3.58 .77 -0.33 46 4.62 .78 0.21 15
Cuba 4.20 .69 -0.08 22 4.02 .72 -0.17 36 3.75 .73 -0.30 41 5.01 .82 0.33 1
Czech Rep 3.68 .76 -0.13 36 3.63 .77 -0.16 34 3.52 .78 -0.21 24 4.18 .82 0.15 29
Egypt 4.55 .38 -0.50 50 5.70 .70 0.19 1 4.86 .56 -0.31 43 5.64 .64 0.15 29
Estonia 4.30 .74 -0.06 20 4.03 .73 -0.19 39 4.07 .79 -0.18 20 4.61 .79 0.13 36
Finland 3.68 .71 -0.20 41 3.86 .80 -0.07 21 3.49 .79 -0.31 43 4.50 .82 0.33 1
France 3.95 .69 -0.04 16 3.55 .88 -0.21 42 3.53 .78 -0.24 30 4.66 .85 0.33 1
Germany 4.09 .76 -0.05 17 3.81 .81 -0.19 39 3.99 .82 -0.09 10 4.51 .86 0.20 20
Hong Kong 3.96 .80 -0.24 44 4.37 .82 0.00 13 4.05 .83 -0.18 20 4.61 .86 0.15 29
Hungary 3.69 .78 -0.18 39 3.66 .72 -0.20 41 3.62 .76 -0.23 27 4.37 .81 0.20 20
India 4.39 .79 -0.10 27 4.60 .78 0.02 12 4.30 .78 -0.17 17 4.74 .85 0.10 43
Indonesia 4.45 .82 0.02 10 4.45 .87 0.04 6 3.90 .84 -0.31 43 4.59 .87 0.12 38
Israel 4.50 .78 0.04 9 4.20 .79 -0.11 26 4.29 .84 -0.08 9 4.53 .83 0.08 45
Italy 3.84 .72 -0.05 17 3.75 .80 -0.11 26 3.00 .79 -0.51 50 4.55 .79 0.33 1
Lebanon 4.90 .76 0.05 8 4.58 .84 -0.09 22 4.30 .79 -0.27 37 5.07 .86 0.19 25
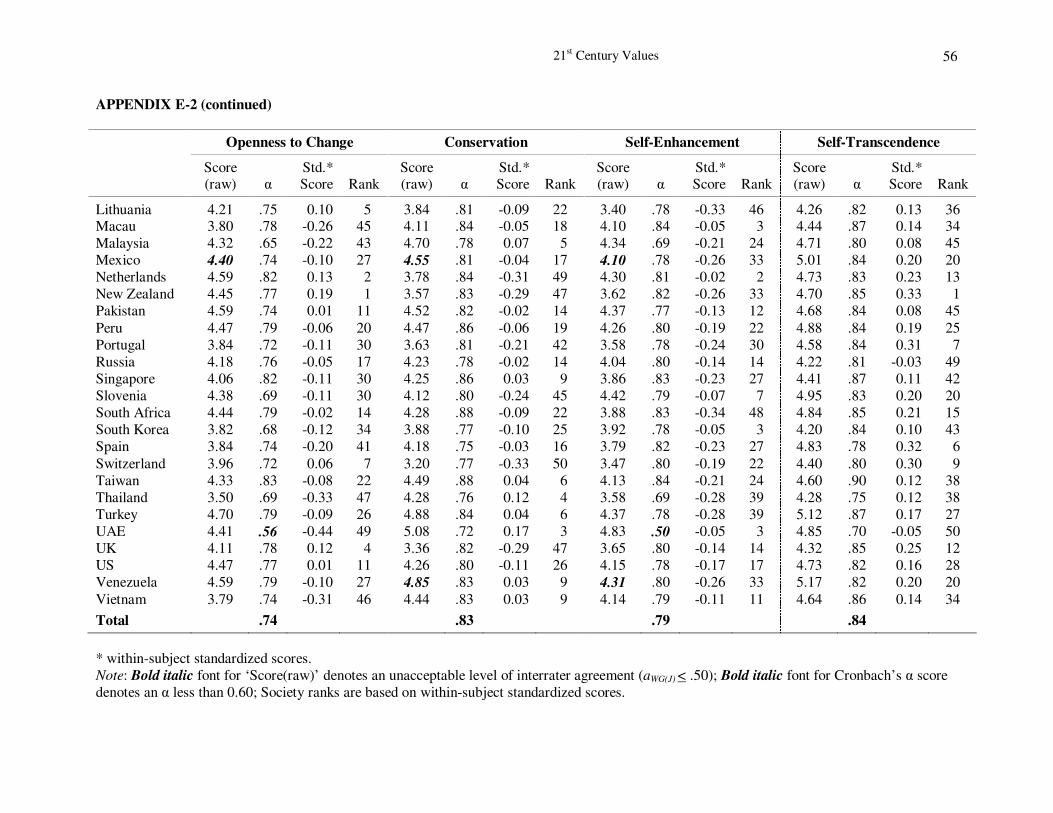
21st Century Values 56
APPENDIX E-2 (continued)
Openness to Change Conservation Self-Enhancement Self-Transcendence
Score (raw) α
Std.* Score Rank
Score (raw) α
Std.* Score Rank
Score (raw) α
Std.* Score Rank
Score (raw) α
Std.* Score Rank
Lithuania 4.21 .75 0.10 5 3.84 .81 -0.09 22 3.40 .78 -0.33 46 4.26 .82 0.13 36 Macau 3.80 .78 -0.26 45 4.11 .84 -0.05 18 4.10 .84 -0.05 3 4.44 .87 0.14 34
Malaysia 4.32 .65 -0.22 43 4.70 .78 0.07 5 4.34 .69 -0.21 24 4.71 .80 0.08 45
Mexico 4.40 .74 -0.10 27 4.55 .81 -0.04 17 4.10 .78 -0.26 33 5.01 .84 0.20 20
Netherlands 4.59 .82 0.13 2 3.78 .84 -0.31 49 4.30 .81 -0.02 2 4.73 .83 0.23 13
New Zealand 4.45 .77 0.19 1 3.57 .83 -0.29 47 3.62 .82 -0.26 33 4.70 .85 0.33 1
Pakistan 4.59 .74 0.01 11 4.52 .82 -0.02 14 4.37 .77 -0.13 12 4.68 .84 0.08 45
Peru 4.47 .79 -0.06 20 4.47 .86 -0.06 19 4.26 .80 -0.19 22 4.88 .84 0.19 25
Portugal 3.84 .72 -0.11 30 3.63 .81 -0.21 42 3.58 .78 -0.24 30 4.58 .84 0.31 7
Russia 4.18 .76 -0.05 17 4.23 .78 -0.02 14 4.04 .80 -0.14 14 4.22 .81 -0.03 49
Singapore 4.06 .82 -0.11 30 4.25 .86 0.03 9 3.86 .83 -0.23 27 4.41 .87 0.11 42
Slovenia 4.38 .69 -0.11 30 4.12 .80 -0.24 45 4.42 .79 -0.07 7 4.95 .83 0.20 20
South Africa 4.44 .79 -0.02 14 4.28 .88 -0.09 22 3.88 .83 -0.34 48 4.84 .85 0.21 15
South Korea 3.82 .68 -0.12 34 3.88 .77 -0.10 25 3.92 .78 -0.05 3 4.20 .84 0.10 43
Spain 3.84 .74 -0.20 41 4.18 .75 -0.03 16 3.79 .82 -0.23 27 4.83 .78 0.32 6
Switzerland 3.96 .72 0.06 7 3.20 .77 -0.33 50 3.47 .80 -0.19 22 4.40 .80 0.30 9
Taiwan 4.33 .83 -0.08 22 4.49 .88 0.04 6 4.13 .84 -0.21 24 4.60 .90 0.12 38
Thailand 3.50 .69 -0.33 47 4.28 .76 0.12 4 3.58 .69 -0.28 39 4.28 .75 0.12 38
Turkey 4.70 .79 -0.09 26 4.88 .84 0.04 6 4.37 .78 -0.28 39 5.12 .87 0.17 27
UAE 4.41 .56 -0.44 49 5.08 .72 0.17 3 4.83 .50 -0.05 3 4.85 .70 -0.05 50
UK 4.11 .78 0.12 4 3.36 .82 -0.29 47 3.65 .80 -0.14 14 4.32 .85 0.25 12
US 4.47 .77 0.01 11 4.26 .80 -0.11 26 4.15 .78 -0.17 17 4.73 .82 0.16 28
Venezuela 4.59 .79 -0.10 27 4.85 .83 0.03 9 4.31 .80 -0.26 33 5.17 .82 0.20 20
Vietnam 3.79 .74 -0.31 46 4.44 .83 0.03 9 4.14 .79 -0.11 11 4.64 .86 0.14 34
Total .74 .83 .79 .84
* within-subject standardized scores.
Note: Bold italic font for ‘Score(raw)’ denotes an unacceptable level of interrater agreement (aWG(J) < .50); Bold italic font for Cronbach’s α score
denotes an α less than 0.60; Society ranks are based on within-subject standardized scores.
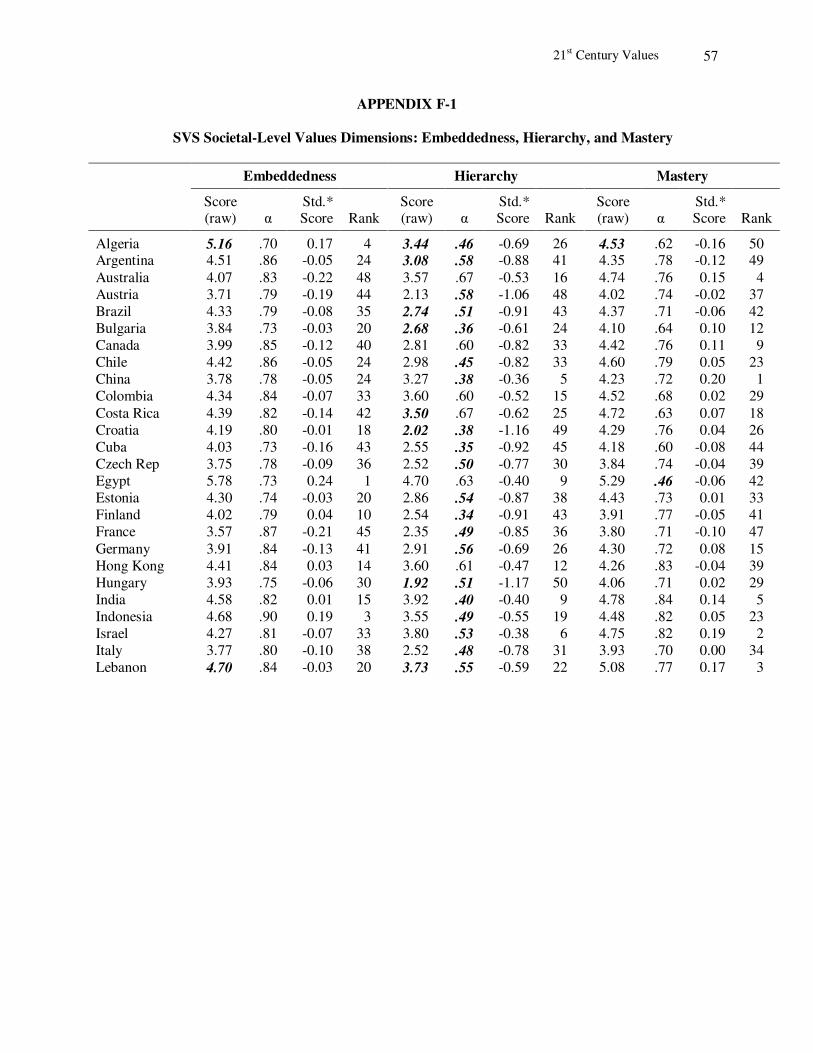
21st Century Values 57
APPENDIX F-1
SVS Societal-Level Values Dimensions: Embeddedness, Hierarchy, and Mastery
Embeddedness Hierarchy Mastery
Score (raw) α
Std.* Score Rank
Score (raw) α
Std.* Score Rank
Score (raw) α
Std.* Score Rank
Algeria 5.16 .70 0.17 4 3.44 .46 -0.69 26 4.53 .62 -0.16 50 Argentina 4.51 .86 -0.05 24 3.08 .58 -0.88 41 4.35 .78 -0.12 49
Australia 4.07 .83 -0.22 48 3.57 .67 -0.53 16 4.74 .76 0.15 4
Austria 3.71 .79 -0.19 44 2.13 .58 -1.06 48 4.02 .74 -0.02 37
Brazil 4.33 .79 -0.08 35 2.74 .51 -0.91 43 4.37 .71 -0.06 42
Bulgaria 3.84 .73 -0.03 20 2.68 .36 -0.61 24 4.10 .64 0.10 12
Canada 3.99 .85 -0.12 40 2.81 .60 -0.82 33 4.42 .76 0.11 9
Chile 4.42 .86 -0.05 24 2.98 .45 -0.82 33 4.60 .79 0.05 23
China 3.78 .78 -0.05 24 3.27 .38 -0.36 5 4.23 .72 0.20 1
Colombia 4.34 .84 -0.07 33 3.60 .60 -0.52 15 4.52 .68 0.02 29
Costa Rica 4.39 .82 -0.14 42 3.50 .67 -0.62 25 4.72 .63 0.07 18
Croatia 4.19 .80 -0.01 18 2.02 .38 -1.16 49 4.29 .76 0.04 26
Cuba 4.03 .73 -0.16 43 2.55 .35 -0.92 45 4.18 .60 -0.08 44
Czech Rep 3.75 .78 -0.09 36 2.52 .50 -0.77 30 3.84 .74 -0.04 39
Egypt 5.78 .73 0.24 1 4.70 .63 -0.40 9 5.29 .46 -0.06 42
Estonia 4.30 .74 -0.03 20 2.86 .54 -0.87 38 4.43 .73 0.01 33
Finland 4.02 .79 0.04 10 2.54 .34 -0.91 43 3.91 .77 -0.05 41
France 3.57 .87 -0.21 45 2.35 .49 -0.85 36 3.80 .71 -0.10 47
Germany 3.91 .84 -0.13 41 2.91 .56 -0.69 26 4.30 .72 0.08 15
Hong Kong 4.41 .84 0.03 14 3.60 .61 -0.47 12 4.26 .83 -0.04 39
Hungary 3.93 .75 -0.06 30 1.92 .51 -1.17 50 4.06 .71 0.02 29
India 4.58 .82 0.01 15 3.92 .40 -0.40 9 4.78 .84 0.14 5
Indonesia 4.68 .90 0.19 3 3.55 .49 -0.55 19 4.48 .82 0.05 23
Israel 4.27 .81 -0.07 33 3.80 .53 -0.38 6 4.75 .82 0.19 2
Italy 3.77 .80 -0.10 38 2.52 .48 -0.78 31 3.93 .70 0.00 34
Lebanon 4.70 .84 -0.03 20 3.73 .55 -0.59 22 5.08 .77 0.17 3

21st Century Values 58
APPENDIX F-1 (continued)
Embeddedness Hierarchy Mastery
Score (raw) α
Std.* Score Rank
Score (raw) α
Std.* Score Rank
Score (raw) α
Std.* Score Rank
Lithuania 4.08 .82 0.04 10 2.75 .47 -0.69 26 4.20 .71 0.10 12 Macau 4.18 .86 -0.01 18 3.65 .56 -0.34 3 4.25 .82 0.03 28
Malaysia 4.66 .80 0.04 10 4.17 .33 -0.34 3 4.69 .71 0.05 23
Mexico 4.52 .82 -0.05 24 3.49 .54 -0.60 23 4.63 .70 0.02 29
Netherlands 3.95 .86 -0.21 45 2.57 .55 -1.05 47 4.46 .76 0.07 18
New Zealand 3.69 .83 -0.22 48 2.57 .49 -0.87 38 4.29 .77 0.11 9
Pakistan 4.55 .83 0.00 17 3.96 .46 -0.39 7 4.68 .76 0.08 15
Peru 4.50 .86 -0.03 20 3.64 .62 -0.58 20 4.68 .75 0.07 18
Portugal 3.82 .82 -0.11 39 2.47 .46 -0.86 37 4.19 .69 0.09 14
Russia 4.41 .79 0.09 5 3.63 .27 -0.39 7 4.41 .77 0.08 15
Singapore 4.28 .86 0.04 10 3.55 .58 -0.42 11 4.32 .78 0.06 22
Slovenia 4.40 .82 -0.09 36 2.81 .47 -0.95 46 4.82 .70 0.14 5
South Africa 4.33 .87 -0.06 30 3.00 .53 -0.87 38 4.59 .79 0.07 18
South Korea 3.96 .81 -0.05 24 3.19 .54 -0.51 14 4.05 .70 0.02 29
Spain 4.15 .77 -0.05 24 3.14 .54 -0.58 20 4.01 .72 -0.11 48
Switzerland 3.31 .80 -0.27 50 2.19 .50 -0.88 41 3.81 .71 -0.01 35
Taiwan 4.53 .89 0.07 7 3.74 .60 -0.49 13 4.40 .86 -0.02 37
Thailand 4.20 .75 0.08 6 3.10 .41 -0.53 16 3.92 .55 -0.09 46
Turkey 4.93 .84 0.06 9 3.95 .57 -0.53 16 5.04 .78 0.11 9
UAE 5.14 .72 0.23 2 4.62 .42 -0.23 1 4.80 .66 -0.08 44
UK 3.51 .82 -0.21 45 2.53 .58 -0.78 31 4.11 .75 0.12 8
US 4.34 .80 -0.06 30 3.02 .56 -0.84 35 4.51 .68 0.04 26
Venezuela 4.82 .84 0.01 15 3.51 .57 -0.70 29 4.77 .77 -0.01 35
Vietnam 4.51 .84 0.07 7 3.86 .67 -0.27 2 4.59 .75 0.13 7
Total 4.20 .84 -0.05 3.10 .57 -0.68 4.36 .73 0.04
* within-subject standardized scores. Note: Bold italic font for ‘Score(raw)’ denotes an unacceptable level of interrater agreement (aWG(J) < .50);
Bold italic font for Cronbach’s α score denotes an α less than 0.60; Society ranks are based on within-
subject standardized scores.
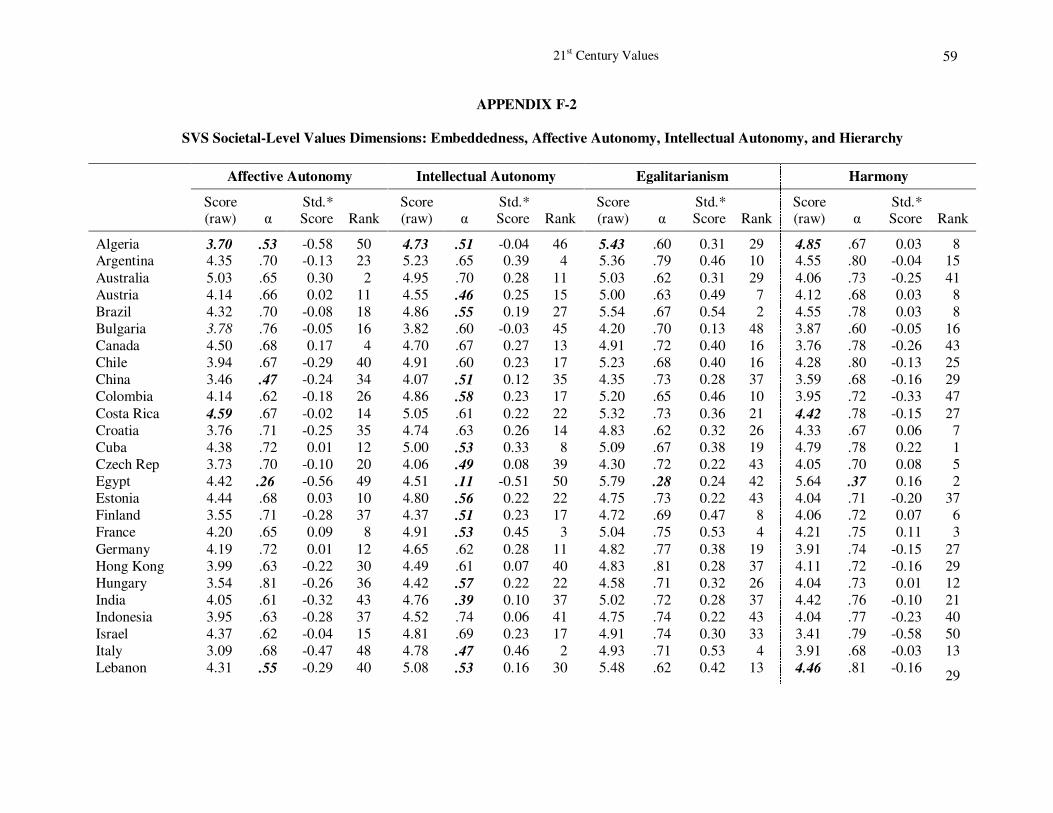
21st Century Values 59
APPENDIX F-2
SVS Societal-Level Values Dimensions: Embeddedness, Affective Autonomy, Intellectual Autonomy, and Hierarchy
Affective Autonomy Intellectual Autonomy Egalitarianism Harmony
Score (raw) α
Std.* Score Rank
Score (raw) α
Std.* Score Rank
Score (raw) α
Std.* Score Rank
Score (raw) α
Std.* Score Rank
Algeria 3.70 .53 -0.58 50 4.73 .51 -0.04 46 5.43 .60 0.31 29 4.85 .67 0.03 8 Argentina 4.35 .70 -0.13 23 5.23 .65 0.39 4 5.36 .79 0.46 10 4.55 .80 -0.04 15
Australia 5.03 .65 0.30 2 4.95 .70 0.28 11 5.03 .62 0.31 29 4.06 .73 -0.25 41
Austria 4.14 .66 0.02 11 4.55 .46 0.25 15 5.00 .63 0.49 7 4.12 .68 0.03 8
Brazil 4.32 .70 -0.08 18 4.86 .55 0.19 27 5.54 .67 0.54 2 4.55 .78 0.03 8
Bulgaria 3.78 .76 -0.05 16 3.82 .60 -0.03 45 4.20 .70 0.13 48 3.87 .60 -0.05 16
Canada 4.50 .68 0.17 4 4.70 .67 0.27 13 4.91 .72 0.40 16 3.76 .78 -0.26 43
Chile 3.94 .67 -0.29 40 4.91 .60 0.23 17 5.23 .68 0.40 16 4.28 .80 -0.13 25
China 3.46 .47 -0.24 34 4.07 .51 0.12 35 4.35 .73 0.28 37 3.59 .68 -0.16 29
Colombia 4.14 .62 -0.18 26 4.86 .58 0.23 17 5.20 .65 0.46 10 3.95 .72 -0.33 47
Costa Rica 4.59 .67 -0.02 14 5.05 .61 0.22 22 5.32 .73 0.36 21 4.42 .78 -0.15 27
Croatia 3.76 .71 -0.25 35 4.74 .63 0.26 14 4.83 .62 0.32 26 4.33 .67 0.06 7
Cuba 4.38 .72 0.01 12 5.00 .53 0.33 8 5.09 .67 0.38 19 4.79 .78 0.22 1
Czech Rep 3.73 .70 -0.10 20 4.06 .49 0.08 39 4.30 .72 0.22 43 4.05 .70 0.08 5
Egypt 4.42 .26 -0.56 49 4.51 .11 -0.51 50 5.79 .28 0.24 42 5.64 .37 0.16 2
Estonia 4.44 .68 0.03 10 4.80 .56 0.22 22 4.75 .73 0.22 43 4.04 .71 -0.20 37
Finland 3.55 .71 -0.28 37 4.37 .51 0.23 17 4.72 .69 0.47 8 4.06 .72 0.07 6
France 4.20 .65 0.09 8 4.91 .53 0.45 3 5.04 .75 0.53 4 4.21 .75 0.11 3
Germany 4.19 .72 0.01 12 4.65 .62 0.28 11 4.82 .77 0.38 19 3.91 .74 -0.15 27
Hong Kong 3.99 .63 -0.22 30 4.49 .61 0.07 40 4.83 .81 0.28 37 4.11 .72 -0.16 29
Hungary 3.54 .81 -0.26 36 4.42 .57 0.22 22 4.58 .71 0.32 26 4.04 .73 0.01 12
India 4.05 .61 -0.32 43 4.76 .39 0.10 37 5.02 .72 0.28 37 4.42 .76 -0.10 21
Indonesia 3.95 .63 -0.28 37 4.52 .74 0.06 41 4.75 .74 0.22 43 4.04 .77 -0.23 40
Israel 4.37 .62 -0.04 15 4.81 .69 0.23 17 4.91 .74 0.30 33 3.41 .79 -0.58 50
Italy 3.09 .68 -0.47 48 4.78 .47 0.46 2 4.93 .71 0.53 4 3.91 .68 -0.03 13
Lebanon 4.31 .55 -0.29 40 5.08 .53 0.16 30 5.48 .62 0.42 13 4.46 .81 -0.16 29
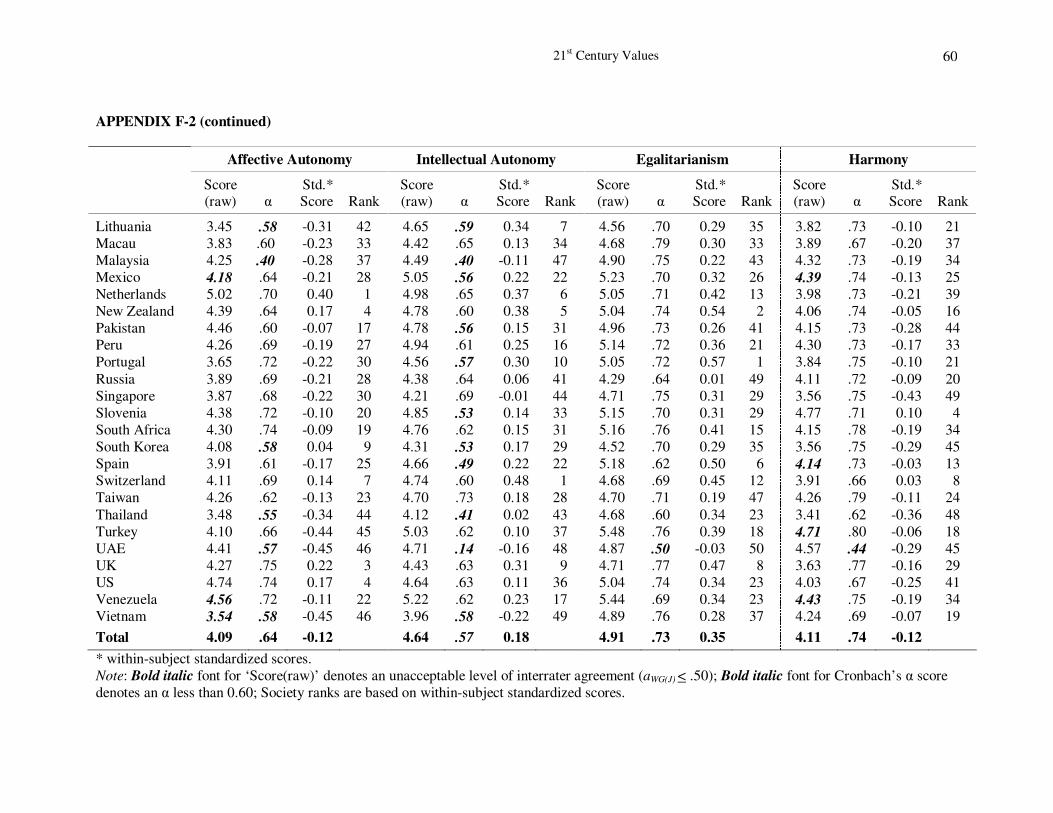
21st Century Values 60
APPENDIX F-2 (continued)
Affective Autonomy Intellectual Autonomy Egalitarianism Harmony
Score (raw) α
Std.* Score Rank
Score (raw) α
Std.* Score Rank
Score (raw) α
Std.* Score Rank
Score (raw) α
Std.* Score Rank
Lithuania 3.45 .58 -0.31 42 4.65 .59 0.34 7 4.56 .70 0.29 35 3.82 .73 -0.10 21
Macau 3.83 .60 -0.23 33 4.42 .65 0.13 34 4.68 .79 0.30 33 3.89 .67 -0.20 37
Malaysia 4.25 .40 -0.28 37 4.49 .40 -0.11 47 4.90 .75 0.22 43 4.32 .73 -0.19 34
Mexico 4.18 .64 -0.21 28 5.05 .56 0.22 22 5.23 .70 0.32 26 4.39 .74 -0.13 25
Netherlands 5.02 .70 0.40 1 4.98 .65 0.37 6 5.05 .71 0.42 13 3.98 .73 -0.21 39
New Zealand 4.39 .64 0.17 4 4.78 .60 0.38 5 5.04 .74 0.54 2 4.06 .74 -0.05 16
Pakistan 4.46 .60 -0.07 17 4.78 .56 0.15 31 4.96 .73 0.26 41 4.15 .73 -0.28 44
Peru 4.26 .69 -0.19 27 4.94 .61 0.25 16 5.14 .72 0.36 21 4.30 .73 -0.17 33
Portugal 3.65 .72 -0.22 30 4.56 .57 0.30 10 5.05 .72 0.57 1 3.84 .75 -0.10 21
Russia 3.89 .69 -0.21 28 4.38 .64 0.06 41 4.29 .64 0.01 49 4.11 .72 -0.09 20
Singapore 3.87 .68 -0.22 30 4.21 .69 -0.01 44 4.71 .75 0.31 29 3.56 .75 -0.43 49
Slovenia 4.38 .72 -0.10 20 4.85 .53 0.14 33 5.15 .70 0.31 29 4.77 .71 0.10 4
South Africa 4.30 .74 -0.09 19 4.76 .62 0.15 31 5.16 .76 0.41 15 4.15 .78 -0.19 34
South Korea 4.08 .58 0.04 9 4.31 .53 0.17 29 4.52 .70 0.29 35 3.56 .75 -0.29 45
Spain 3.91 .61 -0.17 25 4.66 .49 0.22 22 5.18 .62 0.50 6 4.14 .73 -0.03 13
Switzerland 4.11 .69 0.14 7 4.74 .60 0.48 1 4.68 .69 0.45 12 3.91 .66 0.03 8
Taiwan 4.26 .62 -0.13 23 4.70 .73 0.18 28 4.70 .71 0.19 47 4.26 .79 -0.11 24
Thailand 3.48 .55 -0.34 44 4.12 .41 0.02 43 4.68 .60 0.34 23 3.41 .62 -0.36 48
Turkey 4.10 .66 -0.44 45 5.03 .62 0.10 37 5.48 .76 0.39 18 4.71 .80 -0.06 18
UAE 4.41 .57 -0.45 46 4.71 .14 -0.16 48 4.87 .50 -0.03 50 4.57 .44 -0.29 45
UK 4.27 .75 0.22 3 4.43 .63 0.31 9 4.71 .77 0.47 8 3.63 .77 -0.16 29
US 4.74 .74 0.17 4 4.64 .63 0.11 36 5.04 .74 0.34 23 4.03 .67 -0.25 41
Venezuela 4.56 .72 -0.11 22 5.22 .62 0.23 17 5.44 .69 0.34 23 4.43 .75 -0.19 34
Vietnam 3.54 .58 -0.45 46 3.96 .58 -0.22 49 4.89 .76 0.28 37 4.24 .69 -0.07 19
Total 4.09 .64 -0.12 4.64 .57 0.18 4.91 .73 0.35 4.11 .74 -0.12
* within-subject standardized scores.
Note: Bold italic font for ‘Score(raw)’ denotes an unacceptable level of interrater agreement (aWG(J) < .50); Bold italic font for Cronbach’s α score
denotes an α less than 0.60; Society ranks are based on within-subject standardized scores.