Journal Of Business & Economics Research September 2005 ...
12
Journal Of Business & Economics Research – September 2005 Volume 3, Number 9 57 Managerial Performance Measures And Shareholder Value Creation: The Case Of Latin American Companies Eduardo E. Sandoval, (E-mail: [email protected]), ITESM, Mexico Arturo Z. Vásquez Párraga, (E-mail: [email protected]), University of Texas-Pan American ABSTRACT In this paper we examine whether Economic Value Added (EVA TM ) is a good predictor of shareholder value creation (SVC) for a group of Latin American companies. We also examine whether EVA TM is a better predictor of SVC than competing accounting-based measures of managerial performance. The relationship of these predictors to SVC is paramount in a study of factors influencing shareholder value creation such as the compensation of a firm’s executives. Our results show strong correlations between EVA TM and SVC. They also indicate that EVA TM outperforms competing measures even after controlling for the potential effects that these last metrics have on SVC. Moreover, they reveal different levels of SVC sensitivity to changes in EVA TM across countries and significant differences in EVA’s association with SVC across industries. INTRODUCTION conomic Value Added (EVA TM ) is increasingly replacing traditional accounting measures for evaluation of both value creation and executive compensation plans in U.S. companies. Coca-Cola, AT&T, Quaker Oats, Briggs & Stratton, and CSX are some companies that use EVA TM as a managerial performance measure. However, there is a paucity of empirical studies evaluating the advantages of EVA TM over other accounting measures when it comes to explaining shareholder value creation (SVC) for either pooled- country companies or industrial sectors within a given country. In this paper we evaluate the effects of EVA TM on SVC. More specifically, we evaluate whether EVA TM is a better predictor of SVC than other accounting measures such as net income and operating cash flow in two configurations, pooled-country companies and industrial sectors during an eight-year period (1994-2002). To accomplish this evaluation, we studied firms in Argentina, Brazil, Chile, and Mexico. The selected companies are the most equity capitalized within each country and belong to a variety of industrial sectors such as agriculture, commerce, food-beverage, electric power, mining, steel-metallurgy, vehicles, and telecommunications. This industrial array provides a rich field in which to perform our evaluation. Our research differs from studies previously published in the financial literature in at least two relevant ways. First, previous investigations concentrated primarily on U. S. companies, despite the fact that the increasing internationalization faced by multinationals and local companies has raised similar issues in emerging economies. Undoubtedly, both types of companies need to be aware of and familiar with the emerging approaches for executive compensation and the effects these approaches have on companies’ financial and stock market performance. In fact, many companies in emerging economies are adopting economic-based performance measures such as EVA TM to drive an effective executive compensation mechanism to incentivate SVC. Second, few authors have formally studied the statistical relationship between EVA TM and abnormal return (Bacidore et al., 1997), a stock market measure of SVC, which accounts for the difference between realized and required returns generated from some assets’ pricing specification. Bacidore et al. (1997) analyzed the above relationship, but they studied only U. S. companies, thus the empirical evidence describing this relationship in emerging Latin American economies is rather scarce. Other than Sandoval’s (2001) study of Chilean firms and their E brought to you by CORE View metadata, citation and similar papers at core.ac.uk provided by Clute Institute: Journals
Transcript of Journal Of Business & Economics Research September 2005 ...

Journal Of Business & Economics Research – September 2005 Volume 3, Number 9
57
Managerial Performance Measures And Shareholder Value Creation:
The Case Of Latin American Companies Eduardo E. Sandoval, (E-mail: [email protected]), ITESM, Mexico
Arturo Z. Vásquez Párraga, (E-mail: [email protected]), University of Texas-Pan American
ABSTRACT
In this paper we examine whether Economic Value Added (EVATM
) is a good predictor of shareholder value creation (SVC) for a group of Latin American companies. We also examine whether EVA
TM is a
better predictor of SVC than competing accounting-based measures of managerial performance. The relationship of these predictors to SVC is paramount in a study of factors influencing shareholder value creation such as the compensation of a firm’s executives. Our results show strong correlations between EVA
TM and SVC. They also indicate that EVA
TM outperforms competing measures even after
controlling for the potential effects that these last metrics have on SVC. Moreover, they reveal different levels of SVC sensitivity to changes in EVA
TM across countries and significant differences in EVA’s
association with SVC across industries.
INTRODUCTION
conomic Value Added (EVATM
) is increasingly replacing traditional accounting measures for evaluation of both value creation and executive compensation plans in U.S. companies. Coca-Cola, AT&T, Quaker Oats, Briggs & Stratton, and CSX are some companies that use EVA
TM as a managerial performance
measure. However, there is a paucity of empirical studies evaluating the advantages of EVATM
over other accounting measures when it comes to explaining shareholder value creation (SVC) for either pooled-
country companies or industrial sectors within a given country. In this paper we evaluate the effects of EVA
TM on SVC. More specifically, we evaluate whether EVA
TM is a
better predictor of SVC than other accounting measures such as net income and operating cash flow in two configurations, pooled-country companies and industrial sectors during an eight-year period (1994-2002). To accomplish this evaluation, we studied firms in Argentina, Brazil, Chile, and Mexico. The selected companies are the most equity capitalized within each country and belong to a variety of industrial sectors such as agriculture, commerce, food-beverage, electric power, mining, steel-metallurgy, vehicles, and telecommunications. This industrial array provides a rich field in which to perform our evaluation. Our research differs from studies previously published in the financial literature in at least two relevant ways. First, previous investigations concentrated primarily on U. S. companies, despite the fact that the increasing internationalization faced by multinationals and local companies has raised similar issues in emerging economies. Undoubtedly, both types of companies need to be aware of and familiar with the emerging approaches for executive compensation and the effects these approaches have on companies’ financial and stock market performance. In fact, many companies in emerging economies are adopting economic-based performance measures such as EVA
TM to drive
an effective executive compensation mechanism to incentivate SVC. Second, few authors have formally studied the statistical relationship between EVA
TM and abnormal return
(Bacidore et al., 1997), a stock market measure of SVC, which accounts for the difference between realized and required returns generated from some assets’ pricing specification. Bacidore et al. (1997) analyzed the above relationship, but they studied only U. S. companies, thus the empirical evidence describing this relationship in emerging Latin American economies is rather scarce. Other than Sandoval’s (2001) study of Chilean firms and their
E
brought to you by COREView metadata, citation and similar papers at core.ac.uk
provided by Clute Institute: Journals

Journal Of Business & Economics Research – September 2005 Volume 3, Number 9
58
industries, no international studies have been published that enable a comparison of results among emerging Latin American companies and their industrial sectors. We first compare the explanatory power of EVA
TM against competing accounting measures for the period of
1994-2002, before and after controlling for the last metrics. Having identified the best measure for predicting SVC, we examine cross-country and cross-industry differences by pooling and comparing company data across countries and across industries. The following section reviews previous studies of financial performance measures and their relationships with stock price and abnormal returns. The next section presents the methodology used including the measurement of SVC, the sample used, and the methods of analysis. The last sections present and discuss the empirical findings, conclusions, and suggestions for future research.
MANAGERIAL PERFORMANCE MEASURES Neoclassical theory (Modigliani and Miller, 1958, 1963) assumes that managers make decisions that maximize shareholders’ wealth. In practice, however, shareholders must monitor management decisions to ensure that executives opt for decisions that are in line with shareholder interests. When problems arise, owners typically incur expenses to monitor costs so as to keep management’s performance incentives in line. In doing so, however, owners who want to be sure that management behaves according to the owners’ interest may find themselves confronting a trade-off between monitoring costs and compensating executives. It is assumed that when managers receive compensation contracts that align the increase of their own wealth to that of company shareholders, they will make decisions closely aligned with shareholders’ interests. The question is: which management performance measure is the most adequate for a contract to be effective. Jensen and Murphy (1990) and Milbourn (1996) argue that the best performance measure is the stock price itself. Stock prices or returns based on stock prices, however, may not be effective measures because they are exposed to and influenced by factors beyond management’s control. Treatment of previous problems with stock-based compensation when used as a mechanism for better aligning managerial interests with those of shareholders shows that stock-based compensation is effective because insiders and outsiders systematically evaluate a CEO’s performance. Thus, a “good” management performance measure, when used as mechanism for executive compensation, can be expected to have a high correlation with shareholder wealth. Moreover the measure will not be affected by the “randomness” associated with a firm's stock price determination.
Economic Value Added (EVATM
)
A relatively new measure, Economic Value Added (EVA
TM) was introduced to solve problems associated
with stock-based managerial compensation. This metric, first suggested by Stern Stewart Management Services (Stewart, 1991), is a measure of surplus value created once the firm has been able to cover all its costs of capital, and it links the firm’s accounting data to its stock market performance (Stewart, 1991). Formally EVA
TM is defined as
EVA = NOPAT - Kw(NA) (1) where NOPAT is the net operating profits after taxes, Kw is the weighted-average cost of capital, and NA is defined as the adjusted book value of net capital at the beginning of the period. An important issue associated with EVA
TM concerns its theoretical foundation: does it have one? Rogerson
(1997) derived a theoretical model demonstrating that managerial investment incentives are affected by alternative allocation rules when managerial compensation is determined by accounting measures of income such as allocations for capital expenditures. Rogerson’s model assumes well-informed managers, risk-averse shareholders, and an investment decision process that maximizes the expected discounted cash flows. The main advantage of the model is

Journal Of Business & Economics Research – September 2005 Volume 3, Number 9
59
its unique allocation rule that motivates the manager to select an efficient investment level. The income measure created by this allocation rule is usually referred to as “residual income,” or economic value added (EVA
TM).
Another advantage of EVA
TM is that when using residual income as a performance measure for managerial
performance, it includes the cost of equity in addition to the cost of debt. Unlike market-based measures, such as MVA (Market Value Added), which don’t take into account the capital costs of the firm, EVA
TM also can be calculated at
divisional level (Strategic Business Units) and it is essentially a residual flow that can be used for performance evaluation over time. Unlike accounting measures, such as EBIT (Earnings before interests and taxes), OCF (Operating cash flows), NI (Net income) and EPS (Earnings per share), EVA
TM is economic and is based on the idea
that a company must over both the operating costs and the capital costs. Therefore, the increasing use of EVATM
measure would seem justified and promising. In evaluating EVA
TM, we observe that its sponsors have traditionally looked to see whether EVA
TM
dominates net income (NI) and operating cash flow (OCF) in relation to annual stock returns. A variety of empirical studies examine the relationship between EVA
TM, alternative measures, and stock returns or firm values (Biddle,
Bowen & Wallace, 1999; Chen & Dodd, 1997; O’Byrne, 1995; Peterson & Peterson, 1996). Biddle, Bowen & Wallace (1999), for instance, study 6,174 firm-years over the period 1984-1993 to evaluate the correlation between EVA
TM and stock prices. Their results show that EVA
TM does not fit the data better than traditional accounting
earnings in relation to stock returns and firm values. Sandoval (2001) points out that a central defect in these studies is the assumption that a high correlation between EVA
TM and stock price indicates that high EVA
TM investments are related to wealth changes. This assumption
is negated by the possibility that a perfect correlation between EVATM
measure and stock price can be accompanied by a significant but negative performance of the stock in the market. The rationale for the negation is found in the “benchmark” used to measure how well a stock performs in terms of creating value. Such insights offer a lesson: before analyzing the correlation between any performance measure and shareholders’ wealth, we should first find an appropriate measure to evaluate changes in their wealth.
Capital Asset Pricing Model (CAPM) One asset-pricing model that has a theoretical basis and enables us to address the above issue is the capital asset pricing model (CAPM), which focuses on securities’ equilibrium pricing process. Among other properties, any significant deviation from the CAPM equilibrium would indicate an abnormal return, which in turn is a measure of increase or decrease in shareholders’ wealth. An abnormal return shows the return that shareholders obtain in excess of earnings required on a stock given its systematic risk. If this excess return is positive, shareholders obtain more than their risk-adjusted opportunity cost of providing capital. Conversely, if this excess return is negative, they get less than their risk-adjusted opportunity cost. Therefore, a “good” financial performance measure should have a high correlation with abnormal stock returns. Yet, empirical studies that examine the relationship between EVA
TM and abnormal returns for U. S.
companies or companies in emerging economies are scarce. Basing their conclusions on results involving U. S. companies, Bacidore et al. (1997) conclude that EVA
TM correlates well with a proxy of abnormal returns defined as
“Jensen’s alpha” (Jensen, 1968, 1969). These authors point out that SVC is generated by physical assets in place and strategies linked to a firm’s future business growth opportunities. They also note that both value creation drivers are appropriate in decision-making by a firm’s senior executives. But there is virtually no empirical research available on companies from emerging economies (particularly companies from Latin America) that would enable us to analyze EVA
TM to see whether it is a superior managerial performance measure oriented to SVC across markets or it is a
superior managerial performance measure when industrial sectors within a given country are compared.
The Importance of Abnormal Returns
Shareholders can obtain a return on a stock in two ways: through dividends and/or capital gains. In any period of time, t, the shareholder return for firm j can be defined as
Journal Of Business & Economics Research – September 2005 Volume 3, Number 9
60
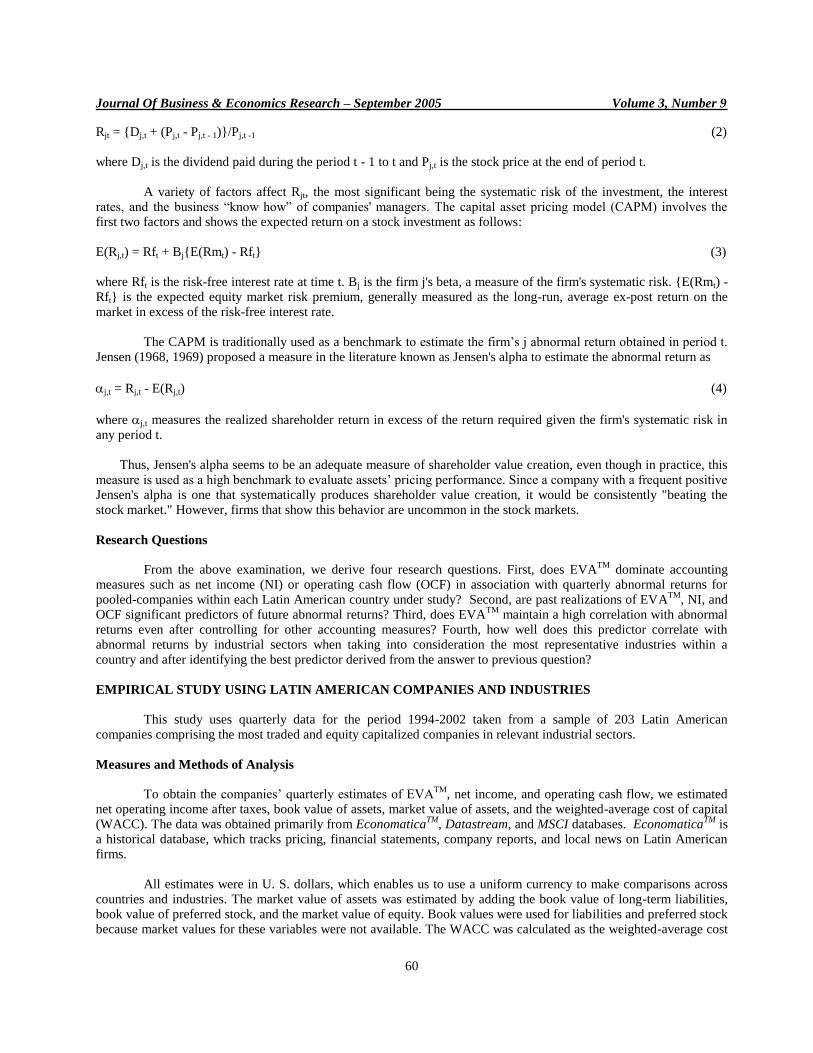
Rjt = {Dj,t + (Pj,t - Pj,t - 1)}/Pj,t -1 (2) where Dj,t is the dividend paid during the period t - 1 to t and Pj,t is the stock price at the end of period t.
A variety of factors affect Rjt, the most significant being the systematic risk of the investment, the interest rates, and the business “know how” of companies' managers. The capital asset pricing model (CAPM) involves the first two factors and shows the expected return on a stock investment as follows:
E(Rj,t) = Rft + Bj{E(Rmt) - Rft} (3) where Rft is the risk-free interest rate at time t. Bj is the firm j's beta, a measure of the firm's systematic risk. {E(Rmt) - Rft} is the expected equity market risk premium, generally measured as the long-run, average ex-post return on the market in excess of the risk-free interest rate.
The CAPM is traditionally used as a benchmark to estimate the firm’s j abnormal return obtained in period t. Jensen (1968, 1969) proposed a measure in the literature known as Jensen's alpha to estimate the abnormal return as
j,t = Rj,t - E(Rj,t) (4)
where j,t measures the realized shareholder return in excess of the return required given the firm's systematic risk in any period t. Thus, Jensen's alpha seems to be an adequate measure of shareholder value creation, even though in practice, this measure is used as a high benchmark to evaluate assets’ pricing performance. Since a company with a frequent positive Jensen's alpha is one that systematically produces shareholder value creation, it would be consistently "beating the stock market." However, firms that show this behavior are uncommon in the stock markets.
Research Questions
From the above examination, we derive four research questions. First, does EVA
TM dominate accounting
measures such as net income (NI) or operating cash flow (OCF) in association with quarterly abnormal returns for pooled-companies within each Latin American country under study? Second, are past realizations of EVA
TM, NI, and
OCF significant predictors of future abnormal returns? Third, does EVATM
maintain a high correlation with abnormal returns even after controlling for other accounting measures? Fourth, how well does this predictor correlate with abnormal returns by industrial sectors when taking into consideration the most representative industries within a country and after identifying the best predictor derived from the answer to previous question?
EMPIRICAL STUDY USING LATIN AMERICAN COMPANIES AND INDUSTRIES This study uses quarterly data for the period 1994-2002 taken from a sample of 203 Latin American companies comprising the most traded and equity capitalized companies in relevant industrial sectors.
Measures and Methods of Analysis
To obtain the companies’ quarterly estimates of EVA
TM, net income, and operating cash flow, we estimated
net operating income after taxes, book value of assets, market value of assets, and the weighted-average cost of capital (WACC). The data was obtained primarily from Economatica
TM, Datastream, and MSCI databases. Economatica
TM is
a historical database, which tracks pricing, financial statements, company reports, and local news on Latin American firms. All estimates were in U. S. dollars, which enables us to use a uniform currency to make comparisons across countries and industries. The market value of assets was estimated by adding the book value of long-term liabilities, book value of preferred stock, and the market value of equity. Book values were used for liabilities and preferred stock because market values for these variables were not available. The WACC was calculated as the weighted-average cost
Journal Of Business & Economics Research – September 2005 Volume 3, Number 9
61
of long-term liabilities, preferred stock, and equity where the weights used were the proxies available on the basis of our estimates of its market-based capital structure. To estimate a firm’s cost of long-term liabilities, we assigned a bond yield with similar debt risk class to each company’s corporate debt. The after-tax cost of long-term liabilities was estimated as the firm’s cost of long-term liabilities multiplied by one minus the marginal tax rate associated with each country under study. The cost of equity was estimated using the market model based on the CAPM. The cost of preferred stock was estimated as the average of the long-term liabilities and the cost of equity established by its theoretical risk class because market proxies for estimation were not available either. To calculate the cost of equity, estimates of risk-free rate, expected market risk premium and firms’ beta were needed. There is some empirical evidence that stock markets are not fully integrated (see Bekaert & Harvey, 1998; French & Poterba, 1991; Harvey, 1995; and Mittoo, 1992). Taking into consideration that stock markets are not fully integrated, we use a weighted-average between each Latin American stock market index and the NYSE index return as proxy for the market portfolio return. In addition, and given the infrequent trading problem in some Latin American stocks, firms’ betas were estimated using the AC method suggested by Dimson (1979) and, following the method proposed by Vasicek (1973), adjusted back toward their average values. Because our final analysis is based on quarterly data, monthly data from previous series were used for further quarterly estimates. The yield of U. S. treasury bills with maturity of ninety days was used as a proxy for the risk free-rate. For the expected market risk premium, historical moving averages of realized monthly market risk premiums from 1992 to the quarter prior to that under estimation were calculated. Companies’ betas were estimated individually based on monthly security and market returns following the same procedure used in estimating the expected risk premium. EVA
TM for each company was finally estimated using equation (1).
Sample
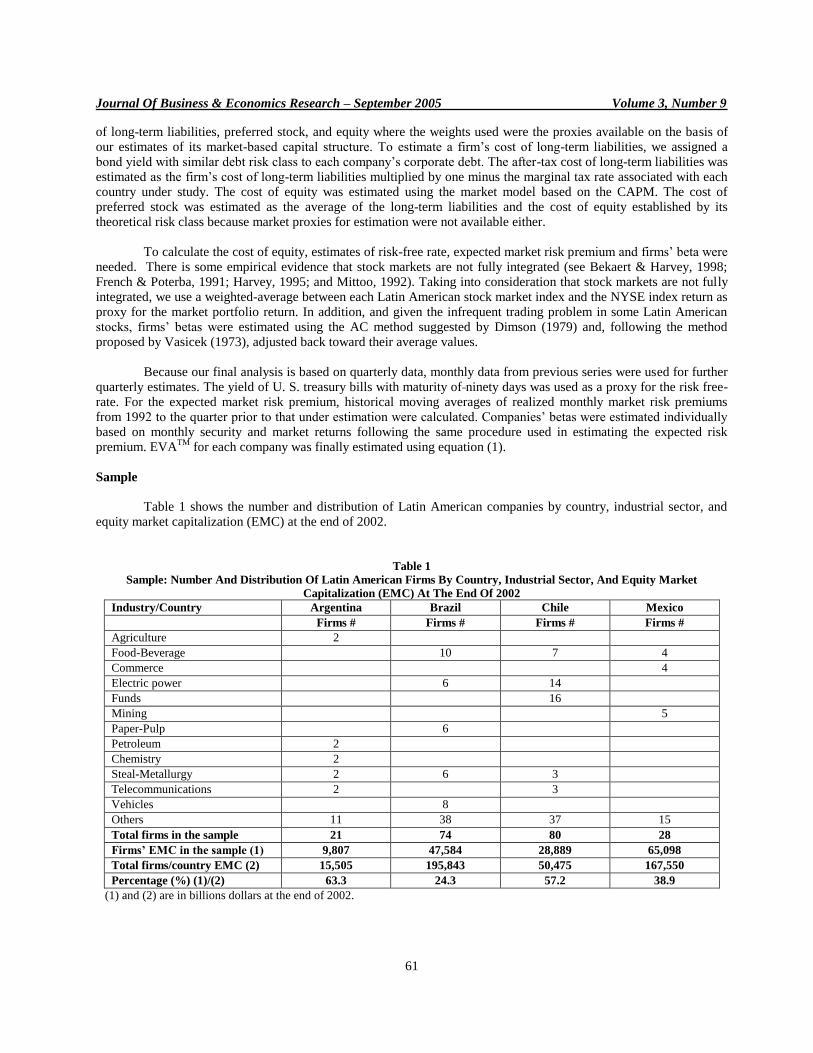
Table 1 shows the number and distribution of Latin American companies by country, industrial sector, and equity market capitalization (EMC) at the end of 2002.
Table 1
Sample: Number And Distribution Of Latin American Firms By Country, Industrial Sector, And Equity Market
Capitalization (EMC) At The End Of 2002
Industry/Country Argentina Brazil Chile Mexico
Firms # Firms # Firms # Firms #
Agriculture 2
Food-Beverage 10 7 4
Commerce 4
Electric power 6 14
Funds 16
Mining 5
Paper-Pulp 6
Petroleum 2
Chemistry 2
Steal-Metallurgy 2 6 3
Telecommunications 2 3
Vehicles 8
Others 11 38 37 15
Total firms in the sample 21 74 80 28
Firms’ EMC in the sample (1) 9,807 47,584 28,889 65,098
Total firms/country EMC (2) 15,505 195,843 50,475 167,550
Percentage (%) (1)/(2) 63.3 24.3 57.2 38.9
(1) and (2) are in billions dollars at the end of 2002.

Journal Of Business & Economics Research – September 2005 Volume 3, Number 9
62
The twenty-one Argentinean companies in the sample represent 63.3% of Argentinean firms’ equity market capitalization at the end of 2002. The dominant industries are agriculture, petroleum, chemistry, steel-metallurgy, and telecommunications. In the case of Brazil, seventy-four firms account for 24.3% of Brazilian companies’ equity market capitalization at the end of 2002, and food-beverage, electric power, paper, steel-metallurgy, and vehicle making are the main industries. For Chile, eighty firms account for 57.2% of Chilean firms’ equity market capitalization at the end of 2002. Food-beverage, electric power, funds, steel-metallurgy, and telecommunications are the main industrial sectors. Finally, in Mexico, twenty-eight firms account for 38.9% of Mexican companies’ market equity capitalization at the end of 2002. Commerce, mining, and steel-metallurgy are the most relevant industrial sectors.
EMPIRICAL RESULTS
The presentation of results follows the order of the research questions and attempts to answer them. For the pooled-companies within each Latin American country under study, the first research question was: Does EVA
TM
dominate accounting measures such as net income (NI) or operating cash flow (OCF) in association with quarterly abnormal returns? The second question was: are past realizations of EVA
TM, NI and OCF significant predictors of
future abnormal returns?
The first set of tests involves general least squared regressions (hereafter, GLS regressions) using pooled time series, cross-section data, as econometric technique. The regression is specified as follows:
yit = it + ixit + it (5) where i shows cross-section units (Latin American companies in the sample: 21, 74, 80 and 28 for Argentina, Brazil, Chile and Mexico, respectively) and periods t = 1, 2,........, 35 (from March '94 to September '02). y it is the CAPM-
based abnormal returns (equation (4)) of company i at time t. it is equal to the constant, which is assumed to be
common for all pool members within each country. i is equal to the sensitivity measure of yit with respect to xit. xit shows alternative proxies for measures of management performance (current and lagged EVA
TM, NI, OCF,
respectively).it is a white noise error term. Since variances within cross-section are expected to occur across time, we use White’s heteroskedasticity covariance method to estimate consistent standard errors of the regression coefficients. The measures of managerial performance were scaled to be consistent with abnormal returns, which are estimated as percentages. For EVA
TM, the
equity market value is used as a denominator since this measure is supposed to be directly associated with value creation for shareholders. For accounting-based measures such as net income (NI) and operating cash flow (OCF), we use the book value of equity and the book value of assets, respectively, as a denominator.
First And Second Research Questions
Table 2 reports the results after running regression equation (5) on each current and lagged management performance measure for the Argentinean and Brazilian pooled-companies, respectively. For both countries, EVA
TM
shows a higher adjusted-R2 or “goodness of fit” than their accounting counterparts. It is important to note that in a
multiple regression approach, the coefficient on lagged EVATM
shows the sensitivity of abnormal returns to variations in lagged EVA
TM, which are uncorrelated with current EVA
TM. In a similar way, the coefficient on current EVA
TM
indicates the sensitivity of abnormal returns to variations in current EVATM
, which in turn are uncorrelated with lagged EVA
TM. One implication of this analysis is that the coefficient on current EVA
TM shows how abnormal returns change
with unexpected variations in current EVATM
, where expectations are based on previous periods’ EVATM
. Thus, the results for Argentina and Brazil would indicate that the market rewards unexpected increases in current EVA
TM but
penalizes unexpected increases in lagged EVATM
. These results are also consistent with the notion that the market bases expectations about firms’ future profitability on the current period’s EVA
TM rather than on its past realizations.
Table 3 reports the results for the Chilean and Mexican pooled-companies. Again, we find that EVA
TM shows
a higher adjusted- R2 than their competing accounting measures. In addition, the results for Chile and Mexico seem to
be qualitatively similar to those for Argentina and Brazil. The market also rewarded unexpected increases in current EVA
TM and penalized unexpected increases in lagged EVA
TM. These results confirm the previous finding that the

Journal Of Business & Economics Research – September 2005 Volume 3, Number 9
63
Table 2
Abnormal Companies’ Returns As Explained By Current And Lagged EVA, NI And OCF Results
For Argentinean And Brazilian Companies As A Pool, Respectively March 1994 Through September 2002
(T-Statistics In Parenthesis)
Variables/
Country Argentina Brazil
Coefficient Coefficient Coefficient Coefficient Coefficient Coefficient
Constant -0.024 -0.040 -0.095 -0.097 -0.097
(-1.699) (-1.699) (-10.178)* (-11.787)* (-11.652)*
Beta1 (EVAt) 4.794 0.420
(4.935)* (3.636)*
Beta2 (EVAt-1) -4.256 -0.386
(-4.424) (-3.449)*
Beta1 (NIt) 0.147 0.012
(2.085)* (0.347)
Beta2 (NIt-1) 0.097 0.018
(1.614) (1.683)
Beta1 (OCFt) 0.344 0.028
(0.305) (0.447)
Beta2 (OCFt-1) 1.848 -0.022
(1.938)** (-0.374)
Adjusted-R2 0.089 0.011 0.018 0.030 0.001 0.001
Note: The dependent variable is abnormal returns. Sample size (total panel observations) = 735 and 2590 for Argentina and Brazil, respectively. * Significant at the 1% level. ** Significant at the 5% level.
Table 3
Abnormal Companies’ Returns As Explained By Current And Lagged EVA, NI And OCF
Results For Chilean And Mexican Companies As A Pool, Respectively
March 1994 Through September 2002
(T-Statistics In Parenthesis)
Variables/Country Chile Mexico
Coefficient Coefficient Coefficient Coefficient Coefficient Coefficient
Constant -0.035 -0.057 -0.055 -0.022 -0.057 -0.053
(-6.194)* (-5.875)* (-8.766)* (-2.589)* (-5.507)* (-3.017)*
Beta1 (EVAt) 2.999 8.111
(3.214)* (7.264)*
Beta2 (EVAt-1) -2.882 -7.418
(-3.113)* (-6.455)*
Beta1 (NIt) 0.874 0.809
(1.709) (5.345)*
Beta2 (NIt-1) -0.118 0.175
(-0.643) (1.353)
Beta1 (OCFt) 1.033 0.804
(1.988)* (0.816)
Beta2 (OCFt-1) -0.119 0.099
(-0.301) (0.103)
Adjusted-R2 0.070 0.066 0.008 0.103 0.062 0.001
Note: The dependent variable is abnormal returns. Sample size (total panel observations) = 2800 and 980 for Chile and Mexico, respectively. * Significant at the 1% level. ** Significant at the 5% level.

Journal Of Business & Economics Research – September 2005 Volume 3, Number 9
64
market bases its expectations about firms’ future profitability on the current period’s EVATM
rather than on its past realizations. Notice that even though the results across countries are qualitatively similar, the sensitivity to changes in current and lagged unexpected EVA
TM varies. Mexico presents the highest sensitivity (elasticity) to either current or
lagged unexpected EVATM
. The coefficients are 8.1 and -7.4, respectively. The ranking continues with Argentina, Chile and Brazil, in that order, with coefficients of 0.42 and -0.39, respectively.
Third Research Question
The third research question asked: Does EVA
TM maintain a high correlation with abnormal returns even after
controlling for other accounting measures? Table 4 reports the results for pooled-companies associated with each Latin American country under study. Notice that these results show abnormal returns as explained by EVA
TM (current and
lagged) after controlling for accounting-based measures (NI and OCF).
Table 4
Abnormal Companies’ Returns As Explained By Current And Lagged EVA After Controlling For NI And OCF
Results For Argentinean, Brazilian, Chilean And Mexican Companies As A Pool, Respectively
March 1994 Through September 2002
(T-Statistics In Parenthesis)
Variable/Country Argentina Brazil Chile Mexico
Coefficient Coefficient Coefficient Coefficient
Constant -0.006 -0.036 -0.047 0.027
(-0.291) (-2.698)* (-3.915)* (0.978)
Beta1 (EVAt) 5.741 0.717 2.901 9.226
(6.174)* (7.240)* (2.909)* (7.878)*
Beta2 (EVAt-1) -5.040 -0.381 -2.872 -7.988
(-5.617)* (-3.726)* (-3.007)* (-7.340)*
Beta3 (NIt) 0.262 0.015 0.898 0.877
(3.401)* (0.434) (1.696) (5.549)*
Beta4 (OCFt) -0.936 -0.283 -0.840 -2.507
(-0.955) (-7.024)* (-1.164) (-3.301)*
Adjusted-R2 0.117 0.050 0.133 0.175
Note: The dependent variable is abnormal returns. Sample size (total panel observations) = 735, 2590, 2800 and 980 for Argentina, Brazil, Chile and Mexico, respectively. * Significant at the 1% level. ** Significant at the 5% level.
According to Table 4, the adjusted- R
2 increases after controlling equation (5), showing the effect that
accounting-based measures have on abnormal returns in the companies-countries under study. However, EVATM
(current and lagged) retains a high explanatory power (between 53% for Chile and 76% for Argentina) when we compare the previous adjusted- R
2 reported in Tables 2 and 3 with those reported in Table 4. On the other hand, the
current and lagged EVATM
continue being highly significant (with positive and negative coefficients, respectively) and their values do not show significant variations in the values reported in Tables 2 and 3. These results seem to validate EVA
TM as a dominant measure of managerial performance at the time value was created for Latin American
companies’ shareholders.
Fourth Research Question
The last research question asked: Taking into consideration the most representative industries within a country, and after identifying the best predictor derived from the answer to previous question, how well does this predictor correlate with abnormal returns by industrial sectors?
Journal Of Business & Economics Research – September 2005 Volume 3, Number 9
65
To answer this question, we run similar regressions to those reported in Table 4. However, the new regressions are separated by country and industrial sector. Table 5 shows the results for Argentina, an EVA
TM
reflecting relatively higher adjusted- R2 in agriculture, steel-metallurgy, and chemistry. The remaining industrial
sectors are under the general average value of 11.7% reported in Table 4. Thus, there are differences across Argentinean industries in terms of the effect that EVA
TM has on SVC.
Table 6 reports the results for Brazilian industrial sectors. EVA
TM shows relatively higher adjusted-R2 in the
paper-pulp and steel-metallurgy sectors. The remaining industrial sectors are under the general average value of the 5% reported in Table 4. However, the net income (NI) seems to be a more appropriate measure for managerial performance in the case of the electric-power industry (an adjusted- R
2 of 51%). Again, we find differences across
Brazilian industries in terms of the effect that EVATM
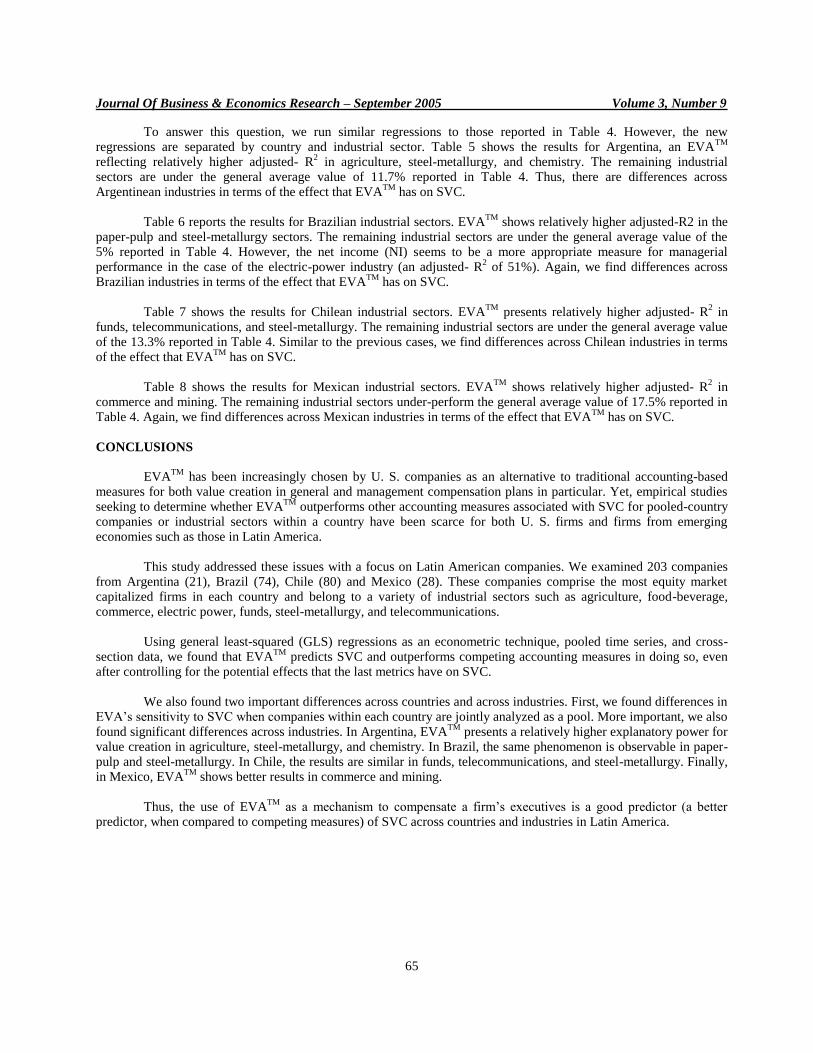
has on SVC. Table 7 shows the results for Chilean industrial sectors. EVA
TM presents relatively higher adjusted- R
2 in
funds, telecommunications, and steel-metallurgy. The remaining industrial sectors are under the general average value of the 13.3% reported in Table 4. Similar to the previous cases, we find differences across Chilean industries in terms of the effect that EVA
TM has on SVC.
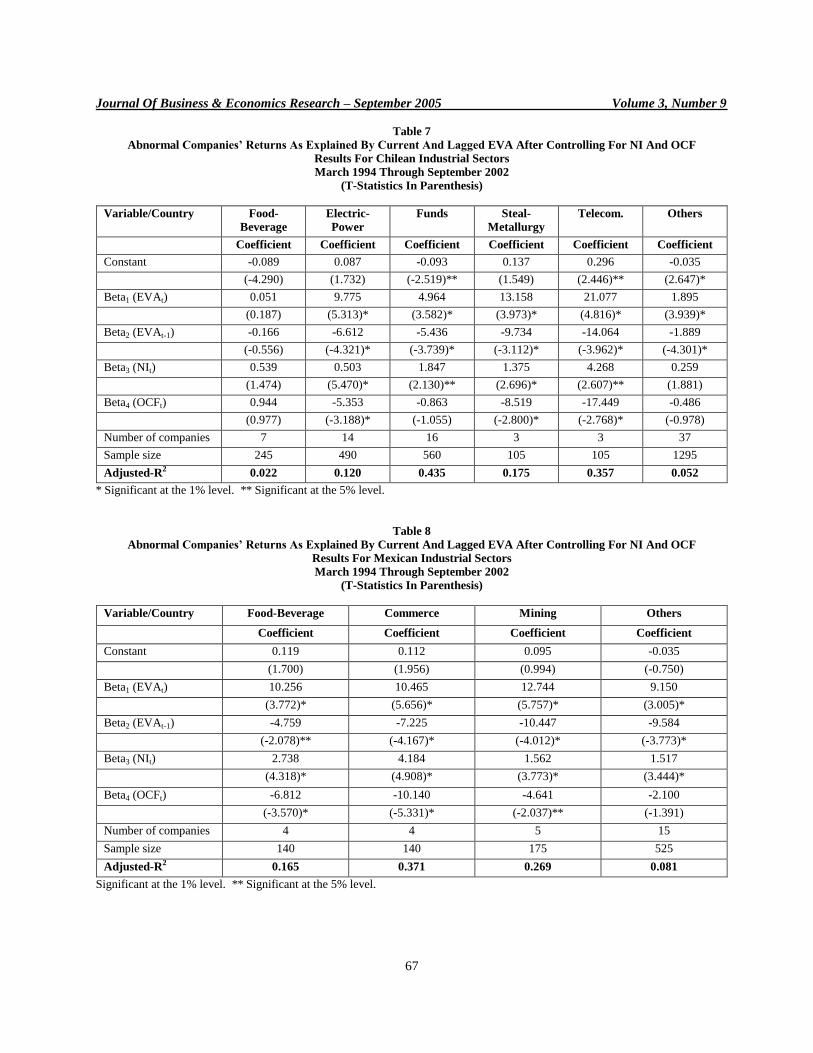
Table 8 shows the results for Mexican industrial sectors. EVA
TM shows relatively higher adjusted- R
2 in
commerce and mining. The remaining industrial sectors under-perform the general average value of 17.5% reported in Table 4. Again, we find differences across Mexican industries in terms of the effect that EVA
TM has on SVC.
CONCLUSIONS
EVA
TM has been increasingly chosen by U. S. companies as an alternative to traditional accounting-based
measures for both value creation in general and management compensation plans in particular. Yet, empirical studies seeking to determine whether EVA
TM outperforms other accounting measures associated with SVC for pooled-country
companies or industrial sectors within a country have been scarce for both U. S. firms and firms from emerging economies such as those in Latin America. This study addressed these issues with a focus on Latin American companies. We examined 203 companies from Argentina (21), Brazil (74), Chile (80) and Mexico (28). These companies comprise the most equity market capitalized firms in each country and belong to a variety of industrial sectors such as agriculture, food-beverage, commerce, electric power, funds, steel-metallurgy, and telecommunications. Using general least-squared (GLS) regressions as an econometric technique, pooled time series, and cross-section data, we found that EVA
TM predicts SVC and outperforms competing accounting measures in doing so, even
after controlling for the potential effects that the last metrics have on SVC. We also found two important differences across countries and across industries. First, we found differences in EVA’s sensitivity to SVC when companies within each country are jointly analyzed as a pool. More important, we also found significant differences across industries. In Argentina, EVA
TM presents a relatively higher explanatory power for
value creation in agriculture, steel-metallurgy, and chemistry. In Brazil, the same phenomenon is observable in paper-pulp and steel-metallurgy. In Chile, the results are similar in funds, telecommunications, and steel-metallurgy. Finally, in Mexico, EVA
TM shows better results in commerce and mining.
Thus, the use of EVA
TM as a mechanism to compensate a firm’s executives is a good predictor (a better
predictor, when compared to competing measures) of SVC across countries and industries in Latin America.

Journal Of Business & Economics Research – September 2005 Volume 3, Number 9
66
Table 5
Abnormal Companies’ Returns As Explained By Current And Lagged EVA After Controlling For NI And OCF
Results For Argentinean Industrial Sectors
March 1994 Through September 2002
(T-Statistics In Parenthesis)
Variable/Country Agriculture Petroleum Chemistry Steal-
Metallurgy Telecom. Others
Coefficient Coefficient Coefficient Coefficient Coefficient Coefficient
Constant -0.001 0.031 0.040 0.082 -0.121 0.024
(-0.007) (0.388) (0.371) (1.420) (-0.448) (0.649)
Beta1 (EVAt) 7.252 10.617 5.604 10.256 6.971 5.235
(11.568)* (1.675) (1.936) (3.166)* (0.436) (4.248)*
Beta2 (EVAt-1) -7.217 -8.116 -4.277 -9.223 -3.543 -3.658
(-18.951)* (-1.208) (-2.334)** -(2.973)* (-0.464) (-3.807)*
Beta3 (NIt) 0.2600 -0.652 0.359 0.928 0.043 0.221
(0.426) (-0.624) (2.225)** (2.752)* (0.173) (2.278)**
Beta4 (OCFt) -6.231 0.401 -0.310 -4.300 2.040 -2.700
(-3.027)* (0.150) (-0.114) (-1.172) (0.179) (-1.937)
Number of companies 2 2 2 2 2 11
Sample size 70 70 70 70 70 385
Adjusted-R2 0.673 0.080 0.117 0.125 0.060 0.090
* Significant at the 1% level. ** Significant at the 5% level.
Table 6
Abnormal Companies’ Returns As Explained By Current And Lagged EVA After Controlling For NI And OCF
Results For Brazilian Industrial Sectors
March 1994 Through September 2002
(T-Statistics In Parenthesis)
Variable/
Country
Food-
Beverage
Electric-
Power
Paper-Pulp Steal-
Metallurgy
Vehicles Others
Coefficient Coefficient Coefficient Coefficient Coefficient Coefficient
Constant -0.009 -0.131 -0.001 -0.047 -0.012 -0.025
(-0.209) (-0.619) (-0.030) (-0.976) (-0.295) (-1.269)
Beta1 (EVAt) 0.537 3.423 0.848 1.105 1.297 0.746
(2.870)* (2.692)** (2.941)* (3.461)* (2.648)* (5.803)*
Beta2 (EVAt-1) -0.273 -3.130 -0.393 -0.870 -0.515 -0.338
(-1.182) (-2.343) (-1.593) (-2.469)** (-0.964) (-2.925)*
Beta3 (NIt) 0.075 44.443 1.374 0.086 0.060 -0.026
(0.683) (1.340) (3.103)* (1.274) (0.626) (-2.626)*
Beta4 (OCFt) -2.419 -30.327 -0.268 -0.122 -0.677 -0.337
(-2.016)** (-0.930) (-1.224) (-0.661) (-2.187)** (-5.999)
Number of companies 10 6 6 6 8 38
Sample size 350 210 210 210 280 1330
Adjusted-R2 0.046 0.510 0.080 0.076 0.037 0.043
* Significant at the 1% level. ** Significant at the 5% level.
Journal Of Business & Economics Research – September 2005 Volume 3, Number 9
67
Table 7
Abnormal Companies’ Returns As Explained By Current And Lagged EVA After Controlling For NI And OCF
Results For Chilean Industrial Sectors
March 1994 Through September 2002
(T-Statistics In Parenthesis)
Variable/Country Food-
Beverage
Electric-
Power
Funds Steal-
Metallurgy
Telecom. Others
Coefficient Coefficient Coefficient Coefficient Coefficient Coefficient
Constant -0.089 0.087 -0.093 0.137 0.296 -0.035
(-4.290) (1.732) (-2.519)** (1.549) (2.446)** (2.647)*
Beta1 (EVAt) 0.051 9.775 4.964 13.158 21.077 1.895
(0.187) (5.313)* (3.582)* (3.973)* (4.816)* (3.939)*
Beta2 (EVAt-1) -0.166 -6.612 -5.436 -9.734 -14.064 -1.889
(-0.556) (-4.321)* (-3.739)* (-3.112)* (-3.962)* (-4.301)*
Beta3 (NIt) 0.539 0.503 1.847 1.375 4.268 0.259
(1.474) (5.470)* (2.130)** (2.696)* (2.607)** (1.881)
Beta4 (OCFt) 0.944 -5.353 -0.863 -8.519 -17.449 -0.486
(0.977) (-3.188)* (-1.055) (-2.800)* (-2.768)* (-0.978)
Number of companies 7 14 16 3 3 37
Sample size 245 490 560 105 105 1295
Adjusted-R2 0.022 0.120 0.435 0.175 0.357 0.052
* Significant at the 1% level. ** Significant at the 5% level.
Table 8
Abnormal Companies’ Returns As Explained By Current And Lagged EVA After Controlling For NI And OCF
Results For Mexican Industrial Sectors
March 1994 Through September 2002
(T-Statistics In Parenthesis)
Variable/Country Food-Beverage Commerce Mining Others
Coefficient Coefficient Coefficient Coefficient
Constant 0.119 0.112 0.095 -0.035
(1.700) (1.956) (0.994) (-0.750)
Beta1 (EVAt) 10.256 10.465 12.744 9.150
(3.772)* (5.656)* (5.757)* (3.005)*
Beta2 (EVAt-1) -4.759 -7.225 -10.447 -9.584
(-2.078)** (-4.167)* (-4.012)* (-3.773)*
Beta3 (NIt) 2.738 4.184 1.562 1.517
(4.318)* (4.908)* (3.773)* (3.444)*
Beta4 (OCFt) -6.812 -10.140 -4.641 -2.100
(-3.570)* (-5.331)* (-2.037)** (-1.391)
Number of companies 4 4 5 15
Sample size 140 140 175 525
Adjusted-R2 0.165 0.371 0.269 0.081
Significant at the 1% level. ** Significant at the 5% level.

Journal Of Business & Economics Research – September 2005 Volume 3, Number 9
68
REFERENCES 1. Bacidore, J., Boquist, J., Milbourn, T., & Thakor, A. (1997). The search for the best financial performance
measure. Financial Analysts Journal, May/June. 2. Bekaert, G. & Harvey, C. (1998). Foreign speculators and emerging equity markets. Working Paper. Duke
University & Stanford University. 3. Biddle, G., Bowen, R., & Wallace, J. (1999). Evidence on EVA
TM .Working Paper. Hong Kong University of
Science & Technology, University of Washington, & University of California, Irvine. 4. Chen, S. & Dodd, J. (1997). Economic Value Added EVA
TM, an empirical examination of a new corporate
performance measure. Journal of Managerial Issues, 318-333. 5. Dimson, E. (1979). Risk measurement when shares are subject to infrequent trading. Journal of Financial
Economics, 7: 197-226. 6. French, K. & Poterba, J. (1991). Investor diversification and international equity markets. American
Economic Review, 81: 222-26. 7. Harvey, C. (1995). Predictable risk and returns in emerging markets. The Review of Financial Studies, 8:
773-816. 8. Jensen, M. & Murphy, K. (1990). Performance pay and top-management incentives. Journal of Political
Economy, 98(2): 225-62. 9. Jensen, M. (1968). The performance of mutual funds in the period 1945-1964. The Journal of Finance, 23:
389-416. 10. Jensen, M. (1969). Risk, the pricing of capital assets, and the evaluation of investment portfolios. Journal of
Business, 42: 167-247. 11. Mittoo, U. (1992). Additional evidence on integration in the Canadian stock market. The Journal of Finance.
47: 2035-54. 12. Modigliani, F. & Miller, M. (1958). The cost of capital, corporation finance, and the theory of investment.
American Economic Review, 261-297. 13. Modigliani, F. & Miller, M. (1963). Corporate income taxes and the cost of capital. American Economic
Review, 433-443. 14. Milbourn, T. (1996). The executive compensation puzzle: theory and evidence. IFA Working Paper No. 235.
London Business School. 15. O'Byrne, S. (1995). EVA
TM and market value. Journal of Applied Corporate Finance, 9(1): 116-125.
16. Peterson, P. & Peterson, D. (1996). Company performance and measures of value added. In The Research Foundation of the Institute of Chartered Financial Analysts, Chapter 4. Rogerson, W. (1997). Inter-temporal cost allocation and managerial investment incentives: A theory explaining the use of economic value added as a performance measure. Journal of Political Economy, 105 (4).
17. Sandoval, E. (2001). Financial performance measures and shareholder value creation: An empirical study for Chilean companies. The Journal of Applied Business Research, 17(3).
18. Stewart, G. (1991). The quest for value. New York: Harper Business. 19. Vasicek, O. (1973). A note on using cross-sectional information in Bayesian estimation of security betas. The
Journal of Finance, 28: 1233-1239.