Journal of BIOPHOTONICS - Boston...
6
www. biophotonics-journal.org Journal of BIOPHOTONICS REPRINT
Transcript of Journal of BIOPHOTONICS - Boston...

www. biophotonics-journal.orgJournal of
BIOPHOTONICS
REPRINT

FULL ARTICLE
Label-free in vivo imaging of peripheral nerveby multispectral photoacoustic tomography
Rui Li**, 1, Evan Phillips**, 1, Pu Wang1, Craig J. Goergen*, 1, and Ji-Xin Cheng*, 1, 2
1 Weldon School of Biomedical Engineering, Purdue University, West Lafayette, IN, 47907, USA2 Department of Chemistry, Purdue University, West Lafayette, IN, 47907, USA
Received 10 January 2015, revised 26 March 2015, accepted 28 March 2015Published online 23 April 2015
Key words: photoacoustic tomography, in vivo, nerve, spectroscopy, multivariate curve resolution
1. Introduction
Attributed to surgical procedures, iatrogenic damageto peripheral nerves is a leading cause of morbidity[1–6]. The resultant complications include temporarynumbness, loss of sensation, and peripheral neuropa-thy [6, 7]. Although several factors are related to ia-trogenic nerve injuries, distinctive visualization ofnerve tissues relative to adjacent structures is of vitalimportance yet remains technically challenging. Cur-rently, several imaging modalities have been appliedto address this concern, including ultrasonography
[8, 9], coherent anti-Stokes Raman scattering(CARS) [10, 11], third-harmonic generation (THG)[12], and magnetic resonance imaging (MRI) [13,14]. These techniques improve visualization ofnerves, but still suffer from several limitations. Ultra-sonography has low contrast and cannot distinguishnerves from adjacent tissues that have similar acous-tic properties. CARS and THG can generate nerve-specific contrast with micron resolution, but havelimited penetration depth due to optical tissue scat-tering. MRI can reveal the whole peripheral nervoussystem, but its resolution is typically on the sub-milli-
* Corresponding author: e-mail: [email protected], Phone: +1 765 494 1517, Fax: +1 765 494 1193;[email protected], Phone: +1 765 494 4335, Fax: +1 765 496 1912
** Equal contributions
Unintentional surgical damage to nerves is mainly due topoor visualization of nerve tissue relative to adjacentstructures. Multispectral photoacoustic tomography canprovide chemical information with specificity and ultraso-nic spatial resolution with centimeter imaging depth, mak-ing it a potential tool for noninvasive neural imaging. Toimplement this label-free imaging approach, a multispec-tral photoacoustic tomography platform was built. Imag-ing depth and spatial resolution were characterized. Invivo imaging of the femoral nerve that is 2 mm deep in anude mouse was performed. Through multivariate curveresolution analysis, the femoral nerve was discriminatedfrom the femoral artery and chemical maps of their spatialdistributions were generated. The femoral nerve was discriminated from the femoral ar-
tery by multivariate curve resolution analysis.
J. Biophotonics 9, No. 1–2, 124–128 (2016) / DOI 10.1002/jbio.201500004
© 2015 by WILEY-VCH Verlag GmbH & Co. KGaA, Weinheim
meter scale, making visualization of small nerves dif-ficult.
As an emerging biomedical imaging tool, photo-acoustic imaging has proven its capability of deep tis-sue imaging with optical absorption contrast and ul-trasonic resolution [15–18]. Major applications ofphotoacoustic imaging rely heavily on contrast fromelectronic absorption of hemoglobin or exogenouscontrast agents [15, 19–21]. Recently, photoacousticimaging using molecular overtone vibration as thecontrast, where the second overtone absorption ofC–H bond lies in the optical window ranging from1100 to 1300 nm, has been successfully demonstratedfor lipid imaging [22–27]. Myelin sheaths surroundingaxons are abundant in lipids, thus providing an oppor-tunity to apply photoacoustic imaging for visualiza-tion of nerves with specific contrast. More recently,photoacoustic microscopy (PAM) has been success-fully employed to image peripheral nerves in miceand white matter in rats [28, 29]. However, translationof this technique to the clinical setting is hindered bymillimeter-scale imaging depth and slow imagingspeed of this microscopy technique. Moreover, it re-mains challenging to separate the nerves from adja-cent blood vessels by single color excitation.
Here, we demonstrate a multispectral photo-acoustic tomography (PAT) platform, together withmultivariate image analysis for in vivo visualizationof peripheral nerves. A customized optical param-etric oscillator (OPO), pumped by the second har-monic of a Nd :YAG laser, was used as the light ex-citation source. Using a tissue-mimicking polyvinylalcohol (PVA) phantom, we demonstrated a pene-tration depth up to 2.7 centimeter and attained anaxial resolution of 124 μm. We further performed invivo imaging of the femoral nerve that is 2 mm deepin a nude mouse at a speed of 10 frames per second.Through multivariate curve resolution (MCR) analy-sis of multispectral images ranging from 1100 nm to1250 nm, we discriminated the femoral nerve fromthe femoral artery and generated chemical maps oftheir spatial distribution.
2. Experimental
2.1 System design
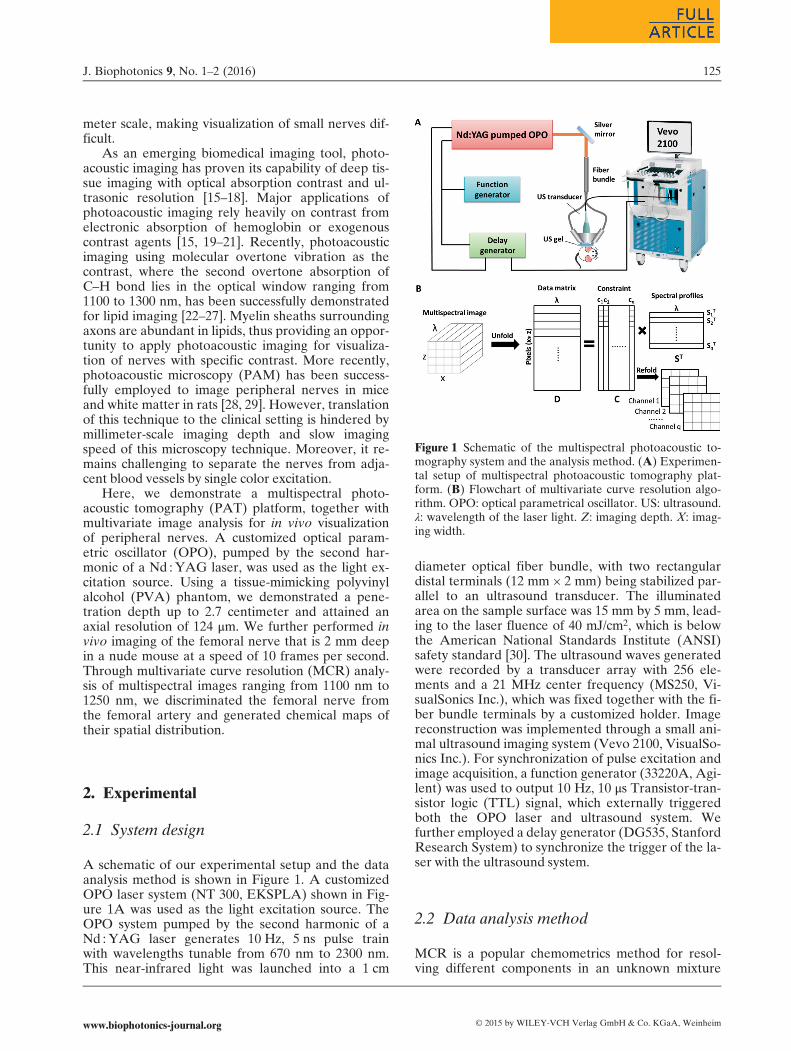
A schematic of our experimental setup and the dataanalysis method is shown in Figure 1. A customizedOPO laser system (NT 300, EKSPLA) shown in Fig-ure 1A was used as the light excitation source. TheOPO system pumped by the second harmonic of aNd :YAG laser generates 10 Hz, 5 ns pulse trainwith wavelengths tunable from 670 nm to 2300 nm.This near-infrared light was launched into a 1 cm
diameter optical fiber bundle, with two rectangulardistal terminals (12 mm × 2 mm) being stabilized par-allel to an ultrasound transducer. The illuminatedarea on the sample surface was 15 mm by 5 mm, lead-ing to the laser fluence of 40 mJ/cm2, which is belowthe American National Standards Institute (ANSI)safety standard [30]. The ultrasound waves generatedwere recorded by a transducer array with 256 ele-ments and a 21 MHz center frequency (MS250, Vi-sualSonics Inc.), which was fixed together with the fi-ber bundle terminals by a customized holder. Imagereconstruction was implemented through a small ani-mal ultrasound imaging system (Vevo 2100, VisualSo-nics Inc.). For synchronization of pulse excitation andimage acquisition, a function generator (33220A, Agi-lent) was used to output 10 Hz, 10 μs Transistor-tran-sistor logic (TTL) signal, which externally triggeredboth the OPO laser and ultrasound system. Wefurther employed a delay generator (DG535, StanfordResearch System) to synchronize the trigger of the la-ser with the ultrasound system.
2.2 Data analysis method
MCR is a popular chemometrics method for resol-ving different components in an unknown mixture
Figure 1 Schematic of the multispectral photoacoustic to-mography system and the analysis method. (A) Experimen-tal setup of multispectral photoacoustic tomography plat-form. (B) Flowchart of multivariate curve resolution algo-rithm. OPO: optical parametrical oscillator. US: ultrasound.λ: wavelength of the laser light. Z: imaging depth. X: imag-ing width.
J. Biophotonics 9, No. 1–2 (2016) 125
© 2015 by WILEY-VCH Verlag GmbH & Co. KGaA, Weinheimwww.biophotonics-journal.org
[32], capable of separating multiple data matrices si-multaneously [32]. Moreover, it can recover the con-centration profiles and spectral profiles from spec-troscopic images [33]. With its powerful mixture-re-solving capability, this technique has been used inspectroscopy, multifluorophore fluorescence ima-ging, and photoacoustic imaging [34–36]. The multi-spectral images were analyzed with the MCR algo-rithm illustrated in the flowchart in Figure 1B. Themultispectral images (X × Z × λ) were unfolded intoa two-dimensional (2D) matrix with the size of [(X ×Z) × λ], with each row representing a spectrum fromeach pixel. An embedded principal component ana-lysis (PCA) method was executed to quantify thenumber of components (q) [37]. The 2D data matrixwas fitted with a bilinear model, D = CST, with C re-presenting the distribution of q components and STrepresenting the different spectra. By refolding thedata matrix C, distribution maps of different compo-nents, corresponding to blood or nerve tissue, weregenerated.
3. Results and discussion
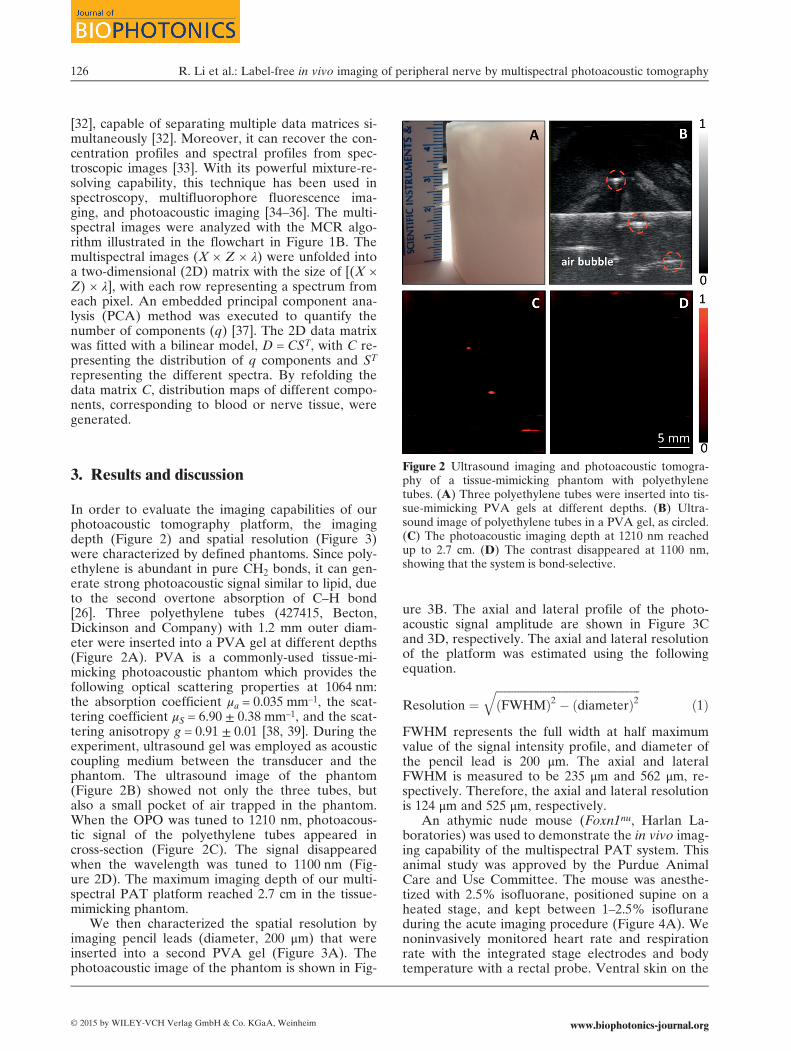
In order to evaluate the imaging capabilities of ourphotoacoustic tomography platform, the imagingdepth (Figure 2) and spatial resolution (Figure 3)were characterized by defined phantoms. Since poly-ethylene is abundant in pure CH2 bonds, it can gen-erate strong photoacoustic signal similar to lipid, dueto the second overtone absorption of C–H bond[26]. Three polyethylene tubes (427415, Becton,Dickinson and Company) with 1.2 mm outer diam-eter were inserted into a PVA gel at different depths(Figure 2A). PVA is a commonly-used tissue-mi-micking photoacoustic phantom which provides thefollowing optical scattering properties at 1064 nm:the absorption coefficient μa = 0.035 mm–1, the scat-tering coefficient μS = 6.90 ± 0.38 mm–1, and the scat-tering anisotropy g = 0.91 ± 0.01 [38, 39]. During theexperiment, ultrasound gel was employed as acousticcoupling medium between the transducer and thephantom. The ultrasound image of the phantom(Figure 2B) showed not only the three tubes, butalso a small pocket of air trapped in the phantom.When the OPO was tuned to 1210 nm, photoacous-tic signal of the polyethylene tubes appeared incross-section (Figure 2C). The signal disappearedwhen the wavelength was tuned to 1100 nm (Fig-ure 2D). The maximum imaging depth of our multi-spectral PAT platform reached 2.7 cm in the tissue-mimicking phantom.
We then characterized the spatial resolution byimaging pencil leads (diameter, 200 μm) that wereinserted into a second PVA gel (Figure 3A). Thephotoacoustic image of the phantom is shown in Fig-
ure 3B. The axial and lateral profile of the photo-acoustic signal amplitude are shown in Figure 3Cand 3D, respectively. The axial and lateral resolutionof the platform was estimated using the followingequation.
Resolution ¼ffiffiffiffiffiffiffiffiffiffiffiffiffiffiffiffiffiffiffiffiffiffiffiffiffiffiffiffiffiffiffiffiffiffiffiffiffiffiffiffiffiffiffiffiffiffiffiffiffiffiffiffiðFWHMÞ2 � ðdiameterÞ2
qð1Þ
FWHM represents the full width at half maximumvalue of the signal intensity profile, and diameter ofthe pencil lead is 200 μm. The axial and lateralFWHM is measured to be 235 μm and 562 μm, re-spectively. Therefore, the axial and lateral resolutionis 124 μm and 525 μm, respectively.
An athymic nude mouse (Foxn1nu, Harlan La-boratories) was used to demonstrate the in vivo imag-ing capability of the multispectral PAT system. Thisanimal study was approved by the Purdue AnimalCare and Use Committee. The mouse was anesthe-tized with 2.5% isofluorane, positioned supine on aheated stage, and kept between 1–2.5% isofluraneduring the acute imaging procedure (Figure 4A). Wenoninvasively monitored heart rate and respirationrate with the integrated stage electrodes and bodytemperature with a rectal probe. Ventral skin on the
Figure 2 Ultrasound imaging and photoacoustic tomogra-phy of a tissue-mimicking phantom with polyethylenetubes. (A) Three polyethylene tubes were inserted into tis-sue-mimicking PVA gels at different depths. (B) Ultra-sound image of polyethylene tubes in a PVA gel, as circled.(C) The photoacoustic imaging depth at 1210 nm reachedup to 2.7 cm. (D) The contrast disappeared at 1100 nm,showing that the system is bond-selective.
R. Li et al.: Label-free in vivo imaging of peripheral nerve by multispectral photoacoustic tomography126
© 2015 by WILEY-VCH Verlag GmbH & Co. KGaA, Weinheim www.biophotonics-journal.org
left hind leg was removed to expose and visualizethe femoral nerve and artery for multispectral PATimaging. Then, sterile ultrasound gel was applied be-tween the transducer and tissue in the left leg of themouse. The transducer was placed along the long
axis of the femoral artery, as shown in the ultrasoundimage in Figure 4B. Because the femoral artery andfemoral nerve have similar acoustic contrast and arein very close proximity to each other, we could noteasily differentiate them with standard ultrasound.Thus, multispectral photoacoustic imaging (Fig-ure 4C) was performed with wavelengths rangingfrom 1100 nm to 1250 nm with a step size of 10 nm.The co-registered microscopic photo of the samemouse leg is shown in Figure 4D. The blue dash lineindicates that the femoral nerve and the femoral ar-tery were adjacent to each other.
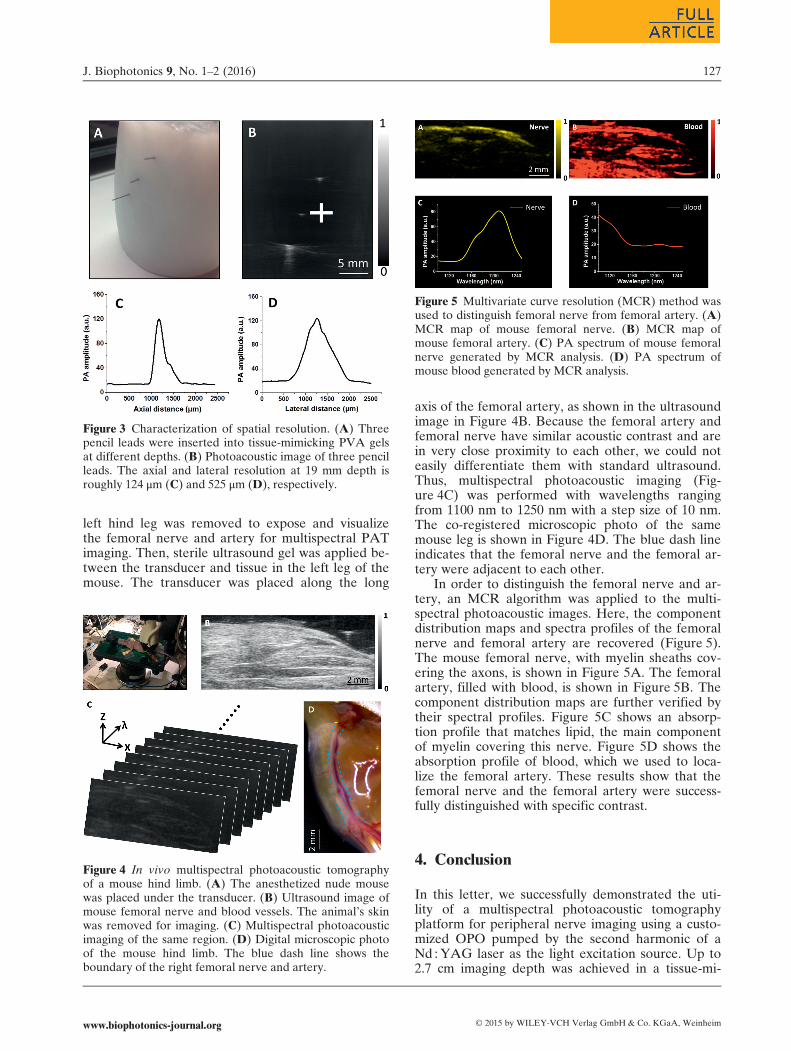
In order to distinguish the femoral nerve and ar-tery, an MCR algorithm was applied to the multi-spectral photoacoustic images. Here, the componentdistribution maps and spectra profiles of the femoralnerve and femoral artery are recovered (Figure 5).The mouse femoral nerve, with myelin sheaths cov-ering the axons, is shown in Figure 5A. The femoralartery, filled with blood, is shown in Figure 5B. Thecomponent distribution maps are further verified bytheir spectral profiles. Figure 5C shows an absorp-tion profile that matches lipid, the main componentof myelin covering this nerve. Figure 5D shows theabsorption profile of blood, which we used to loca-lize the femoral artery. These results show that thefemoral nerve and the femoral artery were success-fully distinguished with specific contrast.
4. Conclusion
In this letter, we successfully demonstrated the uti-lity of a multispectral photoacoustic tomographyplatform for peripheral nerve imaging using a custo-mized OPO pumped by the second harmonic of aNd :YAG laser as the light excitation source. Up to2.7 cm imaging depth was achieved in a tissue-mi-
Figure 3 Characterization of spatial resolution. (A) Threepencil leads were inserted into tissue-mimicking PVA gelsat different depths. (B) Photoacoustic image of three pencilleads. The axial and lateral resolution at 19 mm depth isroughly 124 μm (C) and 525 μm (D), respectively.
Figure 4 In vivo multispectral photoacoustic tomographyof a mouse hind limb. (A) The anesthetized nude mousewas placed under the transducer. (B) Ultrasound image ofmouse femoral nerve and blood vessels. The animal’s skinwas removed for imaging. (C) Multispectral photoacousticimaging of the same region. (D) Digital microscopic photoof the mouse hind limb. The blue dash line shows theboundary of the right femoral nerve and artery.
Figure 5 Multivariate curve resolution (MCR) method wasused to distinguish femoral nerve from femoral artery. (A)MCR map of mouse femoral nerve. (B) MCR map ofmouse femoral artery. (C) PA spectrum of mouse femoralnerve generated by MCR analysis. (D) PA spectrum ofmouse blood generated by MCR analysis.
J. Biophotonics 9, No. 1–2 (2016) 127
© 2015 by WILEY-VCH Verlag GmbH & Co. KGaA, Weinheimwww.biophotonics-journal.org

micking phantom. In vivo imaging of the femoralnerve and artery were performed in a nude mouse.Multivariate curve resolution analysis of multispec-tral images allowed us to discriminate the femoralnerve from the femoral artery in a live nude mouseand to generate chemical maps of their spatial distri-butions. This study opens exciting opportunities forlabel-free imaging of peripheral nerves in patientswith high chemically selective contrast.
Acknowledgements This work was supported by anAmerican Heart Association National Innovation Awardand an American Heart Association Scientist Develop-ment Grant (CJG, 14SDG18220010).
Author biographies Please see Supporting Informationonline.
References
[1] S. G. Joniau, A. A. Van Baelen, C. Y. Hsu, and H. P.Van Poppel, Adv Urol. 2012(2012), 706309 (2012).
[2] M. D. Michaelson, S. E. Cotter, P. C. Gargollo, A. L.Zietman, D. M. Dahl, and M. R. Smith, CA Cancer JClin. 58(4), 196–213 (2008).
[3] A. D. Sharma, C. L. Parmley, G. Sreeram, and H. P.Grocott, Anesth Analg. 91(6), 1358–1369 (2000).
[4] B. F. Jung, G. M. Ahrendt, A. L. Oaklander, andR. H. Dworkin, Pain. 104(1–2), 1–13 (2003).
[5] C. L. Jeng, T. M. Torrillo, and M. A. Rosenblatt, Br JAnaesth. 105(1), i97–107 (2010).
[6] G. Antoniadis, T. Kretschmer, M. T. Pedro, R. W. Ko-nig, C. P. Heinen, and H. P. Richter, Dtsch ArzteblInt. 111(16), 273–279 (2014).
[7] A. J. Wilbourn, Neurol Clin. 16(1), 55–82 (1998).[8] F. O. Walker, Suppl Clin Neurophysiol. 57, 243–254
(2004).[9] A. Grimm, B. Decard, and H. Axer, J Peripher Nerv
Syst. 19(3), 234–241 (2014).[10] T. B. Huff and J. X. Cheng, J Microsc. 225(2), 175–182
(2007).[11] L. Gao, H. Zhou, M. J. Thrall, F. Li, Y. Yang, Z.
Wang, P. Luo, K. K. Wong, G. S. Palapattu, and S. T.Wong, Biomed Opt Express. 2(4), 915–926 (2011).
[12] M. J. Farrar, F. W. Wise, J. R. Fetcho, and C. B. Schaf-fer, Biophys J. 100(5), 1362–1371 (2011).
[13] G. Stoll, M. Bendszus, J. Perez, and M. Pham, J Neu-rol. 256(7), 1043–1051 (2009).
[14] R. C. Fritz and R. D. Boutin, Phys Med Rehabil ClinN Am. 12(2), 399–432 (2001).
[15] X. Wang, Y. Pang, G. Ku, X. Xie, G. Stoica, and L. V.Wang, Nat Biotechnol. 21(7), 803–806 (2003).
[16] H. P. Brecht, R. Su, M. Fronheiser, S. A. Ermilov, A.Conjusteau, and A. A. Oraevsky, J Biomed Opt. 14(6), 064007 (2009).
[17] J. Laufer, D. Delpy, C. Elwell, and P. Beard, PhysMed Biol. 52(1), 141–168 (2007).
[18] S. Hu, K. Maslov, and L. V. Wang, J Vis Exp. 51,e2729 (2011).
[19] J. W. Kim, E. I. Galanzha, E. V. Shashkov, H. M.Moon, and V. P. Zharov, Nat Nanotechnol. 4(10),688–694 (2009).
[20] Q. Zhang, N. Iwakuma, P. Sharma, B. M. Moudgil, C.Wu, J. McNeill, H. Jiang, and S. R. Grobmyer, Nano-technology 20(39), 395102 (2009).
[21] W. J. Akers, C. Kim, M. Berezin, K. Guo, R. Fuhrhop,G. M. Lanza, G. M. Fischer, E. Daltrozzo, A. Zum-busch, X. Cai, L. V. Wang, and S. Achilefu, Acs Nano.5(1), 173–182 (2011).
[22] H. W. Wang, N. Chai, P. Wang, S. Hu, W. Dou, D.Umulis, L. V. Wang, M. Sturek, R. Lucht, and J. X.Cheng, Phys Rev Lett. 106(23), 238106 (2011).
[23] B. Wang, A. Karpiouk, D. Yeager, J. Amirian, S. Li-tovsky, R. Smalling, and S. Emelianov, Opt Lett. 37(7), 1244–1246 (2012).
[24] P. Wang, J. R. Rajian, and J. X. Cheng, J Phys ChemLett. 4(13), 2177–2185 (2013).
[25] R. Li, M. N. Slipchenko, P. Wang, and J. X. Cheng, JBiomed Opt. 18(4), 040502 (2013).
[26] J. R. Rajian, R. Li, P. Wang, and J. X. Cheng, J PhysChem Lett. 4(19), 3211–3215 (2013).
[27] P. Wang, T. Ma, M. N. Slipchenko, S. S. Liang, J. Hui,K. K. Shung, S. Roy, M. Sturek, Q. F. Zhou, Z. P.Chen, and J. X. Cheng, Sci Rep. 4, 6889 (2014).
[28] T. P. Matthews, C. Zhang, D. K. Yao, K. Maslov, andL. V. Wang, J Biomed Opt. 19(1), 16004 (2014).
[29] W. Wu, P. Wang, J. X. Cheng, and X. M. Xu, J Neuro-trauma. 31(24), 1998–2002 (2014).
[30] M. H. Xu and L. H. V. Wang, Rev Sci Instrum. 77(4),041101 (2006).
[31] J. Jaumot, R. Gargallo, A. de Juan, and R. Tauler,Chemometr Intell Lab. 76(1), 101–110 (2005).
[32] R. Tauler, A. Smilde, and B. Kowalski, J Chemometr.9(1), 31–58 (1995).
[33] A. de Juan and R. Tauler, Crit Rev Anal Chem. 36(3–4), 163–176 (2006).
[34] P. N. Perera, K. R. Fega, C. Lawrence, E. J. Sund-strom, J. Tomlinson-Phillips, and D. Ben-Amotz, PNatl Acad Sci USA 106(30), 12230–12234 (2009).
[35] D. M. Haaland, H. D. T. Jones, M. H. Van Benthem,M. B. Sinclair, D. K. Melgaard, C. L. Stork, M. C. Ped-roso, P. Liu, A. R. Brasier, N. L. Andrews, and D. S.Lidke, Appl Spectrosc. 63(3), 271–279 (2009).
[36] P. Wang, H. W. Wang, and J. X. Cheng, J BiomedOpt. 17(9), 96010–96011 (2012).
[37] M. Ringner, Nature biotechnology 26(3), 303–304(2008).
[38] A. Kharine, S. Manohar, R. Seeton, R. G. M. Kolk-man, R. A. Bolt, W. Steenbergen, and F. F. M. deMul, Phys Med Biol. 48(3), 357–370 (2003).
[39] S. E. Bohndiek, S. Bodapati, D. Van De Sompel, S. R.Kothapalli, and S. S. Gambhir, Plos One. 8(9), e75533(2013).
R. Li et al.: Label-free in vivo imaging of peripheral nerve by multispectral photoacoustic tomography128
© 2015 by WILEY-VCH Verlag GmbH & Co. KGaA, Weinheim www.biophotonics-journal.org