
Tazkiya Jurnal Pendidikan Islam ISSN 2086-4191 Vol. VIII ...

Journal of Applied Geophysics 75 (2011) 638–647
Contents lists available at SciVerse ScienceDirect
Journal of Applied Geophysics
j ourna l homepage: www.e lsev ie r .com/ locate / jappgeo
Electrical resistivity and Ground Penetrating Radar for the characterisation of theinternal architecture of Quaternary sediments in the Midlands of Ireland
Xavier M. Pellicer a,⁎, Paul Gibson b
a Geological Survey of Ireland, Beggars Bush, Haddington Road, Dublin 4, Irelandb Environmental Geophysics Unit, Department of Geography, National University of Ireland, Maynooth, Co. Kildare, Ireland
⁎ Corresponding author. Tel.: +353 34638762695.E-mail address: [email protected] (X.M. Pellicer).
0926-9851/$ – see front matter © 2011 Elsevier B.V. Alldoi:10.1016/j.jappgeo.2011.09.019
a b s t r a c t
a r t i c l e i n f oArticle history:Received 28 January 2011Accepted 14 September 2011Available online 25 September 2011
Keywords:GlacialElectrical Resistivity TomographyGPRNear-surfaceIreland
Geophysical techniques Electrical Resistivity Tomography (ERT) and Ground Penetrating Radar (GPR) supportedby traditional field methods are used for the geological mapping, description and interpretation of Quaternaryunconsolidated sediments in a site located in theMidlands of Ireland. The site comprises a broad range of glacialand postglacial sediments (diamicton, esker sand and gravel, glaciolacustrine sand, glaciolacustrine silt/clay andpeat). Preliminary fieldwork comprising, geomorphological mapping, lithostratigraphic analysis of exposuresand borehole drilling and laboratory testing encompassing particle size distribution analysis were carried outto broadly characterise the geology of the study area. These data aided locating the geophysical profiles and sup-ported the geophysical data interpretation. FiveGPR radargramswere collected and permitted depicting the sub-surface internal architecture within low conductivity unconsolidated sediments and aided to the classificationand characterisation of sedimentological and deformational structures. Four ERT profiles allowed the depth tobedrock to be determined and lithological classification of the sediments. The use of these geophysical tech-niques in combination with geotechnical and geological data allowed (i) the determination of the lithologicalcomposition and detailed internal architecture of the subsurface, (ii) the characterisation and description ofthe geology of the site and (iii) understanding the depositional processes acting in the area during icewithdraw-al. Diamicton and esker gravelswere deposited subglacially by an ice sheetwithdrawingwestwards; glaciolacus-trine sediments located along the southmargin of the esker ridgewere laid down in an icemarginal environmentas a subaqueous fan composed of silt, sand and gravel, and as distal deposits composed of silt and clay in thelower ground area between the fan and the esker ridge. Peat developed during postglacial times andwas partial-ly cut away by anthropogenic action at a later stage.
rights reserved.
© 2011 Elsevier B.V. All rights reserved.
1. Introduction
Although sediments laid down during the Quaternary period covermore than 90% of the Irish landscape, traditional geomorphologicalmapping and outcrop analysis are often constrained by the limitednumber of exposures available and poor morphological expression. Inaddition, geotechnical investigations are expensive and only providesparse point data for Quaternary deposits which often show high sed-imentological, lithological and tectonic variability within very shortdistances. Electrical Resistivity Tomography (ERT) and Ground Pene-trating Radar (GPR) geophysical techniques have been widely used inthe past for Quaternary deposit lithological and sedimentological char-acterisation ( ERT — e.g. Baines et al., 2002; Kilner et al., 2005; Wisenet al., 2005; GPR — e.g. Bakker and van der Meer, 2003; Smith andJol, 1992; Trafford, 2009; Ulriksen, 1982). The integration of electricaland electromagnetic geophysical techniques as complementary tools
for unconsolidated sediment characterisation has been widely ex-plored during the last decade in fields such as: describing peatlandareas (Comas et al., 2004; Kittredge et al., 2008; Slater and Reeve,2002); 3D visualisation of active faults (Vanneste et al., 2008); map-ping river terrace deposits (Hirsch et al., 2008); characterising shallowaquifers (Doetsch et al., 2011; Turesson, 2006); recognising groundwa-ter flow through glacial sediments (McClymont et al., 2011); and inves-tigating the influence of glacial sediments on the development ofpeatlands (Comas et al., 2011). However, the combination of thesetechniques as unconsolidated sedimentmapping tools has not been ex-plored in Ireland. In order to explore such geological mapping ap-proach, a site located in the Irish Midlands encompassing a broadrange of geomorphological features presenting a variety of sedimento-logical and lithological settings was selected. A preliminary Quaternarygeology investigation encompassing geomorphological mapping, expo-sure recording and geotechnical investigation was carried out previousto the geophysical surveys. It is finally intended to integrate the geo-physical techniques ERT and GPR in the Quaternary geology mappingprocess. The results obtained from geophysical surveys and traditionalmapping techniques (e.g. borehole and exposure data) are integrated
639X.M. Pellicer, P. Gibson / Journal of Applied Geophysics 75 (2011) 638–647
in order to refine the interpretation of the collected geophysical data-sets, describe the glacial and postglacial sediments encountered inthe area and reconstruct the glacial history of the site.
2. Geographical and geological setting
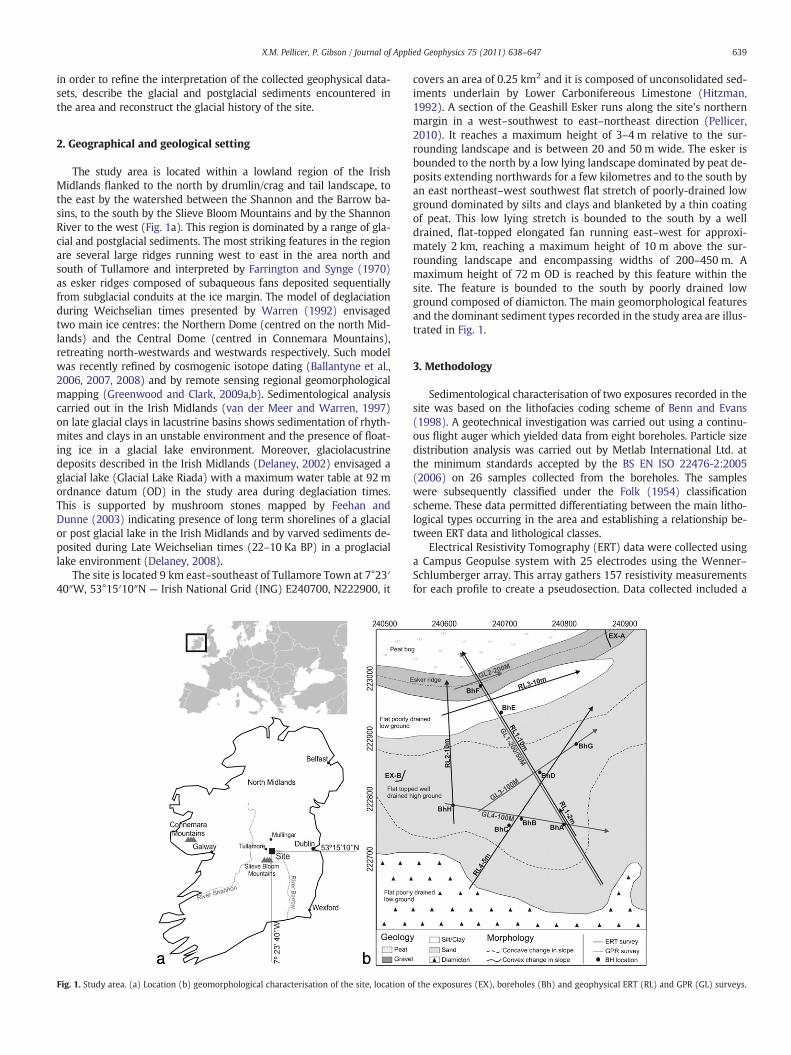
The study area is located within a lowland region of the IrishMidlands flanked to the north by drumlin/crag and tail landscape, tothe east by the watershed between the Shannon and the Barrow ba-sins, to the south by the Slieve Bloom Mountains and by the ShannonRiver to the west (Fig. 1a). This region is dominated by a range of gla-cial and postglacial sediments. The most striking features in the regionare several large ridges running west to east in the area north andsouth of Tullamore and interpreted by Farrington and Synge (1970)as esker ridges composed of subaqueous fans deposited sequentiallyfrom subglacial conduits at the ice margin. The model of deglaciationduring Weichselian times presented by Warren (1992) envisagedtwo main ice centres: the Northern Dome (centred on the north Mid-lands) and the Central Dome (centred in Connemara Mountains),retreating north-westwards and westwards respectively. Such modelwas recently refined by cosmogenic isotope dating (Ballantyne et al.,2006, 2007, 2008) and by remote sensing regional geomorphologicalmapping (Greenwood and Clark, 2009a,b). Sedimentological analysiscarried out in the Irish Midlands (van der Meer and Warren, 1997)on late glacial clays in lacustrine basins shows sedimentation of rhyth-mites and clays in an unstable environment and the presence of float-ing ice in a glacial lake environment. Moreover, glaciolacustrinedeposits described in the Irish Midlands (Delaney, 2002) envisaged aglacial lake (Glacial Lake Riada) with a maximum water table at 92 mordnance datum (OD) in the study area during deglaciation times.This is supported by mushroom stones mapped by Feehan andDunne (2003) indicating presence of long term shorelines of a glacialor post glacial lake in the Irish Midlands and by varved sediments de-posited during Late Weichselian times (22–10 Ka BP) in a proglaciallake environment (Delaney, 2008).
The site is located 9 km east–southeast of Tullamore Town at 7°23′40″W, 53°15′10″N — Irish National Grid (ING) E240700, N222900, it
Fig. 1. Study area. (a) Location (b) geomorphological characterisation of the site, location o
covers an area of 0.25 km2 and it is composed of unconsolidated sed-iments underlain by Lower Carbonifereous Limestone (Hitzman,1992). A section of the Geashill Esker runs along the site's northernmargin in a west–southwest to east–northeast direction (Pellicer,2010). It reaches a maximum height of 3–4 m relative to the sur-rounding landscape and is between 20 and 50 m wide. The esker isbounded to the north by a low lying landscape dominated by peat de-posits extending northwards for a few kilometres and to the south byan east northeast–west southwest flat stretch of poorly-drained lowground dominated by silts and clays and blanketed by a thin coatingof peat. This low lying stretch is bounded to the south by a welldrained, flat-topped elongated fan running east–west for approxi-mately 2 km, reaching a maximum height of 10 m above the sur-rounding landscape and encompassing widths of 200–450 m. Amaximum height of 72 m OD is reached by this feature within thesite. The feature is bounded to the south by poorly drained lowground composed of diamicton. The main geomorphological featuresand the dominant sediment types recorded in the study area are illus-trated in Fig. 1.
3. Methodology
Sedimentological characterisation of two exposures recorded in thesite was based on the lithofacies coding scheme of Benn and Evans(1998). A geotechnical investigation was carried out using a continu-ous flight auger which yielded data from eight boreholes. Particle sizedistribution analysis was carried out by Metlab International Ltd. atthe minimum standards accepted by the BS EN ISO 22476-2:2005(2006) on 26 samples collected from the boreholes. The sampleswere subsequently classified under the Folk (1954) classificationscheme. These data permitted differentiating between the main litho-logical types occurring in the area and establishing a relationship be-tween ERT data and lithological classes.
Electrical Resistivity Tomography (ERT) data were collected usinga Campus Geopulse system with 25 electrodes using the Wenner–Schlumberger array. This array gathers 157 resistivity measurementsfor each profile to create a pseudosection. Data collected included a
f the exposures (EX), boreholes (Bh) and geophysical ERT (RL) and GPR (GL) surveys.

640 X.M. Pellicer, P. Gibson / Journal of Applied Geophysics 75 (2011) 638–647
profile at 2 m, a profile at 5 m and three profiles at 10 m spacing,encompassing lengths of 48 m, 120 m and 240 m, respectively. Sever-al steps were followed to generate a model from the pseudosection.Data were edited when necessary, the editing stage encompassed:(a) merging of ERT profiles collected inline (b) reversing of somedatasets in order to present the data in a consistent direction and(c) topographic correction of all the profiles with altitudinal dataextracted from the Ordnance Survey of Ireland 10 m pixel size DigitalElevation Model (DEM). All datasets were inverted using RES2DINVsoftware (Loke and Barker, 1996). The software generates a calculat-ed model of the pseudosection from the inverted model, the RootMean Square (RMS) error between the calculated and the measuredpseudosection is computed. A least-squares algorithm is used to re-duce the RMS error between the measured and the calculated appar-ent resistivity in an iterative mode. Two inversion methods areavailable in the software package, the Gauss–Newton smoothnessconstrained least-squares (deGroot-Hedlin and Constable, 1990)and Gauss–Newton robust model constrained (Claerbout and Muir,1973), both routines were tested for data inversion, as a generalrule, features depicted for both methods can be considered real(Loke, 2001). Interpretation of the models was based on the resistiv-ity range of some geological materials presented by several re-searchers (Guerin et al., 2004; Palacky, 1987; Reynolds, 1997) andthe data obtained from geological mapping and geotechnical investi-gation carried out in the site.
Ground Penetrating Radar (GPR) data were collected using a PulseEKKO systemwith a 400 V transmitter, perpendicular broadside anten-na orientation in common offset step mode. 50 MHz, 100 MHz and200 MHz antenna frequencies were employed with the following set-tings: (i) 200 MHz — 0.5 m antenna separation, 0.1 m step size and150 ns time window; (ii) 100 MHz — 1 m antenna separation, 0.25 mstep size and 250 ns timewindow; (iii) 50 MHz— 2 m antenna separa-tion, 0.5 m step size and 300 ns timewindow. Twoprofileswere collect-ed using a 200 MHz antenna, two using a 100 MHz and one using the50 MHz. Furthermore, two commonmidpoint surveys (CMP) were car-ried out in the fan area to estimate subsurface velocities. All GPR datawere processed using the EkkoView Deluxe software package. Theradargrams were previously edited by removing unwanted traces andmerging and reversing profiles when required. Data was systematicallyprocessed as follows: (i) time zero adjustment; (ii) low frequency re-moval (‘dewow’) using awindowwidth of one pulse-width of the nom-inal frequency; (iii) application of an automatic gain control (AGC);(iv) migration of the data with the 2D F-K migration method usingthe Stolt (1978) algorithmwith a constant velocity and; (v) topographiccorrection. The velocity used for migration and topographic correctionof the radargramswas estimated from the CMPprofiles and individuallyfor each profile by means of hyperbolae velocity calibration (Neal,2004). GPR data interpretation was based on the concept of radar stra-tigraphy developed through the last two decades (e.g. Jol and Bristow,2003; Jol and Smith, 1991; Moorman et al., 2003; Neal, 2004; Nealet al., 2002; Smith and Jol, 1995). Neal et al. (2002) introduced and de-fined the concepts of radar surfaces, radar packages and radar facies. Aseries of reflection profiles, based on their continuity, shape, dip and re-lationship to each other, was devised by the authors (Fig. 2). A codingscheme for radar surfaces and radar facies modified from Neal (2004)allowed the creation of a relative chronology within each radargramas well as with adjacent ones. The proposed coding system (Fig. 2) dif-ferentiates between radar surfaces and radar facies with subgroups foreach category representing the potential situations presented by glacial,glaciofluvial, glaciolacustrine and postglacial sediments existing in thesite. Reflectorswithin the profiles not directly related to sediment depo-sition (e.g.water table, faulting, hyperbolae derived frompoint features,noise…)were also illustrated and described. Sedimentological interpre-tationwas based on visual analysis of rawand filtered radargrams and itwas supported by knowledge of the regional geology and geotechnicaland geomorphological data.
4. Results
4.1. Geological and geotechnical surveys
Sediments recorded in two exposures (see Fig. 1b for location)were classified by the lithofacies coding scheme from Benn andEvans (1998). A 3–4 m high outcrop (EX-A) located along theesker ridge is dominated by crudely bedded matrix supported cobble/boulder gravel (Bmg) with beds dipping 15–20° north with a fine tomedium sand matrix. A 2 m long lens of laminated silts and clays(Fld) occurs within the beds. These sediments are draped by a thincoating (0–2 m) of diamicton (Dmm), thickening towards the edgesof the ridge and thinner on the ridge-top. The second exposure (EX-B)near the southern margin of the fan is dominated by interstratifiedsandand gravel. Sand (Sd) isfine to veryfinewith some silt component;bedding is deformed. Coarser material is mainly deposited as troughcross-bedded matrix supported medium to coarse gravel and as indi-vidual clast supported gravel beds. Characterisation of the eight bore-holes (see Fig. 1b for location) is based on particle size distributionanalysis carried out on 26 samples and subsequent lithological classifi-cation under Folk's (1954) scheme (Fig. 3). Boreholes BhA, BhB, BhC,BhD, BhG and BhH are located on the fan (Fig. 1), in general terms,these boreholes present interstratified sand and gravel coarseningwestwards underlain by diamicton at depths greater than 8 to 12 m:BhA is dominated by gravelly muddy sand overlying slightly gravellymuddy sand/sandy mud; BhB encompasses gravelly muddy sand over-lying gravelly sandymud; BhCpresentsmuddy sandy gravel overlain byslightly gravelly muddy sand and underlain by gravelly sandy silt; BhDshows gravelly mud underlying slightly gravelly muddy sand and over-lying gravelly silty sand; BhG is composed of silty sand overlying grav-elly muddy sand; BhH is dominated by gravelly sand overlain andunderlain by gravelly muddy sand. BhE is located along the contact be-tween the lacustrine flat and the fan and shows slightly gravelly sandymud overlain by a thin coating of peat and underlain by gravelly sandysilt. BhFwas drilled on top of the esker ridge; the top 4 mare dominatedby muddy sandy gravel with silty sandy matrix, no recovery from 4 to10 m and gravelly mud from 10 to 11.5 m. The borehole logs and sam-ple descriptions based on Folk (1954) classification scheme are pre-sented in Fig. 3; the layers recorded for each borehole log aregeneralised to the dominant lithology.
4.2. Geophysical surveys
4.2.1. ERT profilesA number of lithological types obtained from the particle size ana-
lyses of samples permitted to establish a relationshipwith the electricalresistivity values obtained from the ERT surveys. The colour schemerepresenting the dominant lithological types recorded from the bore-hole logs (Fig. 3) is used to illustrate the interpreted ERT profiles.
Profile RL1-10m (Fig. 4a) cuts across the main geomorphologicfeatures in the site approximately in a south–southeast to north–northwest direction. The section from 100 to 330 m presents areaswith resistivity values higher than 500 Ωm, these are related to grav-elly sand recorded in BhA-S1 (Fig. 3); whereas, the areas showinglower values (b500 Ωm) are inferred as gravelly muddy sand to grav-elly mud recorded in BhD-S1/S2. The section from 330 to 390 m isdominated by sandy mud, as described in BhE-S1, and is representedby low resistivity values (b120 Ωm) down to a depth of about 3 m.Resistivity values of 400–800 Ωm occur from 390 to 405 m, and arerelated to the presence of an esker ridge composed of cobble gravel(BhF —Fig. 3), approximately 8 m thick and 20 m wide. The areaalong the surface 405–425 m is dominated by low resistivity values(b120 Ωm) corresponding to fine sediments. All the materials de-scribed above are underlain by low to medium resistivity values(100–500 Ωm). These resistivity values are associated to diamictoncomposed of gravelly sandy mud and gravelly muddy sand recorded

Fig. 3. Boreholes drilled in the site using a Continuous Flight Auger, classes are generalised from the particle size distribution analysis tests using the classification scheme by Folk(1954); the colour scheme presented was also used for the interpretation of ERT data.
Fig. 2. Top— terminology for description of radar signatures, samples shown are extracted from radargrams collected by Pellicer (2010). Bottom— interpretation coding scheme forradar surfaces and radar facies, modified from Neal (2004).
641X.M. Pellicer, P. Gibson / Journal of Applied Geophysics 75 (2011) 638–647
at the lower levels of BhA and BhD, this resistivity layer encompassesvarying thickness from 5 m to more than 25 m. The lower part of theprofile is dominated by high resistivity values (1000–3000 Ωm) cor-responding to limestone bedrock underlying unconsolidated sedi-ments (Hitzman, 1992). Finally, a lower resistivity zone (600 Ωm)within the limestone bedrock occurs at 100–125 m, showing asharp-vertical contact with the surrounding higher resistivity zone.RL1-2m (Fig. 4b) runs inline with L1-10m. It provides a high resolu-tion cross-section of a small portion of the flat-topped area of thefan. The top metre is dominated by values of less than 300 Ωm relatedto the presence of gravelly muddy sand recorded in BhA-S2 (Fig. 3).
Two areas showing medium resistivity values (N400 Ωm) occurringat 8–24 m and 31–36 m are associated to gravelly sand recorded inBhA-S1. The remaining areas within the profile are dominated by awide resistivity range, 50–400 Ωm and are related to slightly gravellymuddy sand recorded in BhA-S3/4.
RL2-10m (Fig. 5a) runs 80 m west of and subparallel to RL1-10m.Medium to very high resistivity values (500–2000 Ωm) occur alongthe surface at 0–130 m, reaching maximums of 15 m depth. Thearea 130–210 m is dominated by low values (b150 Ωm) reachingmaximum depth of 8 m and probably related to the presence ofsandy mud, as recorded in BhE-S1 (Fig. 3). The area to the north,

Fig. 4. Four profiles collected inline using the ERT and GPR geophysical methods, (a) shows the inversion model of the ERT profile RL1-10m and its interpretation based on resis-tivity values and borehole data, (b) profile RL1-2m showing detail of the 10 m spacing dataset of the first 48 m. (c) GPR profile GL1-50M collected with a 50 MHz antenna, migratedand topographically corrected and (d) GL1-200M collected with a 200 MHz antenna, migrated and topographically corrected shows finer detail of a section of profile GL1-50M.
642 X.M. Pellicer, P. Gibson / Journal of Applied Geophysics 75 (2011) 638–647
dominated by medium resistivity (c. 500 Ωm), is related to bouldergravel shaping the esker ridge. These sediments are underlain bylow to medium resistivity values (150–300 Ωm) interpreted as dia-micton in BhH, which are underlain by a high resistivity(N1200 Ωm) related to the presence of bedrock.
RL3-10m (Fig. 5b) runs along the silt/clay dominated lowland lo-cated at the southernmargin of the esker ridge. High resistivity valuesdominating the lower areas (N1700 Ωm) at 50–20 m OD are associat-ed to limestone bedrock also depicted in RL1-10m. A layer pinchingout westwards at 140–210 m showing medium to high values(600–1700 Ωm) overlies the bedrock. These resistivity layers are
overlain by low resistivity values (b400 Ωm), which probably com-prise sandy mud and gravelly mud as recorded in BhE (Fig. 3).
RL4-5m (Fig. 5c) is composed of three concatenated profiles at5 m electrode spacing which cut obliquely across the main geomor-phologic feature in the site (flat-topped fan) in a southwest to north-east direction. A low resistivity region (b250 Ωm), occurring on thesurface from 0 to 40 m and developing towards deeper parts ismapped as a continuous gently undulating layer occurring under55 m OD and is associated to diamicton composed of gravelly mudand gravelly muddy sand recorded at the lower parts of BhC/D/G.This layer is underlain in places by higher resistivity values

Fig. 5. ERT profiles (a) RL2-10m, (b) RL3-10m and (c) RL4-5m showing the inversion model and their interpretation based on resistivity values and borehole data.
643X.M. Pellicer, P. Gibson / Journal of Applied Geophysics 75 (2011) 638–647
(N1700 Ωm) representing undulating limestone bedrock. The diamic-ton is overlain by high resistivities (N800 Ωm) from 40 to 210 m and240 to 360 m associated to muddy sandy gravel and gravelly muddysand recorded in BhB/C/G. This sand and gravel body is overlain bya layer presenting low to medium resistivity (150–400 Ωm) from 90to 360 m with large variations in thickness related to muddy sandrecorded on S1 for boreholes BhB/C/D/G.
4.2.2. GPR profilesThe raw and filtered GPR radargrams were visually analysed for
data interpretation; visual analysis of non-filtered datasets permitsthe identification of features removed by the filtering process (e.g.migration of the data removes hyperbolae from radargrams, whichallow depicting presence of boulders or channel-like features, aswell as, estimating wave velocities). However, only the filtered radar-grams are shown in the figures presented. The location of GPR profilesis illustrated in Fig. 1. Common midpoint and hyperbolae fitting wereused for velocity calibration of the radargrams. A common midpointprofile was collected in the fan area between boreholes BhB andBhC (Fig. 1), the velocity obtained ranged between 0.10 m/ns and0.12 m/ns. Hyperbolae reflections depicted in profile GL1-200Mwere used for velocity calibration of the flat poorly drained lowground area (Fig. 1) at 0.8 m/ns. Velocity calibration along the eskerridge was also performed by hyperbolae fitting, a velocity of 0.10–0.11 m/ns was obtained. Based on these data a velocity of 0.11 m/nswas selected for data processing and topographic correction. Depthestimates in the sections of the profiles collected in the flat lowground area with subsurface velocities of 0.8 m/ns encompass largeerrors. However, the data processing software available for thisstudy allowed only a single velocity for velocity correction of thedata. The distortion of the radargrams cutting across this area wastaken into account during data interpretation.
GL1-50M (Fig. 4b) reaches a maximum depth of investigation of14 m. Five radar facies are identified along the profile. The area along
the lower parts of the profile showing poor reflectivity (L1f1-Gm) cor-responds to diamicton composed of gravelly sandy mud and gravellymuddy sand, as shown in BhA-S5 and BhD-S4. This is overlain from380 to 410 m by chaotic reflectors agreeing with the muddy sandygravel recorded in BhE-S1 and forming the core of an esker ridgewith moderate topographic expression (L1f2-Gfm). A number of dip-ping reflectors spread from both flanks of the ridge (L1f2-Gfc) areprobably associated with this ridge. A third radar facies (L1f3-Gcd) oc-curs from 100 to 330 m. It is composed of discontinuous to moderatelycontinuous wavy reflectors indicative of cross-stratified sediments. Aset of moderately continuous reflectors dipping 30° NNW are depictedat the edge of the fan at 280–340 m (Fig. 4c,d). These are overlain byseveral curved concave reflectors (L1f4-Gfch) associated to gravellysand recorded in BhA-S1, these facies range from 15 to 30 m in widthand 4 to 7 m in depth and show an erosive contact (L1s3-be) withthe underlying sediments. Furthermore, a continuous reflector subpar-allel to the surface occurs at 330–380 m (L1f5-Lh). The EM are signifi-cantly attenuated in this area, indicating the presence of conductivefine sediments, as recorded in BhE-S1 (Fig. 3). The radargram is fairlydistorted in this section, as the velocity of these sediments is 0.8 m/nsinstead of 0.11 m/ns, thus the contact between f3 and f5 illustrated at3 m depth (Fig. 4b) in the radargram is in fact at 2 m depth. Finally, amoderately continuous reflector running subparallel to the subsurfaceillustrated in blue (Fig. 4c,d) corresponds to the water level recordedin BhF (Fig. 3). GL1-200M (Fig. 4c) provides a higher resolution radar-gram of GL1-50M, four radar facies are recognised. A number of reflec-tors gently dipping NNW (L1f2-Gfm) are detected within the esker(Fig. 6), which correspond to the gently dipping beds of boulder/cobblegravel recorded in exposure EX-A. Several moderately continuous re-flectors dipping 30° NNW are detected at the edge of the fan (240–290 m).Moreover, the erosive contact (L1s3-be) between f3 and f4 isclearly delineated and depositional structures within f4 are sensed(e.g. continuous reflectors dipping SSE and concave up reflectors inter-preted as channel-like features). Four boreholes were drilled along

644 X.M. Pellicer, P. Gibson / Journal of Applied Geophysics 75 (2011) 638–647
these profiles. The main lithological types recorded in the boreholes(Fig. 3) agree with the depicted radar facies: L1f1-Gm relates toBhA-S5 and BhD-S4; L1f2-Gfm is defined by BhF-S1; L1f3-Gfcd corre-sponds to BhA/D-S2; L1f4-Gfch is in accordance with BhA-S1; L1f5-Lhconcurs with BhE-S1.
A cross and a longitudinal section of the esker ridge are presentedin Fig. 6 as a fence diagram of the interpreted profiles GL1-200M andGL2-200M. A continuous horizontal reflector running along the twoprofiles at 59 m OD is inferred as the water-table, as recorded inBhF. A set of moderately continuous and discontinuous oblique,non-parallel reflectors are depicted under 59 m OD (L2f2-Gfc).These are overlain at 0–40 m along GL2-200M by discontinuous cha-otic and hyperbolic reflectors (L2f2-Gfm), associated to the presenceof cobbles along the esker ridge, as recorded in EX-A. The top 4 m ofGL2-200M from 40 to 80 m are dominated by moderately continuousreflectors dipping 10°WSW (L2f2-Gfs). Such reflectors are also recog-nised along line GL12-200M and in exposure EX-A dipping north. Theestimated dip direction of the bedding planes is approximately NW.
GL3-100M profile (Fig. 7a) runs southwest to northeast along theflat-topped elongated fan. Two radar facies are identified. L3f3-Gfc con-sists of moderately continuous to discontinuous sinuous subparallel re-flectors. Continuous curved concave up, sinuous in places, reflectors(L3f4-Gfch) overlie the former with an erosive contact (L3-s3-be).Radar facies f4 are described in boreholes BhD/G as muddy sand andare related to the channel-like features identified in GL1-200M. Theprofile cuts these radar facies at oblique angles in places, the area 0–180 m and 200–240 m at 0–6 m depth shows a long-oblique sectionof the mentioned channel-like features (L1f4-Gfch).
GL4-100M (Fig. 7b) presents two radar facies, L4f3-Gfc is expressedin the radargram by moderately continuous to discontinuous oblique/subparallel reflectors with some occurrences of reflectors dipping east(20–50 m at 4 m depth and 210–230 m at 5 m depth). Continuouscurved concave up reflectors (L4-f4-Gfch) overlie the former with anerosive contact (L4-s3-be). A feature at 180 m and 67m OD, is shownin the non-processed profile as a distinctive bow-tie reflector, charac-teristic of V-shaped channel features (Neal, 2004). Furthermore, threemoderately continuous reflectors dipping 30° E are recorded at 220–250 m distorting radar facies f3 and f4.
5. Discussion
Geological surveying, consisting of geomorphological mappingand lithostratigraphic analysis of exposures, allowed the broad distri-bution of surficial sediments to be assessed but lack of exposure is adifficulty. The geotechnical data permitted the lithological character-isation of the subsurface at eight given points and assisted in the loca-tion of the geophysical surveys which provided data over large areas.Geological mapping and the geotechnical investigations supported
Fig. 6. Fence diagram showing the interpreted radargrams of a cross-section (GL1-200M) and a long-section (GL2-200M) of the esker ridge and the log for BhE.
the interpretation of the geophysical data and provided ‘groundtruth’ in assessing the use of ERT and GPR for recognition and charac-terisation of surficial sediments.
Five lithological classes were differentiated by means of ERT sur-veys supported by field mapping and borehole data, which in chrono-logical order of deposition are: (i) limestone bedrock, (ii) diamicton,(iii) esker gravel and boulders, (iv) gravelly sand/silt and sandy grav-el and (v) lacustrine sandy mud. These classes are characterised fromthe results of resistivity modelling, however, borehole data, geomor-phological evidence and GPR data assisted in the delineation of thelithological boundaries. Areas located at the bottom region of the10 m spacing profiles characterised by high to very high resistivityvalues (N900 Ωm) are interpreted as limestone bedrock. Depth tobedrock ranges from 12 to 38 m, a number of possible weatheredbedrock areas showing resistivities lower than 900 Ωm are alsodepicted in RL1 (Fig. 4a) and RL3 (Fig. 5b). A low to medium resistiv-ity layer (80–400 Ωm) overlying the bedrock is depicted as a contin-uous body with varying thickness in all profiles. This varies from lessthan 1 m in areas underlying the fan up to 25 m in the lower groundarea to the north and is interpreted as diamicton, probably of glacialorigin. Two resistivity layers defined by medium to high resistivityvalues (300–1500 Ωm) are described as gravelly sand/silt (pink col-our in RL1, RL2 and RL4) and as sandy gravel (brown colour in RL1and RL4) overlie the diamicton in the area morphologically definedas a fan. These layers correspond to glaciofluvial sediments reachinga thickness of over 10 m in the middle area of the fan and pinchingout towards its southern and northern margins. An isolated patch20 m wide and 8–10 m thick in its central parts is identified in RL1and partially in RL2 overlying the diamicton encompassing 400–700 Ωm resistivity values. This is interpreted as an esker ridge,which is generally composed of boulders and muddy sandy gravel(See BhF in Fig. 3). Finally, a lithological category dominated by lowresistivity (60–120 Ωm) is recognised in RL1, RL2 and RL3. It is inter-preted as glaciolacustrine sand, silt and clay occurring along the sur-face at the northern and southern margins of the esker ridgeoverlying the diamicton. It reaches a maximum thickness of 8 m inthe middle area of the body located south of the esker and graduallypinches out towards its northern and southern margins. On theother hand, ERT spatial resolution depends on three factors: the elec-trode spacing, the resistivity contrast between the different litholo-gies and the relative position between these features (Kilner et al.,2005). Features, interpreted as gravel channels with the 10 m elec-trode spacing, are shown as gravel lenses with the 2 m spacing.High resolution dataset shows variations of the resistivity valueswithin very short distances indicating lithological changes over-looked by the lower resolution dataset. On the other hand, depth ofpenetration is largely increased with the 10 m spacing dataset,which permitted inferring the presence of limestone bedrock under-lying the unconsolidated sediments and depicting a sharp and verticalstructure (Fig. 4a, 100–120 m) interpreted as karstified limestonebedrock. The combination of different electrode spacing aids in therefinement of the interpretation of the inversion models. Moreover,a disagreement was recorded between the rock head level portrayedby profile RL3-10m (50 m OD) and the rock head level encounteredby profiles RL1/RL2-10m cutting across it, which consistently showrock head level at less than 45 m OD. This illustrates the limitationsof the system to precisely depict the contact between materialswhen using a single profile and emphasises the need to record pro-files at different orientations and combining ERT data with other di-rect (borehole drilling) or indirect (geophysics) methods to refinethe interpretation of resistivity data.
The use of several GPR antenna frequencies for the same survey areais recommended by Jol and Bristow (2003) in order to resolve sedimen-tological structures at different scales. The results for GL1-50/200Mshow that the 50 MHz antenna frequency allowed coarse characterisa-tion of the internal architecture up to 14 m depth, whereas, the

Fig. 7. GPR profiles (a) GL3-100M and (b) GL4-100M. Top — processed radargrams with an AGC gain and topographic correction. Bottom — interpretation of each radargram.
645X.M. Pellicer, P. Gibson / Journal of Applied Geophysics 75 (2011) 638–647
200 MHz antenna permitted the detection of the water table, normalfault planes and the contact between facies f3 and f4. The 100 MHz an-tenna frequency used for GL3 and GL4 seems to offer the best trade offbetween penetration and resolution.
GPR data allowed the characterisation of the subsurface internalarchitecture. Five radar facies were identified, which in chronologicalorder from older to younger are: (i) f1-Gm — glacial massive diamic-ton; (ii) f2-Gfm/Gfc — glaciofluvial massive/cross stratified sedimentsassociated with the esker ridge; (iii) f3-Gcd(d) — glaciofluvial cross-stratified sediments, deformed in places associated with the fan;(iv) f4-Gch(d) — glaciofluvial channel fill sediments, deformed inplaces associated with the fan and; (v) f5-Lh — glaciolacustrine hori-zontally stratified fine sediments. Radar facies f1, characterised by itspoor reflectivity, is depicted at the lower parts of radargram GL1-50M(Fig. 4c) overlain by f2 and f3. Radar facies f2 is depicted in GL1 andGL2 (Fig. 6) overlying f1 with an undifferentiated bounding surface;it is described as discontinuous oblique chaotic reflectors, hyperbolaeand as moderately continuous dipping reflectors in places. It corre-sponds to the deposits forming the core of the esker ridge whichwere recorded in exposure EX-A as crudely bedded cobble/bouldergravel. Radar facies f3, depicted within the fan area (Figs. 4c,d and7), is described by moderately continuous to discontinuous oblique/subparallel reflectors and sinuous/subhorizontal subparallel reflec-tors and it is composed of silty sand and gravelly muddy sand.Radar facies f4, recognised within the fan area in radargrams GL1,GL3 and GL4 (Figs. 4c,d and 7). These are characterised by continuouscurved concave reflectors sinuous in places generally occurring alongthe surface, overlying f3 with an erosional bounding surface and com-posed of gravelly sand, silty sand and slightly gravelly muddy sand.Radar facies f5, identified in GL1, covers the lower ground area be-tween the esker ridge and the fan. It is characterised for reflectors
subparallel to the surface composed of slightly gravelly sandy mudand is interpreted as glaciolacustrine silts and clays overlain by athin coating of peat. Furthermore, a number of sets of discontinuousto moderately continuous dipping reflectors, interpreted as normalfaults, are depicted in GL1 and GL4 (Figs. 4c,d and 7). These faultsare probably associated with collapse structures derived from loss ofsupport of the edges of an ice contact lake acting as a temporarysmall scale sedimentary basin.
The radar facies obtained from GPR data show correspondence withthe lithological classes defined from the ERT and borehole data(Table 1), the integration of the two geophysical datasets togetherwith the geotechnical investigations allows a comprehensive sedimen-tological and lithological characterisation of the subsurface. Resistivityvalues for the lithological types defined in Table 1 agree with previousresearch (Guerin et al., 2004; Palacky, 1987; Reynolds, 1997) andradar facies identified in the study area correspond with facies previ-ously recognised by other authors (Bakker and van der Meer, 2003;Moorman et al., 2003; Neal, 2004). Each technique has its own advan-tages and drawbacks. GPR data provide, in ideal conditions (e.g. lowconductivity sediments), a high resolution picture of the internal archi-tecture of the subsurface, however, the depth of penetration is verypoor in high conductivity sediments (e.g. silts/clays—Fig. 4). The maxi-mum depth of penetration attained in the site is 14 m. On the otherhand, the ERT method allowed the production of profiles of up to40 m depth and clearly detects vertical and horizontal features. Howev-er, the level of detail attained at this depth is much lower and internalarchitecture of the subsurface cannot be recognised using this tech-nique alone.
Geophysical characterisation aided to reconstruct the glacial his-tory of the study area. An esker ridge with poor topographic expres-sion and dominated by cobble/boulder gravel cuts across the north

Table 1ERT lithological classes and GPR radar facies identified in the study area.
Relative chronology Resistivity (Ωm) ERT lithological classes GPR radar facies
6 (younger) 60–120 Silt and clay f5-Lh — lacustrine sediments5 300–800 Gravelly sand/silt f4-Gch(d) — glaciofluvial channel fill (fan)4 400–1500 Sandy gravel f3-Gcd(d) — glaciofluvial cross stratified (fan)3 500–1000 Esker gravel and boulders f2-Gfm/Gfc — glaciofluvial massive (esker ridge)2 80–400 Diamicton f1-Gm — glacial massive1 (older) N900 Bedrock Not detected
646 X.M. Pellicer, P. Gibson / Journal of Applied Geophysics 75 (2011) 638–647
margin of site from west to east. An elongated fan running parallel tothe lower lying esker occurs south of it. These features are separatedby a stretch of glaciolacustrine sediments, but merge east and westof the site into a single entity. The fan is wedge shaped, wideningto the east. Borehole data show that the fan is composed of sandygravel, gravelly sand to muddy sand generally fining eastwards,GPR data depicts a number of cut-and-fill channel-like features run-ning west–east and generally filled with sand and silty sand. Thegeological settings encountered in the site are complex. Diamictonoverlying the bedrock was deposited under subglacial conditions;these deposits are overlain by two main features, the esker ridgeand the fan. The existence of Glacial Lake Riada with an approximatewater level at 92 m OD (Delaney, 2002, 2008) requires these featuresto form either under subglacial or subaqueous conditions. The forma-tion of subaqueous outwash fans associated with eskers can developeither, (i) subglacially within side cavities adjacent to the main tun-nel formed in areas with high hydrostatic pressure (Gorrell andShaw, 1991), (ii) near the ice margin, as ice-walled channel deposits,defined by the ratio of their length to their width and defined aslong bead eskers by Warren and Ashley (1994), or (iii) at the icemargin snout as short bead eskers or ice marginal subaqueous fans(Warren and Ashley, 1994). Subglacial deposits are generally drapedby a coating of diamicton (Fisher and Taylor, 2002). The esker ridge isdominated by poorly sorted cobble, boulder gravel (EX-A) overlain bydiamicton. This suggests that cobble/boulder gravel was deposited ina high energy depositional system under subglacial conditions astunnel-fill esker deposits (Warren and Ashley, 1994); subsequentmelt-ing of the overlying ice deposited the debris included in it as a coating ofdiamicton. Conversely, sedimentation of the fan occurred as a confinedice marginal subaqueous fan or long bead esker. Dipping reflectorsdepicted after a concave change in slope in GL1-50/200M at the north-ernmargin of the fan and in GL4-100Mat its southeastmargin are inter-preted as normal faults. These faults and the geomorphologicalexpression of the body as a long bead esker running west to east, sug-gest that deposition occurred in a channel-like system confined to itsnorth and south margins by ice walls and opened to its outlet to theeast. The sediment collapsed after ice melting and developed the nor-mal faults dipping towards the former ice walls located at the northand south margins of the feature, ice-contact lithofacies typicallyshow collapse and deformational structures created bymassmovementwhen the supporting ice walls slowly melt (Ashley andWarren, 1997).This subaqueous fan is connected to the tunnel fill esker ridge (Warrenand Ashley, 1994), west from the study area. This suggests that the fea-ture is associated with the subglacial tunnel fill deposits (Ashley andWarren, 1995). The fan, located at a higher level (72 m OD), accommo-dated finer, better sorted sediments filling a confined low energy depo-sitional system composed of gravelly sand at its west margin fining tomuddy sand eastwards. The numerous channel-like features identifiedon GPR running west to east are probably formed by resedimentationof material from further up the fan deposited via underflows and sus-pension on a subaqueous fan (Delaney, 2002). The top of the subaque-ous fan has an altitude of 72 m OD, which agrees with the presence ofGlacial Lake Riada flooding the Irish Midlands with a water table at92 m OD (Delaney, 2002). Glaciolacustrine sediments located betweenthe fan and the esker ridge were subsequently deposited; these are
composed of silt/clay with occasional pebbles, probably dropstones de-posited at a later stage as distal facies of icemarginal deposits in a glaciallake environment (van der Meer and Warren, 1997). A thin coating ofpeat developed subsequently on top of these sediments within thesite and as thicker deposits along the northern margin of the esker.Peat deposits suggest the presence of a shallow lake covering themost depressed areas of the site during postglacial times. Peat de-posits in the site have been cut away, they encompass thickness ofless than 30 cm. Peat deposits have been extensively cut-away inthe Irish Midlands during the last century (Gibson, 2007).
6. Conclusions
Geomorphological mapping, exposure lithostratigraphic analysis,borehole logging and particle size distribution analysis data com-bined with ERT and GPR data allowed the lithological and sedimento-logical characterisation of the subsurface. ERT data collected withthree different electrode spacings supported the lithological charac-terisation of unconsolidated sediments and allowed estimating thedepth to bedrock. GPR proved invaluable at depicting the internal ar-chitecture of low-loss materials such as esker gravel and glaciolacus-trine sediments. Using a range of antenna frequencies resulted in thedetection of the subsurface internal architecture at different scales.The radar facies approach used for data interpretation allowed pat-terns encountered in the radargrams to be related to sedimentologi-cal properties of the subsurface. ERT and GPR data complementedeach other and together provided a broad understanding of the sub-surface geology. The integration of these techniques with field andlaboratory data permitted the geological characterisation of the siteand the reconstruction of the depositional environment. The datapresented suggest deposition of the recorded facies by an ice sheetretreating westwards. Firstly, diamicton was deposited subglaciallyover limestone bedrock. A continuous tunnel fill esker ridge (GeashillEsker) was then deposited overlying the diamicton under subglacialconditions infilling a subglacial meltwater channel running east. Asubaqueous fan, indicating a lake water table of over 72 m OD, wasdeposited parallel to the continuous tunnel fill as a long beadedesker ridge composed of silt, sand and gravel overlying the subglacialdiamicton. Glaciolacustrine silts and clays were subsequently depos-ited on the lower ground between the esker ridge and the fan at alater stage of deglaciation. Furthermore, peat developed duringpost-glacial times in a lake covering parts of the study area andextending north from the esker ridge, peat deposits in the studyarea were subsequently cut-away by anthropogenic activity.
Acknowledgments
The geophysical equipment used for this work was provided by theNational University of Ireland, Maynooth Environmental GeophysicsUnit. The Geological Survey of Ireland (GSI) funded the fieldwork andprovided all the equipment for exposure recording, borehole drillingand particle size analysis. The authors would like to thank Caloca, S.,Mozo, B., Sheehy, M. and Fernandez, N. for help in data collection andCox, M. for facilitating access to the site. We also thank Dr. Xavier

647X.M. Pellicer, P. Gibson / Journal of Applied Geophysics 75 (2011) 638–647
Comas for the constructive review comments, which enhanced thequality of an earlier version of the manuscript.
References
Ashley, G.M., Warren, W.P., 1995. Irish eskers/origins of ice-contact stratified deposits.INQUA Commission on Formation and Properties of Glacial Deposits. Symposiumand Field Excursion 21–28 May. 59 pp.
Ashley, G.M., Warren, W.P., 1997. The ice-contact environment. Quaternary Science Re-views 16, 629–634.
Baines, D., Smith, D.G., Froese, D.G., Bauman, P., Nimeck, G., 2002. Electrical resistivityground imaging (ERGI): a new tool for mapping the lithology and geometry ofchannel-belts and valley-fills. Sedimentology 49, 441–449.
Bakker,M.A.J., van derMeer, J.J.M., 2003. Structure of a Pleistocene pushmoraine revealed byGPR: the eastern Veluwe Ridge, The Netherlands. Ground Penetrating Radar in Sedi-ments: In: Bristow, C.S., Jol, H.M. (Eds.), Geol. Soc. London Spec. Publ., 211, pp. 143–151.
Ballantyne, C.K., McCarroll, D., Stone, J.O., 2006. Vertical dimensions and age of theWicklow Mountains ice dome, Eastern Ireland, and implications for the extent ofthe last Irish ice sheet. Quaternary Science Reviews 25 (17–18), 2048–2058.
Ballantyne, C.K., McCarroll, D., Stone, J.O., 2007. The Donegal ice dome, northwestIreland: dimensions and chronology. Journal of Quaternary Science 22, 773–783.
Ballantyne, C.K., Stone, J.O., McCarroll, D., 2008. Dimensions and chronology of the lastice sheet in Western Ireland. Quaternary Science Reviews 27 (3–4), 185–200.
Benn, D.I., Evans, D.J.A., 1998. Glaciers and Glaciation. Arnold, London.BS EN ISO 22476-2:2005, 2006. Geotechnical Investigation and Testing. 0 580 47636 7.Claerbout, J.F., Muir, F., 1973. Robust modellingwith erratic data. Geophysics 38, 826–844.Comas, X., Slater, L., Reeve, A., 2004. Geophysical evidence for peat basin morphology
and stratigraphic controls on vegetation observed in a northern peatland. Journalof Hydrology 295, 173–184.
Comas, X., Slater, L., Reeve, A., 2011. Pool patterning in a northern peatland: geophysicalevidence for the role of postglacial landforms. Journal of Hydrology 399 (3–4),173–184.
Delaney, C.A., 2002. Sedimentology of a glaciofluvial landsystem, Lough Ree area, Cen-tral Ireland: implications for ice margin characteristics during Devensian deglacia-tion. Sedimentary Geology 149, 111–126.
Delaney, C.A., 2008. Seasonal controls on deposition of Late Devensian glaciolacustrinesediments, Central Ireland. Glacial Sedimentary Processes and Products. : In: Hambrey,M., Christoffersen, P., Glasser, N., Jansen, P., Hubbard, B., Siegert, M. (Eds.), SpecialPublication. International Association of Sedimentologists, Oxford, Blackwells,pp. 146–163.
Doetsch, J., Linde, N., Pessognelli, M., Green, A.G., Günther, T., 2011. Constraining 3-D elec-trical resistance tomographywith GPR reflection data for improved aquifer character-ization. Journal of Applied Geophysics. doi:10.1016/j.jappgeo.2011.04.008.
Farrington, A., Synge, F.M., 1970. Three local studies of the Irish Pleistocene, the eskersof the Tullamore District. In: Stephens, N., Glassock, R. (Eds.), Irish GeographicalStudies, Queens University of Belfast, pp. 49–52.
Feehan, J., Dunne, L., 2003. Ireland's Mushroom Stones. Relics of a Vanished Lakeland.Environmental Resource Management, University College Dublin.
Fisher, T.G., Taylor, L.D., 2002. Sedimentary and stratigraphic evidence for subglacialflooding, south-central Michigan, USA. Quaternary International 90, 87–115.
Folk, R.L., 1954. The distinction between grain size and mineral composition insedimentary-rock nomenclature. Journal of Geology 62, 344–359.
Gibson, P.J., 2007. Heritage Landscapes of the Irish Midlands and Selected Itineraries.Geography Publications, Dublin.
Gorrell, G., Shaw, J., 1991. Deposition in an esker, bead and fan complex, Lanark, Ontario,Canada. Sedimentary Geology 72, 285–314.
deGroot-Hedlin, C., Constable, S., 1990. Occam's inversion to generate smooth, two-dimensional model from magnetotelluric data. Geophysics 55, 1613–1624.
Greenwood, S.L., Clark, C.D., 2009a. Reconstructing the last Irish Ice Sheet 1: changingflow geometries and ice flow dynamics deciphered from the glacial landform re-cord. Quaternary Science Reviews 28, 3085–3100.
Greenwood, S.L., Clark, C.D., 2009b. Reconstructing the last Irish Ice Sheet 2: ageomorphologically-driven model of ice sheet growth, retreat and dynamics. Qua-ternary Science Reviews 28, 3101–3123.
Guerin, R., Munoz, M.L., Christophe, A., Laperrelle, C., Hidra, M., Drouart, E., Grellier, S.,2004. Leachate recirculation: moisture content assessment by means of a geophys-ical technique. Waste Management 24, 785–794.
Hirsch, M., Bentley, L.R., Dietrich, P., 2008. A comparison of electrical resistivity, groundpenetrating radar and seismic refraction results at a river terrace site. Journal ofEnvironmental and Engineering Geophysics 13 (4), 325–333.
Hitzman, M.W., 1992. Bedrock geological map of the Carboniferous of Central Ireland(1:100,000 Scale, O.S.Sheets 12,13,15, 16, 18 and 19. Geological Survey of Ireland.
Jol, H.M., Smith, D.G., 1991. Ground penetrating radar of northern lacustrine deltas. Ca-nadian Journal of Earth Sciences 28, 1939–1947.
Jol, H.M., Bristow, C.J., 2003. GPR in sediments: advice on data collection, basic proces-sing and interpretation, a good practice guide. In: Bristow, C.J., Jol, H.M. (Eds.),Ground Penetrating Radar in Sediments. The Geological Society, London, pp. 9–29.
Kilner, M., Westa, L.J., Murray, T., 2005. Characterisation of glacial sediments using geo-physical methods for groundwater source protection. Journal of Applied Geophys-ics 57 (4), 293–305.
Kittredge, N., Comas, X., Baird, A., Slater, L., Strack, M., Thompson, D., Jol, H.M., Binley,A., 2008. Ecohydrologically-important subsurface structures in peatlands arerevealed by Ground-Penetrating Radar and resistivity measurements. Journal ofGeophysical Research, Biogeosciences 113, G04030. doi:10.1029/2008JG000787.
Loke, M.H., 2001. Electrical imaging surveys for environmental and engineering stud-ies. A Practical Guide to 2-D and 3-D Surveys: RES2DINV Manual, IRIS Instruments.www.iris-instruments.com.
Loke, M.H., Barker, R.D., 1996. Rapid least squares inversion of apparent resistivitypseudosections by a quasi-Newton method. Geophysical Prospecting 44, 131–152.
McClymont, A.F., Roy, J.W., Hayashi, M., Bentley, L.R., Maurer, H., Langston, G., 2011. In-vestigating groundwater flow paths within proglacial moraine using multiple geo-physical methods. Journal of Hydrology 399, 57–69.
van der Meer, J.J.M., Warren, W.P., 1997. Sedimentology of late glacial clays in lacus-trine basins, Central Ireland. Quaternary Science Reviews 16, 779–791.
Moorman, B.J., Robinson, S.D., Burgess, M.M., 2003. Imaging periglacial conditions withground-penetrating radar. Permafrost and Periglacial Processes 14, 319–329.
Neal, A., 2004. Ground Penetrating Radar and its use in sedimentology: principles,problems and progress. Earth-Science Reviews 66, 261–330.
Neal, A., Richards, J., Pye, K., 2002. Structure and development of shell cheniers inEssex, southeast England, investigated using high-frequency ground-penetratingradar. Marine Geology 185, 435–469.
Palacky, G.J., 1987. Resistivity characteristics of geologic targets. In: Nabighian, M.N.(Ed.), Electromagnetic Methods in Applied Geophysics Theory, vol. 1. Society of Ex-ploration Geophysicists, Tulsa, Okla., pp. 53–129.
Pellicer, X.M., 2010, Geophysical Characterisation and Evolutionary Model of the Qua-ternary sediments in the North Offaly region of Central Ireland. Unpublished Ph.DThesis, Department of Geography, National University of Ireland, Maynooth.
Reynolds, J.M., 1997. An Introduction to Applied and Environmental Geophysics. JohnWiley and Sons Ltd.
Slater, L., Reeve, A., 2002. Understanding peatland hydrology and stratigraphy using in-tegrated electrical geophysics. Geophysics 67, 365–378.
Smith, D.G., Jol, H.M., 1992. Ground-penetrating radar investigation of a Lake Bonne-ville delta, Provo level, Bingham City, Utah. Geology 20, 1083–1086.
Smith, D.G., Jol, H.M., 1995. Ground penetrating radar: antenna frequencies and maxi-mum probable depths of penetration in Quaternary sediments. Journal of AppliedGeophysics 33, 93–100.
Stolt, R.H., 1978. Migration by Fourier Transform. Geophysics 43, 23–48.Trafford, A., 2009. Mapping thickness of raised peat bog deposits using GPR. Near Sur-
face 2009 — 15th European Meeting of Environmental and Engineering Geophys-ics, Dublin, Ireland.
Turesson, A., 2006. Water content and porosity estimated from ground-penetratingradar and resistivity. Journal of Applied Geophysics 58, 99–111.
Ulriksen, C.P., 1982. The application of impulse radar to civil engineering. Unpubl. PhDthesis, Univ. Lund.
Vanneste, K., Verbeeck, K., Petermans, T., 2008. Pseudo-3D imaging of a low-sliprate,active normal fault using shallow geophysical methods; the Geleen Fault in theBelgian Maas River valley. Geophysics 73 (1), B1–B9.
Warren, W.P., 1992. Drumlin orientation and the pattern of glaciation in Ireland.Sveriges Geologiska Undersokning, Research Papers, Series Ca 81, 359–366.
Warren, W.P., Ashley, G.M., 1994. Origins of the ice-contact stratified ridge (eskers) ofIreland. Journal of Sedimentary Research A64, 433–449.
Wisen, R., Auken, E., Dahlin, T., 2005. Combination of 1D laterally constrained inversionand 2D smooth inversion of resistivity data with a priori data from boreholes. Eu-ropean Association of Geoscientists & Engineers, Near Surface Geophysics 3, 71–79.


