
Joshua T. Abbott Joseph L. Austerweil
30
Running head: RANDOM WALKS AND OPTIMAL FORAGING 1 Random walks on semantic networks can resemble optimal foraging Joshua T. Abbott Department of Psychology University of California, Berkeley Joseph L. Austerweil Department of Cognitive, Linguistic, and Psychological Sciences Brown University Thomas L. Griffiths Department of Psychology University of California, Berkeley Word count: 6153 Address for correspondence: Joshua T. Abbott University of California, Berkeley Department of Psychology 3210 Tolman Hall # 1650 Berkeley CA 94720-1650 E-mail: [email protected] Phone: (510) 642 7134 Fax: (510) 642 5293
Transcript of Joshua T. Abbott Joseph L. Austerweil

Running head: RANDOM WALKS AND OPTIMAL FORAGING 1
Random walks on semantic networks can resemble optimal foraging
Joshua T. Abbott
Department of Psychology
University of California, Berkeley
Joseph L. Austerweil
Department of Cognitive, Linguistic, and Psychological Sciences
Brown University
Thomas L. Griffiths
Department of Psychology
University of California, Berkeley
Word count: 6153Address for correspondence:Joshua T. AbbottUniversity of California, BerkeleyDepartment of Psychology3210 Tolman Hall # 1650Berkeley CA 94720-1650E-mail: [email protected]: (510) 642 7134Fax: (510) 642 5293

RANDOM WALKS AND OPTIMAL FORAGING 2
Abstract
When people are asked to retrieve members of a category from memory, clusters of semantically
related items tend to be retrieved together. A recent article by Hills, Jones and Todd (2012) argues
that this pattern reflects a process similar to optimal strategies for foraging for food in patchy
spatial environments, with people making a strategic decision to switch away from a cluster of
related information as it becomes depleted. We demonstrate that similar behavioral phenomena
also emerge from a random walk on a semantic network derived from human word association
data. Random walks provide an alternative account of how people search their memory,
postulating an undirected rather than a strategic search process. We show that results resembling
optimal foraging are produced by random walks when related items are close together in the
semantic network. These findings are reminiscent of arguments from the debate on mental
imagery, showing how different processes can produce similar results when operating on different
representations.
Keywords: semantic fluency, memory search, semantic networks, random walks, optimal
foraging

RANDOM WALKS AND OPTIMAL FORAGING 3
Random walks on semantic networks can resemble optimal foraging
How do people search their memory for information related to a given cue? One classic
method for exploring this question, the semantic fluency task, asks people to retrieve as many
members of a category as possible in a limited amount of time (Bousfield & Sedgewick, 1944;
Thurstone, 1938). This simple task has been used to explore the representations and processes that
support semantic memory, and has even been used in clinical settings to study memory deficits in
patients with different forms of dementia (Lezak, 1995; Tröster, Salmon, McCullough, & Butters,
1989; Troyer, Moscovitch, Winocur, Leach, & Freedman, 1998). Previous work has found that
retrieval from semantic memory in fluency tasks tends to be produced in bursts of semantically
related words with large pauses between bursts (e.g., Bousfield & Sedgewick, 1944; Romney,
Brewer, & Batchelder, 1993; Troyer, Moscovitch, & Winocur, 1997). For example, Troyer et al.
(1997) asked participants to “name as many animals as you can” and observed that the retrieved
animals tended to group into clusters (“pets”, “African animals”, etc.). The pauses between pairs
of retrieved words in the same cluster (e.g., “dog-cat”) were very small when compared to the
large pauses between pairs of retrieved words that do not belong to any of the same clusters (e.g.,
“cat-giraffe”). This pattern of patchy responses led Troyer et al. (1997) to posit that search
through semantic memory is comprised of two processes, one process that jumps between clusters
related to the given cue and another process that retrieves words within the current cluster.
Inspired by this pattern of bursts in retrieval from semantic memory, recent work by Hills,
Jones, and Todd (2012) compared search through semantic memory to how animals forage for
food. When animals search for food, they must consider the costs and benefits of further depleting
their current food source as opposed to searching for a new patch of food. A large literature in
biology called optimal foraging theory has compared animal foraging to ideal strategies (Stephens
& Krebs, 1986). In particular, the marginal value theorem shows that an animal’s expected rate of
food retrieval is optimal if they stop exploiting the current patch of food when the instantaneous
rate (the marginal value) of food being acquired from the current patch is lower than their overall
expected rate of food retrieval (Charnov, 1976).

RANDOM WALKS AND OPTIMAL FORAGING 4
Human search through semantic memory could be considered analogous to how animals
search for food, with semantically-related clusters playing the role of patches. If this were the
case, then the pattern of pauses between pairs of retrieved words could be consistent with optimal
foraging theory: responses should switch clusters when the marginal value of finding another item
within the current cluster is less than the overall rate of return across memory. Hills et al. (2012)
found that human memory search was consistent with this prediction of optimal foraging theory.
Based on these results and a comparison of the performance of several different computational
models, they proposed that human memory search involves two distinct processes, a “clustering”
and a “switching” process, with the strategy for switching being consistent with the marginal
value theorem.1
In this paper, we show that behavioral phenomena consistent with a two-stage search
process can also be produced by a random walk on a semantic network derived from human word
association data. This potentially provides an alternative account of human performance on
semantic fluency tasks, and is consistent with previous work linking random walks on semantic
networks with memory search (Griffiths, Steyvers, & Firl, 2007; Rhodes & Turvey, 2007;
Thompson, Kello, & Montez, 2013). We show that predictions consistent with the results of Hills
et al. (2012) are produced by random walks on semantic networks in which items that belong to
the same cluster are close together in the network.
By providing an alternative account of the behavioral data that does not explicitly encode
aspects of optimal foraging, our analyses suggest that further experiments will be required to
determine whether the processes underlying human memory search involve optimal foraging.
Furthermore, these results provide a concrete illustration of a theoretical problem for cognitive
psychology that was identified by Anderson (1978) in the context of the mental imagery debate:
different algorithms operating over different representations can produce the same predictions. In
this case, a one-stage search process (a random walk) operating on one representation (a semantic
network) can resemble a two-stage search process (optimal foraging) operating on another
1Hills et al. (2012) are not the first to suggest that a switching process is involved in memory search – similar ideasappear in previous work (e.g., Raaijmakers & Shiffrin, 1981; Dougherty, Harbison, & Davelaar, 2014).

RANDOM WALKS AND OPTIMAL FORAGING 5
representation (a semantic space). The mimicry may not be complete – it might be possible to
construct experiments that differentiate these two accounts – but both models produce key
behavioral phenomena from the semantic memory literature.
The remainder of the paper is organized as follows. First, we provide relevant background
information on the retrieval phenomena predicted by an optimal foraging account of semantic
fluency. We then discuss random walks as an alternative framework for modeling memory search,
beginning with a model considered by Hills et al. (2012). This random walk provided a poor fit to
human data and does not produce behavior consistent with optimal foraging. We then show that a
random walk operating on a different representation – a semantic network based on free
association data – does produce behavior consistent with optimal foraging. An analysis of the two
representations on which these random walks are based suggests that the critical difference is that
the semantic network better captures the clustering of animals, and a minimal model confirms that
a random walk based purely on such a cluster structure produces the key phenomena. We
conclude by discussing the implications of our work for understanding the role of representations
and algorithms in human foraging behavior and outlining possible directions for future research.
Optimal foraging as an account of semantic fluency
Optimal foraging theory covers a wide range of situations that a hungry animal might
encounter (Stephens & Krebs, 1986), but the most basic scenario involves deciding how to
navigate a “patchy” environment for resources. In this environment, food is contained in a set of
discrete patches, which are depleted as the animal consumes the food. Staying in a patch thus
provides diminishing returns, and the animal has to decide when to leave the patch and seek food
elsewhere. The solution is provided by the marginal value theorem (Charnov, 1976), which
indicates that the animal should leave the patch when the rate of return for staying drops below
the average rate of return in the environment. Hills et al. (2012) suggested that retrieval from
semantic memory is analogous to animals foraging for food, where a patch corresponds to a
cluster of semantically-related items and acquiring food corresponds to retrieving an item from

RANDOM WALKS AND OPTIMAL FORAGING 6
this cluster.
To investigate whether optimal foraging theory might account for human search through
semantic memory, Hills et al. (2012) had people perform a semantic fluency task, where people
were asked to “Name as many animals as you can in 3 minutes”. They then analyzed the search
paths taken through memory, as indicated by the time between the animal names people
produced, called the inter-item response time (IRT). These names were assigned to the
predetermined animal categories identified by Troyer et al. (1997), which were used to analyze
patterns in people’s responses: if an item shares a category with the item immediately before it, it
is considered part of the same cluster, otherwise, that item defines a transition between clusters.
For example, given the sequence “dog-cat-giraffe”, “dog” and “cat” are considered elements of
the same cluster, while “giraffe” is considered the point of transition to a new cluster.
As a first measure of correspondence with optimal foraging theory, the ratio between IRTs
and the long-term average IRTs for each participant were examined at different retrieval positions
relative to a cluster switch.2 Figure 1a displays the results of this analysis. The first word in a
cluster (indicated by an order of entry of “1”) takes longer to produce than the overall long-term
average IRT (indicated by the dotted line), and the second word in a cluster (indicated by “2”)
takes much less time to produce (reported results of a within-participant paired t-test,
t(140) = 13.14, p < 0.001 and t(140) = 11.92, p < 0.001, for first and second words
respectively). Furthermore, the IRTs for words preceding a cluster switch (indicated by “-1”) did
not differ significantly from most participants’ own long-term average IRTs (reported results
using a one-sample t-test, 132 of 141 participants were not significantly different, and the nine
that were significantly different all had pre-switch IRT averages less than their long-term
averages). These results are in line with the marginal value theorem, which predicts that IRTs
should increase monotonically towards the long-term average IRT prior to a cluster switch, going
2Hills et al. (2012) also examined a number of preliminary tests to check their assumptions of memory search ina patchy semantic space. As a test of whether transition points occur when local semantic patches are depleted, the“residual proximity” (or inverse semantic distance) of each word produced was compared to all remaining words notyet produced. They found that items produced immediately before a transition point had a lower residual proximitythan items produced immediately after, consistent with their prediction.

RANDOM WALKS AND OPTIMAL FORAGING 7
above this average only when switching to a new cluster.
As a further test of the marginal value theorem’s predictions, the absolute difference
between the pre-switch IRT and long-term average IRT was plotted against the number of words a
participant produced (see Figure 1b). Participants with a larger absolute difference (indicating
they either left clusters too soon or too late) produced fewer words, as predicted by the marginal
value theorem (reported results using a linear regression model found a significant negative
relationship between participants’ deviation from the marginal value theorem policy for patch
departures and the total number of words the participants produced, with a slope of -5.35,
t(139) =−5.77, p < 0.001).
An initial comparison of optimal foraging and random walks
Inspired by the marginal value theorem, Hills et al. (2012) suggested a two-part process
model to account for the results of their experiment: when the IRT following a word exceeds the
long-term average IRT, search switches from local to global cues. They compared this model to
several simpler alternatives, including one in which memory search is simply construed as a
random walk over a set of items (called the “one cue – static” model in their paper). Random
walks have a long history as models of memory (Anderson, 1972), and recent work has shown
that random walks on semantic networks can produce a distribution of IRTs in fluency tasks
(Rhodes & Turvey, 2007; Thompson et al., 2013) and a pattern of responses in free association
tasks (Griffiths, Steyvers, & Firl, 2007) similar to those produced by people.
The random walk considered by Hills et al. (2012) operated over a set of 771 animals, being
possible responses in the semantic fluency task. The model assumed that each response people
produced was sampled from a distribution based on the previous response, with the probability of
each animal given by
P(Xi|X j) ∝ S(Xi,X j)β (1)
where S(Xi,X j) is the similarity between the previous animal response X j and the current animal
response Xi, given by the BEAGLE model of semantic representation (Jones & Mewhort, 2007).

RANDOM WALKS AND OPTIMAL FORAGING 8
In this model, each word is represented by a vector in a semantic space, and the similarity
between words is based on the cosine similarity of their vectors. β is a free parameter of the
model controlling the saliency (attention weight) assigned to a given cue.
Hills et al. (2012) compared this model with a two-part model that switched between
exploring a cluster using a similar random walk and making a larger leap between clusters (called
the “combined cue – dynamic” model in their paper). In this two-part model, the global switching
process was carried out using a generic model of memory retrieval based on the ACT-R and SAM
architectures (Anderson, 1990; Raaijmakers & Shiffrin, 1981). This makes it possible to calculate
the probability of each participant’s sequence of responses under both models, and Hills et al.
(2012) found that the two-part model gave a better fit to the human data than the random walk
model.
Another way to evaluate the performance of the random walk model is to examine whether
it can produce the key phenomena of human behavior that are suggestive of optimal foraging: the
correspondence between the average IRT and the time at which people switch clusters, and the
relationship between deviation from the marginal value theorem and overall performance (as
shown in Figure 1). To examine this, we simulated random walks generating responses via
Equation 1 and subjected these responses to the same analyses that Hills et al. (2012) used on
their data. We used their reported mean β = 4.34 in the simulations below.
To connect the output of a simulation (the sequence of items visited by the random walk
model) to the experimental results (i.e., IRTs), we need to define a method for mapping the
sequence of items to IRTs. In our analyses, we consider only the time between first visits to
animals, which we denote as τ(k) for the kth unique animal item seen (out of the K unique animal
items visited on the random walk). For example the output of a simulated random walk might be:
X0 = “dog”,X1 = “cat”,X2 = “dog",X3 = “mouse”.
Here, K = 3 with k = 1 referring to “dog”, k = 2 referring to “cat”, and k = 3 referring to
“mouse”. Our τ(k) function would return τ(1) = 1, τ(2) = 2, and τ(3) = 4 for this example since
we only consider the first time “dog” is visited (at timestep n = 1). Thus, we define the IRT

RANDOM WALKS AND OPTIMAL FORAGING 9
between animals k and k−1 in a sequence of nodes visited along a random walk as
IRT (k) = τ(k)− τ(k−1). (2)
where τ(k) is the first hitting time of animal Xτ(k). For the above example, the IRT between
“mouse” (k = 3) and “cat” (k = 2) is
IRT (3) = τ(3)− τ(2) = 4−2 = 2.
With this mapping defined, we can perform the same set of analyses in Hills et al. (2012) on IRTs
between animal words for our random walker simulations.3
A total of 141 simulated random walks were run for 45 iterations, which was selected so
that the average number of animals produced by a simulated random walk was approximately
equal to the average number of animals typed by a participant in Hills et al. (2012). Figure 2
shows the results. Consistent with its poor fit to people’s responses, the random walk model did
not produce behavior that resembles optimal foraging. While there was a negative linear
relationship between the deviation from the marginal value theorem and overall performance
(slope of -31.21, t(138) =−4.00, p < 0.001)4, there are few differences between the IRTs and
long-term average IRTs, regardless of retrieval position. This latter difference is particularly
important when analyzing whether transitions between clusters occur at the point predicted by
optimal foraging.
Exploring a different semantic representation
In arguing that people engage in a two-stage process based on optimal foraging theory, Hills
et al. (2012) are making a commitment to a particular algorithm for memory search. In particular,
they show that this algorithm accounts for human behavior better than a random walk. However,
3Although Hills et al. (2012) consider only animals in their search space, we present this method to operate overmulti-domain spaces more generally.
4We removed outliers from all such analyses, which were defined as foragers whose deviation from the marginalvalue theorem or the number of words produced were more than three standard deviations from their respective means.

RANDOM WALKS AND OPTIMAL FORAGING 10
in making this comparison they also need to commit to a representation of semantic memory – in
this case the spatial representation provided by BEAGLE (Jones & Mewhort, 2007). But, as
Anderson (1978) pointed out, claims with respect to representation cannot be evaluated on
behavioral evidence alone without assuming a particular algorithm or process on that
representation (due to mimicry): with a different representation, a random walk might produce a
closer match to human behavior.
While Hills et al. (2012) focused on spatial representations, other work in the memory
literature have used random walks to capture aspects of human memory search (Griffiths,
Steyvers, & Firl, 2007; Rhodes & Turvey, 2007; Thompson et al., 2013) by assuming a different
kind of representation: a semantic network (Collins & Loftus, 1975). In a semantic network,
nodes and edges in a graph encode words and pairwise associations, respectively.5 Previous work
has explored how semantic networks can be used to explore questions about the structure of
semantic memory (Griffiths, Steyvers, & Firl, 2007; Griffiths, Steyvers, & Tenenbaum, 2007;
Romney et al., 1993; Steyvers, Shiffrin, & Nelson, 2004; Steyvers & Tenenbaum, 2005).
Following this work, we approximate the structure of semantic memory with a semantic network
constructed from people’s behavior in a word association task, where people are given a cue and
list words associated with the cue (Nelson, McEvoy, & Schreiber, 2004). For example, if a
participant were told the cue “bed,” they might respond with “pillow,” “blanket,” and “sheet.” The
result is a semantic network with 5018 nodes, representing the associations between words from
“a” to “zucchini.” There are 178 animals in the semantic network that were also one of the 373
animals produced by at least one of the 141 participants in Hills et al.’s (2012) experiment. Of
these 178 animals, 13 were not the associate of any other word and so, we removed them from
this and subsequent analyses (leaving 165 animals for analysis).6
5Technically, any random walk on a discrete set of objects can be interpreted as a random walk on a graph. Fromthis perspective, the random walk considered by Hills et al. (2012) could be viewed as a random walk on a semanticnetwork. However, the probabilities of moving between nodes on this graph were derived from the spatial represen-tation used in BEAGLE, which places constraints on what kinds of conditional probabilities (and graph structures)are possible (for a discussion of these constraints, see Tversky, 1977; Griffiths, Steyvers, & Tenenbaum, 2007). Inparticular, low-dimensional spatial representations constrain the number of items to which an item can be the nearestneighbor (Tversky & Hutchinson, 1986) – a property that might be relevant to the behavior of a random walk.
6Our random walk models operate over all 5018 nodes in the semantic network, however our τ(k) function operates

RANDOM WALKS AND OPTIMAL FORAGING 11
A random walk on a semantic network searches memory in the following manner. Initially,
it starts at the node whose label corresponds to the cue. It moves to a new node by following an
edge, selected at random, from the current node to the new node. A random walk on a semantic
network could retrieve items in a patchy manner, appearing to make deliberate switches between
clusters, if the clusters correspond to densely linked sets of nodes with few links between them.
Thus, if the clusters that appear in people’s responses are reflected in the structure of the semantic
network, this non-strategic search process might be sufficient to capture the phenomena reported
by Hills et al. (2012).
Other than the network, there are two other steps to defining a random walk: (1) defining
what node the random walk starts at (or a probability distribution over nodes), and (2) defining the
probability distribution for transitioning from one node to the next node (a transition probability
matrix). We assume that the random walk starts at the node that represents the cue C given to the
participant. So, to capture the results of Hills et al. (2012), we assume that C is “animal”, and
X0 = l−1(C), where l(·) is a function whose input is a node and output is its corresponding label,
and l−1(·) is the inverse function, whose input is the label and its output is the node with that
label. We explore four possible transition probability matrices defined by the orthogonal
combination of two factors: whether the probability of transitioning out of a node is uniform or
weighted over its edges and whether there is a non-zero probability of jumping back to the node
corresponding to the cue.
The first factor is whether the probability of transitioning out of a node is uniform over its
outgoing edges from the current node (as discussed in the previous example) or weighted,
allowing the model to represent the degree of association between two items. In the case of the
weighted model, the probability of transitioning from the current node to a new node is
proportional to the frequency that the label of the new node was said by a participant given the
current node as a cue in the word-association database (Nelson et al., 2004). Formally, the
associations between a set of n items can be represented as a n×n matrix L, where Li j = 1 when
over just these 165 animals.

RANDOM WALKS AND OPTIMAL FORAGING 12
item j is associated with item i and is zero otherwise. A random walk over these n items is
defined by a matrix M of transition probabilities, where Mi j denotes the conditional probability of
jumping to item i given the random walk is currently at item j. In the uniform model, this is
Mi j =Li j
∑nk=1 Lk j
. (3)
The denominator is called the out-degree of node j or the number of items that are associates of
item j and so it is the number of possible items that the random walk could move to from node j.
For the weighted model, Li j is proportional to the number of times that i was an associate of j.
The weighted model can capture that some associations (e.g., “dog” and “cat”) are stronger than
others (e.g., “dog” and “house”).
The second factor is either non-jumping, where there is no effect of the cue besides for
initializing the random walk or jumping, where at each time step, the model “jumps” back to the
cue with probability ρ, but otherwise (with probability 1−ρ) the model transitions in the same
manner as described above.7
In sum, we will explore four different random walk models, which are formed by
combining two factors: whether the edges are uniform or weighted and whether the random walk
randomly jumps back to the cue (jumping) or not (non-jumping). Formally, they are all defined by
the following equation
P(Xn+1|C = “animal”,Xn = xn) = ρP(Xn+1|Xn = l−1(“animal”))+(1−ρ)P(Xn+1|Xn = xn) (4)
where P(Xn+1|Xn) is defined by Equation 3 with L defined according to whether the model is
uniform or weighted, and ρ = 0 when the model is non-jumping or 0 < ρ≤ 1 when the model is
7We note this is a qualitatively different operation than the proposal of “jumping” between different search cuesmade by Hills et al. (2012). Rather than reflecting a strategic decision to switch between clusters, the jumps areexecuted at random and simply “prime” the search process by returning to the initial state. In simulations not presentedin the paper, we also examined the consequences of jumping to random nodes – a process which is more similar tothe move from local to global cues in the model proposed by Hills et al. (2012), and has precedent in other work onrandom walks and semantic memory (Goñi et al., 2010, 2011). However, this jumping process produces qualitativelysimilar results to those described in the main text.

RANDOM WALKS AND OPTIMAL FORAGING 13
jumping.
A direct quantitative comparison between these models and the models considered by Hills
et al. (2012) is difficult, as there are different numbers of animals in the free association data and
in the BEAGLE representation. This makes comparison hard because the probabilities assigned to
participant responses by each model is determined in part by the number of possible responses
(roughly speaking, the more animals in the model, the less probability assigned to each animal by
the model). Instead, we perform qualitative comparisons of these models in the same manner as
we did for the random walk earlier in the article.
A total of 141 simulated random walks were run for each of the four models. Each
simulation was run for 2000 iterations, which was selected so that the average number of animals
produced by a simulated random walk was approximately equal to the average number of animals
typed by a participant in Hills et al. (2012). On average, each participant responded with 36.8
animals, and an average of 33.5, 42.5, 23.8, and 30.9 animals were produced by the uniform-non
jumping, uniform jumping, weighted non-jumping, and weighted jumping random walk models,
respectively. We expected the jumping models to produce more animals than the non-jumping
models because “jumps” got the model away from nodes already visited by the random walk.
Additionally, we expected slightly fewer animals to be produced by the random walk models than
participants because of the small number of animals included in the semantic network (most
people have probably encountered more than 165 animals). For the jumping models, we selected
the probability of jumping on a given trial, ρ, to be 0.05. Other values for ρ produced similar
results (assuming the value was small).
Figure 3 shows the results of analyzing the simulations of the four random walk models for
optimal foraging-like behavior in the same manner as Hills et al. (2012) performed for participants
in their experiment8. In the left column of Figure 3 is the average ratio of the IRT of an item
relative to its distance to the closest cluster switch (“order of entry”), and, the overall average IRT
for each random walk model. Like people, the first item in a cluster (indicated by “1”) has a
8We also examined “residual proximity”, finding each of the models to follow the prediction that the last word ina patch has a lower residual proximity than the first word in a patch (t(140) =−2.4, p < 0.05 for all four models).

RANDOM WALKS AND OPTIMAL FORAGING 14
significantly longer IRT than the overall average IRT (t(140)> 17, p < 0.001 for all four models),
and the second item in a cluster (indicated by “2”) has a significantly shorter IRT than the overall
average IRT (t(140)<−15, p < 0.001 for all four models).9 In addition, the IRTs for words
preceding a cluster switch (indicated by “-1”) were not signficantly different from most walkers’
long-term average IRTs.10 This pattern of results is consistent with the results of participants in
Hills et al. (2012)’s experiment, the marginal value theorem, and optimal foraging. Each time the
IRT increases dramatically (at “1”) and then decreases dramatically (at “2”), one might be
tempted to suggest that the model “found” another “patch” of relevant items in the semantic
network. However, there are no search strategies being used by the model. It is simply walking
randomly over the semantic network and emitting the labels of nodes that it visits. Thus, a simple
process over a structured representation is sufficient to capture optimal foraging-like behavior.
The right column of Figure 3 examines the marginal value theorem’s cluster-switching
policy, where the absolute difference between the pre-switch IRT and long-term average IRT was
plotted against the number of words a random walker produced along with a regression line
through this data (as in Figure 1b). Across all four models, walkers with a larger absolute
difference (indicating they either left clusters too soon or too late) produced fewer words (a linear
regression model found a significant negative relationship between axes for each of the four
models: slope = -0.19, t(137) = 2.51, p < 0.05, slope = -0.21, t(137) = 1.98, p < 0.05, slope =
-0.10, t(135) = 3.25, p < 0.05, slope = -0.09, t(137) = 2.15, p < 0.05 for the uniform
non-jumping, uniform jumping, weighted non-jumping, and weighted jumping models
respectively). Intriguingly, each of the models produces the basic phenomena taken as evidence
for the use of the marginal value theorem in memory search. These results show that behavior
consistent with following the marginal value theorem can be produced by surprisingly simple
9The introduction of jumps primarily reduces the difference for IRTs before (at “-2”) and after a cluster switch (at“2” and “3”), while increasing the amount of time it takes to find the first item in a cluster. This can be explained bythe model randomly jumping back to the cue anywhere along the search path, making it difficult to find a new animal,yet once one is found, there are more unseen animals left to find nearby.
10The IRT for words preceding cluster switches (indicated by “-1”) of 140, 138, 139, and 138 out of 141 walkerswere not significantly different for the uniform non-jumping, uniform jumping, weighted non-jumping, and weightedjumping models respectively, and all of the walkers that were significantly different had pre-switch IRT averages lessthan their long-term averages for each of the four models.

RANDOM WALKS AND OPTIMAL FORAGING 15
search algorithms, at least when measured along these metrics. In the following sections, we turn
to examining how the structure of semantic memory affects the behavior of these random walks.
The importance of clustering
Our results so far show that a random walk on a semantic network derived from free
associations produces phenomena suggestive of optimal foraging, while a random walk on a
spatial representation generated by BEAGLE (Jones & Mewhort, 2007) does not. This raises a
natural question: Why? What is the critical difference between these two representations?
To address this question, we examined whether the similarity between items in these two
representations reflects the clusters used by Troyer et al. (1997). According to the semantic
network, the similarity between the animals corresponding to nodes i and j was encoded as
si j = exp{−di j}, where di j is the shortest path distance between the nodes i and j in the semantic
network. To derive similarities from the clusters, we used an additive clustering model (Shepard
& Arabie, 1979), where the (nonexclusive) clusters from Troyer et al. (1997) were interpreted as
features. To do so, we formed a 165×165 similarity matrix S. According to additive clustering,
the similarity matrix is defined as
S = FWF′ (5)
where F is the matrix of clusters interpreted as features ( fac = 1 when animal a is in cluster c),
and W is a diagonal weight matrix, whose elements are non-negative and represent the
psychological weights of the clusters. We used the 22 animal clusters defined by Troyer et al.
(1997) to define F. We inferred W by maximizing the posterior distribution of reconstructing S
based on graph distances using additive clustering, assuming a Gaussian prior on W and Gaussian
reconstruction error (as outlined in Navarro & Griffiths, 2008).
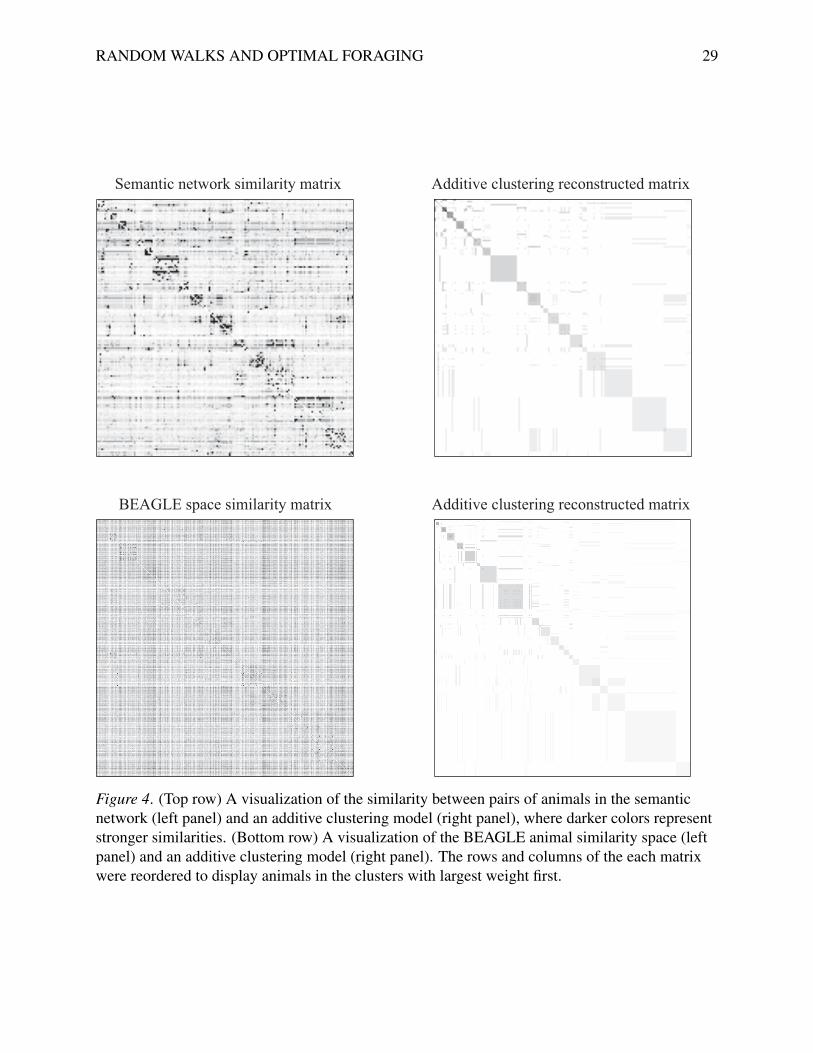
The top row of Figure 4 shows the graph-based similarity matrix and the similarity matrix
reconstructed using additive clustering. Visual inspection of the block structure in both similarity
matrices confirms that they are very similar and provides evidence that the semantic network
implicitly encodes the clusters. The distance between the nodes corresponding to animals in the

RANDOM WALKS AND OPTIMAL FORAGING 16
same cluster is smaller than the distance between animals in different clusters and the retrieval
process depends (implicitly or explicitly) on this distance. This may be why a random walk on a
semantic network can produce behavior that resembles optimal foraging.
By comparison, the representation used in the random walk evaluated by Hills et al. (2012)
does not show the same pattern of clustering. We used the same additive-clustering technique on
the similarity data from BEAGLE, examining how well the similarity data could be predicted
from the cluster membership of different animals. The bottom row of Figure 4 shows the results:
there is only a weak signature of the animal clusters in these data. Consequently, the poor
performance of this model could be a result of the underlying representation not encoding a clear
cluster structure.
These results suggest that the critical difference between these two representations may be
the extent to which they capture the cluster structure of animals. Because items that are in the
same cluster are close in the semantic network, a random walk will tend to stay within clusters
and occasionally switch between clusters, creating the illusion of a two-stage search process. To
evaluate this idea, and to demonstrate that the performance of our model does not depend on any
of the specifics of the free association data from which our semantic network was formed, we
conducted a further simulation using a minimal random walk model. In this model, we assume
that the probability of a transition from item j to item i is given by
Li j =
0 i = j
(1− p)/C j i and j are in the same cluster
p/(n−C j−1) i and j are not in the same cluster
(6)
where C j is the number of items that belong to the same cluster as item j (excluding item j) and n
is the total number of items. This model only makes use of the cluster structure, assigning a high
probability to transitions within a cluster when p is small, but uses no other information about the
items to determine the transition probabilities.
The random walk was run over the subset of 165 animals from the semantic network used

RANDOM WALKS AND OPTIMAL FORAGING 17
in our previous simulation, and p was determined by calculating the average probability of
making a transition outside a cluster in the uniform non-jumping random walk based on the word
association network. We ran 141 simulations for a total of 45 steps each, and submitted them to
the same analyses as Hills et al. (2012). The results are shown in Figure 5. The left column shows
the key phenomena associated with optimal foraging, with the first word in a patch taking
significantly longer to produce on average (t(140) = 9.49, p < 0.001), and the second word taking
much less time to produce than the long-term mean (t(140) =−11.11, p < 0.001). The right
column of Figure 5 examines consistency with the cluster-leaving policy indicated by the marginal
value theorem, where again we find that walkers with a larger absolute difference (indicating they
either left clusters too soon or too late) produced fewer words (a linear regression model found a
significant negative relationship between axes: slope = −4.88, t(132) = 4.09, p < 0.001).
The fact that this minimal model produces behavior similar to optimal foraging suggests
that random walks can mimic a two-stage search process, provided they are on a representation
that captures the underlying cluster structure. This suggests the success of the random walk
model using the semantic network based on free associations in producing behavior that
resembles optimal foraging, and the failure of the random walk using the BEAGLE representation
considered by Hills et al. (2012) may be considered a consequence in the extent to which they
capture this cluster structure.
Discussion
In this article, we examined two potential explanations for why people show optimal
foraging-like behavior when they retrieve items from semantic memory. Both explanations
produced behavior consistent with the predictions of optimal foraging, but they propose that very
different representations and processes are responsible for this behavior. Hills et al. (2012)
suggested that semantic memory is based on spatial representations and search is a dynamic
process, retrieving items from one cluster at a time and switching between clusters when the
retrieval rate falls below a threshold. We proposed an alternative explanation, where semantic

RANDOM WALKS AND OPTIMAL FORAGING 18
memory is represented by a network and search is simply a random walk on the network. In
support of this proposal, we showed that predictions consistent with the results of Hills et al.
(2012) are produced by a random walk model on a network where semantically-related items are
close together in the network.
In the remainder of the paper we discuss some of the implications of our results. In
particular, the observation that different algorithms operating on different representations can
yield similar predictions echoes previous arguments about the challenges of identifying cognitive
representations and processes (Anderson, 1978). We explore this connection and highlight some
directions for future research to try and shed light on the processes that underlie performance on
semantic fluency tasks.
Representations and algorithms
Taken together, our simulations show that the behavior in semantic fluency tasks that Hills
et al. (2012) viewed as evidence for optimal foraging is also predicted by a random walk on a
semantic network. Crucially, this behavior depends on the representation used by the random
walk model: a random walk on a semantic network produces optimal foraging behavior, but a
random walk on corresponding spatial representations does not. Consequently, it seems that there
is something special about the semantic network representation that allows the simple random
walk to appear similar to optimal foraging.
Finding that different algorithms operating on different representations can produce the
same behavior might seem surprising, but has a precedent in cognitive psychology. The mental
imagery debate (e.g., Kosslyn, 1994; Pylyshyn, 1973) depended crucially on this issue – whether
there are effective ways of identifying the algorithms and representations that human minds
employ. Anderson (1978) convincingly argued that we should not be surprised to find cases where
algorithms and representations that seem quite different nonetheless end up producing similar
behavior – such cases are the rule, rather than the exception. In fact, for a sufficiently rich set of
algorithms and representations, we can always find algorithm-representation pairs that cannot be

RANDOM WALKS AND OPTIMAL FORAGING 19
discriminated based purely on behavior.
The situation illustrated by our analyses is not necessarily as extreme as the cases that
Anderson considered, but it does illustrate one of the fundamental challenges of cognitive
psychology: possible psychological representations and mechanisms are always underdetermined
by the available behavioral data, and even behavior that seems like the signature of one
mechanism can sometimes be produced by others. In this case, further experiments may be able
to discriminate between optimal foraging and random walks, but these experiments will have to
be specifically designed to distinguish between these two accounts rather than motivated by the
predictions of one account alone.
Future Directions
Demonstrating that random walk models can produce behavior consistent with optimal
foraging in semantic fluency tasks generates some interesting directions for future research. As
mentioned in the previous section, having two competing accounts of the same phenomena
suggests that the next step in exploring semantic fluency is designing an experiment that
distinguishes between these accounts. One way to do this might be to explore the extent to which
human memory search really is strategic – offering people the opportunity to get a “hint” (say, an
example category member) might provide the way to do this, as it would be possible to examine
whether people seek hints at the moments predicted by the marginal value theorem.
An alternative approach to distinguish these models is considering whether the optimal
foraging account can also predict results that the random walk model has previously been used to
explain. One such result is the correspondence of word fluency with PageRank (Griffiths,
Steyvers, & Firl, 2007) – something that follows directly from the random walk account, but
might be more challenging to account for in terms of optimal foraging. Likewise, additional
support for optimal foraging in memory has been found which directly measures variables
associated with working memory capacity and relates them to features associated with the search
process (Hills & Pachur, 2012; Hills, Mata, Wilke, & Samanez-Larkin, 2013). Accordingly, these

RANDOM WALKS AND OPTIMAL FORAGING 20
findings provide future tests for the random walk account.
Another direction for future research is considering how these different proposals fare in
accounting for changes in semantic fluency in clinical populations. Given that conditions such as
Alzheimer’s and Parkinson’s disease differentially affect clustering and switching
(Borge-Holthoefer, Moreno, & Arenas, 2011; Johns et al., 2013; Lezak, 1995; Tröster et al., 1989;
Troyer et al., 1997, 1998), comparing what degradations to the models are needed to explain the
differential changes in different clinical populations might help to answer practical as well as
theoretical questions about human memory.
Finally, exploring some of the nuances of optimal foraging as an account for human
memory search is likely to be productive. Human foraging behavior has been examined in a few
other domains, including information foraging (Pirolli & Card, 1999) and searching for resources
in a simulated spatial environment (e.g., Cain, Vul, Clark, & Mitroff, 2012; Hutchinson, Wilke, &
Todd, 2008; Kalff, Hills, & Wiener, 2010; Wolfe, 2013). In particular, studies in simulated
environments investigate the strategies people use in multiple-target search and examine whether
searchers adapt their strategies based on the target distribution statistics. The common finding is
that people are in fact sensitive to the resource distributions of their environment, spending more
time in resource-dense patches as predicted by optimal foraging theory. However, their actual
departure times from these patches tend to be at non-optimal rates (e.g., dependent on patch
quality and not the long-term average rate of return as predicted by the marginal value theorem).
It would be interesting to see whether modifying the optimal foraging model considered by Hills
et al. (2012) to produce behavior more consistent with human search in these other domains
would increase or decrease its fit to the ata from semantic fluency tasks.
Conclusion
Identifying and retrieving information relevant to a cue is one of the basic capabilities of the
human memory system. Understanding how people solve the task of searching this vast store of
information is likely to give us insight not just into the human mind, but into how to build better

RANDOM WALKS AND OPTIMAL FORAGING 21
artificial information retrieval systems. Optimal foraging and random walks on semantic
networks offer two quite different accounts of this process – one based on an intelligent search
strategy, the other on a rich representational framework. Both algorithms also have links to other
disciplines, offering links to literatures in biology and computer science respectively. That both
accounts can produce similar behavior is surprising, but also exciting, in that it creates new
opportunities to explore these connections more deeply and develop a more complete picture of
this remarkable human capacity.
Author Note
A preliminary version of this work was presented at the Neural Information Processing
Systems conference, and a conference paper appears in the proceedings of that conference
(Abbott, Austerweil, & Griffiths, 2012). This work was supported by grants IIS-0845410 from the
National Science Foundation, FA-9550-10-1-0232 from the Air Force Office of Scientific
Research, and MURI number N00014-13-1-0341 from the Office of Naval Research.

RANDOM WALKS AND OPTIMAL FORAGING 22
References
Abbott, J. T., Austerweil, J. L., & Griffiths, T. L. (2012). Human memory search as a random
walk in a semantic network. In Advances in Neural Information Processing Systems 25 (pp.
3050–3058).
Anderson, J. R. (1972). Fran: A simulation model of free recall. Psychology of learning and
motivation, 5, 315–378.
Anderson, J. R. (1978). Arguments concerning representations for mental imagery.
Psychological Review, 85, 249–277.
Anderson, J. R. (1990). The adaptive character of thought. Hillsdale, NJ: Erlbaum.
Borge-Holthoefer, J., Moreno, Y., & Arenas, A. (2011). Modeling abnormal priming in
Alzheimer’s patients with a free association network. PloS One, 6(8), e22651.
Bousfield, W. A., & Sedgewick, C. H. W. (1944). An analysis of sequences of restricted
associative responses. Journal of General Psychology, 30, 149–165.
Cain, M. S., Vul, E., Clark, K., & Mitroff, S. R. (2012). A Bayesian optimal foraging model of
human visual search. Psychological Science, 23(9), 1047–1054.
Charnov, E. (1976). Optimal foraging, the marginal value theorem. Theoretical Population
Biology, 9(2), 129–136.
Collins, A. M., & Loftus, E. F. (1975). A spreading-activation theory of semantic processing.
Psychological Review, 82(6), 407–428.
Dougherty, M. R., Harbison, J. I., & Davelaar, E. J. (2014). Optional stopping and the termination
of memory retrieval. Current Directions in Psychological Science, 23(5), 332–337.
Goñi, J., Arrondo, G., Sepulcre, J., Martincorena, I., de Mendizábal, N. V., Corominas-Murtra, B.,
. . . Villoslada, P. (2011). The semantic organization of the animal category: evidence from
semantic verbal fluency and network theory. Cognitive Processing, 12(2), 183–196.
Goñi, J., Martincorena, I., Corominas-Murtra, B., Arrondo, G., Ardanza-Trevijano, S., &
Villoslada, P. (2010). Switcher-random-walks: A cognitive-inspired mechanism for
network exploration. International Journal of Bifurcation and Chaos, 20(3), 913–922.

RANDOM WALKS AND OPTIMAL FORAGING 23
Griffiths, T. L., Steyvers, M., & Firl, A. (2007). Google and the mind. Psychological Science,
18(12), 1069–1076.
Griffiths, T. L., Steyvers, M., & Tenenbaum, J. B. (2007). Topics in semantic representation.
Psychological Review, 114, 211–244.
Hills, T., Jones, M., & Todd, P. (2012). Optimal foraging in semantic memory. Psychological
Review, 119(2), 431–440.
Hills, T., Mata, R., Wilke, A., & Samanez-Larkin, G. R. (2013). Mechanisms of age-related
decline in memory search across the adult life span. Developmental psychology, 49(12),
2396.
Hills, T., & Pachur, T. (2012). Dynamic search and working memory in social recall. Journal of
Experimental Psychology: Learning, Memory, and Cognition, 38(1), 218–228.
Hutchinson, J., Wilke, A., & Todd, P. M. (2008). Patch leaving in humans: can a generalist adapt
its rules to dispersal of items across patches? Animal Behaviour, 75(4), 1331–1349.
Johns, B. T., Taler, V., Pisoni, D. B., Farlow, M. R., Hake, A. M., Kareken, D. A., . . . Jones, M. N.
(2013). Using cognitive models to investigate the temporal dynamics of semantic memory
impairments in the development of Alzheimer’s disease. In Proceedings of the 12th
International Conference on Cognitive Modeling.
Jones, M. N., & Mewhort, D. J. K. (2007). Representing word meaning and order information in
a composite holographic lexicon. Psychological Review, 114(1), 1–37.
Kalff, C., Hills, T., & Wiener, J. (2010). Human foraging behavior: A virtual reality investigation
on area restricted search in humans. In Proceedings of the 32nd Annual Conference of the
Cognitive Science Society (pp. 168–173).
Kosslyn, S. M. (1994). Image and brain: The resolution of the imagery debate. The MIT Press.
Lagarias, J. C., Reeds, J. A., Wright, M. H., & Wright, P. E. (1998). Convergence properties of
the Nelder-Mead simplex method in low dimensions. SIAM Journal of Optimization, 9,
112–147.
Lezak, M. (1995). Neuropsychological assessment. Oxford University Press, USA.

RANDOM WALKS AND OPTIMAL FORAGING 24
Navarro, D. J., & Griffiths, T. L. (2008). Latent features in similarity judgments: A
nonparametric Bayesian approach. Neural Computation, 20, 2597–2628.
Nelson, D., McEvoy, C., & Schreiber, T. (2004). The University of South Florida free association,
rhyme, and word fragment norms. Behavior Research Methods, 36(3), 402–407.
Pirolli, P., & Card, S. (1999). Information foraging. Psychological Review, 106(4), 643–675.
Pylyshyn, Z. W. (1973). What the mind’s eye tells the mind’s brain: A critique of mental
imagery. Psychological Bulletin, 80(1), 1–24.
Raaijmakers, J., & Shiffrin, R. (1981). Search of associative memory. Psychological Review,
88(2), 93–134.
Rhodes, T., & Turvey, M. T. (2007). Human memory retrieval as Lévy foraging. Physica A, 385,
255–260.
Romney, A. K., Brewer, D. D., & Batchelder, W. H. (1993). Predicting clustering from semantic
structure. Psychological Science, 4(1), 28–34.
Shepard, R. N., & Arabie, P. (1979). Additive clustering: Representation of similarities as
combinations of discrete overlapping properties. Psychological Review, 86(2), 87–123.
Stephens, D., & Krebs, J. (1986). Foraging theory. Princeton University Press.
Steyvers, M., Shiffrin, R., & Nelson, D. (2004). Word association spaces for predicting semantic
similarity effects in episodic memory. Experimental cognitive psychology and its
applications: Festschrift in honor of Lyle Bourne, Walter Kintsch, and Thomas Landauer,
237–249.
Steyvers, M., & Tenenbaum, J. (2005). The large-scale structure of semantic networks: Statistical
analyses and a model of semantic growth. Cognitive Science, 29(1), 41–78.
Thompson, G. W., Kello, C. T., & Montez, P. (2013). Searching semantic memory as a scale-free
network: Evidence from category recall and a wikipedia model of semantics. In
Proceedings of the 35th Annual Meeting of the Cognitive Science Society.
Thurstone, L. (1938). Primary mental abilities. Psychometric Monographs.
Tröster, A., Salmon, D., McCullough, D., & Butters, N. (1989). A comparison of the category

RANDOM WALKS AND OPTIMAL FORAGING 25
fluency deficits associated with Alzheimer’s and Huntington’s disease. Brain and
Language, 37(3), 500–513.
Troyer, A. K., Moscovitch, M., & Winocur, G. (1997). Clustering and switching as two
components of verbal fluency: Evidence from younger and older healthy adults.
Neuropsychology, 11(1), 138–146.
Troyer, A. K., Moscovitch, M., Winocur, G., Leach, L., & Freedman, M. (1998). Clustering and
switching on verbal fluency tests in Alzheimer’s and Parkinson’s disease. Journal of the
International Neuropsychological Society, 4(2), 137–143.
Tversky, A. (1977). Features of similarity. Psychological Review, 84, 327–352.
Tversky, A., & Hutchinson, J. (1986). Nearest neighbor analysis of psychological spaces.
Psychological Review, 93(1), 3–22.
Wolfe, J. M. (2013). When is it time to move to the next raspberry bush? foraging rules in human
visual search. Journal of Vision, 13(3), 1–17.

RANDOM WALKS AND OPTIMAL FORAGING 26
(a)
−2 −1 1 2 30
0.2
0.4
0.6
0.8
1
1.2
1.4
Order of entry relative to patch switch
Item
IR
T /
Av
era
ge
IRT
(b)
0 1 2 3 4 510
20
30
40
50
60
Abs(Last item IRT − Average IRT)
Nu
mb
er o
f w
ord
s p
rod
uce
d
Figure 1. Experimental results of a semantic fluency experiment (free recall from the category ofanimals) reproduced from Hills et al. (2012). (a) The mean ratio between the inter-item responsetime (IRT) for an item and the participant’s long-term average IRT over the entire task, relative tothe order of entry for the item (where “1” refers to the relative IRT between the first word in acluster and the last word in the preceding cluster). The dotted line indicates where item IRTswould be the same as the participant’s average IRT for the entire task. (b) The relationshipbetween a participant’s deviation from the marginal value theorem policy for cluster departures(horizontal-axis) and the total number of words a participant produced.

RANDOM WALKS AND OPTIMAL FORAGING 27
(a)
−2 −1 1 2 30
0.2
0.4
0.6
0.8
1
1.2
1.4
Order of entry relative to patch switch
Item
IR
T /
Aver
age
IRT
(b)
0 0.02 0.04 0.06 0.08 0.1 0.1232
34
36
38
40
42
44
Abs(Last item IRT − Average IRT)
Nu
mb
er o
f w
ord
s p
rod
uce
d
Figure 2. Results from 141 simulations of the random walk model from Hills et al. (2012),submitted to the same analyses as their human data. (a) The mean ratio between the inter-itemresponse time (IRT) for an item and the walker’s long-term average IRT over the entire task,relative to the order of entry for the item (where “1” refers to the relative IRT between the firstword in a cluster and the last word in the preceding cluster). The dotted line indicates where itemIRTs would be the same as the participant’s average IRT for the entire task. (b) The relationshipbetween a participant’s deviation from the marginal value theorem policy for cluster departures(horizontal-axis) and the total number of words a participant produced.

RANDOM WALKS AND OPTIMAL FORAGING 28
(a)
−2 −1 1 2 30
0.2
0.4
0.6
0.8
1
1.2
1.4
Order of entry relative to patch switch
Item
IR
T /
Av
era
ge
IRT
0 5 10 15 20 2520
25
30
35
40
45
Abs(Last item IRT − Average IRT)
Nu
mb
er o
f w
ord
s p
rod
uce
d
(b)
−2 −1 1 2 30
0.2
0.4
0.6
0.8
1
1.2
1.4
Order of entry relative to patch switch
Item
IR
T /
Av
era
ge
IRT
0 2 4 6 8 10 12 14 16 1830
35
40
45
50
55
60
Abs(Last item IRT − Average IRT)
Nu
mb
er o
f w
ord
s p
rod
uce
d(c)
−2 −1 1 2 30
0.2
0.4
0.6
0.8
1
1.2
1.4
Order of entry relative to patch switch
Item
IR
T /
Av
era
ge
IRT
0 10 20 30 40 50 6010
15
20
25
30
35
40
Abs(Last item IRT − Average IRT)
Nu
mb
er o
f w
ord
s p
rod
uce
d
(d)
−2 −1 1 2 30
0.2
0.4
0.6
0.8
1
1.2
1.4
Order of entry relative to patch switch
Item
IR
T /
Av
era
ge
IRT
0 5 10 15 20 25 30 3520
25
30
35
40
45
Abs(Last item IRT − Average IRT)
Nu
mb
er o
f w
ord
s p
rod
uce
d
Figure 3. Results after 141 simulations for the four random walk models: (a) the uniformtransition model with no jumps, (b) the weighted transition model with no jumps, (c) the uniformtransition model with a jump probability of 0.05, and (d) the weighted transition model with ajump probability of 0.05. The left column displays the mean ratio between the inter-item responsetime (IRT) for an item and the walker’s long-term average IRT over the entire task, relative to theorder of entry for the item (where “1” refers to the relative IRT between the first word in a clusterand the last word in the preceding cluster). The dotted line indicates where item IRTs would bethe same as the walker’s average IRT for the entire task. The right column displays therelationship between a walker’s deviation from the marginal value theorem policy for clusterdepartures (horizontal-axis) and the total number of words a walker produced.
RANDOM WALKS AND OPTIMAL FORAGING 29
Semantic network similarity matrix Additive clustering reconstructed matrix
BEAGLE space similarity matrix Additive clustering reconstructed matrix
Figure 4. (Top row) A visualization of the similarity between pairs of animals in the semanticnetwork (left panel) and an additive clustering model (right panel), where darker colors representstronger similarities. (Bottom row) A visualization of the BEAGLE animal similarity space (leftpanel) and an additive clustering model (right panel). The rows and columns of the each matrixwere reordered to display animals in the clusters with largest weight first.

RANDOM WALKS AND OPTIMAL FORAGING 30
(a)
−2 −1 1 2 30
0.2
0.4
0.6
0.8
1
1.2
1.4
Order of entry relative to patch switch
Item
IR
T /
Av
era
ge
IRT
(b)
0 0.2 0.4 0.6 0.8 1 1.2 1.428
30
32
34
36
38
40
42
Abs(Last item IRT − Average IRT)
Nu
mb
er o
f w
ord
s p
rod
uce
d
Figure 5. Results for the minimal model on our semantic network with p estimated from theuniform transition word association matrix. (a) The mean ratio between the inter-item responsetime (IRT) for an item and the walker’s long-term average IRT over the entire task, relative to theorder of entry for the item (where “1” refers to the relative IRT between the first word in a patchand the last word in the preceding patch). The dotted line indicates where item IRTs would be thesame as the walker’s average IRT for the entire task. (b) The relationship between a walker’sdeviation from the marginal value theorem policy for patch departures (horizontal-axis) and thetotal number of words a walker produced.


![BENJAMIN ABBOTT and FAMILY Son of Joseph Abbott of …1755, Benjamin Abbott paid Daniel Jones and Richard Brown as his witnesses in a jury trial. [HPB2-1:53] In March 1767, Benjamin](https://static.fdocuments.net/doc/165x107/60a77fbf36d225566e0658f3/benjamin-abbott-and-family-son-of-joseph-abbott-of-1755-benjamin-abbott-paid-daniel.jpg)

