Jones Creek
42
Jones Creek Fecal Indicator Bacteria (FIB), Genetic Markers, Chemical Indicators, and Turbidity 2019-2021 Study Summary April 6 th , 2021 Prepared by: Loxahatchee River District (LRD), WildPine Ecological Laboratory www.loxahatcheeriver.org D. Albrey Arrington (Albrey@lrecd.org), Bud Howard ([email protected]), Rachel Harris ([email protected]), Susan Noel ([email protected]) Florida Department of Environmental Protection (DEP), Division of Environmental Assessment and Restoration (DEAR) Anita Nash ([email protected]), Sarah Menz ([email protected])
Transcript of Jones Creek

Jones Creek Fecal Indicator Bacteria (FIB), Genetic Markers,
Chemical Indicators, and Turbidity 2019-2021 Study Summary
April 6th, 2021
Prepared by:
Loxahatchee River District (LRD), WildPine Ecological Laboratory www.loxahatcheeriver.org D. Albrey Arrington ([email protected]), Bud Howard ([email protected]), Rachel Harris ([email protected]), Susan Noel ([email protected])
Florida Department of Environmental Protection (DEP), Division of Environmental Assessment and Restoration (DEAR) Anita Nash ([email protected]), Sarah Menz ([email protected])

2
Abstract
This report describes a two phased special project conducted by the Loxahatchee River District (LRD) in partnership with the Florida Department of Environmental Protection (DEP). The collaborative Microbial Source Tracking (MST) –water quality study investigated the persistence (measured by % detections and median concentrations) of Fecal Indicator Bacteria (FIB), fecal bacteria associated genetic markers (human, canine, and bird), chemical indicators of human waste, and turbidity across locations and over time in an urban mangrove lined tidal creek, ‘Jones Creek’ (Jupiter, FL, USA). We were not able to attribute FIB, chemical indicators, human waste genetic markers, nor turbidity in Jones Creek to an isolated timeframe, specific location, or any singular water quality measure or event. Rather, Jones Creek appears to be suffering from pervasive poor water quality that is driven by multiple factors.
In phase I surface water samples were collected from 5–7 locations in Jones Creek during eight sampling events (Aug. 2019 to Jan. 2020). Genetic material from human waste bacteria was detected in 26–51% of the 43 total samples (with variations in detections by marker) and 33% of samples noted the presence of live bacteria (HF183 PMA) indicating a recent source of human waste. The canine marker was detected in only 7% of samples, eliminating dog feces as the dominant contributor to the high FIB concentrations frequently reported in Jones Creek. The lack of specific chemical tracers, combined with low levels of human genetic markers, and low concentrations of sucralose, coinciding with the high FIB concentrations suggests that low volumes of human waste are somehow entering into the system; possibly from a small population, such as a single home (or comparable). The consistent presence of live human waste bacteria (HF183 PMA) over time suggests that inputs are not due to an isolated spill or single discharge of human waste material. Comprehensive assessment of reclaimed water characteristics, application sites, and potential downstream impacts strongly suggest reclaimed water is not the source of high FIB or human marker detections in Jones Creek. Reclaimed water was not a source of FIB but could theoretically contribute to detectable HF-183. However, since runoff from the reclaimed water application area (nearby golf course) to Jones Creek does not regularly occur, we expect HF-183 detections are related to untreated human waste. This highlights the importance of using multiple parameters in MST to effectively evaluate various inputs into the system. Again, these results emphasize that a source of untreated human waste impacting Jones Creek needs to be identified and remediated.
In phase II, samples were collected roughly one year later from 5 locations in Jones Creek and 3 potential inputs of FIB (e.g., stormwater conflict box, stormwater outfall point, and lake/pond overflow point) into Jones Creek. FIB concentrations ranged from 4,352–7,270 enterococci per 100 mL in Jones Creek proper and markers for human waste bacteria were detected in over 60% of the 5 samples collected from Jones Creek, demonstrating the persistence of human waste. No human markers were detected in any samples collected from any of the potential stormwater outfall locations, although FIB were detected at all 3 locations (ranging from 132–1,500 enterococci per 100 mL). This suggests the assessed stormwater outfall points were not the source of human waste in Jones Creek.
Staff observations have confirmed there are currently no Onsite Sewage Treatment & Disposal Systems (OSTDS; or septic systems), active sewage spills, nor compromised sanitary sewer infrastructure (based on inspection of stormwater-sewer conflict boxes, air release valves, and other potential sources of low volumes of wastewater) in the Jones Creek area. The most likely conveyance of human waste yet to be investigated include failed privately owned sewer infrastructure, like a lateral, serving a small population (e.g., single household) or illicit discharge of human waste (e.g., homeless encampment, discharge from boat heads, blackwater from campers). A collaborative effort between local residents, LRD, TOJ, DOH, and DEP is needed to systematically identify and eliminate any remaining potential sources of FIB in Jones Creek. The next step is to investigate lateral lines carrying wastewater from homes to the regional sanitary sewer transmission system.

3
Background
Fecal Indicator Bacteria (FIB). Fecal Indicator Bacteria (FIB) are used as an indicator of the potential of human waste impacting surface waters. Environmental Protection Agency (EPA) studies from the 1980’s linked high FIB concentrations to an increase in human-born illnesses due to pathogens, specifically in younger children ingesting water, and those with open wounds and/or compromised immune systems (EPA-823-R-18-001). Though relationships between FIB concentrations and pathogens are stronger in freshwater, FIBs are used to evaluate pathogen potential in brackish water systems (Korajkic et al. 2018). Thus, high concentrations of FIB are a concern for recreational users of waterways (see EPA-823-R-18-001).
Some ambiguity exists in the application of the EPA’s FIB thresholds for recreational waterways. In Florida for brackish waters DEP suggests a monthly geometric mean of 35 enterococci per 100 mL or less when 10 or more samples (all within the same watershed/WBID) were collected in a month or just under 10% of samples may exceed a Ten Percent Threshold Value (TPTV) of 130 enterococci per 100 mL for 7.5 years (62-302.530, F.A.C). However, the State of Florida’s Department of Health (DOH) has chosen to adopt the EPA suggested Beach Action Value (BAV) of 70 or less enterococci per 100 mL for Florida beaches, where any single water sample with an enterococci value of 71 or greater will be classified as “POOR” and trigger a beach swimming advisory. LRD uses the BAV to evaluate water quality in recreational waterways since many people use brackish waterways for recreational activities and could potentially ingest water in these areas. Many residences use the creek for canoeing, kayaking, paddle boarding, fishing, boating, etc. Although swimming is not common in Jones Creek, the conservative BAV is still applied as a preventative measure to protect human health.
Genetic Markers. Scientific advancements in molecular science have facilitated more sophisticated analysis for microbial source tracking (MST), in addition to traditional FIB analysis. MST helps identify sources of fecal contamination in waterbodies and is used to distinguish between potential human and animal contamination sources using genetic markers. Each marker targets DNA from fecal bacteria derived from human or animal waste. DEP operates a molecular biology laboratory capable of quantitative polymerase chain reaction (qPCR) assays. Sample processing begins with filtration and extraction of bacterial DNA from surface water samples. Target DNA is then amplified, and the amount of specific DNA present in samples can be quantified (see https://floridadep.gov/dear/florida-dep-laboratory/content/molecular-biology). The collective results of qPCR and FIB are used to distinguish human from non-human waste, as well as the magnitude of the potential sources, and are a part of DEP’s MST approach.
Chemical Indicators. Chemical tracers are another important tool used in MST. The artificial sweetener Sucralose and pharmaceuticals such as Acetaminophen, Ibuprofen, Naproxen, and Hydrocodone are not naturally found in the environment but are commonly detected in wastewater (DEP, 2018). Ibuprofen, naproxen, and acetaminophen are widely used by humans to treat ailments, are present in human waste, and are mostly removed through wastewater treatment (Rathi et al. 2020). Sucralose, e.g., Splenda®, is popularly used as an artificial sweetener that is not easily degraded in the body or environment and is used as an indicator of human waste (treated or untreated; DEP, 2018). Since sucralose is not readily broken down, a low concentration of sucralose can indicate small volumes of wastewater, while high concentrations generally indicate a large, and/or persistent source of human waste.

4
Turbidity. In addition to high FIB concerns, the residents of Jones Creek regularly voice concerns of turbid water (see photo 1, Appendix A). Turbidity is a measure of water clarity, where particles including sediments and/or organic material (e.g., algae, flocculant bacteria or decaying matter) remain suspended in the water column. Excessive turbidity events naturally occur due to wind, waves, and tides, or can be induced due to anthropogenic activities or surface discharges, such as excess sediment/mineral or pollutant inputs upstream. Turbidity events can also be anthropogenically caused through the additions of organic or inorganic substances into the waterbody, such as washing paint brushes into storm drains, or rinsing drywall dust from wet vacs adjacent to waterways. The decrease in water clarity associated with increasing turbidity can be detrimental to organisms that require light and can even clog the gill structures of aquatic organisms causing stress. Moreover, high turbidity makes the water unappealing for recreational use.
Photo 1. Photo sent to LRD staff on June 10, 2019 courtesy of Jones Creek resident Victor ‘Vic’ Granquist.
(Additional photos Appendix A).

5
Jones Creek Jones Creek is a shallow mangrove lined tidal creek draining an area of approximately 5 km2 located in Jupiter Florida (Fig.1). The area surrounding the creek is largely residential (shown in black box, Fig. 1). Freshwater inputs into the basin typically occur from rainfall, groundwater, and stormwater runoff. The creek is subject to daily tidal inputs, with salinity variability driven by antecedent rainfall conditions and tidal variability. Salinities within Jones Creek can fall to near zero after major rainfall events and can exceed 30 psu (near ocean water salinity) during dry periods. Fig. 1B shows the impact of semi-diurnal tides on salinity within Jones Creek during a period that received approximately 2-inches of rainfall.
Figure 2. (A) Map showing Jones Creek residential area (black square) in reference to the Loxahatchee River and
Jupiter inlet. Blue dot marks the location of salinity data collected in Jones Creek (B). Inset showing location of Loxahatchee River in Jupiter, Florida. (B) Screenshot of salinity (primary y-axis, blue bars) and tidal level
(secondary y-axis, blue line) changes in Jones Creek over a 24-hour period (Aug 1st 2019–Aug2nd 2019; data can be accessed directly at https://loxahatcheeriver.org/jonescreek).
(A)
(B)

6
History of Water Quality issues in Jones Creek
Since the 1980’s water quality in Jones Creek has been a concern with export of excess nutrients and FIB from septic effluent flowing directly into the Loxahatchee River (Russel & Axon 1979). In the 1990’s Lapointe and Krupa (1995) used Coprostanol, a fecal sterol, and stable isotope analysis to confirm septic system effluent as a source of surface water contamination in Jones Creek. In 1997, LRD constructed sanitary sewer infrastructure to serve all houses adjacent to Jones Creek (i.e., ‘Jupiter River Estates’) leading to the elimination of septic systems as these homes connected to centralized sewer.
Since 2014, the LRD, in partnership with the Town of Jupiter (TOJ), has conducted extensive water quality monitoring and thoroughly explored the Jones Creek basin to attempt to identify potential source(s) of FIB and high turbidity in Jones Creek (see https://loxahatcheeriver.org/jonescreek/). This monitoring demonstrated consistently poor water quality with FIB concentrations (both enterococci and fecal coliform) routinely 20 to 80 times higher than the BAV used to issue swim advisories for recreational beaches. The high FIB concentrations often coincide with elevated turbidities and chlorophyll-a concentrations, but to date no obvious sources have been identified.
In 2014 LRD conducted two sampling events in Jones Creek at the Riverkeeper monitoring station ‘75’ and sent samples to Source Molecular, Inc. (Miami, FL) for polymerase chain reaction (PCR) tests which use genetic markers to identify the presence of bacteria from human waste. The samples indicated “trace” levels of the human marker Bacteroides dorei (HF183) during the first sampling event and no detections of human marker during the second sampling event at the same location approximately 2 months later; there were traces of a canine marker. A bird marker was detected at ‘trace’ levels on both sampling occasions. The expense of sample processing and inconsistency with limited samples halted additional genetic testing.
In 2018, after four additional years of data collection and continued high FIB concentrations, LRD enlisted the advice of FIB experts including Dr. Jody Harwood of University of South Florida (USF), Dr. Solo-Gabriele of University of Miami (UM), and Dr. Elizabeth Kelly of UM. The general conclusion was that the high FIB concentrations can be observed across many environments (see Byappanahalli et al. 2012) and could be driven by extensive decaying vegetation and debris within Jones Creek (a theory supported by the high FIB in sediments and wrack measured in Jones Creek; Harris et al. 2018). Although FIB can be present in natural environments, the experts advised revisiting MST and genetic testing before eliminating the possibility of a human source.
August 2019–January 2020 (Phase I), LRD and DEP partnered in an MST study, developed by DEP to investigate the source of bacteria in impaired waterbodies. This study used DEP’s expertise in developing MST studies, along with LRD’s water quality sampling, and DEP’s advanced laboratory analysis to further examine how FIB, genetic markers, chemical indicators, and turbidity varied by season and location. This study is reported as phase I herein.
In fall 2020 LRD conducted a follow up of the 2019-2020 study (Phase II). Surface water samples were collected on Sept 1, 2020 from 8 locations (5 in Jones Creek and 3 upstream sites that are potential conveyors of human waste material). Samples were analyzed for FIB at LRD and sent to Source Molecular, Inc. (Miami, FL) for qPCR testing for human genetic markers following DEP/EPA methodologies. This is reported as phase II herein.

7
Methods
Sampling Locations
In an attempt to monitor water quality in the region, LRD monitors FIB concentrations among other parameters in the long-term ‘Riverkeeper’ water quality monitoring program (see https://loxahatcheeriver.org/river/river-keeper/). The ‘Riverkeeper’ water quality monitoring program stations in Jones Creek are: 75 (Jones Creek at Indiantown Rd bridge), CALC (Caloosahatchee Drive Culvert), and TPJ (Toney Penna Drive Footbridge in Jones Creek).
Since 2014 LRD and TOJ have collected water quality samples at various times and locations in an attempt to document and better understand high FIB concentrations in Jones Creek. These sample locations include: 75 (Jones Creek at Indiantown Rd bridge), PLE (Pennock Lane East), TPJ (Toney Penna Drive Footbridge in Jones Creek), JCU (Jones Creek Upper), CALC (Caloosahatchee Drive Culvert), DEL (Delaware Blvd), and 208C (208 Caloosahatchee Drive) (see https://loxahatcheeriver.org/jonescreek/ for all Jones Creek monitoring data, including exact sample locations).
In phase I of the 2019–2020 MST study, specific locations in Jones Creek were regularly monitored for water quality and genetic markers from August 2019–January 2020. These locations included: 75 (Jones Creek at Indiantown Rd bridge), PLE (Pennock Lane East), TPJ (Toney Penna Drive Footbridge in Jones Creek), JCU (Jones Creek Upper), CALC (Caloosahatchee Drive Culvert), DEL (Delaware Blvd) and/or 208C (208 Caloosahatchee Drive) (Fig. 2). Sampling locations were chosen based on site accessibility and the presence of historical data. All sampling locations were within the extent of Jones Creek, however, JCU is connected to Jones Creek through a slough (Fig.2) which is only connected to the main part of the creek during high water levels. The DEL and 208C dead end creek sampling locations were added towards the end of the project due to the high FIB and genetic material detected in that portion of the creek during the study (Fig. 2). Reclaimed water is used to meet landscape irrigation demands within the Loxahatchee Club Golf Course (LCGC), and reclaimed water is pumped to and stored in an isolated lake within the LCGC (see Appendix B). On August 8th 2019 and November 20th 2019 we sampled the LCGC reclaimed water storage lake for FIB.
In phase II samples were collected approximately 1 year after the initial LRD/DEP study on September 1st 2020 (Fig. 3). Surface water samples were collected and analyzed for FIB and genetic markers. Samples were collected from TPJ, CALC, DELM, DEL, and 208C from Jones Creek Propper (Fig. 2). CALW (Caloosahatchee West/ Commerce Park Weir North), JCU and MIC (Maple Isle Colony) were sampled as areas in connection to Jones Creek that were suspected of being potential source inputs for FIB and human markers (Fig. 3). CALW is a stormwater conflict box and the only known non-tidal discharge point for the industrial park (Fig. 3). JCU is fed through culverts draining the industrial park and roadside runoff. JCU is connected to Jones Creek proper through a slough, not flooded during dry periods (Fig. 3). MIC is a concrete standing structure (>2ft) for emergency overflow of stormwater from LCGN and the surrounding stormwater lakes system during extreme high water (see Appendix B). LRD staff did not observe high flows from MIC over the course of the study although low flows from groundwater seepage and/or roadside stormwater runoff were observed.

8
Figure 2. Map of Phase I sample locations in Jones Creek; blue points show consistent sampling locations (each sampled 8 times), red points show additional sample locations (sampled only 2-3 times). Gray arrows indicate the direction of flows on an outgoing (‘ebb’) tide. Inset showing Jones Creek in reference to the Loxahatchee River in
Jupiter, Florida.

9
Figure 3. Map of Phase II sample locations in Jones Creek; red points show sample locations in Jones Creek proper, yellow points show potential stormwater outflow locations; MIC= Maple Isle/Colony, a structure with potential inputs from Loxahatchee Club’s golf course lake during extreme high water, JCU= Jones Creek Upper, culverts
draining adjacent industrial areas, roadways, and residential communities (JCU slough only connected to Jones Creek proper during sustained heavy rains), and CALW= Caloosahatchee West/Commerce Park Weir North, the
only non-tidal stormwater conflict box draining the industrial area adjacent to Jones Creek . Gray arrows indicate the direction of flows on an outgoing (‘ebb’) tide.
10
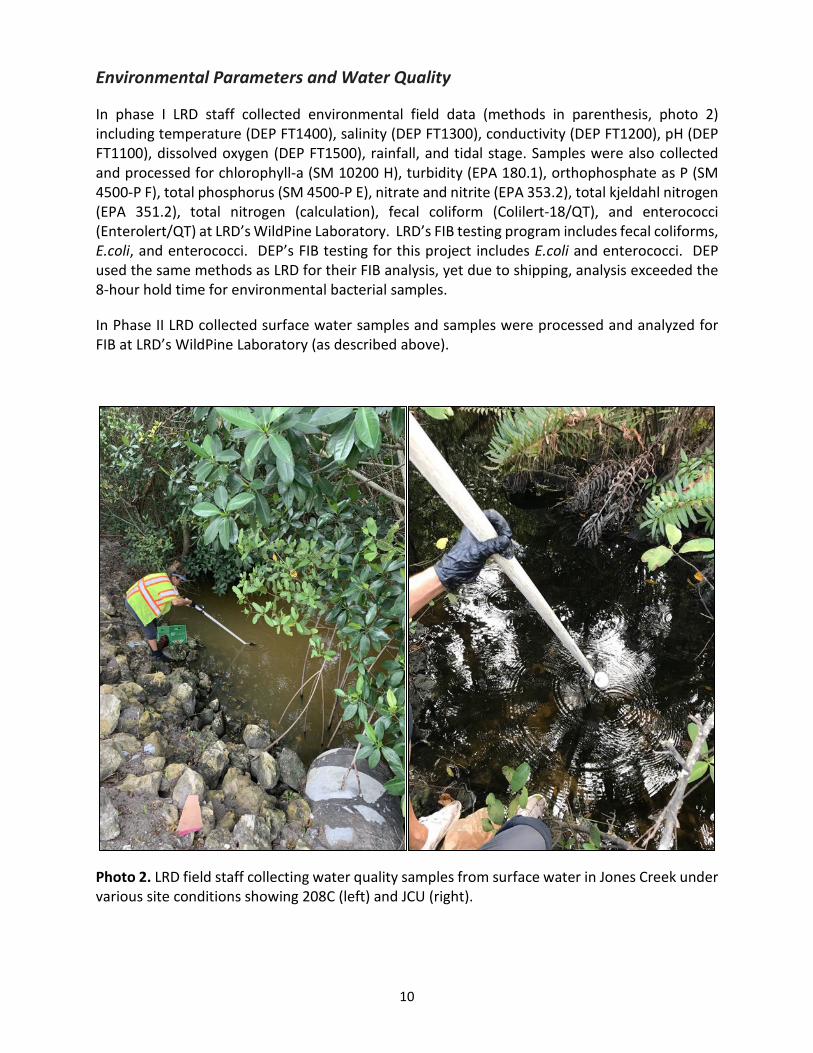
Environmental Parameters and Water Quality
In phase I LRD staff collected environmental field data (methods in parenthesis, photo 2) including temperature (DEP FT1400), salinity (DEP FT1300), conductivity (DEP FT1200), pH (DEP FT1100), dissolved oxygen (DEP FT1500), rainfall, and tidal stage. Samples were also collected and processed for chlorophyll-a (SM 10200 H), turbidity (EPA 180.1), orthophosphate as P (SM 4500-P F), total phosphorus (SM 4500-P E), nitrate and nitrite (EPA 353.2), total kjeldahl nitrogen (EPA 351.2), total nitrogen (calculation), fecal coliform (Colilert-18/QT), and enterococci (Enterolert/QT) at LRD’s WildPine Laboratory. LRD’s FIB testing program includes fecal coliforms, E.coli, and enterococci. DEP’s FIB testing for this project includes E.coli and enterococci. DEP used the same methods as LRD for their FIB analysis, yet due to shipping, analysis exceeded the 8-hour hold time for environmental bacterial samples.
In Phase II LRD collected surface water samples and samples were processed and analyzed for FIB at LRD’s WildPine Laboratory (as described above).
Photo 2. LRD field staff collecting water quality samples from surface water in Jones Creek under various site conditions showing 208C (left) and JCU (right).

11
Genetic Markers
In phase I qPCR assays were run by the DEP Molecular Biology lab in Tallahassee, Florida. qPCR is a laboratory technique used in MST studies to detect and quantify host-associated genetic markers. DEP used markers to detect DNA from bacteria that are commonly present in human and canine waste. LRD collected surface water samples (DEP-SOP-001/01) and conducted all field data documentation (DEP PROP Field Sampling Directions, Nash, 2019). All qPCR analyses were conducted by DEP at the DEP Molecular Biology Laboratory following their designated standard operating procedures (SOPs) for lab activities (https://floridadep.gov/dear/florida-dep-laboratory/content/molecular-biology).
Two human markers, HF183 and HUMM2, were used to determine if DNA from human fecal bacteria were present at the time of sampling. HF183 results are reported as genomic equivalent units per 100 mL (GEU/100 mL) and have a minimum detection limit (MDL) of 12 GEU/100 mL. The MDL can vary based on volume of sample filtered, therefore detections were determined on an individual sample basis. HUMM2 results are reported as copies per 100 mL and have an MDL of 320 copies/100 mL. The HF183 marker detects Bacteroides 16S rRNA gene targets, and the samples are treated with the chemical propidium monoazide (PMA) to differentiate between live and dead cells. This method provides two values, a measurement of the total amount of HF183 DNA and the amount of HF183 DNA coming from live bacteria (HF183 PMA). The other human marker, HUMM2, detects a Bacteroides non-16S rRNA gene target and is very specific to humans. Because these markers have different targets, sensitivities, and specificities, using both human markers together provide a broader range of detection. When both (HF183 and HUMM2) markers are detected this offers stronger evidence of a human source or, when neither are detected, more confidence that a human source is not present.
A separate marker was used to detect bacterial DNA from canine waste (reported as copies per 100mL with an MDL of 640 copies/100mL). Populations of raccoons and wading birds have been noted in this basin and can be a potential source of FIB. However, presently there is no genetic marker available to determine the presence of raccoon waste, and bird markers were not tested.
In phase II samples were sent for molecular testing and analyzed at Source Molecular, Inc. to further explore and isolate problem areas and develop potential solutions. HF183 and HUMM2 were the only genetic markers examined in phase II. Laboratory methods and reporting limits are slightly different for each lab, but in general the qPCR methodologies at Source Molecular follow DEP’s methodologies (see Appendix C).
Chemical Indicators
Humans commonly ingest chemicals, including pharmaceuticals and artificial sweeteners, that are not completely degraded during digestion and can be detected in human waste. When raw human waste, partially treated wastewater, and potentially reclaimed water is discharged into the environment, these chemicals may be measured in receiving waterbodies. Common chemicals used to indicate impacts from human waste include acetaminophen, naproxen, Ibuprofen, hydrocodone and sucralose. In Phase I, LRD collected surface water samples (DEP-SOP-001/01) and field documentation (DEP PROP Field Sampling Directions, Nash, 2019), and DEP analyzed these five indicator chemicals.

12
Data Analysis
FIB, genetic markers, chemical tracers, and turbidity were used to identify any spatial or temporal patterns related to the detection of human waste in Jones Creek. Throughout this report enterococci FIBs are compared to the BAV of less than 70 enterococci per 100 mL, used to evaluate potential human illnesses as a result of ingestion of water during recreational water use. DEP’s recommended numeric Nutrient Criteria (NNC) were used to evaluate nutrients, and although not shellfish harvesting areas, the benchmark of 800 fecal coliform per 100 mL used in class II waters for bacteriological quality was applied (see 62-302.530, F.A.C). Response measures (except turbidity) were log transformed to match the exponential growth pattern in microbes and chemical concentrations. Genetic marker and chemical tracer results are described as % detections (i.e., measures were detected in % of total samples). Detections are reported based on the laboratory’s minimum value that the lab can confidently report and laboratory ‘non detects’ were reported as the laboratory’s minimum detection limit (MDL) (i.e., no values were deleted or substituted for calculations). Correlations were conducted using the nonparametric Kendall-Tau (where tau + 0.2 ≅ Pearson’s R) which is appropriate based on the small sample size. This method of regression is based on ranks, so that no transformations were required. The strength of relationships was used to consider general patterns in the dataset. Since this dataset describes patterns and does not apply predictive models, statistical significance is not shown. Correlations were run in R (v4.0) using ‘NADA’ package (Lee, 2020).
Phase I Results
Seasonal Rainfall
Phase I sampling was designed to include both wet (April–October) and dry (November–March) seasons. Figure 4 shows rainfall throughout phase I of the study, highlighting the heavy (17 cm) rainfall that occurred during the dry season on December 28th 2019. Using the state of Florida’s WaterBody IDentification (WBID 3226C), the average rainfall was approximately 13 inches during both wet and dry seasons. This was due to a relatively dry ‘wet’ season and uncharacteristically wet ‘dry’ season. Since there was little difference in average rainfall between ‘wet’ and ‘dry’ seasons (Fig. 4) dates rather than season were included in subsequent analysis.
Figure 4. Rainfall over phase I (August 2019–January 2020) of the study in Jones Creek drainage basin (WBID
3226C). See https://loxahatcheeriver.org/river/rainfall/.
0
5
10
15
20
1-Au
g
8-Au
g
15-A
ug
22-A
ug
29-A
ug
5-Se
p
12-S
ep
19-S
ep
26-S
ep
3-O
ct
10-O
ct
17-O
ct
24-O
ct
31-O
ct
7-N
ov
14-N
ov
21-N
ov
28-N
ov
5-De
c
12-D
ec
19-D
ec
26-D
ec
2-Ja
n
9-Ja
n
Daily
rain
fall
(cm
)

13
Fecal Indicator Bacteria (FIB)
Enterococci concentrations in Jones Creek have consistently exceeded the BAV used to evaluate recreational beaches in Florida. Here, 93% of samples were above the BAV (40 BAV exceedances out of 43 samples). Figure 5A shows enterococci exceedances as a % occurrence value where exceedances commonly occurred (≥70%) at each location. Figure 5B shows the % occurrence, where enterococci exceedances consistently occurred over time (≥70%) each month of sampling. Figure 5C shows fecal coliform exceedances as a % occurrence value with exceedances at every location. Figure 5D shows the % occurrence, with exceedances during each month of sampling. Since the increased sampling efforts in Jones Creek in 2014, FIBs often exceeded the 800 fecal coliform per 100 mL set for any single sample collected in class II waters. Although not all locations in Jones Creek are considered class II waters, 50% of samples in Jones Creek were above the 800 fecal coliform per 100 mL set for any single sample citeria (28 exceedances out of 56 samples).
Figure 5. FIB exceedances based on LRD analysis in Jones creek showing the % of sample Beach Action Value (BAV) exceedance of 71 enterococci per 100 mL by (A) sample location and (B) month for enterococci FIB and % of
sample the single sample exceedance value of 800 fecal coliform per 100 mL used for class II waters by (C) sample location and (D) month for fecal coliform FIB. All sites were not sampled on all days.
Enterococci concentrations far exceeded the BAV both across locations, with median values ranging from 254–3,873 enterococci per 100mL per location (Fig. 6A), and over time with median values ranging from 512–5,363 enterococci per 100mL per sampling event (Fig. 6B). Concentrations of FIB at the Caloosahatchee Culvert (CALC) were notably highest, and FIB concentrations generally declined moving downstream (e.g., Station 75 furthest downstream site; Fig. 6A). An exception to this general pattern is JCU, which is located at the furthest upstream extent of Jones Creek, yet not definitively exchanging water with Jones Creek proper. JCU had both the lowest median enterococci concentration and the largest interquartile range (i.e., the most variable enterococci concentrations). Regardless, the middle creek segments (TPJ, CALC, DEL, and 208C) had the highest median FIB concentrations (Fig. 6A).
0
50
100
75 PLE TPJ JCU CALC 208C DEL
Ente
roco
cci
Exce
edan
ce (%
)
(A)
0
50
100
Aug Sep Oct Nov Jan
Ente
roco
cci
Exce
edan
ce (%
) (B)
0
50
100
75 PLE TPJ JCU CALC 208C DEL
Feca
l Col
iform
Ex
ceed
ance
(%) (C)
0
50
100
Aug Sep Oct Nov Jan
Feca
l Col
iform
Ex
ceed
ance
(%) (D)

14
Fecal coliform concentrations generally exceeded the criteria for class II waters both across locations, with median values ranging from 271–4,310 fecal coliform per 100mL per location (Fig. 6C), and over time with median values ranging from 548–2,359 fecal coliform per 100mL per sampling event (Fig. 6D). Similar to enterococci, fecal coliform concentrations of FIB at the Caloosahatchee Culvert (CALC) were notably highest, and FIB concentrations generally declined moving downstream (e.g., Station 75 furthest downstream site; Fig. 6A). Fecal coliform concentrations measured from the Loxahatchee Club Golf Course (LCGC) reclaimed water storage lake, the only potential source for reclaimed water in the area are shown for reference in purple (Fig. 6 C and D). Samples collected from LCGC reclaimed water were far lower than values measured in Jones Creek (Fig. 6 Cand D).
Figure 6. Boxplots showing 50% median lines, upper 75% and lower 25% boxes, and interquartile range*1.5 whiskers with outliers labeled for (A) spatial and (B) temporal variations measured in enterococci FIB
concentrations and (C) spatial and (D) temporal variations measured in fecal coliform FIB concentration; dashed red lines showing EPA’s Beach Action Value (BAV), i.e., the point at which EPA advises against recreating in surface waters 71 enterococci per 100 mL and/or DEP’s 800 fecal coliform per 100 mL single day sample criteria used for
class II waters. All sites were not sampled on all days (n=number of samples). Samples collected from the only reclaimed water lakes in the area (Loxahatchee Club Golf Course Lake (LCGC) collected on August 8th 2019 and
November 7th 2019 are shown for reference in purple.
15
Genetic Markers
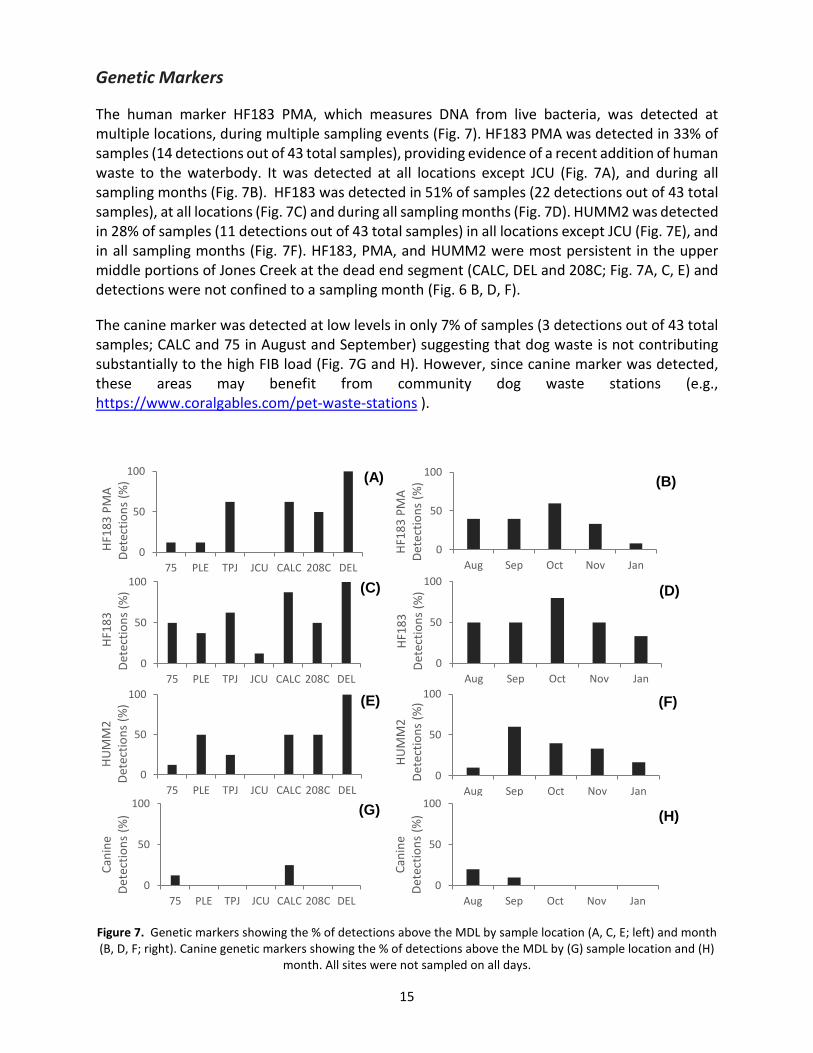
The human marker HF183 PMA, which measures DNA from live bacteria, was detected at multiple locations, during multiple sampling events (Fig. 7). HF183 PMA was detected in 33% of samples (14 detections out of 43 total samples), providing evidence of a recent addition of human waste to the waterbody. It was detected at all locations except JCU (Fig. 7A), and during all sampling months (Fig. 7B). HF183 was detected in 51% of samples (22 detections out of 43 total samples), at all locations (Fig. 7C) and during all sampling months (Fig. 7D). HUMM2 was detected in 28% of samples (11 detections out of 43 total samples) in all locations except JCU (Fig. 7E), and in all sampling months (Fig. 7F). HF183, PMA, and HUMM2 were most persistent in the upper middle portions of Jones Creek at the dead end segment (CALC, DEL and 208C; Fig. 7A, C, E) and detections were not confined to a sampling month (Fig. 6 B, D, F).
The canine marker was detected at low levels in only 7% of samples (3 detections out of 43 total samples; CALC and 75 in August and September) suggesting that dog waste is not contributing substantially to the high FIB load (Fig. 7G and H). However, since canine marker was detected, these areas may benefit from community dog waste stations (e.g., https://www.coralgables.com/pet-waste-stations ).
Figure 7. Genetic markers showing the % of detections above the MDL by sample location (A, C, E; left) and month (B, D, F; right). Canine genetic markers showing the % of detections above the MDL by (G) sample location and (H)
month. All sites were not sampled on all days.
0
50
100
75 PLE TPJ JCU CALC 208C DEL
HF18
3 PM
A De
tect
ions
(%) (A)
0
50
100
Aug Sep Oct Nov Jan
HF18
3 PM
A De
tect
ions
(%) (B)
0
50
100
75 PLE TPJ JCU CALC 208C DEL
HF18
3
Dete
ctio
ns (%
) (C)
0
50
100
Aug Sep Oct Nov Jan
HF18
3
Dete
ctio
ns (%
) (D)
0
50
100
75 PLE TPJ JCU CALC 208C DEL
HUM
M2
Dete
ctio
ns (%
) (E)
0
50
100
Aug Sep Oct Nov Jan
HUM
M2
De
tect
ions
(%) (F)
0
50
100
75 PLE TPJ JCU CALC 208C DEL
Cani
ne
Dete
ctio
ns (%
) (G)
0
50
100
Aug Sep Oct Nov Jan
Cani
ne
Dete
ctio
ns (%
) (H)

16
Chemical Indicators
Only sucralose, a sweetener found in reclaimed water, treated wastewater, and untreated human waste, was detected above DEP’s minimum laboratory detection limit of 0.01 µg/L (see https://fldeploc.dep.state.fl.us/sop) in Jones Creek. Sucralose was detected in 70% of samples and not isolated to a single location or date (Fig. 8).
Figure 8. Sucralose chemical tracer showing the % of detections above the MDL by (A) sample location and (B) month. All sites were not sampled on all days.
Although present in 70% of samples (30 detections out of 43 total samples), the levels of sucralose detected are considered low level (regardless of location or sample date, concentrations remained ≤ 2 ug/L, with median values ranging 0.05–0.5 ug/L; Fig. 9), which is typical for urban streams receiving reclaimed water used for irrigation. Despite the low levels of sucralose, the consistently higher median values at JCU (Fig. 9A and B) and lack of humanmarker detections at JCU (Fig. 7) warrants further investigation into a potential source of reclaimed water at this location.
Figure 9. Boxplots showing 50% median lines, upper 75% and lower 25% boxes, and interquartile range*1.5
whiskers with outliers labeled for (A) spatial and (B) temporal variations measured in sucralose concentrations. All sites were not sampled on all days.
0
20
40
60
80
100
75 PLE TPJ JCU CALC 208C DEL
Sucr
alos
e D
etec
tions
(%)
(A)
0
20
40
60
80
100
Aug Sep Oct Nov Jan
Sucr
alos
e D
etec
tions
(%)
(B)

17
Turbidity
Turbidity in Jones Creek ranged from 2 to 47 NTU (Fig. 10), with only one measure (47 NTU collected at DEL on 11/12/19) falling outside of the turbidity reported for pristine mangrove lakes surrounded by mangrove swamp in south Florida (2 to 33 NTU; Frankovich et al. 2017). Locations farthest upstream in the dead-end canal portions of Jones Creek (Fig. 2) CALC, DEL and 208C had the highest turbidities which seemed to match observations by staff and residents (Fig. 10A). The highest turbidities were noted in September, October, and November (Fig. 10B).
Figure 10. Boxplots showing 50% median lines, upper 75% and lower 25% boxes, and interquartile range*1.5 whiskers with outliers labeled for (A) spatial and (B) temporal variations measured in turbidity. All sites were not
sampled on all days.
Nutrients
With the exception of JCU total nitrogen concentrations from all sampling locations typically fell below FDEP’s designated Numeric Nutrient Criteria (NNC) for the corresponding river segment (1.26 mg/L total nitrogen for the southwest fork of the Loxahatchee River; Fig. 11). Again, aside from JCU, total nitrogen concentrations generally fell below the NNC (Fig. 11B). The highest total nitrogen concentrations were measured on January 13th 2020 (Fig. 11B), following the high rainfall event (Fig. 4). Total phosphorus concentrations generally exceeded the NNC for the corresponding river segment (0.075 mg/L total phosphorus for the southwest fork of the Loxahatchee River; Fig. 11). This was not unique to sample location or sampling date (Fig. 11). These nutrient concentrations suggest that JCU appears to be a source of excess nitrogen (Fig. 11A) and illustrates nitrogen inputs into the system following episodic rainfall events (Figs. 4 and 11B). The lack of distinct patterns in total phosphorus concentrations over space and time warrants further investigation into phosphorus sources in the system (Fig. 11C and D).

18
Figure 11. Boxplots showing 50% median lines, upper 75% and lower 25% boxes, and interquartile range*1.5 whiskers with outliers labeled for (A) spatial and (B) temporal variations measured in total nitrogen and for (C) spatial and (D) temporal variations measured in total phosphorus. All sites were not sampled on all days. Red
dashed line depicting FDEP’s Numeric Nutrient Criteria (NNC) of 1.26 mg/L total nitrogen for the southwest fork of the Loxahatchee River; river segment closest to Jones Creek.

19
General Patterns
To look at general patterns and relationships between environmental variables and response measures (FIB, genetic markers, chemical indicators, and turbidity) we recorded observations during each sampling event at each site. In doing so we were able to evaluate general trends in the data. It should be noted that these correlations ignore location specific responses that may be driving relationships and only describe relationships measured here (i.e., specific sites and sampling dates). Nevertheless, nonparametric ranked correlations (a method more appropriate to look for trends using presence absence data) were used to consider trends in environmental parameters and response measures over the course of this study.
Salinity (column 3, Fig. 12) and dissolved oxygen decreased (blue, negative correlations) and nutrient concentrations increased with increasing distance away from the river mouth (red, positive correlations). This is the pattern we would expect in tidally influenced systems.
The lack of consistent correlations between FIB and dissolved oxygen suggests that overall, FIB are present regardless of oxygen conditions (column 5, Fig. 12). The lack of positive correlations between temperature and FIB suggests that the presence of bacteria is not temperature dependent (column 8, Fig. 12). The positive correlation between chlorophyll-a (chl-a) and FIB suggests that phytoplankton and algae might be harboring bacteria, or that algae grow in conditions similar to FIB (column 12, Fig. 12). The positive correlation between Total Phosphorus (TP) and FIB suggests that either directly, or indirectly, increased TP may promote FIB in this area (column 19, Fig. 12). This is consistent with similar studies examining the drivers of FIB in the region (Kelly et al. 2020).
Turbidity was positively correlated with chl-a, TP, FIB, PMA and HF183 (column 20, Fig. 12). Based on what we know of primary productivity and nutrient dynamics, this suggests that TP inputs may be driving chl-a production, which in turn harbors FIB, thus increasing turbidity. The high degree of covariation between these measures warrants further investigation but cannot distinguish the sequence or causation of these events.
The chemical indicator sucralose was not correlated to FIB (column 26, Fig. 12). Sucralose was positively correlated to TN, and to a lesser extent TP, and negatively correlated to salinity (column 26, Fig. 12).
There were inconsistencies between DEP and LRD FIB data, but overall FIB measures were positively correlated. FIB was positively correlated to the human genetic marker HF183, with and without PMA treatment, providing evidence that human waste may be contributing to the high FIB. HUMM2 was not correlated with FIB or HF183 (column 25, Fig. 12). This human marker is less sensitive than HF183 and was detected in fewer samples overall.

20
Abreviations: Dist=distance to river, Cond.= conductivity, DO= dissolved oxygen, Sal.=salinity, Temp.=temperatuer, chl= uncorrected chlorophyll-a, Tub.= turbidity, NH3= ammonia, Nox=nitrate+nitrite, Org.N=orgtanic nitrogen, OP= orthophosphate, TKN= total kildajl nitrogen, TN= total nitrogen, TP= total phosphorus, Ent.=enterococci measued by LRD lab, F.Col= Fecal coliform measued by LRD lab, DEP_E.coli= E. coli measued by DEP lab, DEP_Entero.=enterococci measured measued by DEP lab, PMA= HF183 treated with propidium monoazide (PMA) to distinguish live cells, HF183= Bacteroides 16S rRNA gene, HUMM2= Bacteroides non-16S rRNA gene.
Figure 12. Kendell’s Tau rank correlation matrix of all parameters measured Aug. 2019-Jan 2020. Blue colors signify positive relationships, red colors negative. The strength of relationships are emphasized by color darkness
and shape size (stronger relationships are shown in darker colors having larger circles). Numbers highlight individual r values; statistical significance is not shown.

21
Phase II Results
Phase II revealed the continued presence/persistence of human markers in Jones Creek proper for at least one year (September 2019– September 2020). Although samples were not collected regularly over this period, the detection of human genetic markers and high FIB in Jones Creek proper in phase II suggests a persistent source of human waste. The moderate level of HF183 detections in Jones Creek proper confirms the presence of human waste, with copies of HF183 and HUMM2 both increasing from TPJ and CALC, upstream to DELM, and then DEL (Table 1). In accordance with phase I, phase II documented the highest FIB in the portion of Jones Creek from CALC to DEL/208 and that JCU (the furthest upstream site) does not appear to be contributing to the FIB issue. This suggests a source upstream, but the source is still unknown.
The known stormwater system outfalls in the area (JCU, CALW and MIC) did not reveal any indication of human genetic markers, yet enterococci FIB concentrations all surpassed levels that are a concern to human health in recreational waterways (enterococci values exceeding BAV of less than 70 per 100 mL; Table 1).
Table 1. Results of the September 1st, 2020 phase II study. Analyses conducted by Source Molecular, Inc. Non-detect values are values below the minimum laboratory reporting limit. The HF183 levels detected are considered moderate.
Water Location HF183 (copies/100mL)
HUMM2 (copies/100mL)
Enterococci (per 100 mL)
Jones Creek proper TPJ 1,290 35 4,352 Jones Creek proper CALC 1,500 35 6,488 Jones Creek proper DELM 2,830 411 5,794 Jones Creek proper DEL 7,660 750 5,172 Jones Creek proper 208C 5,910 319 7,270 potential stormwater outfall JCU Non-detect Non-detect 512 potential stormwater outfall CALW Non-detect Non-detect 132 potential stormwater outfall MIC Non-detect Non-detect 1,500

22
Conclusions
Neither FIB, chemical tracers, human waste genetic markers, nor turbidity, in Jones Creek can be attributed to an isolated timeframe, specific location, or related to any singular water quality measure (Figs. 5–12). With the exception of JCU, which is not consistently inundated enough to have connection to Jones Creek, the locations farthest upstream in the middle segment of Jones Creek (CALC, DEL, and 208C) had the highest FIB concentrations (Figs. 5 and 6), and most consistent detections of human waste genetic markers (Figs. 7A–F). This suggests a persistent source(s) of a low volume of human waste entering Jones Creek somewhere upstream towards the middle segment of the creek (CALC, DEL, and 208C). Although we detected human markers in Jones Creek, we did not detect them in any of the stormwater outfall locations that discharge directly to Jones Creek (Table 1). The lack of human genetic markers despite the high FIB concentrations in these stormwater outfalls may indicate that non-human sources of fecal bacteria from outside of the creek are contributing to high FIB in Jones Creek. While non-human related FIB and excess nutrients were observed in monitored stormwater outfalls, it is possible that these outfalls may be contributing to the high FIB concentrations in Jones Creek, there is yet an unidentified source of human waste in Jones Creek that is significantly degrading water quality and must be identified.
While HF183 PMA levels are much higher in untreated wastewater than treated effluent (i.e., ‘reclaimed water’), low-level HF183 PMA can be present in reclaimed water despite wastewater treatment. Reclaimed water is not used or applied within Jones Creek and the individual reclaimed water source in the area, Loxahatchee Club Golf Course (LCGC) lake, only overflows water into Jones Creek via Maple Isle Colony Structure (MIC) during extreme rain events (isolated to a single event in Dec 2019). The distance of the LCGC reclaimed water lake from Jones Creek (Appendix B), as well as the state’s requirements on treated wastewater and criteria used for reclaimed water, and low FIB measured at LCGC lake (Fig. 6C and D) suggests that reclaimed water is not the source of high FIB in Jones Creek.
During this study we noted positive relationships between turbidity, chlorophyll-a, total phosphorus, FIB and human genetic markers in an exploratory ranked correlation analysis (Fig. 12). This pattern matches field observations of turbidity events (LRD staff and residents) and fits in our current understanding of the relationships between FIB, nutrients and phytoplankton in South Florida. For instance, in Dubois Swimming Lagoon chlorophyll-a concentrations could be confidently predicted using a model of both total phosphorus and salinity (Kelly et al. 2020). Similarly, a combined model of total phosphorus, salinity, and sample depth was a marginally fair predictor of enterococci concentrations; and enterococci concentrations significantly differed by tidal conditions (Kelly et al. 2020). Here, samples were consistently collected on outgoing– low tides to capture the anticipated ‘worst case scenario’. In doing so, we could not evaluate differences between tidal stages. However, we did detect positive trends between turbidity, chlorophyll-a, total phosphorus, FIB and human genetic markers independent of salinity (Fig. 12), which suggests that these positive relationships occur independently of tidal cycle.
Additional work is needed to identify causal relationships and specific drivers. These findings add further evidence that the impaired water quality in Jones Creek is a localized issue, with FIB in Jones Creek derived from both human and non-human sources.
Over the course of this study, we have observed several issues that can be addressed by the public emphasizing the importance of community involvement, and community driven action required to identify sources and improve water quality in the area. At various times during the study LRD staff noticed: fish, lobster, and alligator carcasses, pet waste and waste bags, and landscape vegetation floating in the creek, along the bridges and banks of Jones Creek, and on or in storm drains. Any dead and/or decaying matter is likely to harbor bacteria and will contribute to poor water quality. We urge residents to communicate this amongst themselves and please refrain from discarding any waste into the creek or stormwater structures.

23
References
Byappanahalli MN, Nevers MB, Korajkic A, Staley ZR, Harwood VJ. 2012. Enterococci in the Environment. Microbiology and Molecular Biology Reviews. 76(4), 685-706.
httpp://doi.org/10.1128/MMBR.00023-12
Department of Environmental Protection (DEP). 2018. Assessment of Microbial Source Tracking Markers and Tracers at Wastewater Treatment Facilities in Florida.
http://publicfiles.dep.state.fl.us/dear/labs/biology/miscpubs/WWTFStudy_Final.pdf
Environmental Protection Agency (EPA) EPA-823-B-14-001. 2014 (edu.). National Beach Guidance and Required Performance Criteria for Grants.
https://www.epa.gov/sites/production/files/2014-07/documents/beach-guidance-final-2014.pdf
Environmental Protection Agency (EPA) EPA- 823-R-18-001. 2017. 2017 Five-Year Review of the 2012 Recreational Water Quality Criteria.
https://www.epa.gov/sites/production/files/2018-05/documents/2017-5year-review-rwqc.pdf
Frankovich TA, Rudnick DT, Fourqurean JW. 2017. Light attenuation in estuarine mangrove lakes. Estuarine, Coastal and Shelf Science 184:191e201. https://doi.org/10.1016/j.ecss.2016.11.015
Harris RJ, Noel S, Howard KB, Porter D, Kelly EA, Solo-Gabriele H, Arrington DA. 2018. Enterococci in wrack sediments and surface water. Coral Springs, FL. 12th International Symposium on Biogeochemistry of Wetlands Poster.
Kelly E, Gidley M, Sinigalliano C, Kumar N, Brand L, Harris RJ, Solo-Gabriele HM. 2020. Proliferation of microalgae and enterococci in the Lake Okeechobee, St. Lucie, and Loxahatchee watersheds. Water Research, 171: 115441. https://doi.org/10.1016/j.watres.2019.115441
Korajkic A, McMinn B, Harwood VJ. 2018. Relationships between Microbial Indicators and Pathogens in Recreational Water Settings. Int. J. Environ. Res. Public Health 15(12), 2842; https://doi.org/10.3390/ijerph15122842
Lapointe BE and Krupa S. 1995. Jupiter Creek septic tank/water quality investigation. Final Report. Loxahatchee River Environmental Control District, Jupiter, FL.
Lee L, 2020. ‘NADA’ package. https://cran.r-project.org/package=NADA
Nash, Anita. 2019. DEP PROP Field Sampling Directions.
Rathi BS, Kumar PS, Show PL. 2020. A review on effective removal of emerging contaminants from aquatic systems: Current trends and scope for further research. https://doi.org/10.1016/j.jhazmat.2020.124413
Russel, Axon. 1979. Septic Tank Study. Phase II. Technical Report to the Loxahatchee River Environmental Control District.
Resource for relevant research: https://www.epa.gov/water-research/research-support-and-implement-recreational-water-quality-criteria-rwqc
Loxahatchee River District (LRD) Riverkeeper data: https://loxahatcheeriver.org/river/river-keeper/

24
Appendix A. Jones Creek Photos

25
Low tide at Toney Penna Bridge (TPJ) facing southwest. February 8th 2018. photo: Rachel Harris
Low tide at undisclosed location in Jones Creek. February 9th 2018. photo: Rachel Harris
Low tide at Delaware street culvert (DEL) facing east. March 4th 2019. photo: Susan Noel

26
Low tide south of Caloosahatchee avenue bridge (CALC) facing east. March 12th 2019. photo: Vic Granquist
Low tide south of Caloosahatchee avenue bridge (CALC) facing east. April 2th 2019. photo: Vic Granquist
Low tide south of Caloosahatchee avenue bridge (CALC) facing east. June 6th 2019. photo: Vic Granquist

27
Appendix B. Stormwater Map

28
Map of stormwater lines provided by Town of Jupiter (TOJ) (orange) and Loxahatchee Club Golf Course (LCGC)’s series of stormwater collection lakes (LCGC lakes and golf course approximate area in green). Sample collection points from phase II are shown for context; Jones Creek proper (white) and potential FIB source locations (yellow).
The only source of Loxahatchee River District (LRD) supplied reclaimed water in this area is the LCGC lake (shown and labeled below in purple.) This lake is not directly connected to any of the surrounding stormwater retention lakes, nor to outfalls into Jones Creek. All the other lakes within the LCGC are a mixture of groundwater and stormwater. These lakes are interconnected via culverts with riser boards and overflow during wet weather periods ultimately discharging to Jones Creek.

29
Appendix C. Laboratory Reports

30
Florida Department of Environemtnal Protection (DEP) Division of Environmental Assessment and Restoration (DEAR) Summary Report

31
Florida Department of Environemtnal Protection (DEP) Molecular Biology Laboratory Results
Data Qualifiers: A= Value reported is the mean of two or more determinations, Q= Sample held beyond normal holding time, J = Estimated value and/or the analysis did not meet established quality control criteria, U = Material was analyzed for but not detected. The reported value is the method detection limit for the sample analyzed, I = The reported value is between the laboratory method detection limit and the laboratory practical quantitation limit.

32

33

34

35
Appendix D. Field Sheets
(site photos available upon request)
https://loxahatcheeriver-my.sharepoint.com/personal/rachel_harris_lrecd_org/_layouts/15/onedrive.aspx?id=%2Fsites%2FLRDModern%2FWildpine%20Laboratory%2FProjects%2FDEP%20Prop%20Study&listurl=https%3A%2F%2Floxahatcheeriver%2Esharepoint%2Ecom%2Fsites%2FLRDModern%2FWildpine%2
0Laboratory&sortField=Modified&isAscending=true

36

37

38

39

40

41

42
Appendix E. Concentrations of genetic markers by location (A-C) and date (D-F); DEP data 2019-2020.