Joining the Dots on Disability Services Data: Challenges and Opportunities
42
Joining the dots on disability services data: challenges and opportunities Dr Pamela Kinnear Mark Cooper-Stanbury
-
Upload
informa-australia -
Category
Health & Medicine
-
view
191 -
download
1
Transcript of Joining the Dots on Disability Services Data: Challenges and Opportunities

Joining the dots on disability services data: challenges and opportunities
Dr Pamela Kinnear
Mark Cooper-Stanbury
2
Outline
• Context
• Disability services data as we know it
– And what we know from it
• Challenges and opportunities
– Selected issues
– Discussion

CONTEXT
18/03/2013 3

4
The work of AIHW
• AIHW is the national institute for health, housing and community services data
– collection, analysis and reporting
– data development (standards and metadata)
• Work alongside ABS and other federal agencies (health performance, prevention, safety and quality, workforce)
• Work with state and territory health and community services authorities
5
The AIHW Act • Enacted in 1987
• Welfare functions added in 1992
• Statutory authority of the Australian Government
• Part of the Health and Ageing portfolio – reports to the Minster for Health

Functions under the Act
• Collect, produce and coordinate health and welfare-related information and statistics
• Develop methods…and relevant specialised statistical standards and classifications
• Publish methodological and substantive reports
• Subject to section 29, enable researchers to have access to health and welfare-related information and statistics

7
Policy context
• National Disability Agreement – Funding agreement between Australian Government and
eight state and territory governments
– Amended in July 2012 to incorporate changes implied by National Health Reform Agreement
• National Disability Strategy 2010–2020 – Broad policy
– Involves all sectors, such as health, education, employment, justice, and community services

8
Policy context (cont.)
• National Carer Strategy – Launched in 2011 – Gives effect to the principles of the Carer Recognition Act 2010. – Aims is to respond to the diverse and changing needs of carers
with appropriate services and supports
• National Disability Insurance Scheme (NDIS) – Announced by the Council of Australian Governments on 25 July
2012 – Based on individualised funding and person-centred care – Launch sites in July 2013 (a pilot of 26,000 people in selected
regions)

Why do we want to know?
• Quantify governments’ response to need for specialist disability services
– window on client needs
– window on service capacity
• Satisfy public expectation of right to know about $billion programs
• Enable comparison of jurisdictional programs in a standardised way
– AIHW role in standardising data inputs and outputs
• Assist evaluation of programs with respect to use, outcomes and costs
• [Potentially] provide information to prospective service users on available services and best performing agencies (a la MyHospitals)

10
A question
What are the 2 or 3 most important things you would like to know about disability services in Australia? (Muse on this while you attend to the next few slides, and assess what role the available data may play in giving you the answers.)

DISABILITY SERVICES DATA
18/03/2013 11

Complexity and need for integration
Now On the horizon
> 2,200 specialist agencies in one defined sector, across 9 ‘jurisdictions’
At least as many specialist agencies + an unknown number of registered providers, across three ‘sectors’
> 300,000 clients > ? 500,000 + clients
5–6 funding streams, reasonably straightforward flows
6–8 funding streams, more complex flows
Annual reporting; reasonably aggregated data
Ongoing reporting; transaction-based data; more parties
Fairly simple uses of data More complex uses of data (e.g. individual ‘budget’ tracking; actuarial analysis)

13
Disability services data
• Provides information on specialist disability services
• Collection funded by Australian Government and state and territory governments
• Partnership between AIHW and Disability Policy and Research Working Group
• Latest report released in 2012 with 2010–11 data

Who • Clients of services provided under
NDA • Service providers covered by NDA
When • Service transactions day-to-day • Annual cycle of reporting
What • Services provided • Services received • [Estimate of] unmet need
Where • Service outlets (= specific type of
service from a service provider in a specific location)
Why • Performance reporting under COAG
agreements • General public accountability
How • National Minimum Data Set • AIHW Act to protect personal
information • [Opportunity for] data integration
service
Key parameters

15
Gist of the NMDS

16
Service users Services received Service type outlets
Demographics (sex, DOB, Indigenous status, postcode, interpreter services required, communication method living arrangements, residential setting, primary disability, other disabilities)
Service dates: • start date • last and exit dates • main reason of
cessation of services
• service type • geographic location • agency sector • funding jurisdiction
Support needs information (9 life areas)
Hours of service received (reference and typical week)
Hours, days and weeks of operation
Informal carer information (existence, status, relationship, age)
Staff hours (paid, unpaid, reference week, typical week)
Main source of income, receipt of carer allowance (child), individualised funding status, labour force status
Number of service users

17
Who provides disability services?
• Data usually collected by 2,238 agencies operating under the National Disability Agreement
• Agencies manage 13,833 service type outlets • Agencies funded by:
– Australian Government 28% – State/territory governments 72%
• Majority (82%) of service providers were in the non-government sector – majority of these (86%) were income tax exempt charities

18
What services are provided?
0 10 20 30 40 50
Respite
Accommodation support
Community access
Employment
Community support
Per cent

19
Who uses disability services?
• 314,300 people, accessing 528,100 ‘services’
– Average of 1.7 services each
• Median age 33
• 59% men
• 6% Aboriginal or Torres Strait Islander people
• 63% lived in major cities
20
Who uses disability services (cont)?
• Main primary disability:
- 30% intellectual
- 20% psychiatric
- 17% physical
• 44% had an informal carer

What types of assistance are needed?
0% 20% 40% 60% 80%
Mobility
Domestic life
Self-care
Working
Communication
Education
Interpersonal
Learning
Community life
Always need help Sometimes need help

22
Changes over time
• Since 2009–10:
- 7% increase in number of service users
• Since 2005–06:
- 45% increase in number of service users
- 75% increase in employment services
- 108% increase in number of service users without an informal carer
23
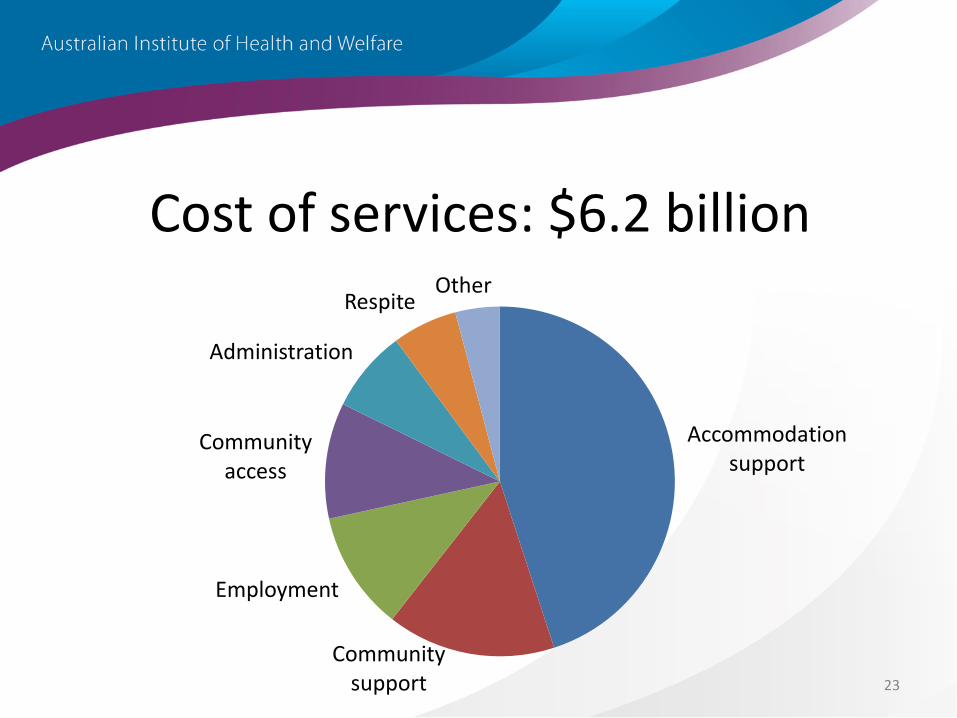
Cost of services: $6.2 billion
Accommodation support
Community support
Employment
Community access
Administration
Respite Other

What is the end product?

What is the end product?

What is the end product?

27
Services data redevelopment
• Current services collection been operating with little change for several years
• Concerns that it is not providing the data necessary to
– support the National Disability Strategy
– support a National Disability Insurance Scheme
• A redevelopment plan started in 2011
28
Services data redevelopment (cont.)
• First stage is ‘disability data dictionary’: definitions and data standards to support a revised collection
– cover some new content
– provide formal metadata for existing collection
– pave the way for a new collection
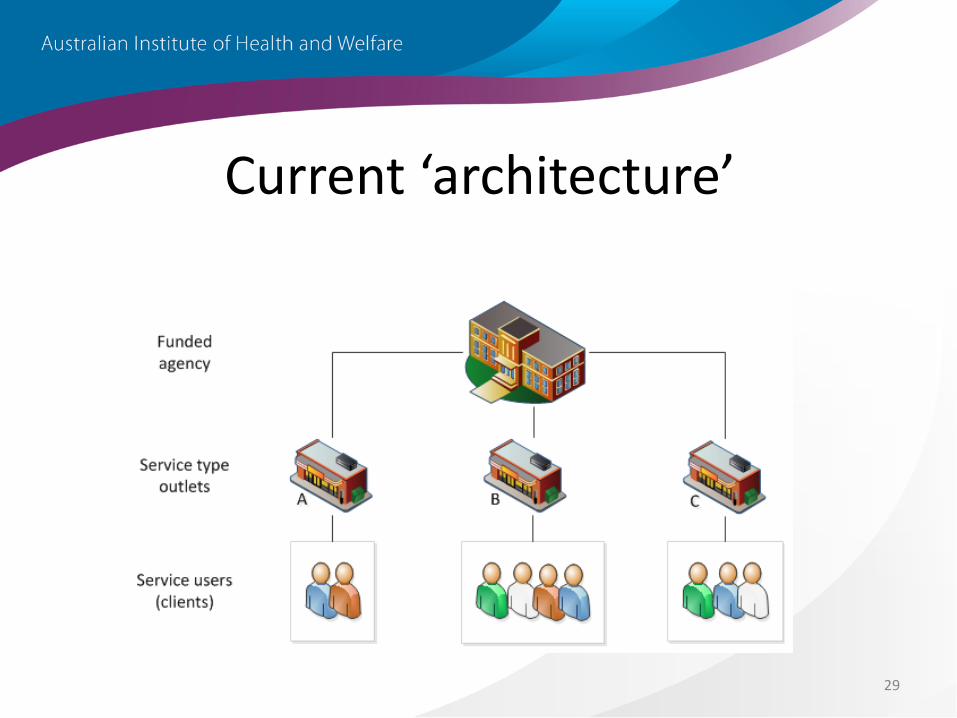
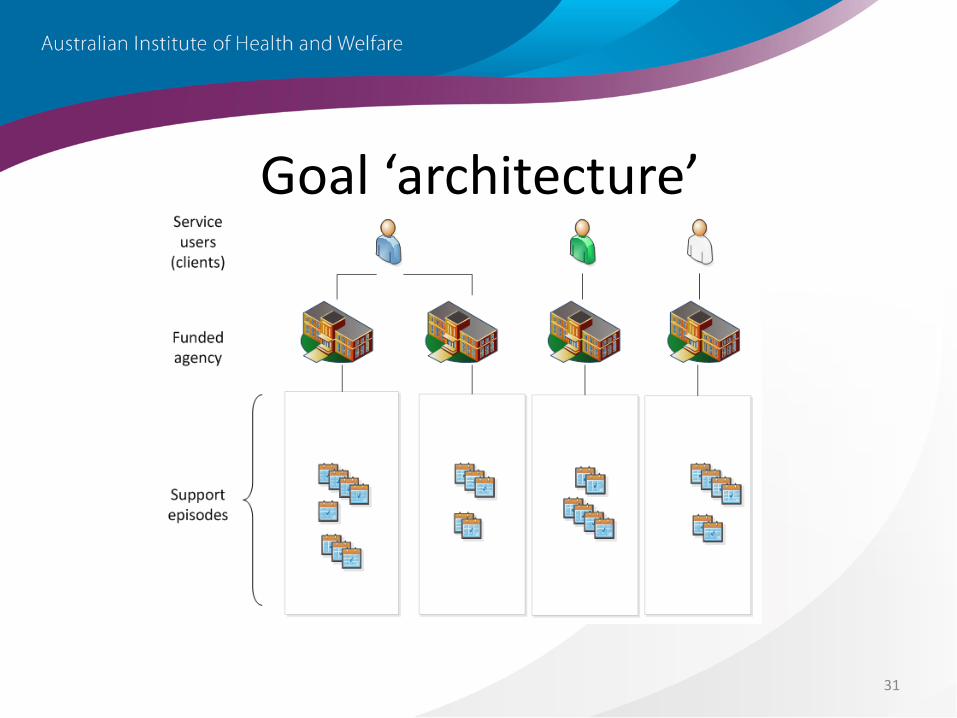
• Some thinking about a revised data architecture
29
Current ‘architecture’

30
Goal ‘architecture’
31
Goal ‘architecture’

CHALLENGES AND OPPORTUNITIES
18/03/2013 32

33
Challenges—outline
• No universal identifier in data systems
• Gaps in services and survey data
• Complexity of data with NDIS roll-out
34
No universal identifier in data systems
• But widespread use of SLK 581 statistical linkage key
• enables AIHW to stitch together episodes for same SLK across agencies and across years
– way of counting people and not episodes
• not perfect, for example, by looking for new SLKs each year we estimated 80,000 new users in the DS NMDS

35
Gaps in services data
• Outcomes
– Functioning and health
– Client/carer experience with services
• Cultural and language diversity
• Carer arrangements

36
NDIS complexity
• Scheme participants – Support plan
– Individual budget
• NDIS data system largely transactional
• Big advantage will be a centralised client record
• Challenge (and opportunity) is extracting data for statistical uses, and lining these data up with other data

37
Challenge with joining up the data

FEEDBACK AND DISCUSSION
18/03/2013 38
39
Questions for table discussion
• What are the 2 or 3 most important things you would like to know about disability services in Australia?
• What is your top recommendation for ‘joining the dots’ to obtain that information?

40
Feedback and general discussion

41
Contacts
Dr Pamela Kinnear [email protected] Ph 02 6249 5096
Mark Cooper-Stanbury [email protected] Ph 02 6244 1251
Liz Clout [email protected] Ph 02 6244 1208

42
www.aihw.gov.au