John Furlow: USAID's approach to adaptation
25
USAID’s Approach to Adaptation High Mountain and Glacier Watershed Program July 15, 2013 John Furlow, Global Climate Change Office USAID
-
Upload
harlin-media -
Category
Documents
-
view
228 -
download
1
description
Slides to John Furlow's presentation to HiMAP in Huaraz, Peru on 15 July 2013.
Transcript of John Furlow: USAID's approach to adaptation

USAID’s Approach to Adaptation
High Mountain and Glacier Watershed Program
July 15, 2013
John Furlow, Global Climate Change Office
USAID

USAID’s Climate and Development Strategy
•Mitigation •Adaptation •Integration across Agency activities
Adaptation emphasizes:• Highly vulnerable
countries• Ability or willingness to
respond• LDCS, SIDS, Glacier-
dependent countries

Weather, Climate, and Economics
• Developing country economies concentrated in climate sensitive sectors
• ~70% of developing country populations derive income from agriculture
-80
-60
-40
-20
0
20
40
60
80
1982
1983
1984
1985
1986
1987
1988
1989
1990
1991
1992
1993
1994
1995
1996
1997
1998
1999
2000
year
perc
enta
ge
-30
-25
-20
-15
-10
-5
0
5
10
15
20
25
rainfall variation around the meanGDP growthAg GDP growth
Ethiopia: Rainfall, GDP and Agric. GDP
World Bank
-80
-60
-40
-20
0
20
40
60
80
1982
1983
1984
1985
1986
1987
1988
1989
1990
1991
1992
1993
1994
1995
1996
1997
1998
1999
2000
year
perc
enta
ge
-30
-25
-20
-15
-10
-5
0
5
10
15
20
25
rainfall variation around the meanGDP growthAg GDP growth
Ethiopia: Rainfall, GDP and Agric. GDP
-80
-60
-40
-20
0
20
40
60
80
1982
1983
1984
1985
1986
1987
1988
1989
1990
1991
1992
1993
1994
1995
1996
1997
1998
1999
2000
year
perc
enta
ge
-30
-25
-20
-15
-10
-5
0
5
10
15
20
25
rainfall variation around the meanGDP growthAg GDP growth
Ethiopia: Rainfall, GDP and Agric. GDP
World Bank
Ethiopia: Rainfall, GDP and Agric. GDP
-80
-60
-40
-20
0
20
40
60
80
1982
1983
1984
1985
1986
1987
1988
1989
1990
1991
1992
1993
1994
1995
1996
1997
1998
1999
2000
year
perc
enta
ge
-30
-25
-20
-15
-10
-5
0
5
10
15
20
25
rainfall variation around the meanGDP growthAg GDP growth
Ethiopia: Rainfall, GDP and Agric. GDP
World Bank
-80
-60
-40
-20
0
20
40
60
80
1982
1983
1984
1985
1986
1987
1988
1989
1990
1991
1992
1993
1994
1995
1996
1997
1998
1999
2000
year
perc
enta
ge
-30
-25
-20
-15
-10
-5
0
5
10
15
20
25
rainfall variation around the meanGDP growthAg GDP growth
Ethiopia: Rainfall, GDP and Agric. GDP
-80
-60
-40
-20
0
20
40
60
80
1982
1983
1984
1985
1986
1987
1988
1989
1990
1991
1992
1993
1994
1995
1996
1997
1998
1999
2000
year
perc
enta
ge
-30
-25
-20
-15
-10
-5
0
5
10
15
20
25
rainfall variation around the meanGDP growthAg GDP growth
Ethiopia: Rainfall, GDP and Agric. GDP
World Bank
Ethiopia: Rainfall, GDP and Agric. GDPEthiopia: Rainfall, Ag GDP,
GDP Growth

Adaptation Programs
Aim to reduce vulnerability in key development sectors
• Build access and capacity to apply scientific information
• Improve Governance
• Implement programs to build resilience.

TodayVulnerable economy:
• Climate-sensitive economic activities
• Uneven growth, income distribution
• Weak governance
• Missing incentives and policies
2050Resilient Economy:
• Diversified economy
• More equitable, income distribution
• Safety from climate-related disasters
• Adequate, clean energy
GCC Adaptation Inputs
Governance capacity
Information communication
and use
Planning and design
Climate-resilient growth
Low emissions development
New technologies Improved
market conditions
Strategic financing
GCC Mitigation Inputs
Low Carbon, Climate Resilient Growth
Agriculture, resource managementEconomic and social developmentEducation, infrastructure, etc.

USAID’s Mainstreaming Approach
Resi
lienc
e Im
prov
ed
Development objectives
Requirements for development objectivesInputs
Enabling environment
Stressors/Constraints/ImpedimentsClimate
Non-climate
SolutionsAdaptation actions to reduce climate stresses
Actions to reduce non-climate stressesActions with co-benefits
Prob
lem
For
mul
atio
n an
d Pr
ogra
m D
esig
n

USAID’s Mainstreaming Approach: Food Security
Resi
lienc
e Im
prov
ed
Development objectives: Food Security
Requirements for development objectivesInputs: seeds, land, water, fertilizer, labor, credit, savings, transport, markets, public health, etc.Enabling environment: Effective governance, stable society, land tenure, price incentives, etc.
Stressors/Constraints/ImpedimentsClimate – Extreme rainfall events, higher temps, drought, delayed rains Non-climate – Poor sanitation, rapid population growth, infectious disease, perverse incentives, poor infrastructure, risk aversion, post harvest losses
SolutionsAdaptation actions to reduce climate stresses – e.g., access to tailored climate forecasts, seeds, water harvesting, irrigation, credit, insurance, etc.Actions to reduce non-climate stresses – WASH, health programs, better storage, etc
Prob
lem
For
mul
atio
n an
d Pr
ogra
m D
esig
n

Matching Information with Decisions
• What is important to stakeholders?• What decisions are being made?• Which can you influence?• What is the timeframe of the decision?• What information would inform a better decision?

Giannini et al., 2007
Global level Uncertainties are Large; Regional level are larger(Individual Model Runs and Averages)
East Africa

Key Opportunities/Demands: Climate Change
Limitations of “traditional” climate change scenarios
• Uncertainties
• Double Conflict of Scales (too course, too far in the future)
• Trends (“Climate Change”) Explain Relatively Small Proportion of Total Variability
Walter Baethgen, IRI

Pick 15 years randomly
Mean Monthly Rainfall in SW Uruguay (1910 – 2010)
Walter Baethgen, IRI

SW Uruguay: Monthly Precipitation (15 Randomly Selected Years)
0
50
100
150
200
250
300
350
0 1 2 3 4 5 6 7 8 9 10 11 12Month
Prec
ipita
tion
(mm
)
Walter Baethgen, IRI

None of the years behaves like the long term mean
Probability of a year being “Average” = ZERO
Can we do better?• Seasonal Climate Forecasts• Understand Historical Variability / associated risks• Study possible characteristics of Future Climate• Link it to Decision Systems
Still, Planning/Decisions are often based on “AVERAGE” year
Walter Baethgen, IRI
Our Approach to Climate Risk Management: Manage the Entire Range of RISKS
Walter Baethgen, IRI
Climate related Outcome (e.g., food production)
Pro
babi
lity
(Den
sity
)

Climate related Outcome (e.g., food production)
Pro
babi
lity
(Den
sity
)
Ag Production Systems,Water Management,are designed to avoid this
HARDSHIPe.g., Drought
CRISISe.g., Mitch
Our Approach to Climate Risk Management: Manage the Entire Range of RISKS
Walter Baethgen, IRI

CRISISe.g., Mitch
HARDSHIPe.g., Drought
Pro
babi
lity
(Den
sity
)
Climate related Outcome (e.g., food production)
Ag Production Systems,Water Management,are designed to avoid this
Also CriticalFor
Development:Risk aversion reduces Technology Adoption
Effect on Natural Resources
“Poverty Traps”
MISSEDOPPORTUNITIES
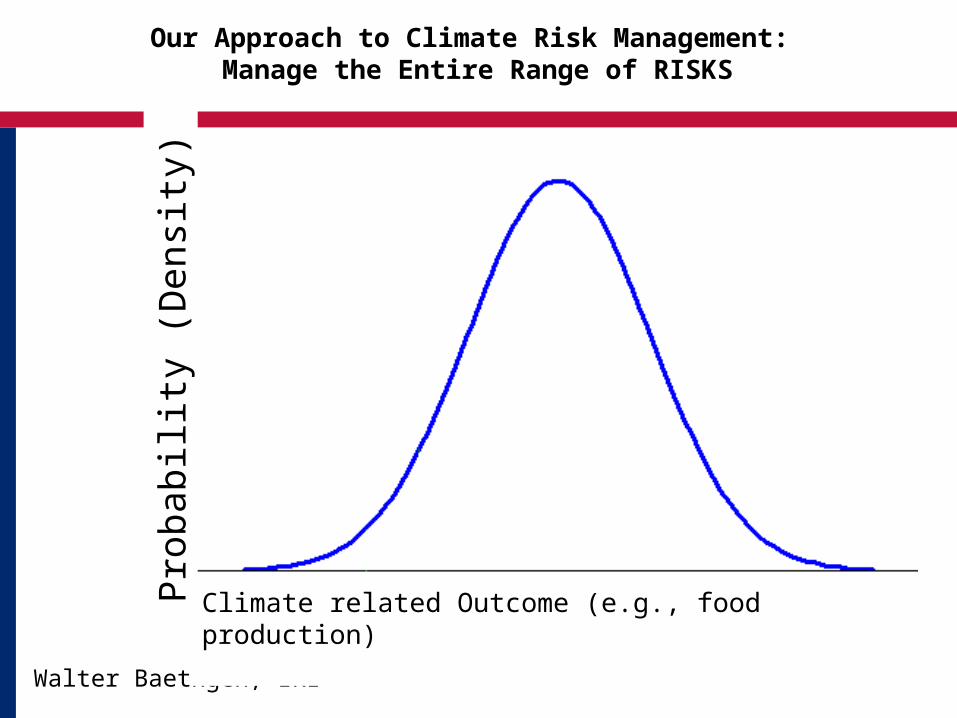
Our Approach to Climate Risk Management: Manage the Entire Range of RISKS
Walter Baethgen, IRI
CRISISe.g., Mitch
HARDSHIPe.g., Drought
Pro
babi
lity
(Den
sity
)
Climate related Outcome (e.g., food production)
Cover this to be able to take advantage of this
INDEX INSURANCE
Insurance that does not aim to Compensate Damagebut to Take Advantageof Opportunities
Our Approach to Climate Risk Management: Manage the Entire Range of RISKS

Jamaica’s Vision for Development

Impact on Fisheries
• Healthy and Stable Population• World Class Education• Social Protection• Stable Macro Economy• Enabling Business Environment• Strong Economic Infrastructure• Energy Security• Competitive Industries• Sustainable Management of Resources• Hazard Risk Reduction and Adaptation• Sustainable Urban and Rural Development
CLIMATE SENSITIVE ELEMENTS OF JAMAICA’S VISION 2030

Dia
gnos
e pr
oble
ms
Vision 2030 Economic drivers / Development objectivesFood Security, Economic Growth, Tourism, Health
Requirements for development objectives Inputs – Agricultural systems, fisheries, markets, natural environment, fresh water, energy, transport systems, laborEssential conditions – Safety, governance, policy, financing, public awareness
Stressors/Constraints/Impediments Climate – Natural disasters, changes in rainfall, temperature, sea level rise Non-climate – Demographic pressure, pollution, corruption, chronic poverty, conflict
Solutions Adaptation actions to reduce climate stresses – Strengthen Weather/Climate Services, Improved early warnings, capacity building, public awareness, better natural resources management, financial servicesActions to reduce non-climate stresses – Policy measures to address pollution
Des
ign
Improve R
esilienceADDRESSING CLIMATE STRESS IN DEV. PROGRAMS

EXAMPLES FROM THE JAMAICA PROCESS

Internationally Competitive Industry
Structures(Vision 2030 Outcome)
Tourism(Sector)
Labor(Input)
Security/safety(Enabling condition)
Beaches(Input)
Coral reefs (Input)
Reliable transportation
(Enabling condition)
Lack of access to training
FloodingSea level rise
Greater rainfall
intensity
Warmer temps
Sea level rise
Reliable electricity supply
(Enabling condition)
Tropical storms Warmer
temps
Pollution
Pollution
Fuel costs
Energy costs
EXAMPLE FROM THE JAMAICA PROCESS: TOURISM

Beach nourishment
Share lessons learned
Update zoning regulations &
building codes
Enforce existing laws & regulations
Beaches(Input)
Artificial reefs
Restore coastal
vegetation
Improve coastal
resources management
Update engineering and design standards
Raise public awareness
Train developers & contractors in more resilient approaches
Policies to complement
on-the-ground actions
FloodingSea level
rise
Pollution
Analyze & disseminate weather &
climate info.
EXAMPLE FROM THE JAMAICA PROCESS: TOURISM
Sea walls, groins, other
manmade beach
defenses

Climate Services: Jamaica Ag Extension and Met Service
• Seasonal predictions of rainfall and drought conditions. – New systems for predicting drought conditions, based on the
Standardized Precipitation Index– Additional work forecasting of soil moisture conditions
• Improving communication of agricultural climate risk management practices
• Climate services implementation in three target agricultural sites: – SW St. Elizabeth, – Manchester/Christiana, – Guy’s Hill

Thank You
• USAID Climate Page– http://www.usaid.gov/climate
• Adaptation Partnership– http://www.adaptationpartnership.org/
• Climate Services Partnership– http://climate-services.org/node