John F. Brock Nik Jhangiani - Coca-Cola...
50
John F. Brock CHAIRMAN & CEO Nik Jhangiani SVP & CFO
-
Upload
truongkiet -
Category
Documents
-
view
214 -
download
0
Transcript of John F. Brock Nik Jhangiani - Coca-Cola...

John F. Brock CHAIRMAN & CEO
Nik Jhangiani SVP & CFO

As always, these expectations are based on currently available competitive, financial, and
economic data along with our current operating plans and are subject to risks and
uncertainties that could cause actual results to differ materially from the results
contemplated by the forward-looking statements.
The forward-looking statements in this presentation should be read in conjunction with
the risks and uncertainties discussed in our filings with the Securities and Exchange
Commission (“SEC”), including our most recent Form 10-K and other SEC filings.
2
Included in this presentation are forward-looking management comments and other statements that reflect management’s current outlook for future periods.

3
SOLID FOUNDATION
OPPORTUNITY FOR GROWTH
SHAREOWNER VALUE
CRS AND KEY TAKEAWAYS

$8.2 billion net sales
30 billion servings annually to 170 million consumers
17 production facilities
~11,750 employees
10-K 2013 4
Preeminent Western European bottler

5
Be the best beverage sales and customer service company Vision
#1 or strong #2 in every category we compete
Strategic Priorities
Our customers’ most valued supplier
A winning and inclusive culture
Drive consistent long-term profitable growth

Managing the levers of our business to drive consistent long-term profitable growth and deliver shareowner value
Non-alcoholic ready-to-drink (NARTD); Canadean FY12 (most recent available), excludes tap/bulk water & dairy; AC Nielsen FY13; rounded 6
~$180B of annual retail value - Beverage Market ~$65B of annual retail value - NARTD
Large And Growing Category
#1 in value & volume share in NARTD and Sparkling
Successful Position

7
SOLID FOUNDATION
OPPORTUNITY FOR GROWTH
SHAREOWNER VALUE
CRS AND KEY TAKEAWAYS

~$38B
~$27B
~$115B
~$180B Beverage Market (Retail Value)
NARTD – Non-measured1
NARTD – Measured2
Hot Tea/Coffee, All Alcohol, Dilutables1
1. Canadean FY12 (most recent available), excludes tap/bulk water & dairy, rounded 2. AC Nielsen FY13, rounded
8
~$27B NARTD - Measured (Retail Value)
+3% +4.5%
2013 Growth2
v.
20
12
3 Y
r C
AG
R

FMCG Sector Ranking
AC Nielsen FY13 (Strategic Planner); Rankings based on most recent available data (excludes tobacco)
2013 NARTD
#1 #2 Value $B Value % Growth
NARTD Charcuterie 27.3 2.9
Charcuterie NARTD 10.3 4.2
NARTD Charcuterie 8.7 0.8
NARTD Beer 2.5 0.1
NARTD Beer 2.2 2.2
NARTD Charcuterie 2.0 7.7
NARTD Beer 1.6 6.0
9

1: The Coca-Cola Company (TCCC ) beverages based on eight fluid ounce servings 2: CCE internal reports 3: AC Nielsen FY13
CCE2 180
207
140
324
254
173
137
#1 in NARTD & Sparkling in value & volume in every territory
Grew value & volume share in NARTD category
Grew value & volume share in Sparkling segment
TCCC Per Caps1 2013 CCE 2013 Performance3
10

1. AC Nielsen FY13 2. 10-K 2013 11
Sparkling: grow segment
Still: selectively grow value share
Category & CCE Mix Segment Strategy
43%
18% 3%
22%
36%
10%
35% 46%
87%
NARTD VOLUME NARTD VALUE CCE VOLUME 2 1 1
Sparkling Still Water
CCE participates in high value segments
12
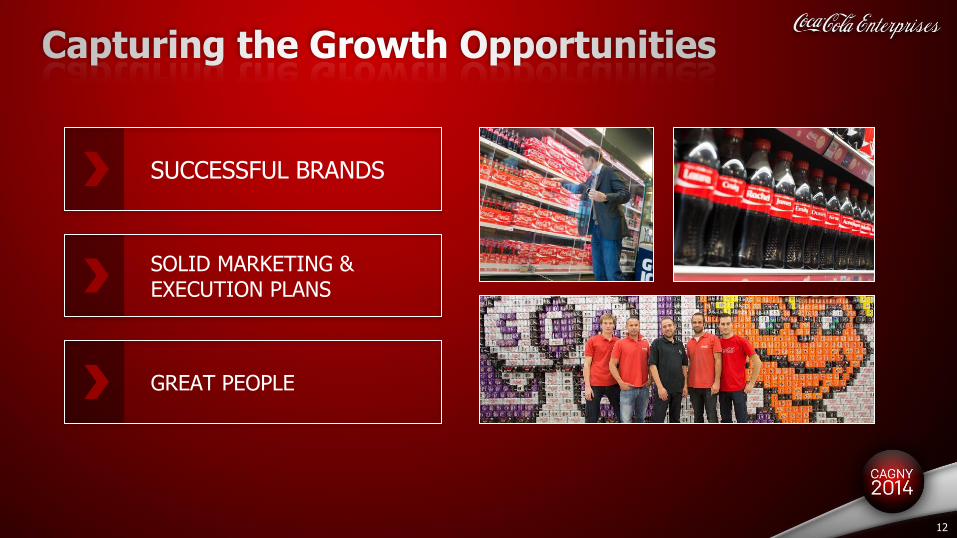
SUCCESSFUL BRANDS
SOLID MARKETING & EXECUTION PLANS
GREAT PEOPLE

10-K 2013 13
69% Volume
Coca-Cola Trademark
18% Volume
Sparkling Flavors
& Energy
13% Volume
Stills

CCE internal reports 14
2013 Growth +15%
2014 Highlights
Accelerate Coke Zero – ‘Just Add Zero’ campaign
Enhance ‘Share A Coke’ campaign
Package innovation
Win in digital
#1 in volume and value cola share in every territory

15

16
Sweetener innovation – Stevia
Package innovation
Schweppes relaunch in Great Britain
2014 Innovation/Activation
New adult sparkling non-alcoholic beverage
Low calorie
Preservative free
With lemon juice
Fully integrated marketing
Finley - France

17
New flavors (Relentless Cherry & Burn lemon ICE)
Sweetener options (Relentless sugar free reformulation)
Brand Expansion & Innovation

18
Package innovation (Nestea proprietary bottles, multipacks)
Sweetener options (Nestea Stevia)
New flavors (Minute Maid, Nestea, Powerade Worldcup, Mer)

19
250ml Can
1L Contour PET
1.25L Contour PET
4 x 1.5L Multipacks
1.75L Contour PET
Drive Recruitment Compete More Effectively
Boost Frequency
Create Value

20
Enhanced
Jan. Dec.
World Cup
Trophy Tour
Recruitment Pack / Music “COKE WITH MEALS”
Always “on”

21
Pre-tourney excitement:
Trophy tour
Ticket giveaways
In-store activation
Special edition packages
TV commercials
Digital
Active living promotions
2013: 350M social media impressions
2014: enhanced on-line programming and more names
‘Share A Coke’ Campaign World Cup

22

Pan European scale supported with global procurement capability
Flexible & efficient logistics & distribution
Cost efficient production & expandable infrastructure
Responsible & sustainable
23
Procurement, Production, and Logistics Excellence

Flexibility to execute wide-scale customized programs
Norway: new package and route to market
Improving production efficiency & effectiveness
Expanding package, pack, and pallet flexibility
External recognition for manufacturing sustainability
24

GREAT BRITAIN
FRANCE
BELGIUM
NETHERLANDS
#1
#2
#1
#1
10 years in a row
Up from #5 in 2008
4 years in a row
4 years in a row
2013 Advantage Group survey
Most Valued FMCG Supplier
25

Standardizing (e.g. channel-focused Sales and Marketing organization)
Centralizing (e.g. shared services center)
Improving (e.g. cold-drink equipment service activities)
26
Business Transformation Program (BTP)
Improving our operating model for driving sustainable future growth

27
Standardize sales and marketing structures
Step-change sales force effectiveness
Enhance core capabilities
Sales Force Realignment
Created shared services center
Improved processes
More effective customer service
Reduced cost
Centralization of Transaction Processing
Continued focus on organizational effectiveness and efficiency

28
2013 % Growth Category CCE
NARTD +7.7 +10.1
Sparkling +9.7 +11.6
CCE awarded ‘NorgesGruppen Environmental Award for 2012’ as a result of
bold move of changing delivery and pack-type
Unlocking category value
New Route-to-Market and New Packaging
Customer Recognition
Results have exceeded expectations
AC Nielsen FY13

Experienced management team
Solid bench strength
Investing in capabilities
29
Attract, develop, and retain a highly talented and diverse workforce

30
SOLID FOUNDATION
OPPORTUNITY FOR GROWTH
SHAREOWNER VALUE
CRS AND KEY TAKEAWAYS

CONSISTENT earnings in line with our
long-term objectives
MAXIMIZE free cash flow (FCF) and
maintain financial flexibility
INCREASE return on invested capital
and drive shareowner value
DRIVE CONSISTENT LONG-TERM PROFITABLE GROWTH
31

32
Grow profitably while investing CapEx prudently Drive Cash From
Operations
Maintain target leverage range Optimize Capital
Structure
Invest in high return M&A opportunities and/or return cash to shareowners
Opportunistically Invest and/or Return Cash To Shareowners
Focus on total shareowner return

Net Sales
Operating Income
EPS
Comparable & currency neutral 33
Generate Solid Free Cash Flow
Growth
4 - 6%
6 - 8%
High Single-Digit
Long-Term Targets
Low Single-Digit
Mid-Single-Digit
+10%
2014 Outlook

Long-term target 4.0% – 4.5% of net sales
2014 expected to be ~$350M
~2/3 supports growth, ~1/3 maintains existing assets
Operations Cold Drink Equipment IT, Other
61%
23%
16%
10-K 2013 34
2013 Capital Mix Capital Highlights

1. 10-K; Net Debt is total 3rd party debt less cash & cash equivalents; comparable EBITDA 2. Pro forma FY10 assumes D&A of low to mid $300M 35
1.6x2 1.7x 2.0x 2.6x
2010 2011 2012 2013 2014+
LONG-TERM TARGET RANGE 2.5x – 3.0x
Net Debt1 to EBITDA

36 10-K 2013; rounded
475 475 550 525
475 480
250
475
100
252423222120191817161514
Long-Term Debt Maturity ($M)
Weighted average cost of debt ~3%

10-K 2013; CCE internal reports; comparable; one-time / other = cash restructuring, cash tax, other 37
~75%
~100%
~25%
0%
25%
50%
75%
100%
2013 FCF One-Time /Other
Net Income
2013 impacted by non-recurring items (e.g. restructuring)
Over time, we expect the two to more closely align
Continued focus on annual ROIC improvement
FCF as a % of Net Income Comments

38
Core business growth
Adjacent territories and adjacent categories
Other territories
New business
Opportunities
Cash flow of existing business
Incremental value creation by CCE
Incremental value to CCE’s core business
Risk, cost, and timeframe
Evaluation Criteria
Opportunities evaluated against alternatives, including return of cash to shareowners

39
$0.00
$0.20
$0.40
$0.60
$0.80
$1.00
03 04 05 06 07 08 09 10 11 12 13 14E
10-K, internal reports; rounded
Increased the Annualized Rate By At Least 25% in each of the Last 5 Years
7 consecutive years of increases

2010 2011 2012 2013 2014E
$3.6B
$1.0B $1.0B
$1.2B $1B
Other Share Repurchase Dividends
10-K, YE market cap (2014 as of 02/18/2014); internal reports; rounded
Almost $8B of cash returned after the formation of new CCE through 2014E
44% 12% 11% 11%
40
9%
% of Mkt Cap

2H11 - 2014E ($B) Opportunity1 Outlook2
FCF 2.5 2.7
Balance Sheet 2.0 1.6
Total 4.5 4.3
41
During 2011, we outlined a $4.5B opportunity through 2014
How are we doing?
1. 2011 Investor Event presentation 2. 2H11-2013 from historical earnings releases and 10-Ks; 2014 outlook as of Feb 5, 2014; FCF adjusted for cash restructuring, cash tax, pension contributions in excess of pension expense; rounded
While the environment has been challenging, our focus on managing our business levers has allowed us to remain broadly on-track

~6-7% ~8-10%
~2-3%
CCE internal reports 42
Net Income Organic growth while
maintaining debt leverage
Annual cash available + =
Annual Cash Available as % of Market Capitalization
Opportunity to generate significant cash annually for M&A and/or shareowners

Focus on consistent long-term profitable growth and total shareowner return
43
Realistic about challenging environment
History of and commitment to managing the levers of our business to deliver growth
Favorable and flexible capital structure
Long-term financial objectives are challenging, yet achievable

44
SOLID FOUNDATION
OPPORTUNITY FOR GROWTH
SHAREOWNER VALUE
CRS AND KEY TAKEAWAYS

Deliver For Today
Lead The Industry
Innovate For The Future
We will deliver for today, growing a low carbon, zero waste business, and inspire and lead change for a more sustainable tomorrow
Sustainability Vision
DELIVER FOR
TODAY
INSPIRE FOR
TOMORROW
45
Strategic Priorities
Corporate Responsibility and Sustainability (CRS)

46
Water – reduced water use ratio to 1.4 liters/liter
Carbon – lowest footprint in CCE history
Packaging – new recycling joint ventures; began consumer recycling behavior study
Making Significant Progress On Sustainability Goals
Decreasing Environmental Impact While Reducing Costs
Achieved operational carbon footprint goal 7 years ahead of schedule
Partnered with key customers to deliver consumer-facing recycling programs
Expanded portfolio of low and no-calorie offerings
All new cooler placements are HFC-free

47
Improve operational effectiveness
Increase engagement and advocacy
Enhance image and reputation
2013/2014 Recognition By Industry and Sustainability Stakeholders
Rated top Food & Beverage Company by Corporate Knights; ranked #43 overall

48
Though optimistic about our long-term outlook, we are realistic about key business environment risks
Challenging macroeconomic environment
Volatile commodity costs
Increasing focus on health and wellbeing
Risk of increased taxes

49
Operating environment remains challenging
Financial priorities focused on long-term profitable growth
Track record of and focus on delivering shareowner value
CCE is executing our strategic priorities

John F. Brock CHAIRMAN & CEO
Nik Jhangiani SVP & CFO