John A. Cross University of Wisconsin-Oshkosh · mailing address of its operator and location of...
17
Twenty Years of Change in Wisconsin’s Dairy Industry: 1989-2009 John A. Cross University of Wisconsin-Oshkosh Wisconsin’s dairy industry experienced tremendous change between 1989 and 2009. In 1989 Wisconsin was the nation’s leading milk producer, with 1,740,000 milk cows on 35,573 dairy farms, the vast majority of which were family operated. Twenty years later, Wisconsin was the nation’s second largest milk producer, with nearly a half million fewer cows. Its number of dairy farms had fallen by 63 percent. Amish and Old Order Mennonite dairy herds had grown to account for a tenth of all dairy farms, while megadairy operations had become increasingly common, particularly within east central Wisconsin. Over the past twenty years tremendous change has occurred within Wisconsin’s dairy industry. In 1989 Wisconsin was the nation’s leading milk producer, with 1,740,000 milk cows on 35,573 dairy farms (WASS 1989). Twenty years later, Wisconsin was the nation’s second largest milk producer, having lost its leadership position to California in 1993. Today, Wisconsin has 1,257,000 milk cows in far fewer dairy herds. The Wisconsin Department of Agriculture, Trade, and Consumer Protection reported that as April 2009 the state had 13,294 licensed dairy producers (WASS 2009), a drop of 63 percent since 1989. Wisconsin has steadily lost dairy herds since early last century and its number of milk cows has fallen by 1,112,000 since 1944, when the all-time high figure was reached. Nevertheless, total milk production continued to rise until the late 1980s because of a nearly three-fold increase in milk production per cow. After a slight dip in production, it has grown since 2004. At the same time, the size of the average herd has also increased, reaching 95.5 cows by 2009. The state’s total milk output of 25,239 million pounds in 2009 exceeded the previous record set in 1988 (WASS 2010a). This paper reviews spatial changes in Wisconsin’s dairy industry between 1989 and 2009, updating findings reported nearly a decade ago (Cross 2001). This two decade period has witnessed major transformations in the dairy industry, particularly a major increase in the number of confined animal feeding operations that define megadairies and the growing prominence of the Amish and Old Order Mennonites among the smallest dairy farmers. The decline in number of dairy farms over the past twenty years occurred after the state had already seen its number of farms with milk cows fall by 145,000 from its maximum reached in 1935. Overall, since spring 1989 Wisconsin has lost over 22,000 milk producers. While total milk production experienced relatively little change, given continuing improvement in milk yields per cow, the size of Wisconsin’s total dairy herd fell by 28.6 percent between 1989 and 2005. It has been slowing increasing since then, reaching 1,260,000 by the beginning of 2010 (WASS 2010b).
Transcript of John A. Cross University of Wisconsin-Oshkosh · mailing address of its operator and location of...

Twenty Years of Change in Wisconsin’s Dairy Industry: 1989-2009
John A. Cross University of Wisconsin-Oshkosh
Wisconsin’s dairy industry experienced tremendous change between 1989 and 2009. In 1989 Wisconsin was the nation’s leading milk producer, with 1,740,000 milk cows on 35,573 dairy farms, the vast majority of which were family operated. Twenty years later, Wisconsin was the nation’s second largest milk producer, with nearly a half million fewer cows. Its number of dairy farms had fallen by 63 percent. Amish and Old Order Mennonite dairy herds had grown to account for a tenth of all dairy farms, while megadairy operations had become increasingly common, particularly within east central Wisconsin.
Over the past twenty years tremendous change has occurred within Wisconsin’s dairy industry. In 1989 Wisconsin was the nation’s leading milk producer, with 1,740,000 milk cows on 35,573 dairy farms (WASS 1989). Twenty years later, Wisconsin was the nation’s second largest milk producer, having lost its leadership position to California in 1993. Today, Wisconsin has 1,257,000 milk cows in far fewer dairy herds. The Wisconsin Department of Agriculture, Trade, and Consumer Protection reported that as April 2009 the state had 13,294 licensed dairy producers (WASS 2009), a drop of 63 percent since 1989.
Wisconsin has steadily lost dairy herds since early last century and its number of milk cows has fallen by 1,112,000 since 1944, when the all-time high figure was reached. Nevertheless, total milk production continued to rise until the late 1980s because of a nearly three-fold increase in milk production per cow. After a slight dip in production, it has grown since 2004. At the same time, the size of the average herd has also increased, reaching 95.5 cows by 2009. The state’s total milk output of 25,239 million pounds in 2009 exceeded the previous record set in 1988 (WASS 2010a).
This paper reviews spatial changes in Wisconsin’s dairy industry between 1989 and 2009, updating findings reported nearly a decade ago (Cross 2001). This two decade period has witnessed major transformations in the dairy industry, particularly a major increase in the number of confined animal feeding operations that define megadairies and the growing prominence of the Amish and Old Order Mennonites among the smallest dairy farmers. The decline in number of dairy farms over the past twenty years occurred after the state had already seen its number of farms with milk cows fall by 145,000 from its maximum reached in 1935. Overall, since spring 1989 Wisconsin has lost over 22,000 milk producers. While total milk production experienced relatively little change, given continuing improvement in milk yields per cow, the size of Wisconsin’s total dairy herd fell by 28.6 percent between 1989 and 2005. It has been slowing increasing since then, reaching 1,260,000 by the beginning of 2010 (WASS 2010b).
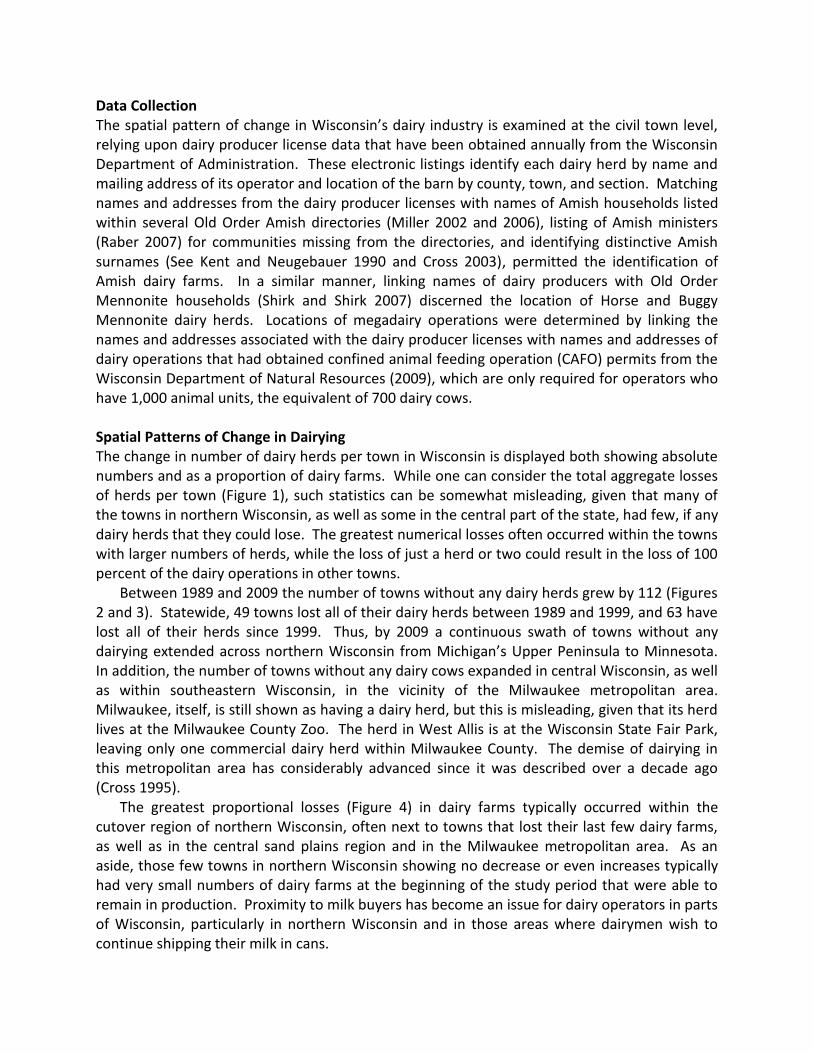
Data Collection The spatial pattern of change in Wisconsin’s dairy industry is examined at the civil town level, relying upon dairy producer license data that have been obtained annually from the Wisconsin Department of Administration. These electronic listings identify each dairy herd by name and mailing address of its operator and location of the barn by county, town, and section. Matching names and addresses from the dairy producer licenses with names of Amish households listed within several Old Order Amish directories (Miller 2002 and 2006), listing of Amish ministers (Raber 2007) for communities missing from the directories, and identifying distinctive Amish surnames (See Kent and Neugebauer 1990 and Cross 2003), permitted the identification of Amish dairy farms. In a similar manner, linking names of dairy producers with Old Order Mennonite households (Shirk and Shirk 2007) discerned the location of Horse and Buggy Mennonite dairy herds. Locations of megadairy operations were determined by linking the names and addresses associated with the dairy producer licenses with names and addresses of dairy operations that had obtained confined animal feeding operation (CAFO) permits from the Wisconsin Department of Natural Resources (2009), which are only required for operators who have 1,000 animal units, the equivalent of 700 dairy cows. Spatial Patterns of Change in Dairying The change in number of dairy herds per town in Wisconsin is displayed both showing absolute numbers and as a proportion of dairy farms. While one can consider the total aggregate losses of herds per town (Figure 1), such statistics can be somewhat misleading, given that many of the towns in northern Wisconsin, as well as some in the central part of the state, had few, if any dairy herds that they could lose. The greatest numerical losses often occurred within the towns with larger numbers of herds, while the loss of just a herd or two could result in the loss of 100 percent of the dairy operations in other towns.
Between 1989 and 2009 the number of towns without any dairy herds grew by 112 (Figures 2 and 3). Statewide, 49 towns lost all of their dairy herds between 1989 and 1999, and 63 have lost all of their herds since 1999. Thus, by 2009 a continuous swath of towns without any dairying extended across northern Wisconsin from Michigan’s Upper Peninsula to Minnesota. In addition, the number of towns without any dairy cows expanded in central Wisconsin, as well as within southeastern Wisconsin, in the vicinity of the Milwaukee metropolitan area. Milwaukee, itself, is still shown as having a dairy herd, but this is misleading, given that its herd lives at the Milwaukee County Zoo. The herd in West Allis is at the Wisconsin State Fair Park, leaving only one commercial dairy herd within Milwaukee County. The demise of dairying in this metropolitan area has considerably advanced since it was described over a decade ago (Cross 1995).
The greatest proportional losses (Figure 4) in dairy farms typically occurred within the cutover region of northern Wisconsin, often next to towns that lost their last few dairy farms, as well as in the central sand plains region and in the Milwaukee metropolitan area. As an aside, those few towns in northern Wisconsin showing no decrease or even increases typically had very small numbers of dairy farms at the beginning of the study period that were able to remain in production. Proximity to milk buyers has become an issue for dairy operators in parts of Wisconsin, particularly in northern Wisconsin and in those areas where dairymen wish to continue shipping their milk in cans.

Figure 1. Decline in number of dairy farms per civil town in Wisconsin between 1989 and 2009. Data compiled by author from digital dairy producer license files obtained in 1989 from Wisconsin Department of Agriculture, Trade, and Consumer Protection and in 2009 from Wisconsin Department of Administration.

Figure 2. Towns, cities, and villages without any dairy herds in 1989. Data from digital dairy producer license list obtained in 1989 from Wisconsin Department of Agriculture, Trade, and Consumer Protection.
Figure 3. Towns, cities, and villages without any dairy herds in 2009. Data from digital dairy producer license list obtained in 2009 from Wisconsin Department of Administration.

Figure 4. Percent change in number of dairy farms per town in Wisconsin between 1989 and 2009. Data compiled by author from digital dairy producer license files obtained in 1989 from Wisconsin Department of Agriculture, Trade, and Consumer Protection and in 2009 from Wisconsin Department of Administration.
The proportional rate of change in dairy production over the past decade was compared
with the proportional decline over the previous decade (Figure 5). It is clear that those towns experiencing the greatest proportional declines are interspersed with towns of seeming stability or decreasing loss rates, typically representing towns with one or two dairy farmers who are hanging onto their operations after the rapid departure of a larger number of operators during the previous decade. These are best seen in northern Wisconsin and in an expanding area of central Wisconsin.
Far more interesting and more significant to Wisconsin’s dairy industry are the considerable areas of north central, southwestern, and east central Wisconsin that are marked by relatively stable rates of loss, or by decreasing rates of loss. It is within these areas that not only are rates of loss slowing, but overall percentage rates of decline are well below the overall state average (Figure 4), even though the actual number of herds lost were high (Figure 1). However, for many of these towns, they also had the most to lose, and even following their losses, their numbers of herds remain higher than elsewhere in Wisconsin. It is within portions of north

central, southwest, and east central Wisconsin that changes are occurring that are redefining Wisconsin’s dairy industry. These changes are occurring among both the smallest and largest operators.
Figure 5. Changing rates of herd loss in Wisconsin: Comparison of the proportional losses during 1989-1999 with the proportional losses during 1999-2009. Data compiled and calculated by author.
Amish and Old Order Mennonite Dairy Farms An increasing share of Wisconsin’s smaller dairy farms are being operated by the Amish (Cross 2004, 2007). In 1989 Wisconsin had 478 Amish dairy farms, then accounting for 1.3 percent of the state’s dairy farmers. By 2009, that number had risen to at least 966 (Figure 6). With the increase in their numbers and the decrease of other dairy operators, the Amish now account for nearly 7.5 percent of all dairy operators in Wisconsin. While not all Amish communities have survived, including the demise of their Amherst and New Glarus settlements, and within several settlements many households have abandoned dairying in favor of woodworking, considerable growth has occurred near existing Amish settlements in Clark, Monroe, and Vernon counties (Figure 7). At the same time new Amish settlements have been established in Grant and Lafayette counties, and relatively young communities in Green Lake, Waushara, and Shawano Counties have experienced considerable growth.

Expansion of Amish settlements into Wisconsin resulted from both push and pull factors. Population growth in their long established settlements in Indiana, Ohio, and Pennsylvania, among a group long known for having large families, has pushed those families whose children want to continue in farming to seek lands elsewhere. Lands in Wisconsin have attracted the Amish because of their relatively low prices, suitability of available lands to sustain their non-mechanized agricultural practices, and relative distance from urban centers (Cross 2004). The Amish decision to settle within that hilly area of Vernon County south of Cashton (in Monroe County) was predicated upon finding “a place that permitted social isolation but was not so remote that it created economic isolation” (Heasley 2005, 106). The fact that the region had a heterogeneous landscape, which would support farms of both crops and pastures, as well as provide game, maple sugar, fuel, and lumber from the adjacent forest, was attractive (Heasley 2005).
Figure 6. Number of Amish dairy farms per town in Wisconsin in 2009. Data compiled by author from dairy producer license list and Amish directories and ministers listings, supplemented by surname analysis.
Even though a smaller proportion of Wisconsin’s Amish households have dairy herds now
than in the past, in several regions of the state the Amish comprise a substantial share of the local dairy farmers (Figure 8). In 2009 the Amish accounted for at least 75 percent of all dairy

farmers within six Wisconsin towns and for at least half within twenty towns. Within another 35 towns the Amish operated between a quarter and one-half of all dairy farms. Statewide, in 2009 Amish dairy farms were found within 138 towns, or 12.8 percent of those towns that had dairy herds. Not unexpectedly, within the town with the state’s greatest total number of dairy herds, the Town of Clinton in Vernon County, Amish farmers operated 63 of its 79 dairy farms.
Figure 7. Change in number of Amish dairy farms in Wisconsin per town between 1989 and 2009. Data compiled by author from dairy producer license listings and Amish directories and ministers listings, supplemented by surname analysis.

Figure 8. Percent of dairy farmers per Wisconsin town who were Amish in 2009. Data compiled and calculated by author from dairy producer license list and Amish directories and ministers listings, supplemented by surname analysis.
The Amish are not the only Old Order religious group that plays a regionally important role
in Wisconsin’s dairy industry. There are currently 324 dairy farms that are operated by Old Order Mennonite farmers, often termed the “Horse-and-Buggy Mennonite” (Figure 9). The Old Order Mennonite settlements sprawl across northern Clark County, overlapping into several adjacent counties, and these Mennonites have recently established several new settlements in Grant County. The Old Order Mennonite travel in horse drawn buggies and dress in a manner similar to the Amish. However, the Old Order Mennonites utilize more modern technologies on their dairy farms, including tractors with steel wheels. Within six towns the Old Order Mennonites account for at least half of all dairy farmers, and they comprise at least a quarter of the farmers in an additional five towns. Overall, Old Order Mennonite farmers are now found in 35 Wisconsin towns.
When one considers both of the Old Order groups, Amish and Mennonite farmers operate at least 1,262 dairy herds in Wisconsin, nearly one in ten of all dairy farms statewide. Together, they manage at least half of all dairy farms within 27 Wisconsin towns and at least a quarter in 68 towns. Statewide, Old Order dairy farmers are found in 159 towns, or in 14.8 percent of all

towns with dairy herds. The increased prominence of these Old Order dairy farmers has resulted from both increases in their numbers and decreases in the total number of dairy farms statewide.
Figure 9. Number of Old Order Mennonite dairy farms per town in Wisconsin in 2009. Data compiled by author from dairy producer license list and Groffdale Mennonite directory, supplemented by surname analysis.
Megadairy herds Wisconsin lagged behind several western and southern states in the development of giant mega-herd operations. The 1987 agricultural census found only nine dairy farms with 500 or more cows operating in the state (US Census 1989). Five years later that number was only 13 (US Census 1994). Yet the expansion of the Amish and Mennonite with their small operations is not the only change that has occurred in Wisconsin during the past two decades. The 2007 Census of Agriculture reported that 272 Wisconsin dairy farms had herds of 500 or more cows (NASS 2009). Statewide, these large herds contained 20.6 percent of all of Wisconsin’s dairy cows. The prominence of these large operations upon dairying in east central Wisconsin can clearly be seen (Figure 10). The situation in northern Wisconsin, where far fewer dairy cows are milked, displays the impact that one or two large operations can have upon production statistics for a county with very few other producers (Figure 11). For example, while the Census

of Agriculture reports that Sawyer County had 2,199 milk cows spread among 24 producers in 2007 with but one producer with over 500 cows—and the census withheld the number of cows in its size class because of disclosure rules, records from the Wisconsin Department of Natural Resources indicated that the dairy operation had 870 animal units in 2007, the equivalent of 609 dairy cows, and it had received a permit to expand to the equivalent of 798 cows by the end of 2008.
Figure 10. Number of megadairy herds per Wisconsin county in 2007. Data from NASS (2009).

Figure 11. Prominence of megaherd dairy operations in Wisconsin counties in 2007. Calculated by author from NASS (2009) data.
Concentrated Animal Feeding Operations in Dairying Although agricultural census data are not reported at the civil town level, nor do the statistics distinguish the largest operators from the overall number who operate herds of at least 500 cows, matching of data from the dairy producer license listing and those dairy operations that have received Wisconsin Pollutant Discharge Elimination System (WPDES) Concentrated Animal Feeding Operation permits issued by the Wisconsin Department of Natural Resources facilitates the identification of those dairy farms with such permits (Figure 12). Because pollutant discharge permits are not required for dairy farms with fewer than 700 cows (the equivalent of 1,000 animal units), mapping of the permitted licensed dairy operations shows the spatial distribution of Wisconsin’s largest dairy operations as of early 2009 (Figure 13). The greatest concentration of these megadairies is found within east central Wisconsin, including Kewaunee, Brown, Manitowoc, and Calumet counties, with a line extending from Fond du Lac to Dane county. The Town of Wrightstown in Brown County, south of Green Bay, had five, the most megadairy operations of any town in Wisconsin.
Undoubtedly, both the number and prominence of megadairy operations in Wisconsin will rise in the future. On February 27, 2009, the Wisconsin Department of Natural Resources

issued a Concentrated Animal Feeding Operation permit to Rosendale Dairy LLC in Fond du Lac County (Figure 14), permitting it to expand to 4,000 milk cows, along with 150 beef cattle. In addition, the permit noted the expectation of the owner to seek “a possible second phase of similar size in the future” by Fall 2010, bringing the operation up to 8,000 milk cows, with two 1,200 foot long free-stall barns. Now completed, this is the largest dairy operation in Wisconsin.
Figure 12. Number of dairy herds with over 700 cows per town in Wisconsin in 2009. Compiled by author from 2009 dairy producer license listing and CAFO information from Wisconsin Department of Natural Resources.
Even before the establishment of the Rosendale Dairy, Wisconsin already had several very
large dairy operations. At the time they received their CAFO permits, Weise Brothers Farm in Brown County had 2,968 dairy cows, Siemers Holstein Farm Inc. in Manitowoc County had 3,034 dairy cows, and the Kenn Buelow dairy farm in Calumet County had 2,911 dairy cows. Statewide, eighteen operators had at least 2,000 dairy cows at the time they received their last CAFO permit or permit renewal. In addition, 15 dairy farms had fewer than this number of cows at the time their latest CAFO permit was issued, but had received permission to expand to at least 2,000 dairy cows. At present Wisconsin has nearly thirty dairy farms of at least 2,000 cows. Such large operations provide many economies of scale, facilitate large investments in

huge free-stall barns and modern automated milking parlors, and permit the operators to concentrate upon improving milk production, while relying upon feed grown by other farmers. Although these operations possess efficiencies, their sizes pose serious environmental concerns, particularly should animal wastes be inappropriately handled. The megadairies have also been responsible for the hiring of large numbers of Hispanic laborers, changing the ethnic composition of rural Wisconsin.
The Future Dairy Landscape The future dairy landscape within Wisconsin will undoubtedly feature both increasing prominence of dairy operators at both ends of the size spectrum. A greater share of the state’s dairy farms will be operated by Amish and Old Order Mennonite farmers, while larger numbers of megadairy operations will increasingly dominate the total milk production. While megadairy operations have become increasingly prominent within east central Wisconsin where there are relatively few Amish dairymen, some megadairies have been established in the vicinity of Amish and Old Order Mennonite dairy farms. For example, near Athens in Marathon County, several free-stall barns of megadairies are located next door to or across the highway from Amish farmsteads. Both the large and small operations represent the future of Wisconsin’s dairy industry.
Figure 13. Wisconsin megadairy farms with over 2,000 cows. Compiled by author from 2009 dairy producer license listing and CAFO information from Wisconsin Department of Natural Resources.

Figure 14. Free-stall barn at Rosendale Dairy, Fond du Lac County. This structure, extending 1,200 feet, was constructed during the first phase in development of the Rosendale Dairy, which after its recent expansion, houses 8,000 cows, the greatest number of any megadairy in Wisconsin.

References Cited Cross, John A. (1995) “Dairying in an Urban Environment: The Milwaukee Metropolitan Area,” Transactions of the Wisconsin Academy of Sciences, Arts and Letters. 83: 75-86. ________. (2001) “Change in America's Dairyland,” The Geographical Review. 91 (4): 702-714. ________. (2003) “Amish Surnames, Settlement Patterns, and Migration,” Names. 51 (3-4): 193-214. ________. (2004) “Expansion of Amish Dairy Farming in Wisconsin,” Journal of Cultural Geography. 21 (2): 77-101. ________. (2007) “The Expanding Role of the Amish in America’s Dairy Industry.” Focus on Geography, 50 (3): 7-16. Heasley, Lynne. (2005) A Thousand Pieces of Paradise: Landscape and Property in the Kickapoo Valley. Madison: University of Wisconsin Press. Kent, Robert B. and Randall J. Neugebauer. (1990) “Identification of Ethnic Settlement Regions: Amish Mennonites in Ohio.” Rural Sociology. 55 (3): 425-441. Miller, Devon. (2002) Wisconsin, Minnesota & Montana Amish Directory. Millersburg, OH: Abana Books. ________. (2006) Wisconsin, Minnesota & Montana Amish Directory. Millersburg, OH: Abana Books. NASS [National Agricultural Statistics Service]. (2009) 2007 Census of Agriculture. Volume 1 Geographic Area Series, Part 49 Wisconsin State and County Data (AC07-A-49). Washington: U.S. Department of Agriculture. Raber, Ben J. (2007) Minister's List. The New American Almanac. (38th Edition). Baltic, OH: B. J. Raber and Gordonville, PA: Gordonville Print Shop, pp. 28-79. Shirk, Laura N. and Beatrice N. Shirk. (2007) Directory of the Groffdale Conference Mennonite Churches (Fifth Edition). [no publisher listed] US Census [United States Bureau of the Census]. (1989) 1987 Census of Agriculture. Volume 1 Geographic Area Series, Part 49 Wisconsin State and County Data (AC87-A-49). Washington: U.S. Department of Commerce.

________. (1994) 1992 Census of Agriculture. Volume 1 Geographic Area Series, Part 49 Wisconsin State and County Data (AC92-A-49). Washington: U.S. Department of Commerce. WASS [Wisconsin Agricultural Statistics Service]. (1989) Wisconsin 1989 Dairy Facts. Madison: Wisconsin Department of Agriculture, Trade and Consumer Protection. ________. (2009) 2009 Wisconsin Agricultural Statistics. Madison: Wisconsin Department of Agriculture, Trade and Consumer Protection. ________. (2010a) “Milk Production - 1933 to current year.” Madison: Wisconsin Department of Agriculture, Trade and Consumer Protection. (http://www.nass.usda.gov/Statistics_by_State/Wisconsin/Publications/Dairy/milkprod_excel.pdf) ________. (2010b) “Number of Milk Cows – 1933 to current year.” Madison: Wisconsin Department of Agriculture, Trade and Consumer Protection. (http://www.nass.usda.gov/Statistics_by_State/Wisconsin/Publications/Dairy/milkno.pdf) Wisconsin Department of Natural Resources. (2009) “WDNR Runoff Management - CAFO Permittees.” Madison: Wisconsin Department of Natural Resouces. http://dnr.wi.gov/runoff/agriculture/cafo/permits/index.asp