
Jóhannes Helgi Jóhannesson
100
Design of a 170 m span bridge over the fjord Thorskafjordur in Iceland Jóhannes Helgi Jóhannesson Avdelningen för Konstruktionsteknik Lunds Tekniska Högskola Lunds Universitet, 2010 Rapport TVBK - 5185
Transcript of Jóhannes Helgi Jóhannesson

Design of a 170 m span bridge over the fjord Thorskafjordur in Iceland
Jóhannes Helgi Jóhannesson
Avdelningen för Konstruktionsteknik Lunds Tekniska Högskola Lunds Universitet, 2010
Rapport TVBK - 5185

i
Avdelningen för Konstruktionsteknik Lunds Tekniska Högskola Box 118 221 00 LUND Department of Structural Engineering Lund Institute of Technology Box 118 S-221 00 LUND Sweden Design of a 170 m long bridge over the fjord Þorskafjörður in Iceland Dimensionering av 170 m lång bro över fjorden Þorskafjörður på Island Jóhannes Helgi Jóhannesson 2010 Abstract Determining the structural type of a bridge is often a difficult task. The purpose of this thesis is to preliminary design three bridge alternatives. The bridge shall cross the fjord Þorskafjörður in Iceland. The goal is to determine the most favorable option. That decision will be based on economy, construction and aesthetics. Following that a more detailed design of the superstructure is performed for the chosen alternative. All calculations are performed according to Eurocode.
Keywords: concrete girder bridge; arch bridge; cable-stayed bridge; concrete; reinforcement; prestress

ii
Rapport TVBK-5185 ISSN 0349-4969 ISRN: LUTVDG/TVBK-10/5185+92p Examensarbete Supervisor: Dr. Fredrik Carlsson Examinator: Prof. Sven Thelandersson October 2010

iii
Foreword This thesis was written under the administration of the Division of Structural Engineering at the University of Lund. It was written during the period September 2009 - September 2010 under the supervision of Dr. Fredrik Carlsson.
I especially want to thank my supervisor, Dr. Fredrik Carlsson, for all his help with making this thesis become real. I also want to thank Einar Hafliðason, the head of the bridge division of the Icelandic Road Administration, for the help with finding a subject for this thesis and for giving me necessary information regarding this subject. For the cost of various structural materials I would like to thank Oskar Bruneby, a site manager at Peab, for his contribution. In addition I would like to thank a good friend from Iceland, Ástþór Ingvason, for making 3D animations of the three bridge alternatives presented in this thesis. Finally, I want to thank my friends at LTH: Bzav Abdulkarim, Daniel Honfi, Ívar Björnsson and Valdimar Örn Helgason for all their help and last but not least other friends and family for their moral support.
Lund, October 2010 Jóhannes Helgi Jóhannesson

iv

v
Table of Contents 1 Introduction ..................................................................................................................................... 1
1.1 Background ............................................................................................................................. 1
1.2 Objectives ............................................................................................................................... 1
1.3 Outline of the thesis ................................................................................................................ 1
2 Bridge types .................................................................................................................................... 2
2.1 Concrete bridge ....................................................................................................................... 2
2.2 Arch bridge ............................................................................................................................. 3
2.3 Cable-stayed bridge................................................................................................................. 4
3 The actual project – geometry and boundary conditions ................................................................ 5
4 Preliminary design .......................................................................................................................... 7
4.1 Introduction ............................................................................................................................. 7
4.2 Loads ....................................................................................................................................... 7
4.2.1 Permanent loads .............................................................................................................. 7
4.2.2 Variable loads ................................................................................................................. 7
4.2.3 Load combinations .......................................................................................................... 8
4.3 Material cost ............................................................................................................................ 9
4.4 The concrete beam bridge ..................................................................................................... 10
4.4.1 Geometry for type 1 ...................................................................................................... 10
4.4.2 Size estimation .............................................................................................................. 10
4.4.3 Supports ........................................................................................................................ 11
4.4.4 Construction .................................................................................................................. 13
4.4.5 Cost estimation/conclusions .......................................................................................... 13
4.5 The arch bridge ..................................................................................................................... 16
4.5.1 Geometry for type 2 ...................................................................................................... 16
4.5.2 Arch ............................................................................................................................... 17
4.5.3 Bridge Deck .................................................................................................................. 22
4.5.4 Hangers ......................................................................................................................... 23
4.5.5 Transversal Bracing ...................................................................................................... 23
4.5.6 Foundations ................................................................................................................... 24
4.5.7 Construction .................................................................................................................. 24
4.5.8 Cost estimation/conclusions .......................................................................................... 24
4.6 The cable-stayed bridge ........................................................................................................ 26
4.6.1 Aesthetics of cable-stayed bridges ................................................................................ 26
4.6.2 Geometry for type 3 ...................................................................................................... 27
4.6.3 Design ........................................................................................................................... 27

vi
4.6.4 Deck .............................................................................................................................. 32
4.6.5 Pylons ............................................................................................................................ 33
4.6.6 Foundation .................................................................................................................... 34
4.6.7 Construction .................................................................................................................. 34
4.6.8 Cost estimation/conclusions .......................................................................................... 35
4.7 Summary and choice of bridge type...................................................................................... 37
5 Final design ................................................................................................................................... 38
5.1 Introduction ........................................................................................................................... 38
5.2 Design ................................................................................................................................... 39
5.2.1 Building codes .............................................................................................................. 39
5.2.2 Loading ......................................................................................................................... 39
5.2.3 Materials ....................................................................................................................... 39
5.2.4 Exposure classes and service life .................................................................................. 40
5.2.5 Tendon alignment and prestress force ........................................................................... 40
5.2.6 Prestress losses .............................................................................................................. 46
5.2.7 Secondary effects of prestress ....................................................................................... 51
5.3 Ultimate moment capacity .................................................................................................... 55
6 References ..................................................................................................................................... 57
6.1 Literature ............................................................................................................................... 57
6.2 Computer programs............................................................................................................... 58
6.3 Other references .................................................................................................................... 58
Appendix A ........................................................................................................................................... 59
Appendix B ........................................................................................................................................... 74

Design of a 170 m long bridge over the fjord Þorskafjörður in Iceland
1
1 Introduction
1.1 Background The motivation for writing this thesis is an interest in bridges that the author has acquired during his studies in structural engineering. Many people consider bridges to be state of the art of all civil structures. That can be for many reasons; f. ex. bridges sometimes cross a difficult passing or because of their aesthetic aspects.
During the time the subject for this thesis was under consideration the author decided to contact the bridge division of the Icelandic Road Administration (ICERA). Einar Hafliðason, the head of the bridge division of ICERA, was contacted and he was more than willing to help. He came up with a few options to look into which were all considered. Following that, a decision was made and a bridge that is to be constructed to cross the fjord Þorskafjörður in Iceland was chosen as a subject for this thesis.
1.2 Objectives The main purpose for a bridge over the fjord Þorskafjörður is to shorten the distance of the route on the way to the northwestern part of Iceland. With this bridge the route will shorten of about 10 km. Another purpose is to increase traffic security by eliminating all one-lane bridges on this 10 km sector.
The main objective of this thesis is divided into two parts. First, a preliminary design of three bridge alternatives is made. A rough cost estimation and an estimation of quantity of materials is made based on the preliminary design for these three alternatives. Secondly, a more detailed design is made of the most appropriate bridge type. The choice of a bridge type is based on the conclusions from the first part. These conclusions will primarily be based on economy, aesthetics and construction method.
1.3 Outline of the thesis Chapter 2 consists of a general discussion about aesthetics, advantages and disadvantages and other aspects for the three bridge types that are chosen to be analyzed.
Chapter 3 displays the bridge location and describes the boundary conditions and geometry at the construction site. It also includes information about why this bridge is to be built.
Chapter 4 includes preliminary design and cost estimations of the three chosen bridge alternatives with respect to the quantity of materials needed for each type. That chapter also includes conclusions of the preliminary design, that is, which type of bridge is chosen for a more detailed design with respect to the limits that are set.
Chapter 5 includes more detailed structural analysis for the superstructure of the chosen bridge alternative.

2 BrThere armain sub
1. 2. 3. 4.
These ipreferen
Safety aprincipleachieved
In this thbased onbridge (pbased on
2.1 CConcreteconcreteof the sifor this t
These tylonger ththey intealternatisense aswith two
Des
ridge typre many areabjects consid
Safety ServiceabilitEconomy Aesthetics
ssues and thnce.
and serviceabes and thus d through no
hesis three bn the four apost tensionn the author´
Concrete e slab- or gire bridges are implest formtype of bridg
ypes of croshan ca. 25 megrate to theives. Neverths the two typo girders can
ign of a 170
pes as of concerndered in this
ty
heir order o
bility are acdepend on
onscientific m
bridge types aforementioned), an arch s interest.
bridge rder bridges an attractive
ms for a bridgge can be see
Figure 2-1
s-sections wm. They are ece surroundinheless, the aes that are co
n be seen in f
Figur
m long bridg
n that need tthesis. They
of priority m
chieved throuthe analytic
means and de
are investiganed areas of
bridge and
are by far the alternative
ge with respeen in figure 2
1: A typical cro
with prestressconomically
ngs on site. Tauthor considonsidered in figure 2-2.
e 2-2: An exam
ge over the f
2
to be focusedcan be listed
may though
ugh systemacal skills ofepend almost
ated as optioconcern. Tha cable-staye
e most commfor long-spa
ect to its struc2-1.
oss-section for
s reinforcem compatible
They are alsders them nothe next cha
mple of a prest
fjord Þorskaf
d on when dd in order of
be criticize
atic applicatif the enginet entirely on
ons for the prhese three bred bridge. T
mon of all bran bridges anctural mode
a concrete gir
ment in the giand can easio easy to coot as the statapters. An ex
ressed girder b
fjörður in Ice
esigning a bf priority as:
ed and are
ion of scienter. Economythe creativity
roject and a ridge types a
The choice of
ridge types nnd are considof action. A
der bridge.
irders are usily be designonstruct comte-of the-art
xample of a c
bridge.
eland
bridge. There
merely the
tific and engy and aesthy of the engi
choice is estare; a concref these altern
owadays. Prdered by man
typical cros
sually used fned in the mampared to ma
bridges in tconcrete bea
e are four
authors´
gineering hetics are neer.
tablished ete beam natives is
estressed ny as one s-section
for spans anner that any other the same m bridge
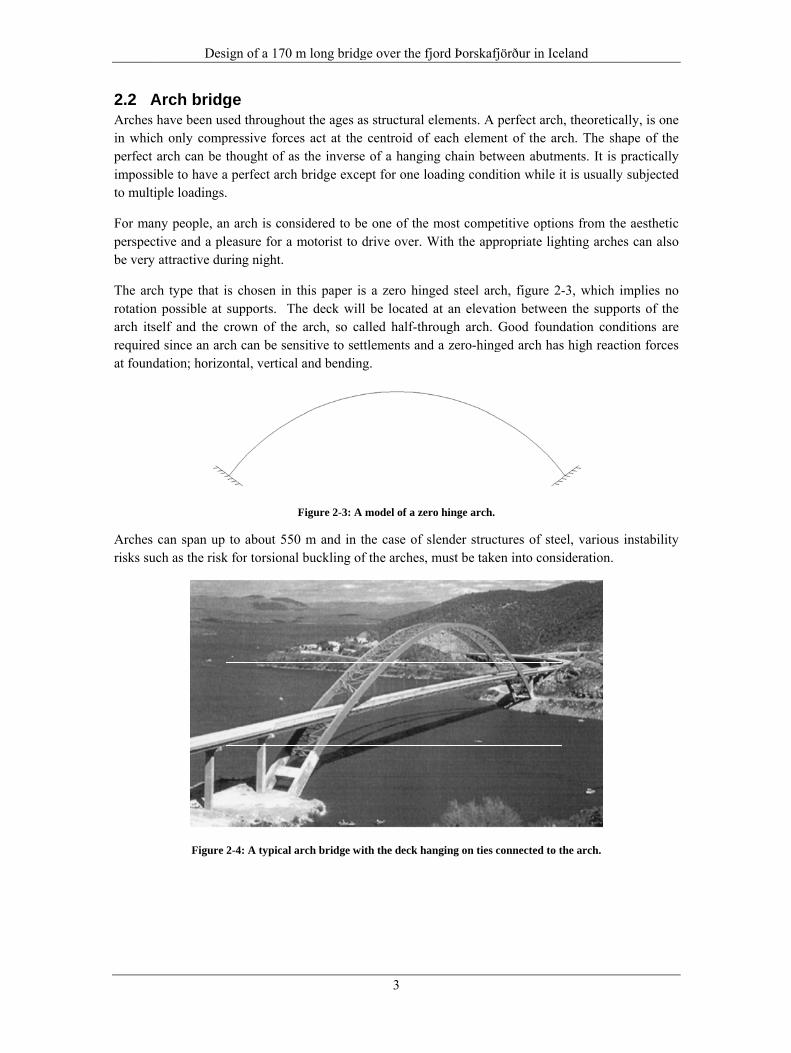
2.2 AArches hin whichperfect aimpossibto multip
For manperspectbe very
The archrotation arch itserequiredat found
Arches crisks suc
Des
Arch bridghave been ush only comparch can be ble to have aple loadings.
ny people, antive and a plattractive du
h type that ipossible at
elf and the cd since an arcdation; horizo
can span up ch as the risk
Figure
ign of a 170
ge sed throughopressive forcthought of a
a perfect arch.
n arch is conleasure for a uring night.
is chosen in supports. Tcrown of thech can be senontal, vertica
to about 55k for torsiona
2-4: A typical
m long bridg
out the ages aes act at the
as the inverseh bridge exce
nsidered to bmotorist to
this paper iThe deck wile arch, so cansitive to set
al and bendin
Figure 2-3: A
50 m and in al buckling o
arch bridge w
ge over the f
3
as structural e centroid ofe of a hanginept for one l
be one of thedrive over. W
is a zero hinll be locatedalled half-thttlements an
ng.
A model of a ze
the case of sof the arches,
with the deck ha
fjord Þorskaf
elements. A f each elemeng chain betoading cond
e most compWith the app
nged steel ard at an elevahrough arch. d a zero-hing
ero hinge arch.
slender struc must be tak
anging on ties
fjörður in Ice
perfect archent of the arctween abutm
dition while i
etitive optionpropriate ligh
ch, figure 2-tion betweenGood found
ged arch has
ctures of steeen into consi
connected to t
eland
h, theoreticallch. The shap
ments. It is prit is usually s
ns from the hting arches
-3, which imn the suppordation condis high reactio
el, various inideration.
the arch.
ly, is one pe of the ractically subjected
aesthetic can also
mplies no rts of the itions are on forces
nstability
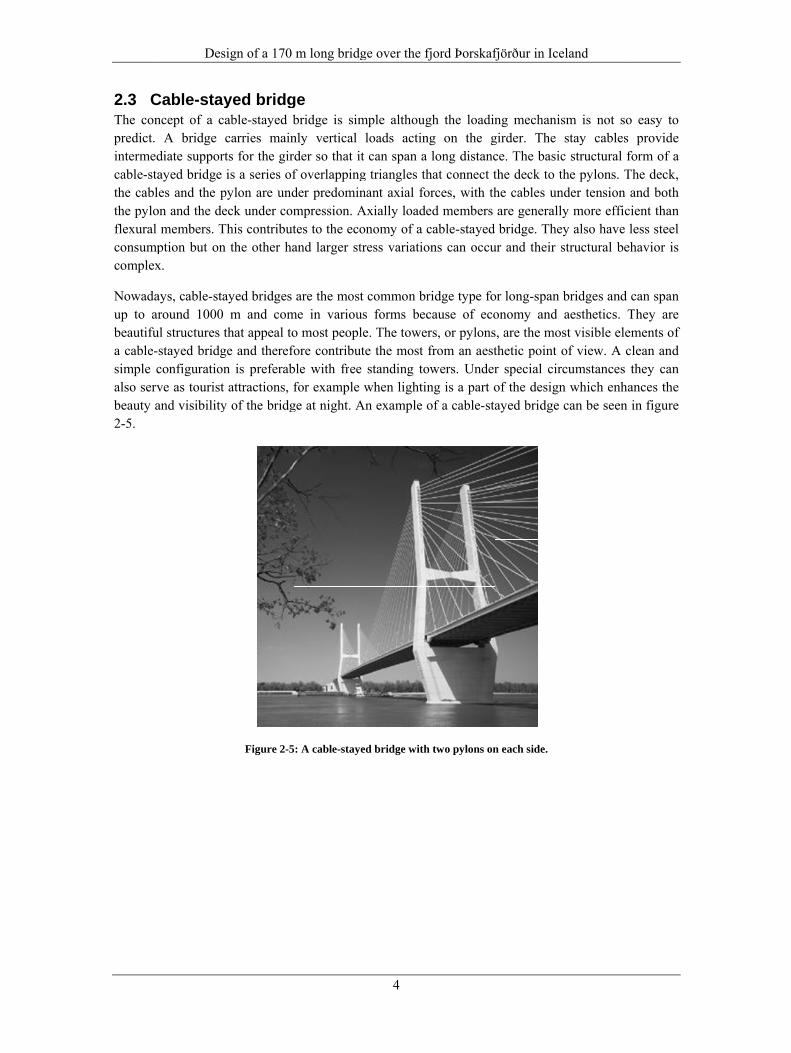
2.3 CThe conpredict. intermedcable-stathe cablthe pyloflexural consumpcomplex
Nowadaup to arbeautifua cable-simple calso servbeauty a2-5.
Des
Cable-stayncept of a ca
A bridge cdiate supportayed bridge es and the p
on and the demembers. T
ption but on x.
ays, cable-staround 1000
ul structures tstayed bridgconfigurationve as tourist and visibility
ign of a 170
yed bridgable-stayed bcarries maints for the giris a series of
pylon are undeck under coThis contribut
the other ha
ayed bridges m and com
that appeal toge and therefn is preferabattractions,
y of the bridg
Figure 2-5
m long bridg
ge bridge is simnly vertical rder so that if overlappingder predominmpression. Ates to the ecoand larger st
are the mostme in variouo most peoplfore contribuble with freefor example
ge at night. A
5: A cable-stay
ge over the f
4
mple althougloads actin
t can span a g triangles thnant axial foAxially loadeonomy of a ctress variatio
t common brus forms becle. The tower
ute the most e standing to
when lightinAn example o
ed bridge with
fjord Þorskaf
gh the loadinng on the g
long distanchat connect torces, with thed members cable-stayedons can occu
ridge type focause of ecors, or pylonsfrom an aest
owers. Underng is a part oof a cable-st
h two pylons on
fjörður in Ice
ng mechanisgirder. The ce. The basicthe deck to the cables unare generall
d bridge. Theur and their s
or long-span onomy and s, are the mothetic point or special cirof the designayed bridge
n each side.
eland
sm is not sostay cables
c structural fthe pylons. Tnder tension y more effic
ey also have structural be
bridges and aesthetics. Tst visible eleof view. A ccumstances n which enhacan be seen
o easy to provide
form of a The deck, and both
cient than less steel
ehavior is
can span They are ements of clean and they can ances the in figure

3 ThThe posi
Currentlcrosses ain each crossing
In figureThe ligh
As was directionnecessaracquired
The restsides of fjord wh
The largaround maximuminimumrock fillalignmen
Des
he actualition of this b
ly there is a a river with direction, to
g the fjord.
e 3-1 the posht gray line w
mentioned, n. The requry area of wd. For full wa
t of the distanthe bridge. T
here the bridg
gest possible 1.65 m from
um differencm water opelings will bnt of the plan
ign of a 170
l project bridge is in t
road that goonly one lan
o increase tr
sition of the fwhere the arro
Figure 3-1: Po
the bridge uired length
water openingater changes
nce required Therefore thege is to be po
depth of seam the sea bee between hning would
be at each enned road lin
m long bridg
– geomethe north-we
oes along thne. The purpraffic safety,
fjord can be ow points is
osition of the fj
will have twof the brid
g needs to bethe water flo
to cross the e bridge willositioned is a
a level is aroud. The averahighest and be reduced b
end abutmenne that will b
ge over the f
5
etry and stern part of
he fjord and pose of the ne efficiency a
seen. The figthe current r
fjord on the no
wo traffic ladge, 170 m, e of minimuow is assume
fjord will bel be positionearound 1 km.
und 6.35 m aage sea levelowest sea
by a few ments and erosbe considered
fjord Þorskaf
boundarf Iceland pass
at the end oew bridge isand to short
gure displaysroad.
rth-western co
anes for noris mainly
um 560 m2 sed to be 2.5 m
e achieved byed in the mid.
and the smalel is 4 m frolevel is 4.7 ters becauseion protectiod is displayed
fjörður in Ice
ry conditsing a fjord c
of the fjord ts therefore toten the route
s the northw
oast of Iceland
rmal vehicle due to ecolo that full wm/sec.
y a road, on ddle of the fj
llest possibleom the sea b
m. It can b of piers andon will be d in figure 3-
eland
tions called Þorska
there is a bro have two lae of about 1
estern part o
.
traffic, onelogical reaso
water change
a rock fillingord. The wid
e depth of sebed. Hence, be assumed
d abutments.at all suppo-2.
afjörður.
ridge that anes, one 0 km by
of Iceland.
e in each ons. The s will be
g on both dth of the
a level is the total that the
Guiding orts. The

The soilfundame
A sectio
The fjordefined greater tIceland a
Figur
Des
l at the sea bents will be f
on of the fjord
Figu
rd is not locas <2% g in
than 4% g thare displayed
e 3-4: Maximu
ign of a 170
Figure 3-2
bed consists founded on c
d is displaye
ure 3-3: A cros
cated in an n this area, he provisiond in figure 3-
um values of su
m long bridg
2: The road lin
of sedimentcohesive pile
ed in figure 3
ss section of th
earthquake zsee figure 3s of Eurocod-4.
urface accelera
ge over the f
6
ne where the br
layers. The es.
-3. Note that
he fjord, the he
zone and the3-4. Accordide 8 can be
ation. (EarthquIceland).
fjord Þorskaf
ridge will be co
sediment lay
t the height i
eight is scaled u
e peak valueing to Eurocneglected. T
uake Engineer
fjörður in Ice
onstructed.
yers are cohe
is scaled 10 t
up of the facto
e for surfaccode 8 for stThe different
ring Research C
eland
esive materia
times the wid
r 10.
e acceleratiotructures witt earthquake
Centre, Univer
als so all
dth.
on, ag, is th ag not zones in
rsity of

Design of a 170 m long bridge over the fjord Þorskafjörður in Iceland
7
4 Preliminary design
4.1 Introduction This chapter contains preliminary design of the three bridge types, a concrete girder bridge, an arch bridge and a cable-stayed bridge. The aim of the preliminary design is to determine the most suitable bridge type for the purpose of crossing the fjord Þorskafjörður. The chapter is divided in to two different sections. The first sections (sections 4.2 and 4.3) treat factors that are common for all three bridge types, i.e. loads, load combinations and materials. Sections 4.4 to 4.6 treat the three different bridge types respectively. In these sections are sizes of important bridge elements for each bridge type estimated. These sections also contain rough cost estimations and construction methods for each bridge type. Finally, in the last section of this chapter, the most suitable bridge type is determined based on the preliminary design.
4.2 Loads For the preliminary design of this project only three loads are considered. Two permanent loads, self-weight and pavement, and one variable load, traffic load. The loads are determined according to Eurocode 1 (EC1).
4.2.1 Permanent loads Self-weight for reinforced concrete is set to 25 kN/m3. The self-weight of pavement and structural steel are set to 2.1 kN/m2and 78.5 kN/m3 respectively.
4.2.2 Variable loads The variable actions, which are taken into account in this thesis, are traffic loads in vertical direction. After some discussion with the head of the bridge division of ICERA it seemed reasonable to do this simplification in the preliminary analysis.
Traffic Loads In EC1-2, chapter 4, there are defined four different load models for traffic loads. In this case Load Model 1 (LM1) is used with two partial systems, one including axle loads (Tandem system TS) and the other including uniformly distributed loads (UDL system), see figure 4-1. LM1 is considered to cover most of the effects from traffic of lorries and cars and should be used for general and local verifications while the other load models are considered for dynamic effects, special vehicles and other situations. LM1 should be applied on each notional lane and on the remaining areas. On notional lane number i, the load magnitudes are referred to as αQiQik and αqiqik, axle load and distributed load respectively. On the remaining areas, the load magnitude is referred to as αqrqrk. According to chapter 4.3.2(3) in EC1-2 the recommended minimum values for the adjustment factors are: ≥ 0,8 ≥ 1,0
The national annex for Sweden recommends the following minimum values for the adjustment factors: = 0,9 = 0,9 = 0

Hence, Icelandicharacte
These lomost unf
4.2.3 Several when a state is mlimit sta
Des
these valuesc national an
eristic vertica
oad arrangemfavorable res
Load combload combinbridge is anamade for the ate is accordin
ign of a 170
s are used fnnex for this al distributed
Table
ments are dispsult.
Figure 4
binations nations need talyzed and dpreliminary
ng to EC0, s
,
m long bridg
for this situapart of Euro
d loads, qik, ar
e 4-1: Axle load
played on fig
4-1: Load arra
to be taken idesigned. Bu design of alection 6.4.3.
, " + "
ge over the f
8
= 1,0= 1,0ation. The S
ocode 2 is nore summariz
ds and uniform
gure 4-1 and
angements for l
nto account,ut for simplifll bridge type2: " + " , ,
fjord Þorskaf
Swedish natot ready yet. Czed in table 4
mly distributed
d should be a
load model 1 in
in the ultimfication onlyes. The desig
" + "
fjörður in Ice
ional annex Characteristi
4-1.
d loads.
arranged for
n EC1-2.
ate and serviy an analysisgn value of a
, , ,
eland
is applied ic axle loads
each case to
iceability lim in the ultim
actions in the
since an , Qik, and
o give the
mit states, mate limit e ultimate

where
γG,j
Gk,J
γP
P
γQ,1
Qk,1
γQ,i
ψ0,i
Qk,i
Here arevariable principa
4.3 MTable 4-not comthat havattendedSwedengiven.
To estimis used necessarfrom Zhas the omaintenthe desig
Des
Partial facto
Characterist
Partial facto
Relevant rep
Partial facto
Characterist
Partial facto
Factor for co
Characterist
e γG,j=1.35, γaction resp
al action.
Material c-2 summariz
mpletely corree been inves
d and other . Workforce
mate the price(SEK/kg). T
ry to find thehuan (1998) aones that wance or othegn of that is
ign of a 170
r for perman
ic value of p
r for prestres
presentative v
r for variable
ic value of th
r for variable
ombination v
ic value of th
γP=1.0 and γpectively. Th
ost zes unit priceect they will stigated. Theresources liis included
Table
e of the steelTo come upe unit weightabout stay ca
were chosen r factors, winot done in
m long bridg
nent action j
permanent ac
ssing actions
value of a pr
e action 1
he leading va
e action i
value of varia
he accompan
γQ,1=1.5 the phe last term
es for the magive a good basis of theke discussioin these val
4-2: Unit pric
l hangers in tp with a prit (kg/m) of thables where here to use
ll be estimatthe prelimin
ge over the f
9
tion j
s
restressing ac
ariable action
able action i
nying variabl
partial safetyin this equa
aterials used.d perspective cost estimat
ons with conlues and high
ces for various
the arch bridice for the he cables. Unthe unit wei
e and that vted and cost oary phase. H
fjord Þorskaf
ction
n 1
le action i
y factors foration is not
. Even thoug on prices fotion and pricntractors andher values a
structural mat
dge, see sectistay cables nit weight foght of cablesvalue is 24of foundatio
Here estimatio
fjörður in Ice
r permanent required sin
gh values of or comparisoces is from cd engineersre chosen w
terials.
ion 4.5.4, uniof the cable
or cables wass that has a s.1 kg/m. Nons is a factoron is used to
eland
action, prestnce there is o
various expeon of the bridourses the auboth in Ice
where a price
it price for soe-stayed brids found in a similar breako lifetime cr of uncertain
o calculate th
tress and only one
enses are dge types uthor has land and range is
olid steel dge it is literature king load cost, like nty since
he cost of

the subselements
4.4 TBridge tsupportithe bridg
4.4.1 This bricontinuodown to
4.4.2 As was mspans, twfigure 4-the lengt
The firsprestress290x290Also an
The heigheight, Lbridge sheconomiwon’t co
The cenTheland
where B
The thic
The estim
Des
structures wis. Included in
The concrtype no. 1 ising the beamge deck will
Geometry idge type wous girder br the sea bed.
Size estimmentioned bwo internal -2. This choith of the exte
st step is to s system is 0 mm. 3 cabadditional th
ght of the gL/h, of the ghould be choic reasons (some up probl
nter distancedersson (2009
B is the free w
ckness of the
mated cross-
ign of a 170
th a method n the substru
rete beams a concrete
ms. There wilbe 10 m, see
for type 1 ill have a cridge with 4
ation efore, the totspans with tice of span leernal spans i
decide the pVSL 6-19.
bles are choshickness of 3
irder is detegirder. A recosen in the rasection 7.2.1lems later in
e between t9):
width of the b
slab is chose
-section of th
m long bridg
developed bucture are the
m bridgepost-tension
ll be two mae figure 4-3.
oncrete slabspans, see fi
tal span of ththe length 4engths is mas about 80 %
Figure 4-2: Sp
prestressing The dimens
sen in each r300 mm is de
ermined by tcommended ange of 12-3
1 in Menn (1n the design.
ℎ = 20the two ma
= 1,8 ∙bridge.
en to be 250
he bridge, ba
ge over the f
10
by Menn (19e piers and fu
ned girder bain girders wSupports wil
b supported igure 4-2. Th
he bridge is 18 m and twde to get an
% of the lengt
pan lengths for
system to esions for anrow which retermined ov
the slenderneslenderness
35 and some1986)) and So the estim
⟹ ℎ = 4820ain girders,
⟹ = 11,mm to be ab
ased on the m
fjord Þorskaf
986) as a 23.undaments.
bridge with fwith post-tens
ll be founded
on two conthe girders ar
170 m. The bwo external sp
even momenth of the inte
r bridge type 1
estimate the chorage blo
results in a mver the suppo
ess, a ratio bratio for a clower rangea low value
mated height b
= 2,4
a, is chose
0,8 = 5,6
ble to resist s
methods abov
fjörður in Ice
.5% of the to
four spans ansioning cabled on concrete
tinuous girdre supported
bridge is divipans with a nt distributioernal ones.
.
size of the cks for thatminimum wiorts.
between the conventional
e should be ce should alsobecomes:
en with the
shear forces a
ve, can be see
eland
otal cost of s
nd concrete es. The total e piles.
ders. The brion concrete
ided into foulength of 3
n. That is ac
girders. Thet specific syidth, b, of 10
span lengthl cast-in-placonsidered beo be chosen
e following
and moment
en in figure 4
structural
columns width of
idge is a columns
ur smaller 7 m, see
chieved if
e chosen ystem are 080 mm.
h and the ce girder ecause of
so there
method,
ts.
4-3.

4.4.3 MaximuTo estimhas to bloads haTo find figure 4-
The GD
And the
Des
Supports um load on amate the mosbe determineave to be loc
GDF, the m-4.
Fs for the tw
following tr
ign of a 170
Figu
a column wost unfavorab
ed. GDF tellscated in the mmoment is ca
Figure
wo traffic loa
raffic loads th
m long bridg
ure 4-3: The cr
ould be whenble load actins how the trmost unfavoalculated aro
e 4-4: Location
ds, axle and = 1,37= 1hat act on on
ge over the f
11
ross-section at
n the given tng on a singraffic load israble positio
ound B with
n of traffic load
distributed l7 For the ta1,16 For U
ne beam are:
fjord Þorskaf
preliminary st
traffic load igle beam the s distributed on on the bri
the lever ar
ds to determine
oads, are det
andem system
DL system
fjörður in Ice
tage.
s located as girder distribetween the
idge deck in rm for each
e GDF.
termined to b
m
eland
shown in figibution factoe girders. Ththe lateral dload as disp
be:
gure 4-4. or (GDF) he traffic direction. played in
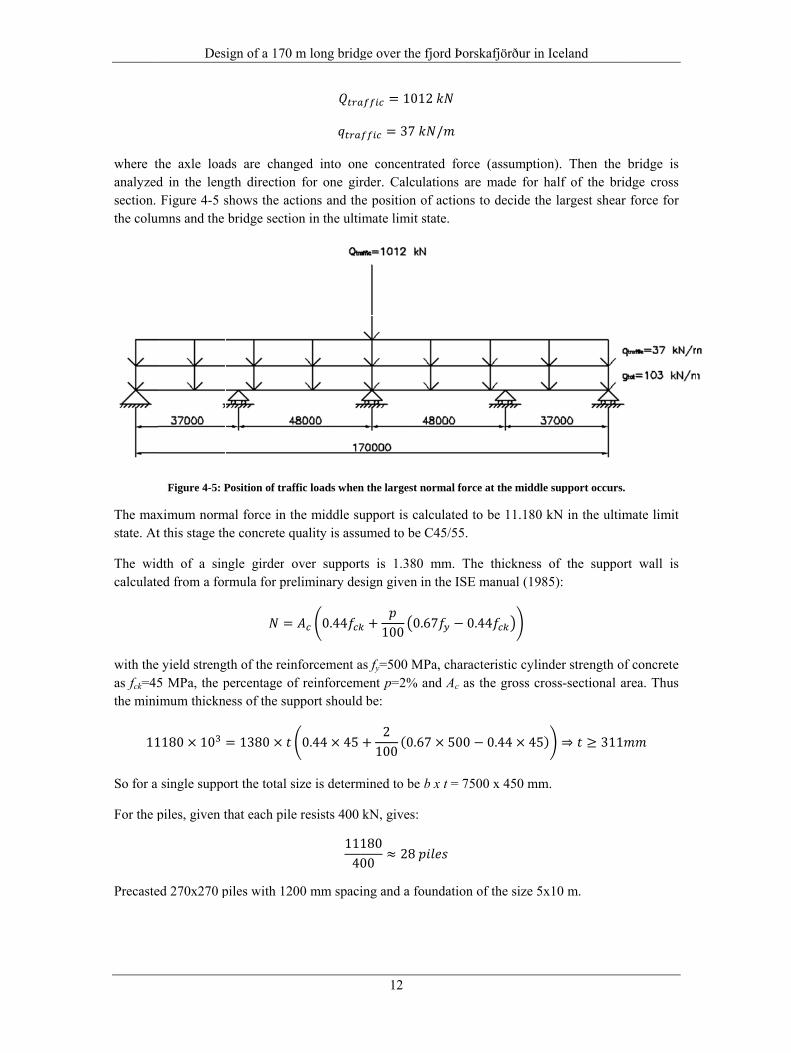
where thanalyzedsection. the colum
The maxstate. At
The widcalculate
with theas fck=45the mini
11So for a
For the p
Precaste
Des
he axle loadd in the lengFigure 4-5 smns and the
Figure 4-5: P
ximum normt this stage th
dth of a sined from a for
yield streng5 MPa, the pimum thickn
1180 10single suppo
piles, given t
ed 270x270 p
ign of a 170
ds are changth directionshows the acbridge sectio
Position of traf
mal force in the concrete q
ngle girder ormula for pre
=gth of the reinpercentage oess of the su
= 1380ort the total s
that each pile
piles with 12
m long bridg
nged into onn for one girctions and thon in the ulti
ffic loads when
the middle suquality is assu
over supporeliminary de
0.44nforcement a
of reinforcemupport should
0.44 45size is determ
e resists 400 11400 mm spaci
ge over the f
12
= 1012= 37 ne concentrarder. Calcula
he position oimate limit st
n the largest no
upport is calumed to be C
rts is 1.380 sign given in
+ 100 0.6as fy=500 MP
ment p=2% ad be:
+ 2100 (0.67mined to be b
kN, gives: 18000 28 ing and a fou
fjord Þorskaf
2 /
ated force (aations are mf actions to tate.
ormal force at
lculated to beC45/55.
mm. The thn the ISE ma
67 − 0.44Pa, characterand Ac as the
7 500 − 0b x t = 7500 x
undation of t
fjörður in Ice
assumption).made for half
decide the la
the middle sup
e 11.180 kN
hickness of anual (1985):
istic cylindere gross cross
.44 45) ⇒x 450 mm.
the size 5x10
eland
Then the bf of the bridargest shear
pport occurs.
N in the ultim
the support:
r strength of -sectional ar
⇒ ≥ 311
0 m.
bridge is dge cross force for
mate limit
t wall is
f concrete rea. Thus

Design of a 170 m long bridge over the fjord Þorskafjörður in Iceland
13
4.4.4 Construction The construction method of a concrete girder bridge is relatively easy to perform. Concrete girder bridges are one of the most common bridges in Iceland. This bridge alternative is often chosen for similar conditions as are in this case because of economic and constructional reasons, that is, when a shallow fjord is to be crossed.
Supports and columns below the superstructure will be constructed first. They will be founded on piles. Since the level of sea depth at is shallow at the construction site the superstructure of the bridge will be casted in forms that are supported on a temporary filling under the bridge. The filling will finally be removed when the concrete has hardened and can then be used as road material.
4.4.5 Cost estimation/conclusions To estimate the cost of this bridge type a method from Menn (1986) is used. The following is an explanation of this method.
The superstructure’s costs can be reliably estimated with the help of the geometrical average span length, lm, defined as:
= ∑∑
where li is the length of span i.
The empirical equations given below give the quantities of concrete, reinforcing steel, and prestressing steel as functions of lm and have been derived from samples of recently constructed bridges.
By this method the volume of concrete in the whole superstructure is obtained by multiplying the total deck surface by the effective girder depth, hm, defined by the following expression: ℎ = 0.35 + 0.0045 ∙
where hm and lm are in meters. This equation is valid provided the actual girder depth, h, satisfies the following inequality: 120 ≤ ℎ ≤ 116
which fulfills the criteria used earlier, l/h=20. The quantity of reinforcing steel is obtained by multiplying the total volume of concrete by the mass of steel per unit volume of concrete, ms. The parameter ms is estimated using the equation: = 90 + 0.35 ∙
where lm is in meters and ms is in kilograms per cubic meter of concrete (kg/m3). This expression is valid provided the deck slab is not transversely prestressed. Between 65 and 70 kg/m3 of reinforcement is required for stability during construction and crack control; this quantity is independent of span length, see Menn (1986). The transverse reinforcement required to resist loads is primarily a function of cross-section dimensions. An additional 20 to 25 kg/m3 is required for commonly used cross-sections, regardless of span length. Most of the steel required above the

minimumattention
The maconstrucequation
where lm
girders multiply
The estiobtained(scaffold(temporainto accomaterialfalseworsea leveincreaseestimate
Here is ois a tabcalculati
Des
m 65 to 70 kn in the desig
ss of prestrection methodn:
m is in meterthat are no
ying mp by th
imated cost d by multiplding systemary structureount the propl costs, anotrk and formwl the cost pe
ed. These vaed using table
Table 4
only listed thble that sumions as well
ign of a 170
kg/m3 is locagn and arrang
essing steel d. For girders
s and mp is iot transversehe total volum
of concretelying the es
ms that are ue used to retposed constrther construwork costs yiercentage of alues are choe 4-3, from M
4-3: Table from
he quantity omarizes thoas the empiri
m long bridg
ated in the dgement of th
per unit vos that are cas
in kilogramsely prestressme of concre
e, reinforcinstimated quaused to temtain unhardenruction sequeuction methoields the totathe total cos
osen to be 2Menn (1986)
m Menn (1986)
of super- andse results. Tical equation
ge over the f
14
deck slab. Thhe superstruct
lume of consted on conv
= 0.4 ∙s per cubic med. The qu
ete.
ng steel andantities withmporarily suned concrete
ence; if it is god should bal superstructst of those st5% and 23%
).
) to estimate co
d substructureThese quantins above. The
fjord Þorskaf
he deck slab ture reinforc
ncrete, mp, iventional fals
meter of concuantity of pr
d prestressinunit materi
upport permae until hardegreater than 6be considereture cost. Sintructural part% respective
osts for variou
e materials thities are acqe calculated
fjörður in Ice
should thereement.
s a functionsework, mp i
crete. This exrestressing s
ng steel in tial costs. Thanent structuened) should65 percent o
ed. Adding nce abutmentts as well as ely. The rem
us structural el
hat will be dquired basedquantities ar
eland
efore be the
n of span lens estimated u
xpression is steel is obta
the superstruhe cost of fures) and fo
d be estimatef the superstthe bridge ts and piers afalsework/fo
maining cost
lements.
determined and on the prere given in ta
focus of
ngth and using the
valid for ained by
ucture is falsework formwork ed taking tructure´s material, are under
formwork ts can be
nd below eliminary able 4-4.

For the fsub- andcost for
This resutype of bISK/SEK
Des
T
figures givend superstructthis bridge ty
ult is consistbridge was 6K. Note that
ign of a 170
Table 4-4: Amo
n in table 4-4ture and the type the total
tent with a d638.500.000 this draft ass
F
m long bridg
ounts of structu
4, abutments total cost basvalues for th
Table 4-5: T
draft for this pISK which isumes the tot
Figure 4-6: An
ge over the f
15
ural materials
and columnsed on the prhe structural
Total cost of br
project madeis around 38tal length of
n overview of th
fjord Þorskaf
for the concre
s are includerice values felements are
ridge type 1.
e by ICERA.700.000 SE
f 182 m inste
he beam bridg
fjörður in Ice
ete beam bridg
ed. Below is from section e doubled.
where the eEK with the e
ad of 170 m.
e.
eland
ge.
a table with 4.3 and to g
estimated cosexchange rat.
prices of get a total
st for this e of 16.5

4.5 TBridge tEach arcwill be odeck wilmain girwhich arthe main
4.5.1 The chochosen bwhich wconditio
To conna drawin
To deterdetermin
Des
The arch btype no. 2 is ch will be ofof zero hingell be of comrders with shre connected
n girders, see
Geometry oice of the rbetween 4 an
would result ons on site (n
nect the deckng of the stru
rmine the sened accordin
ign of a 170
bridge a conventio
f a steel box ed type with
mposite steel/chear studs. Td to the arche figure 4-7.
F
for type 2 rise of the and 8 see, Loin less horiz
no rock – only
k to the arch uctural mode
Figur
ction forces ng to figure 4
m long bridg
nal steel arccross-sectioX-bracing bconcrete. In
To connect thhes with hang
igure 4-7: A cr
rch is basedoretsen and Szontal reactiy sediment s
= 4 ⇒vertical steel of the bridg
e 4-8: A struct
in the arche4-9.
ge over the f
16
h bridge witon with steelbetween the a
the longitudhe two maingers. A reinf
ross-section of
d on the ratiSundquist (19ion forces. Tsoil layers). T
⇒ = 174l wire hangege.
tural model of
es the GDF n
fjord Þorskaf
th two separastiffeners in
arches to incdinal direction girders therforced concr
the bridge dec
io between s995). This ra
This ratio is That results i704 = 42,5 ers with c/c 2
the tied arch b
needs to be
fjörður in Ice
ate arches abnside, see figrease lateral
on of the bridre will be trarete slab wil
ck.
span and risatio is in thissuitable becn
25 m are cho
bridge.
determined a
eland
bove the bridgure 4-11. Th
stiffness. Thdge there wiansversal stel be casted o
e which is gs case chosencause of geot
osen. On figu
again. The G
dge deck. he arches he bridge ll be two el beams on top of
generally n to be 4 technical
ure 4-8 is
GDFs are

The follo
And the
4.5.2 To desiginvestigamoving moment
Des
owing GDFs
following tr
Arch gn the arch tated: abutmea point load
t, shear force
ign of a 170
Figure 4
s are acquire
raffic loads th
the influenceent, ¼ of thed of 100 kN
e and normal
m long bridg
4-9: Position of
d: = 1,13= 1hat act on on
e lines for the arch and tN in 10 m i
force. Thes
ge over the f
17
f traffic loads w
3 For the ta1,00 For U
ne girder are:= 694= 27 he arch needhe middle. Iintervals ovese influence d
fjord Þorskaf
when calculati
andem system
DL system
: 4 /
d to be determInfluence liner the deck diagrams can
fjörður in Ice
ing GDF.
m
mined. 3 secnes for each in the longi
n be seen in f
eland
ctions in the section are
itudinal direfigure 4-10.
arch are made by ction for

Design of a 170 m long bridge over the fjord Þorskafjörður in Iceland
18
Figure 4-10: Influence lines for various section forces at most critical placements.
To calculate the important section forces for design of the cross section of the arch the traffic loads are placed on the most unfavorable position corresponding to these influence diagrams in a program called PCFrame. PCFrame is a commercial program for structural analysis of frames.
Cross Section To design the arch in the ultimate limit state the section forces are required. The highest moment in the arch is reached when the traffic load is located in the middle of the span. The position of the point load at the first quarter of the span gave the highest normal force. So these corresponding section forces are used to design the cross section and are shown in table 4-6.
-1.00
-0.50
0.00
0.50
1.00
0.00 0.20 0.40 0.60 0.80 1.00
M
x/L
Influence Lines for Moment in the Arch
Abutment 1/4 of span
Middle of the span
-1.00
-0.50
0.00
0.50
1.00
0.00 0.20 0.40 0.60 0.80 1.00
V
x/L
Influence Lines for Shear Force in the Arch
Abutment 1/4 of span
Middle of the span
-1.00
-0.50
0.00
0.50
1.00
0.00 0.20 0.40 0.60 0.80 1.00
N
x/L
Influence Lines for Normal Force in the Arch
Abutment 1/4 of span
Middle of the span

The mat
The follodirection
The crodimensioA.
StabilityTo checwell as wload and
Des
terial qualitie
owing cross-n and resistan
oss-section ions of the cr
y ck for stabiliwith the helpd the maximu
ign of a 170
T
es of the stee
-section was nce, see figu
F
s a welded ross section (
ity in longitup of PCFramum normal f
m long bridg
Table 4-6: Des
el are given in
Table 4-7:
determinedure 4-11:
Figure 4-11: Ch
box section(moment of
udinal directme. To fulfillforce needs to
ge over the f
19
sign section for
n table 4-7.
Material quali
after few tria
hosen cross-sec
n with trapeinertia, secti
tion two invel the requiremo be in the ra
fjord Þorskaf
rces in the arch
ities of steel.
als with resp
ction of the arc
ezoidal stiffeion modulus
estigations aments for staange from 4
fjörður in Ice
h.
pect to stabili
ch.
feners. Furthetc.) can be
are made; caability the rato 5, see Lo
eland
ity in the lon
her details aseen in the a
alculation bytio between
oretsen and S
ngitudinal
about the appendix
y hand as buckling
Sundquist

(1995). critical b
where S case S isdetermin
From anwell widetermin
EC3 givis given
with Nd
Here χ is
with e
and α, astronger
, the no
Des
To calculatebuckling load
S is the one-hs 98525 mm ned to be 458
nalysis in PCith the calcnation of the
ves another min section 5.
as the design
s the reductio
equal to
an imperfectir axis and a w
on-dimension
ign of a 170
e the bucklind is given as
half length ofand k is 0.70
845 kN and t
CFrame for thculations by
cross section
Fi
method to de.5.1 in EC3.
n normal forc
on factor for
ion factor, owelded box s
nal slenderne
m long bridg
ng load by ha:
f the arch and0 for a fixedthe ratio betw
his case this y hand. Then. The buckl
igure 4-12: Bu
etermine the EC3 defines
ce and the ca
.r the relevant
= += 0,5
obtained fromsection with b
ess, is define
ge over the f
20
and formulas
= ( )d k is the effed arch with a ween the buc
= 4.8
factor is deteese calculatiling mode sh
uckling mode sh
buckling ress the followin≤ .apacity of the=t buckling m1− ,
1 + − 0m an appropb/tf<30, α be= 0.49ed as
fjord Þorskaf
s presented b
)
ective lengthrise-span rat
ckling load an
ermined to bions were t
hape for this
hape of the arc
sistance criteng criteria:
e cross-sectio/
ode and is de
10,2 +
riate bucklincomes
fjörður in Ice
by Austin (1
h factor, see Atio as 0.25. Fnd the maxim
be 5.0. That mthe most crarch is show
ch.
eria for comp
on, Nb.Rd , as
efined as
ng curve. Fo
eland
971) were u
Austin (1971For these valmum normal
matches consritical ones
wn in figure 4
pressed mem
or buckling a
used. The
1). In this lues Pe is l force is
siderably for the
4-12.
mbers and
about the

where βA
In this c
Table 4-
It can bearch.
CompreTo detedetermin
In this c
The cros
Here, Np
and Wpl factor isseen in aforce are
The resu
Des
A is dependin
ase βA is equ
-8 summarize
e seen in tabl
ession and ermine the cned. To decid
case the cros
ss-section ca
Npl.Rd is the plthe plastic s defined as appendix A. e made accor
ults of this an
ign of a 170
ng on the cro
ual to 1. For r
es the results
Table
le 4-8 that th
bending cacompression de the cross
s section cla
apacities are d
lastic designsection modu= 1,1 inNext a chec
rding to secti
nalysis are su
m long bridg
=oss-section a= 1 for Cl= /resistance of
s of this anal
e 4-8: Criteria
he buckling re
pacities and bendin
section class
ass is determi
defined in EC
.n resistance fulus. For res
n section 5.1.ck for bendinion 5.4 in EC
.ummarized in
ge over the f
21
= /s below:
lass 1, 2 or 3
for Class 4
f member to = 1,1ysis.
for buckling r
esistance is w
ng capacities plastic stres
ined to be 1.
C3 in section
. = /= /for compresssistance of C1 in EC3. Th
ng moment, cC3. The follo≤ .≤ .+ .n table 4-9.
fjord Þorskaf
,
cross sectio
4 cross sectio
buckling the
resistance from
well above th
es the class ss distributio
ns 5.4.4 and
/
sion, Mpl.Rd thClass 1, 2 or he calculatiocompression owing design
Ben
Com
≤ 1 Com
fjörður in Ice
ons
ons
e safety facto
m EC3.
he calculated
of the croson is assumed
5.4.5 respect
he plastic re3 cross-sect
ons for Npl.Rd,and combin
n criteria are
nding
mpression
mbined bend
eland
or is
d normal forc
ss-section had.
tively as
esistance for tion the parti Mpl.Rd and W
ned bending achecked:
ing and axia
ces in the
as to be
bending ial safety
Wpl can be and axial
l force

All the cso small
4.5.3 The bridwork aswill only
TransveThe tranloading them. Thmomentcross-se
Figure 4
The highthese secgiven in
Des
criteria are ful and are ther
Bridge Decdge deck wi composite dy make the st
ersal beamsnsversal beamfor these behese positiont and shear ction in the u
4-13: Positions
hest momentction forces
n sections 5.4
ign of a 170
Tabl
ulfilled. Alsorefore neglec
ck ill consist ofdeck with sttructure mor
s ms will be m
eams will bens are show iforce in the ultimate limi
s of traffic load
t and shear fothe cross-sec
4.5 and 5.4.6 ≤
m long bridg
le 4-9: Design v
o, the cross-scted. The arc
f main steel teel shear sture rigid. Estim
made of stee when the ain figure 4-1transversal
it state.
ds and shear- a
force are detection can be in EC3 as
. =
ge over the f
22
values and resi
section is assch is mostly i
girders, tranuds. The commated thickn
el and will axle load fro13. This locat
beams. The
and moment didetermined.
ermined to bdetermined.
/
fjord Þorskaf
istance for the
sumed to resin compressi
nsversal beammposite effeness of the co
be placed wom the traffiction of the ax
ese section f
iagrams when
e 3025 kNm The design
For class 1 o
fjörður in Ice
arch.
ist the shear on.
ms and concct is not cal
oncrete slab i
with 5 m spac is placed exle load willforces are us
the cross-secti
m and 1359 kNcriteria for s
or 2 cross sec
eland
forces since
crete slab. Tculated hereis 200 mm.
acing. Worstexactly abovl generate thsed to determ
ions of cross be
N respectiveshear- and m
ctions
e they are
They will e but that
t case of ve one of e highest mine the
eams are
ely. From moment is

where thbeams is
Main giThe maihangers.7241 kNthe trancalculati
4.5.4 The hanhangers ultimateexactly carbon s
4.5.5 The chothe X-tyanalyzed
Des
he parameters shown in fi
rders in girders w. The largest
Nm respectivnsversal beaions can be s
Hangers ngers are the
are designee limit state. at hanger nu
steel with the
Transversaoice of X-typype, see Bund as a truss sy
ign of a 170
rs are explainigure 4-14. F
Fi
will be connet shear force
vely. Here thems. The de
seen in appen
Fig
elements thed to resist t
This force umber 1 cloe design yield
al Bracing e bracing ratnner and Wrystem. Later
m long bridg
ned in the lasFor detailed c
igure 4-14: Est
ected to the te and momene same criteretermined crndix A.
gure 4-15: Dete
hat connect thhe largest teis acquired
osest to the d strength as
ther than Vieright (2006)ral braces wi
ge over the f
23
≤ . =st section. Thcalculations,
timated size of
transversal bnt in the mairia are checkross-section
ermined size of
he bridge deension force,when the axsupport. The
s 3605 kN.
erendeel brac, which resull not be calc
fjord Þorskaf
(√ )/he determinesee appendix
f the cross beam
beams whichin girders ar
ked, shear- ancan be see
f the main gird
eck to the arc, which is dxle force froe chosen ma
cing is that thults in less lculated at thi
fjörður in Ice
ed cross-sectx A.
ms.
h are hanginre determinednd moment ren in figure
ders.
ch. They aredetermined toom the traffaterial of the
he system wilateral deflecis time.
eland
tion of the tra
ng from the ad to be 2087resistance, ase 4-15 and
e vertical cabo be 3393 kfic load is poese hangers
ill be more rctions and w
ansversal
arches in 7 kN and s was for
detailed
bles. The kN in the ositioned is M100
igid with would be

4.5.6 The soilconcrete(2010). length oestimate
for eachbe 35 pifundamesupport direction
4.5.7 My propFirst, foube placesegmentsegmentplaced in
Next thebeams thwelded casted.
4.5.8 In table quantitieon the m
Des
Foundatiol under the e piles that wThe piles wi
of the piles wed amount of
h arch. The spiles under eacent itself. Ththe fundam
n and the app
Constructiposal of a coundations foed under thets, sizes that t at a time, sun right positi
e deck is cohat are hangtogether and
Cost estim4-10 the to
es are based method in sec
ign of a 170
ns foundations
will be driveill have an in
will be 14 m.f piles is
pacing betwech abutmenthe filling beh
ments. A conproximate siz
Fig
ion onstruction mr the arches
e bridge. Theare possible
upported by ions the temp
onstructed. Tging in the had finally, wh
mation/conctal quantity on the preli
ction 4.4.2 fo
m long bridg
s is sedimenen down to nclination do. The largest
124een the piles. The piles whind the brid
ntinuous founze of it will b
gure 4-16: Plac
method for thwill be consten the archee to transporfalsework stporary worki
The main girangers. The
hen all the w
clusions of materialsminary calcu
or bridge type
ge over the f
24
nt layers. Ththe ground.
own in the dit reaction for
60100 32 will be 1.2
will also be adge will alsondation is chbe 7.2 x 4 x 1
cing of piles at
his bridge typtructed and t
es will be rart. These segtanding on thing plane is r
rders come hangers con
work with the
s for the arculations. Thee one. These
fjord Þorskaf
he foundatioEach pile r
irection to thrce in the arc
m. The totalable to resist o be able to hosen under16.8 m, see f
the arch suppo
pe is similarthen a tempoaised. Each agments will bhe working premoved and
in segmentsnnect the arche structural s
hes and bride cost estimae cost figures
fjörður in Ice
n will be foresists about he arch’s direch’s direction
number of pthe risk of turesist some
r the whole figure 4-16.
orts.
r to the methorary workingarch will be be welded toplane. When d can be used
s and are cohes to the desteel is done
dge deck areation for the s are given in
eland
ounded on p400 kN, Ha
ection. The en is 12601 k
piles is deterurning alongexternal actbridge in th
hod for bridgg plane of grdivided into
ogether in stethe arches h
d as a road fil
onnected to teck. Each se, the concret
e summarizefoundations
n table 4-11.
precasted afliðason estimated kN so the
rmined to g with the tions and he lateral
ge type 1. ravel will o several eps, each
have been lling.
the cross egment is te slab is
ed. These is based

To get a
This bridsteel cos
Des
a total cost th
dge type is lst and compl
ign of a 170
Table 4-10:
he total mater
little less thaexity of the s
F
m long bridg
Quantities of
rial cost is do
Table 4-11:
an twice as exstructure. An
Figure 4-17: An
ge over the f
25
structural mat
oubled, whic
Total cost of b
xpensive as n overview o
n overview of t
fjord Þorskaf
terials for the
ch is a rough
bridge type 2.
the first bridof the arch br
the arch bridg
fjörður in Ice
arch bridge.
estimation.
dge type. Thiridge can be
ge.
eland
is mainly depseen in figur
pends on re 4-17.

4.6 TBridge tpylons steel/conabout thcable-sta
4.6.1 Bridge tcable stconfigur4-20. Thstabilize
Nowadaorthotrop
Many cofor concconstrucconstrucyard. Thweight obecause
A propeHoweveexcept fconcrete
AlthougcomposicomposiMost poHoweveend span
In this conditiothere is transferrand a cocable sy
Des
The cable-type no. 3 ison each sidncrete deck.
he choice of tayed bridges
Aestheticstype no. 3 istayed bridgerations, see fhe pylons caed by the cab
ays the pylonpic or as a co
oncrete cablecrete cable-stction is a fction it is pohe segments,of the segmeit is stiffer a
erly designeder, with incrfor very longe. Thus the re
gh the steel orite deck witite with the ortions of ther, tensile strns. Post-tensi
a self-anchoons on site, th
a so called red to the suombination
ystem can be
ign of a 170
-stayed bs a back and de, similar The cross s
the superstrus are discusse
s of cable-ss a cable stay is to be defigure 4-18. Tan either be
bles that are a
Figure 4-18
ns are most omposite ste
e-stayed bridtayed bridge
further deveossible to use, however, shent is limitedand easier to
d and fabricreasing laborg spans. Theeduced self-w
rthotropic deth a concretesteel girder he girder arresses may oioning is usu
oring systemhe foundationearth anchor
upports at thof self-anchseen on figu
m long bridg
bridge front cable-to the Öres
section of thucture is in thed.
stayed bridyed bridge. Tesigned. TheThe number rigid, work
anchored into
: Configuratio
often madeel/concrete d
dges have bees: cast-in-plelopment of e a more comhould all be d by the tranerect.
cated orthotrr costs, the use of steelweight of the
eck is too expe slab on a by shear stu
re under higoccur in the mually used in
m is preferans will be bered system we ends of thoring and ea
ure 4-19.
ge over the f
26
-stayed bridgsund bridge
he deck is sihe next chap
dges There are see cables canof spans can
k as a cantileo the ground
ons of the cable
e of concretedeck.
een built. In lace construc
the free camplicated crosimilar to av
nsportation c
ropic deck isorthotropic
l in the decke deck slab m
pensive for csteel frame
uds reduces gh compressmiddle portiothese areas t
able, see figelow sea levewhere the ho
he bridge wharth anchorin
fjord Þorskaf
ge, see figuree. The bridgimilar to bridpter where ae
everal types n be arrangen either be twever, or the
d.
es for cable-sta
e. The deck
general, thection or precantilever cooss-section bvoid adjustmcapability. B
s a good soldeck becom
k is, today, twmust result in
construction can be very
the steel quasion, which on of the cento keep the c
gure 4-19. Tel and sedimorizontal comhich requiresng system. T
fjörður in Ice
e 4-21. Thisge will condge type 2. esthetics and
that can comed in a harpwo or three, deck is stif
ayed bridges.
k can be mad
ere are two ccast construconstruction mbecause prec
ment in the pBox is the pr
lution for a mes less comwo to four ti
n appreciable
in most couny competitivantity of theis good for
nter span anconcrete unde
That dependment layers ar
mponents of favorable foThe principl
eland
bridge typesist of a coA further di
d structural s
me into mindp-, fan- or c
see figures ff and the py
de of concre
construction ction. A castmethod. Forcasting is donprecasting forreferred cros
cable-stayedmmercially aimes as expe
e savings.
ntries at this ve. Making e girder signr concrete m
nd at both ener compressi
s on the fore the main sf the cable fofoundation cole of a self-a
e has two omposite iscussion
system of
d when a combined 4-19 and ylons are
ete, steel
methods t-in-place r precast ne in the rms. The s section
d bridge. attractive ensive as
time, the the deck
nificantly. members. nds of the ion.
oundation soil. Also orces are onditions anchored

Let us cobe a gooseen on
But, an a self-an
4.6.2 Based oHere, a hand delithe viewin the pyThe outestays womodelleanalysis two pylbridge dhorizont
4.6.3 In this se
Des
onsider an asod choice witfigure 4-20.
asymmetricanchoring syst
Geometry on the discusharp shape ccate appeara
wing angle. Itylon begin aer spans lengon’t exceed d in SAP200 of structuresons are conndeck to eachtal.
Design ection the ele
ign of a 170
symmetricalth respect to
al system hatem.
for type 3 ssion above configurationance becauset also allows
at a lower elegths should bits limits. Fi
00 for 3D anas. The deck, nected togeth pylon. Eac
ements in the
m long bridg
Figure 4-1
system withfoundation c
Figure 4-2
s earth-anch
self-anchorin of the cablee an array of an earlier stevation so thbe around 30igure 4-21 dalysis. SAP2see figure 4-
ther with onch cable wil
Figure 4-21
e following t
ge over the f
27
19: Self anchor
h only one pyconstruction
20: Asymmetri
ored cables
ing cable syes is chosen.parallel cabl
tart of the dehat fastening 0-40% of theisplays the g
2000 is a com-26, is 10 m
ne cross-beamll be connec
1: Model for br
table will be
fjord Þorskaf
red system.
ylon as can bn. An exampl
ical system.
and requires
ystem is pref Harp shape les will alwa
eck constructof cables ca
e main spangeometry ofmmercial fini
wide with fom for stabilcted to trans
ridge type 3.
checked in t
fjörður in Ice
be seen in figle of that stru
s better found
ferable in thconfiguratio
ays appear pation because an start beforlength so thethe chosen m
ite element pour pylons, twity. Ten cab
sversal beam
the ultimate
eland
gure 4-19. Thuctural system
dation condi
his specific son offers a vearallel irrespthe cable an
re the pylon e stresses in model. The
program for swo on each s
bles will conms with 30°
limit state.
hat could m can be
tion than
situation. ery clean
pective of nchorages
is ready. the back bridge is structural side. The nnect the angle to

To begielementstraffic lois movedisplayeindicate
Des
in with the s of the bridoads are placd in 5 m inc
ed for those the position
ign of a 170
Tab
necessary sge that are u
ced by using crements alon
parts of theof the pylon
m long bridg
ble 4-12: Eleme
section forceunder investithese influenng the bridge bridge thatns.
ge over the f
28
ents that will b
es and reactgation. SAP2nce lines. To
ge deck. On ft will be an
fjord Þorskaf
be checked in U
tions are de2000 is used
o create influfigures 4-22
nalyzed at th
fjörður in Ice
ULS.
etermined fod to create inuence lines a
to 4-24 are his stage. Th
eland
or the corresnfluence linepoint load othese influe
he dark verti
sponding s and the f 100 kN nce lines ical lines

Design of a 170 m long bridge over the fjord Þorskafjörður in Iceland
29
Figure 4-22: Influence lines for moments in the deck and at pylon supports.
-1.00-0.90-0.80-0.70-0.60-0.50-0.40-0.30-0.20-0.100.000.100.200.300.400.500.600.700.800.901.00
0.00 0.10 0.20 0.30 0.40 0.50 0.60 0.70 0.80 0.90 1.00
M
x/L
Influence Lines for Moment in the main girders
@Pylon Center
-1.00-0.90-0.80-0.70-0.60-0.50-0.40-0.30-0.20-0.100.000.100.200.300.400.500.600.700.800.901.00
0.00 0.10 0.20 0.30 0.40 0.50 0.60 0.70 0.80 0.90 1.00
M
x/L
Influence Lines for Moment in Pylon Supports
Left Pylon Right Pylon

Design of a 170 m long bridge over the fjord Þorskafjörður in Iceland
30
Figure 4-23: Influence lines for normal forces in pylon support and moment at 55% of the height of the pylons.
-1.00
-0.90
-0.80
-0.70
-0.60
-0.50
-0.40
-0.30
-0.20
-0.10
0.00
0.10
0.20
0.30
0.40
0.50
0.60
0.70
0.80
0.90
1.00
0.00 0.10 0.20 0.30 0.40 0.50 0.60 0.70 0.80 0.90 1.00
N
x/L
Influence Lines for Normal Force in Pylon Supports
Left Pylon Right Pylon
-1.00
-0.90
-0.80
-0.70
-0.60
-0.50
-0.40
-0.30
-0.20
-0.10
0.00
0.10
0.20
0.30
0.40
0.50
0.60
0.70
0.80
0.90
1.00
0.00 0.10 0.20 0.30 0.40 0.50 0.60 0.70 0.80 0.90 1.00
M
x/L
Moment in 55% of the Height of the Pylons
Left Pylon Right Pylon

Design of a 170 m long bridge over the fjord Þorskafjörður in Iceland
31
Figure 4-24: Influence lines for various parts of the structural system of the cable-stayed bridge.
After the influence lines have been created the bridge is modeled as a 3D model in SAP2000 with the forces positioned at the corresponding positions. The slab is modeled as area section elements with a meshing of 0.5 m so that the axle traffic loads can be positioned right. Main girders and cross beams in the bridge deck are modeled as frame elements as well as the pylons. The cables are modeled as cable elements with high tensional stiffness. The only supports of the model are the fixed supports under the pylons because the pylons and cables should be able to carry its self-weight under construction.
0.00
0.10
0.20
0.30
0.40
0.50
0.60
0.70
0.80
0.90
1.00
0.00 0.10 0.20 0.30 0.40 0.50 0.60 0.70 0.80 0.90 1.00
N
x/L
Axial Force in cables - Back Stays
Cable 1 Cable 2 Cable 3
Cable 4 Cable 5
0.00
0.10
0.20
0.30
0.40
0.50
0.60
0.70
0.80
0.90
1.00
0.00 0.10 0.20 0.30 0.40 0.50 0.60 0.70 0.80 0.90 1.00
N
x/L
Axial Force in cables - Front Stays
Cable 1 Cable 2 Cable 3
Cable 4 Cable 5

4.6.4
ConcreThe conconcreteshear stu
Cross BThe crodesignedloads for
When ththe crossof the flsee appe
Main GLargest span andreached is chosenthe widtcalculati
Des
Deck
te Slab ncrete slab we casted on suds will be w
Beams ss beams wd to resist thr the largest
Figu
he largest mos beams. Theanges is 300
endix A.
irder moment in td is determinwhen the tran. From thesth of the flanion, see appe
ign of a 170
will be 250 mite and a me
welded on cro
will be made he self-weighmoment can
ure 4-25: Posit
oment and she cross sectio
0 mm and the
the main girned to be 73affic loads arse design valnges is 400 mendix A. Figu
m long bridg
mm thick andetal deck benoss beams an
of steel andht of the co
n be seen in f
ion of the traff
hear force areon of the beae thickness o
rders is when11 kNm. Thre applied wlues the size mm and the ure 4-26 disp
ge over the f
32
d the concretneath of trapend main girde
d are placedncrete slab
figure 4-25.
fic loads to esti
e determinedam is I shapeof the web an
n the traffic he largest she
where the pyloof the girderthickness of
plays the cho
fjord Þorskaf
te quality is ezoidal profilers.
d in 5 m intand the traff
imate the size
d in ULS, it’sed with the tond flanges is
loads are apear force is dons are positr is determinf the web anosen bridge d
fjörður in Ice
C35/45. Theles. To achie
tervals alongffic loads. Lo
of the cross be
s possible to otal height of30 mm. For
pplied at the determined ttioned. An I-ned. The totand flanges is deck.
eland
e slab will ceve composit
g the deck. Tocation of th
eams.
determine thf 860 mm. Tr detailed cal
middle of thto be 1247 k-shaped crosal height is 130 mm. For
consist of te effects
They are he traffic
he size of The width lculation,
he bridge kN and is ss section 200 mm, r detailed

4.6.5 The pylC40/50. beams. normal determinpylons iinteractidesign pappendix
The cho
Des
Figure 4-26
Pylons lons will be
The towersEach pylon force were dned 1.5 x 2.0is determineion diagram tpoint for thex A.
sen cross-sec
N(k
N)
ign of a 170
6: Configuratio
a concrete s have two v
is designed determined t0 m with a wd to be 1.2 to estimate the above men
Figu
ction of the p
-30,000
-20,000
-10,000
0
10,000
20,000
30,000
40,000
50,000
60,000
70,000
0
N (k
N)
m long bridg
on of the deck
hollow sectivertical cable
for combinto be 27292 wall thicknes
x 2.0 m withe capacity ontioned sect
re 4-27: N-M i
pylon is show
5,000 10,
N
ge over the f
33
and girders w
ion. The cone planes andned moment
kNm and 5ss as 0.3 m. Tth a wall thiof the pylon.tion forces.
interaction dia
wn in figure
,000 15,000 2
M (kN
N-M Diagram
fjord Þorskaf
with shear studs
ncrete qualitd are connec
and normal5121 kN respThe size of tickness of 0 The star on Calculations
agram for the p
4-28.
20,000 25,000
Nm)
m
fjörður in Ice
s and trapezoi
ty in the pyted togetherl force. The pectively. Ththe cross-bea0.25 m. Figu
the inside ofs of the pylo
pylon.
0 30,000 35,0
eland
dal profiles.
lons is chosr with two tr
design momhe size of a ams that conure 4-27 disf the curve sons are disp
000
sen to be ransverse ment and
pylon is nnects the splays an hows the
played in

4.6.5.1 Where tmain girtension f2000 wi
Finally a
4.6.6 The founbridge tykN and pylon. T
4.6.7 The founpylon wthe deckconstrucmain girthe beammain girof the sp
Des
Cables the cables arrders. The cforce in the th tendon un
a model of th
Foundationdation undeypes. The lar27292 kNm
The fundamen
Constructindations are
will be construk can start wcted further urders and croms. Finally thrders weldedpan. This wa
ign of a 170
Figure 4
re connectedcables are mcables was d
nits as 6-61 w
he bridge tha
Figure 4-2
n er each pylonrgest vertical
m respectivelnt along with
ion to be constr
ucted up to awhere the decup. During toss-beams arhe slab is casd togeather uay, the struct
m long bridg
4-28: Cross sec
d to the bridgmodeled as cdetermined towith a design
at was constru
29: 3-D model
n will consisl reaction forly. That imph the piles is
ructed first. Aa height wheck is connecthis the crosre in place thsted. This pr
until the top rture works a
ge over the f
34
ction of the pyl
ge deck croscable elemeno be 15888 k
n capacity of
ucted in SAP
of the cable-st
st of concretrce and momplies that app
assumed to
After that, thre the lowestcted to the cs-beams arehe trapezoidaocess is donerow is reacheas a self-anch
fjord Þorskaf
lon with reinfo
ss beams arents with highkN. A propo17019 kN.
P2000 is disp
tayed bridge in
te footings anment under on
proximatelyresist the ris
he work witht cable is con
cables in seg also set in al profiles are for each caed and the dehored system
fjörður in Ice
orcement.
e placed to rh tensional sosal of a cabl
played in figu
n SAP2000.
nd cohesive ne pylon is d
13 piles arek for overtur
h the pylons nnected. The
gments meanplace. After
re fastened oable row witheck structure
m with the de
eland
reduce torsiostiffness. Thle system is V
ure 4-29.
piles as for determined toe needed unrning.
can start when the construnwhile the pyr the segmenon the upper h the segmene meets in theck hanging
on in the he largest VSL SSI
the other o be 5121 nder each
here each ruction of ylons are nts of the
edges of nts of the he middle
from the

cables ostayed b
Figure
4.6.8 The totaprice vasubstruccalculatibridge ty
Finally t
Des
on each side bridge in the w
4-30: The Ston
Cost estimal quantities alues given icture are lisions but the ype one.
T
the total cost
ign of a 170
of the pylonworld that di
necutters Brid
mation/concof materials in section 4.sted for the
cost estimat
Table 4-13: Am
t of this bridg
m long bridg
ns. Below, fisplays how
dge (currently t
clusions are summar3. In table 4 cost estimtion for the
mounts of struc
ge type is sum
Table 4-14:
ge over the f
35
figure 4-30, ithis principl
the largest cab
rized in table4-14 the mai
mation. Thesfoundations
ctural materia
mmarized in
Total cost of b
fjord Þorskaf
is an exampe works.
ble-stayed brid
e 4-13 and coin materials e quantitiesis based on
als for the cable
n the table 4-
bridge type 3.
fjörður in Ice
le from one
ge in the world
ost estimatioand quantiti are based
n the method
e-stayed bridg
14.
eland
of the large
d) under const
on made baseies of the su
on the pred in section
e.
est cable-
truction.
ed on the uper- and eliminary 4.4.2 for

This bridependsthere is qalso a la
Des
idge type is s on the samequite much q
arge factor. A
ign of a 170
little less the factors as fquantity of co
An overview
Figure 4-31
m long bridg
han three timfor bridge tyoncrete and rof the arch b
: An overview
ge over the f
36
mes as expeype 2, steel creinforcemenbridge can be
of my proposa
fjord Þorskaf
ensive as thcost and comnt that is usee seen in figu
al of a cable-st
fjörður in Ice
he first bridgmplexity of thed in the pyloure 4-31.
tayed bridge.
eland
ge type. Thihe structure. ons and the c
s mainly But also
cables are

Design of a 170 m long bridge over the fjord Þorskafjörður in Iceland
37
4.7 Summary and choice of bridge type From the total cost estimations for the bridge types it is clear that the cable-stayed bridge is the most expensive one. Also the arch bridge is quite expensive compared to the prestressed concrete bridge that is the least expensive one. From a construction point of view the prestressed bridge is also the most favorable. From these perspectives a concrete girder bridge is the obvious choice.
But, there are also other aspects that need to be taken into consideration when choosing a bridge type; aesthetics, method of construction and construction time are obvious factors that can affect which choice is made. The author will leave those decisions for others to make at later stages but chooses to design the concrete beam bridge in a more detailed manner. In the following chapter more detailed calculations will be performed for the superstructure of bridge type 1. Calculations of the post-tensioned cables are performed where the prestress force and eccentricity of the cable profile are determined. Following that all cable losses are determined and then the secondary effects of prestress. Finally the ultimate moment capacity is determined for relevant members of the superstructure.
Design of a 170 m long bridge over the fjord Þorskafjörður in Iceland
38
5 Final design
5.1 Introduction Prestressed concrete structures, using high-strength materials to improve serviceability and durability, are an attractive alternative for long-span bridges, and have been used worldwide since the 1950s. The presence of cracks that can develop in tensile members can lead to corrosion of the reinforcement due to its exposure to water and chemical contaminants. Corrosion is generally only a problem for structures in aggressive exterior environments (bridges, marine structures, etc.) and is not critical in the majority of buildings. The effect of cracking of members can lead to substantial loss in stiffness which occurs after cracking and the second moment of area of the cracked section is far less than the second moment of area before cracking. Thus, allowing cracks to develop can cause a large increase in the deformation of the member. For prestressed concrete, compressive stresses are introduced into a member to reduce or nullify the tensile stresses which result from bending due to the applied loads. The compressive stresses are generated in a member by tensioned steel anchored at the ends of the members and/or bonded to the concrete.
There are two types of prestressing systems: pre-tensioning and post-tensioning systems. Pre-tensioning systems are methods in which the strands are tensioned before the concrete is placed. This method is generally used for mass production of prefabricated members. Post-tensioning systems are methods in which the tendons are tensioned after concrete has reached a specified strength. This technique is often used in projects with very large elements. The main advantage of post-tensioning is its ability to post-tension cast-in-place members. Mechanical prestressing jacking is the most common method used in bridge structures.
The post-tensioning process involves three fundamental stages. In the first stage of the process, the concrete is cast around a hollow duct. After the concrete has set or hardened, a tendon, consisting of a number of strands, is pushed through the duct (alternatively, the tendon can be placed in the duct before casting). Thus, the tendon can be fixed in any desired linear or curved profile along the member. By varying the eccentricity of the tendon from the centroid, the maximum effectiveness of a constant prestressing force can be utilized by applying the prestress only where it is required. Once the concrete has achieved sufficient strength in compression, the tendon is jacked from one or both ends using hydraulic jacks, thus putting the concrete into compression. When the required level of prestress is achieved, the tendon is anchored at the ends of the member. After anchorage, the ducts are usually filled with grout under pressure. The grout is provided mainly to prevent corrosion of the tendon but it also forms a bond between the tendon and the concrete which reduces the dependence of the beam on the integrity of the anchor and hence improves its robustness.
When prestressed concrete elements are designed the following factors need to be considered:
• The prestressing reinforcement is determined by concrete stress limits under service load. • Bending and shear capacities are determined for the ultimate limit state • Deformations are determined in the serviceability limit state.

5.2 DThroughloads arthe girdemm.
5.2.1 The brid
• •
5.2.2 Self-weithe load
5.2.3 In this se
5.2.3.1 High strconcreteconcrete
The effedefinitioconstantEcm, is re
where φ
In this cconcrete
Des
Design hout the desie calculated ers is change
Building cdge shall be d
FS ENV 199FS ENV 199
Loading ight and trafgenerated by
Materials ection the m
Concreterength concre quality is e compressio
fects of creeon of creep t stress. To taeduced to an
is the creep
case, there ise is loaded is
ign of a 170
ign process, with respect
ed from what
odes designed acc
91 92
ffic loads arey prestressin
ost common
e rete is alwayC45/55. For
on strength is
ep need to bis that undeake account
n effective ela
coefficient.
Table 5-
s a humid at 28 days. Th
m long bridg
one girder it to that. Aftt was chosen
cording to the
Eurocode 1 Eurocode 2
e the same asng is taken in
n physical pro
ys used in por this qualitys fck=45 MPa
be taken inter compressifor creep in tastic modulu
φ is taken fr
-1: Creep coeff
tmospheric che circumfere
ge over the f
39
is designed wfter iteration n in chapter 4
e following s
(Loading) (Concrete D
s in the pre-dnto account.
operties of al
ost-tensionedy the modul. The self-we
to account fon the concthe design of
us, Ec,eff. Ec,eff
, = 1 +rom EC2 and
ficient, φ, for n
condition at tence of the se= 27700
fjord Þorskaf
with propertiof the calcu
4.4 with a he
standards:
Design)
design phase
ll materials u
d structural mlus of elastieight of reinf
for calculatiorete membef concrete mf is determine
d shown in ta
normal weight
the bridge siection, u, is:
fjörður in Ice
ies of half thlations in th
eight of 1800
e. But in this
used are sum
members. In city is Ecm=forced concr
on of long-tr will contra
members the med with the f
able 5-1.
concrete.
ite of 80% a
eland
he cross-sectis chapter th
0 mm instead
s detailed de
mmarized.
this case th=36000 MParete is 25 kN/
term deflectact with timmodulus of efollowing for
and the age w
tion. The he size of d of 2400
sign also
he chosen a and the /m3.
tion. The me due to elasticity, rmula:
when the

Design of a 170 m long bridge over the fjord Þorskafjörður in Iceland
40
The cross sectional area of the concrete is: = 6460000
The notional size is calculated to be: 2 = 466
which gives after interpolation the creep coefficient as φ =1.56, see table 5-1, and the effective modulus of elasticity is determined to Ec,eff=14066 MPa.
5.2.3.2 Reinforcement The quality of the reinforcement is chosen to be B500B with characteristic yield strength fyk=500 MPa.
5.2.3.3 Prestress system As mentioned in chapter 4 for bridge type 1, the prestressing system is VSL 6-31. All technical information concerning VSL systems are acquired from technical brochures published by VSL International Ltd. (2010). Each tendon consists of 28 strands each consisting of 7 wires with a diameter of 15.7 mm with a total nominal cross-section Ap=4200 mm2, where each strand has a nominal cross section of 150 mm2. The steel quality of the wires is fp0,1k/fpk=1640/1860 MPa. The breaking load of each tendon is 7812 kN. The cables will be placed before casting in a group around a centerline that counteracts the moment from the self-weight of the bridge. The cables will be anchored individually with conical devices at each end of the bridge. When the concrete has achieved sufficient strength large multi-cable hydraulic jacks are used at both ends of the bridge to prestress the structure. When the required level of prestress is achieved the tendons are anchored at each end of the member. After anchorage, the ducts around the tendons are filled with cement grout under pressure, called bonded tendons. The cement grout is provided mainly to prevent corrosion of the tendons, but also it forms bond in the integrity of the anchor and hence improves its robustness. The prestressing process will be done in that manner that first the two internal spans will be constructed and prestressed and then finally the two external spans will be constructed and prestressed. To simplify the calculations it is assumed that the cables are calculated as one element, stressed from both ends of the bridge.
5.2.4 Exposure classes and service life According to Eurocode 2 (EN 1992-1-1) a structure should be classified after environmental conditions, chemical and physical. This structure will be classified in the following classes:
• Corrosion induced by carbonation: XC4 • Corrosion induced by chlorides: XD3 • Corrosion induced by chlorides from sea water: XS3 • Freeze/Thaw Attack: XF4
These classifications give a structural class of S4 according to table 4.3N in EC2. For that class the minimum concrete cover for reinforcement steel is cmin,dur=45 mm and for prestressing steel cmin,dur=55 mm. Also, for post-tensioned members, the concrete cover should not be less than the diameter of the duct. In this case the external diameter of the duct is 117 mm. According to EC0, table 2.1, the service life (indicative design working life) for bridges is 100 years.
5.2.5 Tendon alignment and prestress force The position of the centroid of the tendons should be chosen to give the highest effective depth. The alignment is based on concrete cover, the number and size of the tendons, the size of the cable ducts
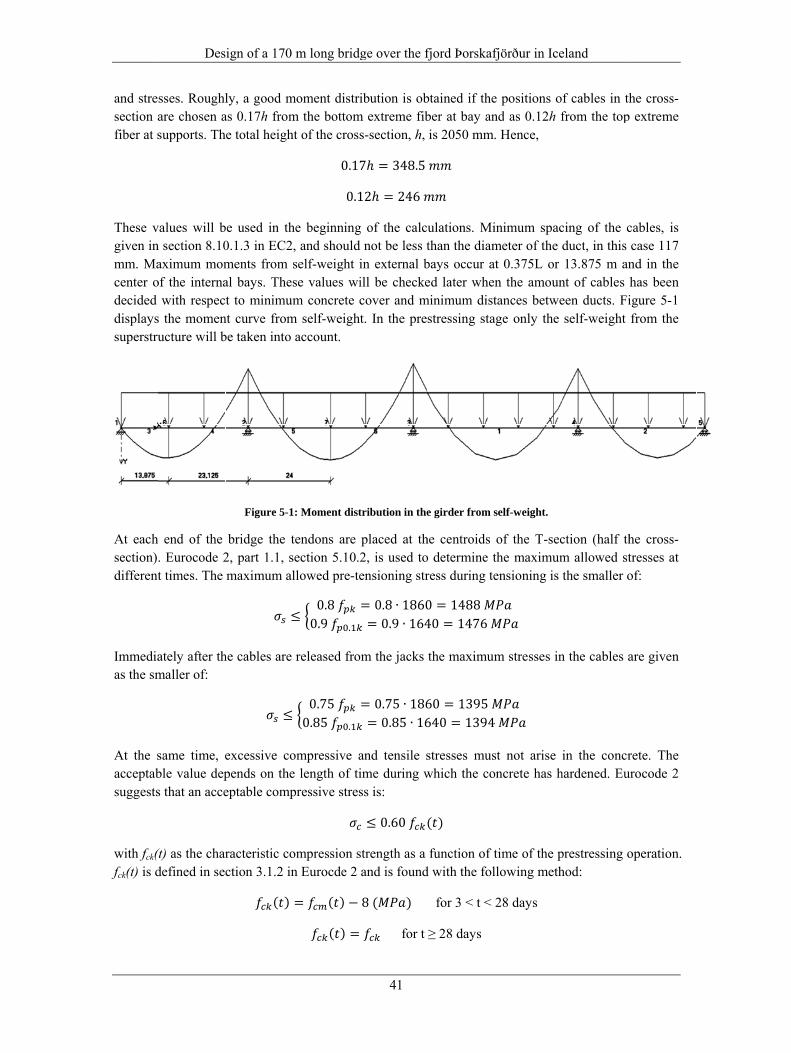
and stresection afiber at s
These vgiven inmm. Macenter odecided displayssuperstru
At each section)different
Immediaas the sm
At the sacceptabsuggests
with fck(fck(t) is d
Des
sses. Roughlare chosen asupports. Th
values will bn section 8.10aximum momof the interna
with respecs the momenucture will b
end of the . Eurocode 2t times. The
ately after thmaller of:
same time, eble value deps that an acce
(t) as the chardefined in sec
ign of a 170
ly, a good mas 0.17h frome total heigh
be used in th0.1.3 in EC2ments from al bays. Thest to minimum
nt curve frombe taken into
Figure 5-1
bridge the t2, part 1.1, smaximum al
≤he cables are
≤excessive copends on theeptable comp
racteristic coction 3.1.2 in( )
m long bridg
moment distrim the bottomht of the cross0.170.1he beginning, and shouldself-weight ise values wim concrete c
m self-weightaccount.
1: Moment dist
tendons are section 5.10.2llowed pre-te
≤ 0.8 0.9 .released fro
0.75 0.85 .ompressive ae length of tipressive stres
ompression sn Eurocde 2 = ( ) −( ) =
ge over the f
41
ibution is obm extreme fibs-section, h, 7ℎ = 348.512ℎ = 246
g of the calcnot be less t
in external bill be checkecover and mt. In the pre
tribution in the
placed at th2, is used toensioning str= 0.8 ∙ 1860= 0.9 ∙ 164
om the jacks
= 0.75 ∙ 186= 0.85 ∙ 16and tensile sime during wss is: ≤ 0.60 strength as a and is found8 ( )
for t
fjord Þorskaf
btained if theber at bay anis 2050 mm.
ulations. Mithan the diambays occur aed later when
minimum diststressing sta
e girder from s
he centroids o determine tress during te0 = 1488 40 = 1476 the maximum
60 = 1395 640 = 1394stresses muswhich the co
( )
function of td with the fol
for 3 < t <
≥ 28 days
fjörður in Ice
e positions ond as 0.12h f. Hence,
inimum spacmeter of the t 0.375L or n the amountances betwe
age only the
self-weight.
of the T-secthe maximumensioning is
m stresses in
st not arise oncrete has h
time of the pllowing meth
28 days
eland
f cables in thfrom the top
cing of the cduct, in this 13.875 m an
nt of cables een ducts. Fiself-weight
ction (half thm allowed stthe smaller o
n the cables a
in the concrhardened. Eu
prestressing ohod:
he cross-p extreme
cables, is case 117 nd in the has been igure 5-1 from the
he cross-tresses at of:
are given
rete. The urocode 2
operation.

Design of a 170 m long bridge over the fjord Þorskafjörður in Iceland
42
fcm(t) is estimated from the following expressions: ( ) = ( )
With βcc(t) as:
( ) = exp 1 − 28 = exp 0.25 1 − 2810 = 0.85
where s is chosen to 0.25 which is valid for cement of strength classes CEM Class N at 10 days and fcm is 53 MPa. From this fcm(t) is determined to 44.79 MPa and fck(t) to 36.79 MPa. Hence, the compressive strength at transfer becomes: ≤ 0.6 ( ) = 0.6 ∙ 36.79 = 22.07
And the concrete strength at service time is: ≤ 0.6 = 0.6 ∙ 45 = 27
EC2 does not lay down any compulsory permissible tension stresses so the choice of concrete tension stress limits is left to the discretion of the designer. Hence the design is restricted by not allowing high tensile stresses to develop at service and only the concrete tensile strength at transfer:
. , ≤ 2.7
And at service the maximum tensile stress is chosen to: ≤ 2.0
The stresses in the cross-section are calculated according to Navier’s formula:
= − + −
where P is the normal force, A is the area of the cross-section and I is the moment of inertia. Mg is the moment generated by self-weight, es is the eccentricity of the normal force and y is the location in the section where the stresses are calculated. In this equation P and es are unknown and have to be determined. The prestress force and eccentricity will be determined by developing a Magnel diagram, a method to determine a Magnel diagram is descriped in O’Brien (1999). Magnel diagrams are determined for the critical sections where the maximum transfer- and service moments occur. An estimation of the ratio between the prestress force at service and the prestress force at transfer, ρ, is made (generally from 0.75-0.90) and is chosen here to be 0.75. The critical sections that will be checked are external and internal spans and supports B and C. Figure 5-2 displays the load arrangements to establish the largest moments at each section at service stage. These load arrangements are determined based on influence lines that are created by the same method as in section 4 and can be seen in appendix B.

Figu
These mdevelope
Table 5
Below isfollow.
σtmin: min
σtmax: ma
σbmin: mi
σbmax: ma
These st
Des
ure 5-2: Mome
moments are ed for each s
5-2: Maximum
s a list that d
nimum stres
aximum stres
inimum stres
aximum stre
tresses are de
ign of a 170
ent distribution
calculated isection and th
m moments at e
defines neces
s at extreme
ss at extreme
ss at extreme
ss at extreme
etermined ac
=
m long bridg
ns and load arr
in the compuhe moments
each section wh
ssary notatio
top fibre.
e top fibre.
e bottom fibr
e bottom fibr
ccording to:
ge over the f
43
rangement for
uter programcan be seen
here M0 is the m
n, sign conv
e.
re.
−
fjord Þorskaf
r moments at se
m PCFRAMEin table 5-2.
moment at tra
ventions and
1
fjörður in Ice
ervice for the c
E after influe
ansfer and Ms t
formulas for
−
eland
calculated sect
ence lines h
the moment at
r the calculat
tions.
ave been
service.
tions that

where Wpositive centroidMS at seare show
ρomin: mi
ρomax: ma
ρSmin: mi
ρSmax: ma
In table
And fina
Note thnegative
The follthe Mag
Des
W is the sectivalue, A is
d is positive aervice), see twn in append
inimum perm
aximum perm
inimum perm
aximum perm
5-3 the num
ally the resul
at for these e.
lowing four gnel diagrams
ign of a 170
===
on modulus area of the
and below neable 5-2. Sag
dix B. The no
missible stres
missible stre
missible stres
missible stre
erical values
lts for these t
Table
calculations
inequalities s: 1
m long bridg
(I/y). Wb is a
e cross-sectioegative) and g moments aotation for pe
ss at transfer.
ss at transfer
ss at service.
ss at service
s for these pe
Table 5-
top and botto
5-4: Maximum
s compressiv
are used to
1 ≤ 1
ge over the f
44
−−
−at bottom anon, e is the M are applieare positive ermissible str
.
r.
.
ermissible str
-3: Permissible
om stresses a
m stresses at to
ve stresses
determine th
+
fjord Þorskaf
1 1
1nd is a negati
eccentricity ed moments and hog momresses in thes
resses are giv
e stresses.
are listed in t
op and bottom
are consider
he feasible z
fjörður in Ice
−−
−ive value and
of prestress(M0 is the mments are nese equations
ven.
table 5-4.
fibers.
red positive
zone for the p
1
eland
d Wt is at tops tendons (aoment at tranegative. Thesis the follow
and tensile
prestressing
p and is a above the nsfer and se values
wing:
e stresses
force on

Design of a 170 m long bridge over the fjord Þorskafjörður in Iceland
45
1 + ≤ 1 2 1 ≤ 1 + 3 1 + ≤ 1 4
These inequalities represent half-planes bounded by the line on which the stress limits are just satisfied. To determine which half-plane represents the inequality, the origin of the Magnel diagram is substituted into inequality 1, 1/P=0 and e=0, and gives the following:
0 ≤ 1 1
If this is true (A is positive), the correct half-plane is the one containing the origin and the same procedure is done for the three remaining inequalities. 1 ≤ 0 2
0 ≤ 1 3 1 ≤ 0 4
Thus, for inequality 1 the half-plane contains the origin, for inequality 2 it doesn’t, for inequality 3 the half-plane contains the origin and for inequality 4 it doesn’t. For further information see appendix B and O’Brien (1999).
After some calculation the Magnel diagrams are established (Appendix B) and the appropriate prestress force and eccentricity are chosen. The chosen prestress force is 46.512 kN (1/P=2.15 x 10-8 N-1) which is based on the maximum allowable eccentricity that is at supports B and C. That requires approximately 8 tendons each with a breaking load of 7812 kN. The eccentricity limits at each section are given below, based on these Magnel diagrams.
Section at support A: -180 mm ≤ e ≤ 283.6 mm
Section at span 1: -210 mm ≤ e ≤ -410 mm
Section at support B: 200 mm ≤ e ≤ 283.6 mm
Section at span 2: -300 mm ≤ e ≤ -420 mm
Section at support C: 250 mm ≤ e ≤ 283.6 mm
On figure 5-3 is the longitudinal feasible zone and the cable layout displayed. That zone is based on the calculations above.

Fig
On figur
5.2.6 The effethe lengtransfer losses coccur prand lossThe pre-
• •
The pos
•
•
Des
gure 5-3: Longi
re 5-4 the ch
Prestress ective prestregth of the m
and servicean be dividerior to the poses which occ-transfer loss
Elastic shorFriction betw
st-transfer lo
Time dependthe concreteLoss due to tension).
ign of a 170
itudinal feasib
osen eccentr
Figu
losses ess force is n
member. There, the losses ed into two oint in time cur after the ses consist of
rtening of theween the ten
sses consist
dent losses, . slippage of
m long bridg
ble zone of the c
ricities are di
ure 5-4: Chose
not generally refore, in orin prestress
groups in acwhen stress prestress is
f:
e cross-sectiondons and the
of:
which are fr
the tendons
ge over the f
46
cable (the beam
isplayed.
n eccentricitie
equal to therder to deters must first ccordance wis first felt btransferred t
on. e surroundin
rom relaxatio
at the ancho
fjord Þorskaf
m size has the
s for the cable
e applied jackrmine the effbe calculate
with the time by the concrto the concre
g ducts (in c
on of the ste
orage known
fjörður in Ice
scale of 10 in v
line.
king force noffective stresed at each d
when they rete are calleete are called
ase of post-t
el and by cr
n as draw-in
eland
vertical directi
or is it constas due to pre
design sectiooccur. Losse
ed pre-transfd post-transfe
tension).
reep and shri
loss (in case
ion).
ant along estress at n. These es which fer losses er losses.
inkage of
e of post-
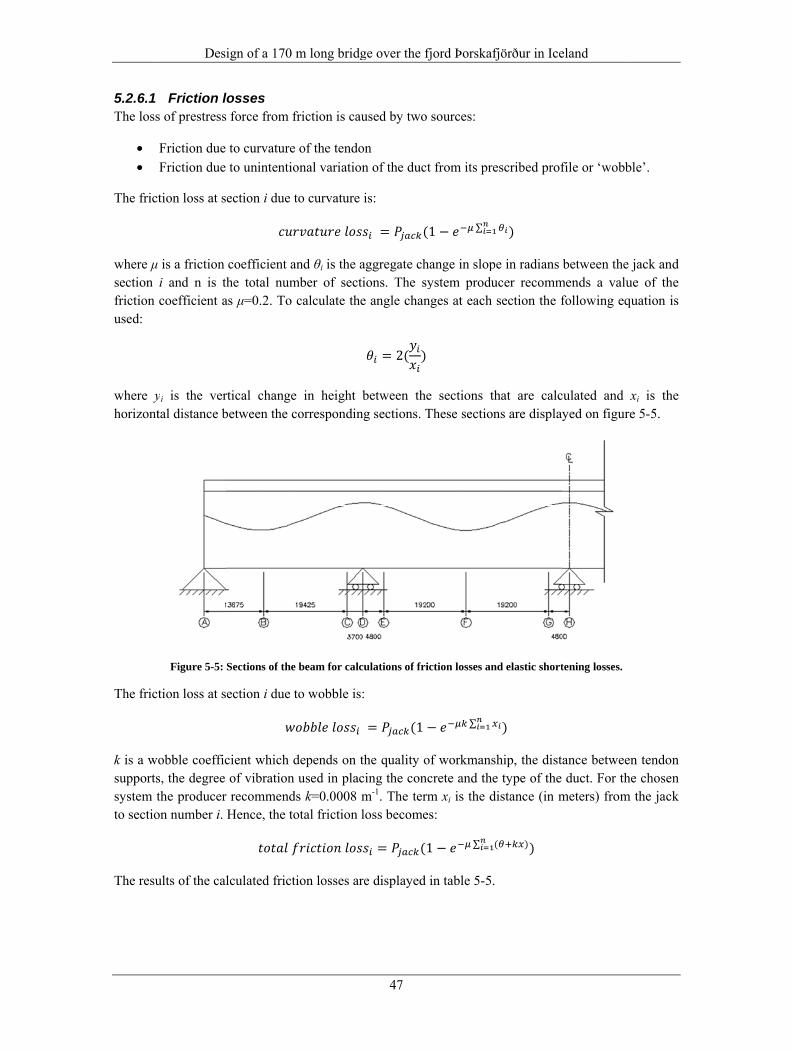
5.2.6.1 The loss
• •
The frict
where μ section friction used:
where yhorizont
The frict
k is a wosupportssystem tto sectio
The resu
Des
Friction ls of prestress
Friction dueFriction due
tion loss at s
is a friction i and n is tcoefficient a
yi is the vertal distance b
Figure 5-5:
tion loss at s
obble coeffics, the degree the produceron number i.
ults of the ca
ign of a 170
losses s force from f
to curvature to unintentio
section i due
coefficient athe total numas μ=0.2. To
rtical changebetween the c
Sections of the
section i due
cient which of vibration
r recommendHence, the t lculated frict
m long bridg
friction is ca
e of the tendoonal variatio
to curvature and θi is the amber of sect
calculate th
e in height correspondin
e beam for calc
to wobble is depends on t
n used in placds k=0.0008 otal friction tion losses ar
ge over the f
47
aused by two
on on of the duct
is: = (aggregate chtions. The sye angle chan
= 2( )between the
ng sections. T
culations of fri
s: = (1the quality ocing the concm-1. The termloss become= (1re displayed
fjord Þorskaf
sources:
t from its pre
(1 − ∑hange in slopystem produ
nges at each
e sections thThese section
iction losses an
− ∑of workmanscrete and them xi is the d
es: 1 − ∑in table 5-5.
fjörður in Ice
escribed prof
)
pe in radians ucer recommsection the f
hat are calcns are display
nd elastic short
)
ship, the diste type of the distance (in m
( ))
eland
file or ‘wobb
between the mends a valufollowing eq
culated and yed on figur
tening losses.
ance betweeduct. For th
meters) from
ble’.
jack and ue of the quation is
xi is the e 5-5.
en tendon he chosen
m the jack

5.2.6.2 As the pcause a shortenintendon ttendon t
where ineccentricshortenin
5.2.6.3 After jaanchoragthe anch
Des
Elastic shprestress is tslackening ong in each that is releasthat is release
ndex 1 and city respecting loss for th
Draw-in lcking the teges to the co
hors. The ´dr
ign of a 170
hortening ltransferred tof the strandtendon of p
sed first and ed first is:
ℎ2 indicate t
ively. Ag is he whole cab
losses endons are reoncrete. Thisraw-in´ of the
m long bridg
Table
losses to the concrd which resupost-tensione
then less in
endon 1 andthe area of
ble group in o
Table 5-6:
eleased from process resue tendons res
ge over the f
48
e 5-5: Friction
ete, the conults in a lossed members n the next on
d 2 respectivf the cross-seone girder ar
Elastic shorte
m the jacks aults in a loss sults in a los
fjord Þorskaf
losses.
crete undergs of prestress
are differenne and etc. T
1 =vely. P and ection. The re displayed
ening losses.
and the forcdue to slipp
ss of strain o
fjörður in Ice
goes elastic s force. The nt. The maxThe elastic s
1 +e are the prresults of tin table 5-6.
e is applied page or ‘drawf εjack at the a
eland
shortening. losses due t
ximum loss shortening lo
restressing fthe calculate
directly thrw-in’ of the sanchorage. H
This can to elastic is in the
oss in the
force and ed elastic
ough the strands at However,

Design of a 170 m long bridge over the fjord Þorskafjörður in Iceland
49
because of friction, this loss decreases along the length of the member to zero at a distance Ld from the jack. The extent of draw-in losses is determined with the following equation:
= ∆( − )/
where (Pjack-PL)/L is the slope of the distribution of prestress force if the friction loss is assumed to vary linearly. Δs is the total shortening of the tendon. The magnitude of the draw-in loss at the anchorage is then given by the following equation:
∆ = 2 ( − )
where ΔP is the draw-in loss. The distribution of the prestress force after the draw-in loss is displayed in figure 5-6 where the decrease of this loss along the length of the member becomes zero at distance Ld approximately 15 m from the jack.
Figure 5-6: Distribution of the prestress force after the draw-in loss for half of the total span.
5.2.6.4 Time-dependent losses Losses in prestress which occur gradually over time are caused by shortening of the concrete due to creep and shrinkage and due to relaxation of the prestressing steel. Shrinkage is a time-dependent strain which occurs as the concrete sets and for a period after setting. The shrinkage strain approaches final value at infinite time. When maintained at a constant tensile strain, steel gradually loses its stress with time due to relaxation. The extent of the loss of stress in prestressing strands due to relaxation is determined by the stress to which the steel is tensioned, the ambient temperature and the class of steel. Maximum allowable value for relaxation losses of the prestressing steel are specified by the manufacturer as 2.5% for 15 mm strands. To determine the loss EC2 suggests that it should be based on the 1000 hour values given in figure 5-7. These values should be trebled to determine the final relaxation losses.
0, 46512
85, 40830
0, 4327024, 44891
40000
45000
50000
0 20 40 60 80
P [k
N]
x [m]
Draw-in loss
Prestress dueto friction loss
Draw-in loss

The pherelaxatiooccurs athe conc
EC2 recfollowin
where
The finaautogenoauthor r
Des
enomenon oon refers to tat constant stcrete.
commends thng formula:
Δσp,tot = loss
εcs = final shof this strain
Ep = modulu
Δσp,r = loss o
m = modular
φ = final cre
σc = stress in
Ap = area of
Ag, Ig = gros
e = eccentric
al shrinkage ous shrinkagefers to sect
ign of a 170
F
of creep is the loss of sttress. For pre
hat these two
∆of stress in s
hrinkage stran is εcs=0.000
us of elasticit
of stress in th
r ratio, Ep/Ec
eep coefficien
n the concret
prestressing
s area and se
city of tendo
strain is comge strain, εca. tion 3.1.4 (6)
m long bridg
Figure 5-7: Re
essentially ttress under cestressed con
o prestress lo
, = 1 +steel due to c
ain calculated0256.
ty of the pres
he tendons at
c.
nt taken from
te at the level
g steel.
econd mome
ns from cent
mposed of tw For detailed) in EC2. Th
ge over the f
50
elaxation of pre
the same asconstant straincrete, relaxa
osses, creep
+ ∆1 +creep, shrink
d according
stressing stee
t the design s
m table 5-1.
l of the tendo
nt of area of
troid section.
wo componed explanationhe loss of str
fjord Þorskaf
estressing steel
s that of relin while creeation occurs
and shrinkag
, (1 + 0.kage and rela
to section 3.
el.
section due to
ons due to pe
f section.
.
ents, the dryns of calcularess in the te
fjörður in Ice
l.
laxation. Thep is the incin the steel w
ge, should b
.8 )
xation.
.1.4 (6) in E
o relaxation.
ermanent loa
ying shrinkagations of the endons due t
eland
he distinctionrease of strawhile creep o
e calculated
C2. Calculat
ads plus prest
ge strain, εcd
final shrinkato relaxation
n is that ain which occurs in
with the
ted value
tress.
, and the age strain , Δσp.r, is

derived the secti
and the l
The strecalculate
FollowinFrom ththen be c
5.2.7 For statmomenteccentricduring pdisplaceThe equparaboliM1=Pe. maximu
Since thparaboli
Applicat
Des
from figure ion that is ca
loss of stress
ess, σc, in thed using the
ng these calcese results acalculated. T
Secondaryically indetet and secondcity, the secoprestressing. ement methoduivalent load ic tendon proIf an equiva
um moment a
he equation ic, the mome
tion of this e
ign of a 170
5-7 with thelculated as:
s in the tendo
he concrete following eq
culations theand from the The results of
y effects oferminate strudary momenondary mom
To determid and equivais a uniform
ofile. The bealent uniformat mid-span i
of the bendents must be
equation at th
m long bridg
e ratio of stee
ons due to re
∆ , = 3at the leve
quation:
=e total time-dcalculations
f the calculat
Table 5-7
f prestressuctures the pnt. The priment is momene the secon
alent load memly distributeending momem upward loais equal to:
ding momenequal in the
he mid-span g
ge over the f
51
el stress/char
= +laxation as:
el of tendon
+ ( +dependent los of the drawted time-dep
: Time-depend
prestress mo
mary momennt caused byndary momeethod. In thised load estabent at any poad, w, is ass
= 8nt for unifortwo beams a=gives
fjord Þorskaf
racteristic ten
ns due to pe
+ )
oss of stress w-in losses th
endent losse
dent losses.
oment consisnt is the pry reactions deent there ares thesis the eblished by coint due to thsumed to act
rmly loaded at any point.
fjörður in Ice
nsile strength
ermanent loa
in the tendonhe applied pres are display
sts of two coduct of preveloped at ie two commquivalent loaonsidering ahis prestresson the beam
simply supThus
eland
h as (σp/fpk) w
ads plus pre
ns can be caestress at ser
yed in table 5
components, restressing fointermediate on methods;ad method isa simple beaming force is
m, see figure
pported beam
with σp at
estress is
alculated. rvice can 5-7.
primary force and
supports ; support s applied. m with a given by
e 5-8, the
m is also

and
where e
In the cae is the cable, se
Thus, th
To deteris used.
• • • •
Des
is the distan
ase when theeccentricity
ee figure 5-9
he eccentricit
rmine the moThe calculat
Draw a free Label the spUse the threMove one sp
ign of a 170
nce from the c
Figure 5-8:
e vertical posat mid span
.
Figure 5-9: D
ty becomes:
oment at the tion procedur
body diagrampans L1 and Le-moment eqpan further a
m long bridg
cable to the e
Calculation of
sition of the cn from the c
Determination
intermediatere of the thre
m of the firsL2 and the supquation to so
and repeat the
ge over the f
52
= 8= 8
eccentricity o
f the equivalen
cables at supcable to the
n of e for cable
= + +2e supports theee-moment e
t two spans.pports A, B a
olve the unkne procedure a
fjord Þorskaf
of the beam
nt load for curv
pports is not tline that con
with eccentric
e three-momquation is in
and C. nown momenabove.
fjörður in Ice
at mid-span.
ved tendons.
the same at tnnects these
city e1 and e2.
ment equationn the followin
nts.
eland
.
two adjacent two position
n (Clapeyronng order:
supports ns of the
n´s theory)

•
•
In this cMA, MB a
The nota
The termwith uni
In table momentMore de
Des
Repeat as nequations. Solve 3 simu
case these moand MC. The
ation for the
ms on the rigiformly distri
5-8 the calct diagrams foetailed calcul
ign of a 170
needed, alwa
ultaneous eq
oment equatiey are the fol+++formulas abo
Figure 5-10: N
ght hand side ibuted load o
culated valueor the corresplations to obt
m long bridg
ays moving o
quations for 4
ions are threlowing: 2 ( +2 ( +2 ( +ove is displa
Notation for ca
of these equon span no. n
es for w andponding momtain the secon
Table 5
ge over the f
53
one span to
4 spans to get
e since there
) +) +) +ayed on figur
lculations with
uations are acn:
= 24d the prestresments. The sndary mome
5-8: Prestress m
fjord Þorskaf
the right an
t the internal
e are four spa
= −6(= −6(= −6(re 5-10.
h the three-mo
cquired with
ss momentsecondary mo
ent are in app
moment.
fjörður in Ice
nd writing a
l moments.
ans and three
+ ) + ) + )
ment equation
h the followin
are listed anoment is linependix B.
eland
new set of
e unknown m
n.
ng formula fo
nd on figure ear between s
f moment
moments,
for beams
5-11 the supports.

When thcalculate
Des
he total moed. That is do
ign of a 170
Figure 5
oment has bone in the ne
m long bridg
5-11: Diagrams
been obtaineext chapter.
ge over the f
54
s of primary an
ed in the be
fjord Þorskaf
nd secondary m
eam, the ult
fjörður in Ice
moments.
timate mom
eland
ment capacityy can be

Design of a 170 m long bridge over the fjord Þorskafjörður in Iceland
55
5.3 Ultimate moment capacity When the member has been designed to satisfy the transfer and service stress limits it is necessary to check for moment capacity in the ultimate limit state. As for ordinary reinforced concrete, the ultimate moment capacity of a prestressed section is calculated by equilibrium of forces at the corresponding section. The compressive strain in the concrete due to prestress, εce, at the level of the prestressing tendon is given with the following formula:
= 1 +
where Mp is the moment due to prestress and P is the prestress force, both after all losses, at the section that is calculated. The tendon strain is defined as (contraction positive):
= − + −
where Ap is the area of the prestress reinforcement and Ep is its modulus of elasticity. εct is the total ultimate strain in the concrete and is found with the following equation:
= − ( − )
EC2 recommends that εult should be taken as 0.0035. Here d is the effective depth, distance from extreme fibre in compression to the center of tension reinforcement, and x is the distance from extreme fibre in compression to neutral axis. To calculate the equilibrium of forces the force in the steel, Fp, and the compressive force acting on the concrete in compression, Fc, are required: = ( )
= 0.8
Here b is the width of the section which Fc is acting on. α is a coefficient which takes into account the long-term effects on the compressive strength and is 1.0. γc is the partial safety factor for concrete strength and is equal to 1.5 according to EC2. Now the following equation for equilibrium of forces is established and solved to find x: + = 0
When x is found a check is made to see if the steel has yielded by substituting x into the equation for the tendon strain defined above. The initial yield strain for prestressing steel is ⁄ where γp is the partial safety factor for reinforcement strength and is equal to 1.15 according to EC2. εpu cannot exceed the initial strain, otherwise the steel has yielded. Finally the ultimate moment capacity can be determined with the following formula: = =
with z as: = ( − 0.4 )
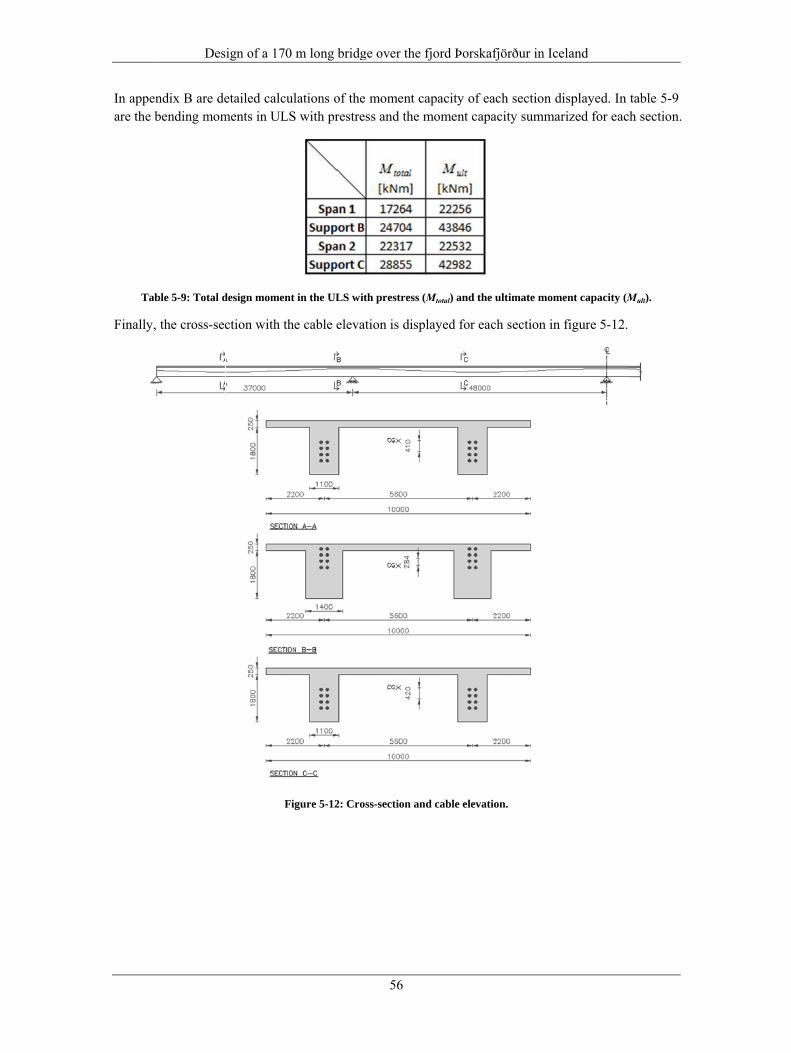
In appenare the b
Tab
Finally,
Des
ndix B are debending mom
ble 5-9: Total d
the cross-sec
ign of a 170
etailed calcuments in ULS
design moment
ction with th
Fi
m long bridg
ulations of theS with prestre
t in the ULS w
he cable eleva
igure 5-12: Cro
ge over the f
56
e moment caess and the m
ith prestress (M
ation is displ
oss-section and
fjord Þorskaf
apacity of eamoment capa
Mtotal) and the
layed for eac
d cable elevatio
fjörður in Ice
ach section dacity summar
ultimate mom
ch section in
on.
eland
isplayed. In rized for eac
ent capacity (M
figure 5-12.
table 5-9 h section.
Mult).

Design of a 170 m long bridge over the fjord Þorskafjörður in Iceland
57
6 References
6.1 Literature Austin, W.J., (1971), “IN-PLANE BENDING AND BUCKLING OF ARCHES“, Journal of the Structural Division, May 1971, pp. 1575-1591.
Bunner, M. and Wright, K., (2006), “Selecting the Shape of a Steel Arch”, Bridgeline, Volume 15, NO. 1, April 2006.
Chen, W. and Duan, L., (2000), “Bridge Engineering Handbook”, CRC Press LLC, Florida.
EN 1990:2002. Eurocode - Basis of Structural Design. CEN, 2002.
EN 1991:2002. Eurocode - Actions on Structures. CEN, 2002.
EN 1992:2004. Eurocode – Design of Concrete Structures. CEN, 2004.
EN 1993:1992. Eurocode – Design of Steel Structures. CEN, 1992.
Ghoneim, M. and El-Mihilmy, M., (2008), “Design of Reinforced Concrete Structures”, Vol. 3, Cairo University, Cairo.
Gilbert, R. I., and Mickleborough, N. C., (2004), “Design of Prestressed Concrete”, Spon Press, London.
ISE manual, (1985), I. Struct. E./ICE Joint committee, “Manual for the Design of Reinforced Concrete Building Structures”, Institution of Structural Engineers, London.
Loretsen, M. and Sundquist, H., (1995), ”Bågkonstruktioner”, KTH.
Loretsen, M. and Sundquist, H., (1995), ”Hängkonstruktioner”, KTH.
Menn, C., (1986), “Prestressed Concrete Bridges”, Springer-Verlag, Wien.
Nawy, E. G., (2008), “Concrete Construction Engineering Handbook”, 2nd edition, CRC Press LLC, Florida.
O’Brien, E. J. and Dixon, A. S., (1999). “Reinforced and Prestressed Concrete Design”, Pearson Education Limited, Edinburgh.
“Prestress Manual”, (2005), State of California, Department of Transportation, Engineering Services.
Thelandersson, S., (2009), “Design of bridges – Structural design project”, Lund University, Structural engineering.
Zhuan M. Q. and Guo. X. J., (1998), “PE Shelled Large Pitch Twisted Stay Cable, For Construction Use”, Shanghai PuJiang Cable Co. Ltd. Shanghai.

Design of a 170 m long bridge over the fjord Þorskafjörður in Iceland
58
6.2 Computer programs AutoCAD 2009, Autodesk.
CSI SAP2000, version 14, Computers & Structures.
Microsoft Office Excel 2007, Microsoft.
Microsoft Office Word 2007, Microsoft.
PCFrame, version 2.15, AEC AB.
6.3 Other references Hafliðason, E. (2010), personal communication with Hafliðason at ICERA.
Earthquake Engineering Research Centre, University of Iceland.
VSL Post-Tensioning Systems, Technical Data, (2010), VSL International Ltd.
http://www.ingvason.com/

Appendix A
Appendix A
59

Q1k= 300 αQ1= 0,9 αQ1∙Q1k= 270 kN
Q2k= 200 αQ2= 0,9 αQ2∙Q2k= 180 kN
q1k= 9 αq1= 1 αq1∙q1k= 9 kN/m2
q2k= 2,5 αq2= 1 αq2∙q2k= 2,5 kN/m2
q3k= 2,5 αq3= 1 αq3∙q3k= 2,5 kN/m2
F z M q l z MFor Q For q
CALCULATIONS OF GDF FOR BRIDGE TYPE 1
F z M q l z MRA 5,6 RA∙x 5,6 RA∙x
135 6,8 918 9 3 5,8 156,6135 4,8 648 2,5 3 2,8 2190 3,8 342 2,5 3 ‐0,2 ‐1,590 1,8 162 ∑M= 176,1
∑M= 2070 RA= 31,45RA= 369,64 GDFq= 1,16
GDFQ= 1,37 RB= 10,55
RB= 80,36
Total actions on half of the cross section for traffic loads in the length direction1012 kN
37 kN/mq=GDFq*RA=
RA
Q=2*GDFQ*RA=
Appendix A
60

Part b h A y0 S=Ay0 y‐y0 I0 A(y‐y0)2 Ix
nr. mm mm mm2 mm mm3 mm mm4 mm4 mm4
1 1080 2400 2592000 1200 3,11E+09 431,1 1,24E+12 4,82E+11 1,73E+122 1080 2400 2592000 1200 3,11E+09 431,1 1,24E+12 4,82E+11 1,73E+123 10000 250 2500000 2525 6,31E+09 ‐893,9 1,30E+10 2,00E+12 2,01E+12
∑ 7684000 1,25E+10 5,46E+12
y= 1631,1 mm WTop= mm3
h= 2650 mm WBottom= mm3
u= 30100 mm2A/u= 511 mmφ= 1,54Ec,eff= 14175 N/mm2
Part b h A y0 S=Ay0 y‐y0 I0 A(y‐y0)2 Ix
nr. mm mm mm2 mm mm3 mm mm4 mm4 mm4
1 5000 250 1250000 2525 3,16E+09 ‐893,9 6,51E+09 9,99E+11 1,01E+122 1080 2400 2592000 1200 3,11E+09 431,1 1,24E+12 4,82E+11 1,73E+12
∑ 3842000 6,27E+09 2,73E+12
y= 1631,1 mm WTop= 2,68E+09 mm3
h= 2650 mm WBottom= 1,67E+09 mm3
In the middle of the span ‐ Half cross section
In the middle of the span
5,36E+09
3,35E+09
Perimeter:Notional size:Creep coefficient:
Effective elastic modulus:
Creep ‐ Effective elastic modulus
Note: All cross‐section calculations are done from the bottom fibreCalculations for Area, Moment of Inertia and Section Modulus for Bridge Type 1
Appendix A
61

Part b h A y0 S=Ay0 y‐y0 I0 A(y‐y0)2 Ix
nr. mm mm mm2 mm mm3 mm mm4 mm4 mm4
1 1380 2400 3312000 1200 3,97E+09 363,1 1,59E+12 4,36548E+11 2,03E+122 1380 2400 3312000 1200 3,97E+09 363,1 1,59E+12 4,36548E+11 2,03E+123 10000 250 2500000 2525 6,31E+09 ‐961,9 1,30E+10 2,31335E+12 2,33E+12
∑ 9124000 1,43E+10 6,38E+12
y= 1563,1 mm WTop= 5,87E+09 mm3
h= 2650 mm WBottom= 4,08E+09 mm3
Part b h A y0 S=Ay0 y‐y0 I0 A(y‐y0)2 Ix
nr. mm mm mm2 mm mm3 mm mm4 mm4 mm4
1 5000 250 1250000 2525 3,16E+09 ‐961,9 6,51E+09 1,16E+12 1,16E+122 1380 2400 3312000 1200 3,97E+09 363,1 1,59E+12 4,37E+11 2,03E+12
∑ 4562000 7,13E+09 3,19E+12
y= 1563,1 mm WTop= 2,51E+09 mm3
h= 2650 mm WBottom= 2,04E+09 mm3
u= 30100 mm2A/u= 606 mmφ= 1,50Ec,eff= 14416 N/mm2
A W,Top W,Bottom I Weight
mm2 mm3 mm3 mm4 kN/m7684000 5,36E+09 3,35E+09 5,46E+12 192,13842000 2,68E+09 1,67E+09 2,73E+12 96,059124000 5,87E+09 4,08E+09 6,38E+12 228,14562000 2,51E+09 2,04E+09 3,19E+12 114,05
25 kN/m3
2,1 kN/m2
Self weight of concrete for half of the bridge section96,1 kN/m
10,5 kN/m
106,6 kN/m
36000 N/mm2
In the Middle of the Span
Over a support
Over a support
Summary
Ec=
Perimeter:Notional size:Creep coefficient:
Effective elastic modulus:
Creep ‐ Effective elastic modulus
Over a support ‐ Half cross section
Over a support ‐ half
In the middle of the Span ‐ half
γconcrete=
γpavement=
gconcrete=
gpavement=
gtot=
Appendix A
62

Q1k= 300 αQ1= 0,9 αQ1∙Q1k= 270 kN
Q2k= 200 αQ2= 0,9 αQ2∙Q2k= 180 kN
q1k= 9 αq1= 1 αq1∙q1k= 9 kN/m2
q2k= 2,5 αq2= 1 αq2∙q2k= 2,5 kN/m2
q3k= 2,5 αq3= 1 αq3∙q3k= 2,5 kN/m2
F z M q l z MFor Q For q
CALCULATIONS OF GDF FOR BRIDGE TYPE 2
F z M q l z MRA 10 RA∙x 10 RA∙x
135 9 1215 9 3 8 216135 7 945 2,5 3 5 37,590 6 540 2,5 3 2 1590 4 360 ∑M 268,5
∑M= 3060 RA 26,85RA= 306,00 GDFq= 0,99
GDFQ= 1,13 RB= 15,15
RB= 144,00
Total actions on half of the cross section for traffic loads in the length direction694 kN
27 kN/mq=GDFq*RA=
RA
Q=2*GDFQ*RA=
Appendix A
63

Relevant distances fo
r cross‐section calculations of the
arch
Appendix A
64

Part
bh
tA
y 0S=Ay 0
y‐y 0
I 0A(y‐y
0)2
I x
nr.
mm
mm
mm
mm
2mm
mm
3mm
mm
4mm
4mm
4
Box Section
900
1700
5025
0.00
085
0,00
2,13
E+08
0,0
9,54
E+10
0,00
E+00
9,54
E+10
Stiffen
ers Nr. 1
‐‐
‐3.90
011
8,69
4,63
E+05
731,3
5,60
E+06
2,09
E+09
2,09
E+09
Stiffen
ers Nr. 2
‐‐
‐3.90
017
5,00
6,82
E+05
675,0
1,34
E+07
1,78
E+09
1,79
E+09
Stiffen
ers Nr. 3
‐‐
‐3.90
040
0,00
1,56
E+06
450,0
1,34
E+07
7,90
E+08
8,03
E+08
Stiffen
ers Nr. 4
‐‐
‐3.90
062
5,00
2,44
E+06
225,0
1,34
E+07
1,97
E+08
2,11
E+08
Stiffen
ers Nr. 5
‐‐
‐3.90
085
0,00
3,31
E+06
0,0
1,34
E+07
0,00
E+00
1,34
E+07
A19
49,8
mm
2Stiffen
ers Nr. 6
‐‐
‐3.90
010
75,00
4,19
E+06
‐225
,01,34
E+07
1,97
E+08
2,11
E+08
I x2,80
E+06
mm
4Stiffen
ers Nr. 7
‐‐
‐3.90
013
00,00
5,07
E+06
‐450
,01,34
E+07
7,90
E+08
8,03
E+08
I y6,70
E+06
mm
4Stiffen
ers Nr. 8
‐‐
‐3.90
015
25,00
5,95
E+06
‐675
,01,34
E+07
1,78
E+09
1,79
E+09
Stiffen
ers Nr. 9
‐‐
‐3.90
015
81,31
6,17
E+06
‐731
,35,60
E+06
2,09
E+09
2,09
E+09
∑28
5.09
72,42
E+08
1,05
E+11
y=85
0,0
mm
h=17
00mm
Wel=
1,24
E+08
mm
3
Stiffen
ers
Calculations fo
r Area, M
omen
t of Ine
rtia and
Sectio
n Mod
ulus For th
e Stronger Axis
Appendix A
65

Part
Ay
nW
xiType
nr.
mm
2mm
mm
3
119
49,8
731,31
457
0369
0Stiffen
er2
1949
,867
5,00
452
6451
8Stiffen
er3
1949
,845
0,00
435
0967
9Stiffen
er4
1949
,822
54
1754
839
Stiffen
er5
8000
053
,00
41,7E+07
Stiffen
er6
4500
082
5,00
27,4E+07
Flange
780
000
400
41,3E+08
Web
2,35
E+08
ENV 199
3‐1‐1
5.4.5 an
d 5.4.5.2 Be
nding Mom
ent (pa
ge 65)
5.4.4 Co
mpression
((1) and
(2)) (p
age 65
)
Msd=
1587
5kN
m‐109
01kN
a) Design plastic
resistance compression
f y=
355MPa
9200
9kN
a) Design plastic
resistance mom
ent
Calculations of p
lastic sectio
n mod
ulus of the
sectio
n
Wxpl=
NSd=
Npl.Rd=
.Sd
cRd
MM
≤ pl,Rd
pl
yM0
M=W
f/γ
⋅
.Sd
cRd
NN
≤
.0
/pl
Rdy
MN
Afγ
=
2
pl,Rd
.
1M
Sd
Sd
pl
Rd
MN
N⎡
⎤+
≤⎢
⎥⎢
⎥⎣
⎦
y35
5MPa
900
9kN
γ M0=
1,1
Mpl.Rd=
7598
4kN
m
5.4.8.1 Be
nding an
d axial force
Design
1587
5OK!
0,22
1090
1OK!
0,21
0,22
OK!
@ 1/4 of arch:
@ cen
ter of arch:
Compression
[kN]
Bend
ing [kNm]
Combine
d
Resistan
ce75
984
9200
91,00
Npl.Rd
.Sd
cRd
MM
≤ pl,Rd
pl
yM0
M=W
f/γ
⋅
.Sd
cRd
NN
≤
.0
/pl
Rdy
MN
Afγ
=
2
pl,Rd
.
1M
Sd
Sd
pl
Rd
MN
N⎡
⎤+
≤⎢
⎥⎢
⎥⎣
⎦
Appendix A
66

Part b h A y0 S=Ay0 y‐y0 I0 A(y‐y0)2 Iy
[mm2] [mm2] [mm2] [mm] [mm2] [mm] [mm4] [mm4] [mm4]Top Flange 300 40 12000 1160 1,39E+07 ‐570 1,60E+06 3,90E+09 3,90E+09
Web 40 1100 44000 590 2,60E+07 0 4,44E+09 0,00E+00 4,44E+09Bottom Flange 300 40 12000 20 2,40E+05 570 1,60E+06 3,90E+09 3,90E+09
∑ 68000 4,01E+07 1,22E+10
y= 590 [mm]h= 1180 [mm]Wel= 2,07E+07 [mm3]
Part y A Wpl
2 3
5.4 Restistance of cross‐sections in EC3
Main girders ‐ Bridge type 2
[mm] [mm2] [mm3]Top Flange 570 12000 6,84E+06 γM0= 1,1 fy= 355 MPa
Web 1 275 22000 6,05E+06Web 2 275 22000 6,05E+06
Bottom Flange 570 12000 6,84E+06
∑ 2,58E+07 Where
44000 mm2
MSd,max= ‐7241 kNm
ε 0,81 VSd,max= 2087 kN
d 1100tw 40
α 0,5 8320 kNm OK!d/tw 27,5 8198 kN OK!Class Class 1 →d/tw ≤ 33ε No reduction needed!c 150tf 40
c/tf 3,75Class Class 1 →c/tf ≤ 9ε
Design values:
Web
Flan
ge
Cross Section Class, table 5.3.1 in EC3
Wpl=
Combined
Provided that the design value of the shear force V sd does not exceed 50% of the design plastic shear resistance V pl.Rd no reduction need be
made
ShearMoment
Resistance:
Shear area: Av=Σ(dtw)=
.Sd c RdM M≤
.Sd pl RdV V≤
. 0( / 3) /Sd pl Rd v y MV V A f γ≤ =
Appendix A
67

Part b h A y0 S=Ay0 y‐y0 I0 A(y‐y0)2 Iy
[mm2] [mm2] [mm2] [mm] [mm2] [mm] [mm4] [mm4] [mm4]Top Flange 200 30 6000 845 5,07E+06 ‐415 4,50E+05 1,03E+09 1,03E+09
Web 30 800 24000 430 1,03E+07 0 1,28E+09 0,00E+00 1,28E+09Bottom Flange 200 30 6000 15 9,00E+04 415 4,50E+05 1,03E+09 1,03E+09
∑ 36000 1,55E+07 3,35E+09
y= 430 [mm]h= 860 [mm]Wel= 7,79E+06 [mm3]
Part y A Wpl 5.4 Restistance of cross‐sections in EC3
Cross‐beams ‐ Bridge type 2
[mm] [mm2] [mm3]
Top Flange 415 6000 2,49E+06 γM0= 1,1 fy= 355 MPa
Web 1 200 12000 2,40E+06Web 2 200 12000 2,40E+06
Bottom Flange 415 6000 2,49E+06
∑ 9,78E+06 Where
24000 mm2
MSd,max= 3025 kNm
ε 0,81 VSd,max= 1359 kN
d 800tw 30
α 0,5 3156 kNm OK!d/tw 26,67 4472 kN OK!Class Class 1 No reduction needed!c 100tf 30
c/tf 3,333Class Class 1
Design values:
Wpl=
MomentShear
Combined
Resistance:
Provided that the design value of the shear force V sd does not exceed 50% of the design plastic shear resistance V pl.Rd no reduction need be
made
Flan
geWeb
Cross Section Class, table 5.3.1 in EC3
Shear area: Av=Σ(dtw)=
.Sd c RdM M≤
.Sd pl RdV V≤
. 0( / 3) /Sd pl Rd v y MV V A f γ≤ =
Appendix A
68

Q1k= 300 αQ1= 0,9 αQ1∙Q1k= 270 kN
Q2k= 200 αQ2= 0,9 αQ2∙Q2k= 180 kN
q1k= 9 αq1= 1 αq1∙q1k= 9 kN/m2
q2k= 2,5 αq2= 1 αq2∙q2k= 2,5 kN/m2
q3k= 2,5 αq3= 1 αq3∙q3k= 2,5 kN/m2
F z M q l z M
CALCULATIONS OF GDF FOR BRIDGE TYPE 3
For Q For qF z M q l z MRA 10 RA∙x 10 RA∙x
135 9 1215 9 3 8 216135 7 945 2,5 3 5 37,590 6 540 2,5 3 2 1590 4 360 ∑M 268,5
∑M= 3060 RA 26,85RA= 306,00 GDFq= 0,99
GDFQ= 1,13 RB= 15,15
RB= 144,00
Total actions on half of the cross section for traffic loads in the length direction694 kN
27 kN/m
Q=2*GDFQ*RA=
q=GDFq*RA=
RA
Appendix A
69

Mmax
Vmax
Part b h A y0 S=Ay0 y‐y0 I0 A(y‐y0)2 Iy
[mm2] [mm2] [mm2] [mm] [mm2] [mm] [mm4] [mm4] [mm4]Top Flange 300 30 9000 845 7,61E+06 ‐415 6,75E+05 1,55E+09 1,55E+09
Web 30 800 24000 430 1,03E+07 0 1,28E+09 0,00E+00 1,28E+09Bottom Flange 300 30 9000 15 1,35E+05 415 6,75E+05 1,55E+09 1,55E+09
∑ 42000 1,81E+07 4,38E+09
y= 430 [mm]h= 860 [mm]Wel= 1,02E+07 [mm3]
Part y A Wpl 5.4 Restistance of cross‐sections in EC3
Cross‐beams ‐ Bridge type 3
Part y A Wpl
[mm] [mm2] [mm3]
Top Flange 415 9000 3,74E+06 γM0= 1,1 fy= 355 MPa
Web 1 200 12000 2,40E+06Web 2 200 12000 2,40E+06
Bottom Flange 415 9000 3,74E+06∑ 1,23E+07 Where
24000 mm2
Cross Section Class MSd,max= 3237 kNmε 0,81 VSd,max= 672 kN
d 800tw 30
α 0,5 3960 kNm OK!d/tw 26,67 4472 kN OK!Class Class 1 →d/tw ≤ 33ε No reduction needed!c 150tf 30
c/tf 5Class Class 1 →c/tf ≤ 9ε
5.4 Restistance of cross sections in EC3
Provided that the design value of the shear force V sd
does not exceed 50% of the design plastic shear resistance V pl.Rd no reduction need be made
MomentShear
Combined
Resistance:
Design values:
Web
Shear area: Av=Σ(dtw)=
Flan
ge
Wpl=
.Sd c RdM M≤
.Sd pl RdV V≤
. 0( / 3) /Sd pl Rd v y MV V A f γ≤ =
Appendix A
70
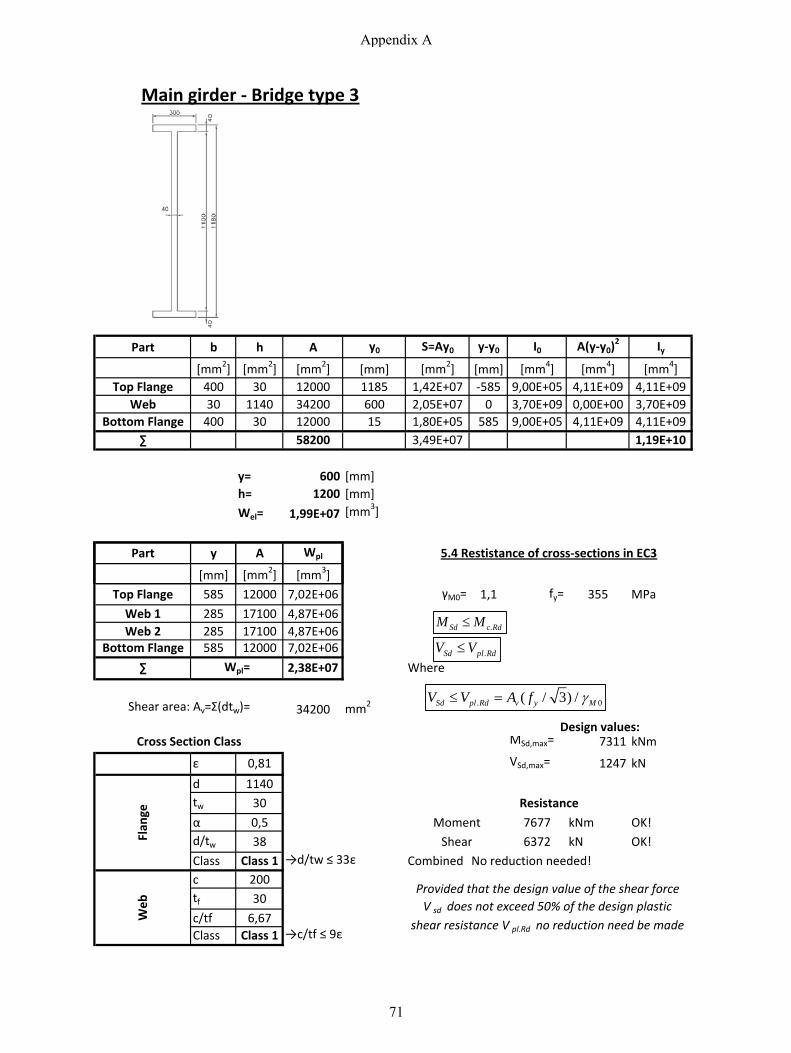
Part b h A y0 S=Ay0 y‐y0 I0 A(y‐y0)2 Iy
[mm2] [mm2] [mm2] [mm] [mm2] [mm] [mm4] [mm4] [mm4]Top Flange 400 30 12000 1185 1,42E+07 ‐585 9,00E+05 4,11E+09 4,11E+09
Web 30 1140 34200 600 2,05E+07 0 3,70E+09 0,00E+00 3,70E+09Bottom Flange 400 30 12000 15 1,80E+05 585 9,00E+05 4,11E+09 4,11E+09
∑ 58200 3,49E+07 1,19E+10
y= 600 [mm]h= 1200 [mm]Wel= 1,99E+07 [mm3]
Part y A Wpl 5.4 Restistance of cross‐sections in EC3
Main girder ‐ Bridge type 3
[mm] [mm2] [mm3]
Top Flange 585 12000 7,02E+06 γM0= 1,1 fy= 355 MPa
Web 1 285 17100 4,87E+06Web 2 285 17100 4,87E+06
Bottom Flange 585 12000 7,02E+06
∑ 2,38E+07 Where
34200 mm2
MSd,max= 7311 kNm
ε 0,81 VSd,max= 1247 kN
d 1140tw 30
α 0,5 7677 kNm OK!d/tw 38 6372 kN OK!Class Class 1 →d/tw ≤ 33ε Combined No reduction needed!c 200tf 30
c/tf 6,67Class Class 1 →c/tf ≤ 9ε
Provided that the design value of the shear force V sd does not exceed 50% of the design plastic
shear resistance V pl.Rd no reduction need be made
Wpl=
Design values:
Shear area: Av=Σ(dtw)=
Resistance
MomentShear
Web
Flan
ge
Cross Section Class
.Sd c RdM M≤
.Sd pl RdV V≤
. 0( / 3) /Sd pl Rd v y MV V A f γ≤ =
Appendix A
71

Column
tx L l ty B bmm 300 1500 900 300 2300 1700
A 1920000 mm2
Reinforcement
Cover x (Pcs.) Sox y (Pcs.) Soy x (Pcs.) Sox y (Pcs.) Soymm 50 18 80,9 26 80,6 13 85,4 21 83,0
Outside Bars Inside Bars
3000
Cross‐SectionReshape Chart for Right Scaling
1500
2000
2500
3000
Cross‐SectionReshape Chart for Right Scaling
0
500
1000
1500
2000
2500
3000
0 500 1000 1500 2000
Cross‐SectionReshape Chart for Right Scaling
0
500
1000
1500
2000
2500
3000
0 500 1000 1500 2000
Cross‐SectionReshape Chart for Right Scaling
Appendix A
72

Materials
Safety Class 3 ⇒ γn 1,2Concrete C40/50
Outside Bars 1 ∅ 25 ⇒ Aslo 490,9 mm2/Bar2
Inside Bars 1 ∅ 25 ⇒ Aslo 490,9 mm2/Bar
Stirrups 2 ∅ 10 ⇒ Asv 78,5 mm2/Bar
Creep, RH % 95 φ 1
Reinforcement #Ks40 1 55Ks60 2 Normalt utomhus samt inomhus i icke
Creep, RH %Innomhus i uppvärmde lokaler
Ks60 2Ss260S 3B500B 4 ⩾ 95Ks600S 5Ns500 6Nps500 7
Mycket fuktig miljö
75Normalt utomhus samt inomhus i icke uppvärmde lokaler
fcck fcc fctk fct Eck Ec Ec,eff εcu
MPa MPa MPa MPa MPa MPa MPa -38 19,8 2,4 1,33 35.000 24.306 12.153 0,0035
fyk fst Esk Es εsy
MPa MPa MPa MPa -O id B 500 435 200 000 200 000 0 00217
Rebars
Concrete
Outside Bars 500 435 200.000 200.000 0,00217Inside Bars 500 435 200.000 200.000 0,00217Stirrups 500 435 200.000 200.000 0,00217
Load
k 60.000
70.000
X‐Axis
NSd= 5121 kNMSd= 27292 kNm
10.000
20.000
30.000
40.000
50.000
60.000
70.000
N (kN)
X‐Axis
‐30.000
‐20.000
‐10.000
0
10.000
20.000
30.000
40.000
50.000
60.000
70.000
0 5.000 10.000 15.000 20.000 25.000 30.000 35.000
N (kN)
M (kNm)
X‐Axis
‐30.000
‐20.000
‐10.000
0
10.000
20.000
30.000
40.000
50.000
60.000
70.000
0 5.000 10.000 15.000 20.000 25.000 30.000 35.000
N (kN)
M (kNm)
X‐Axis
Appendix A
73

Appendix B
Appendix B
74

‐1.00
‐0.80
‐0.60
‐0.40
‐0.20
0.00
0.20
0.40
0.60
0.80
1.00
0.00 0.20 0.40 0.60 0.80 1.00M/M
max
x/Ltot
Influence Lines for Moment in External Spans
0.2*37 0.4*37 0.6*37 0.8*37 1.0*37
‐1.00
‐0.80
‐0.60
‐0.40
‐0.20
0.00
0.20
0.40
0.60
0.80
1.00
0.00 0.20 0.40 0.60 0.80 1.00M/M
max
x/Ltot
Influence Lines for Moment in Internal spans
0.2*48 0.4*48 0.6*48 0.8*48 1.0*48
Appendix B
75
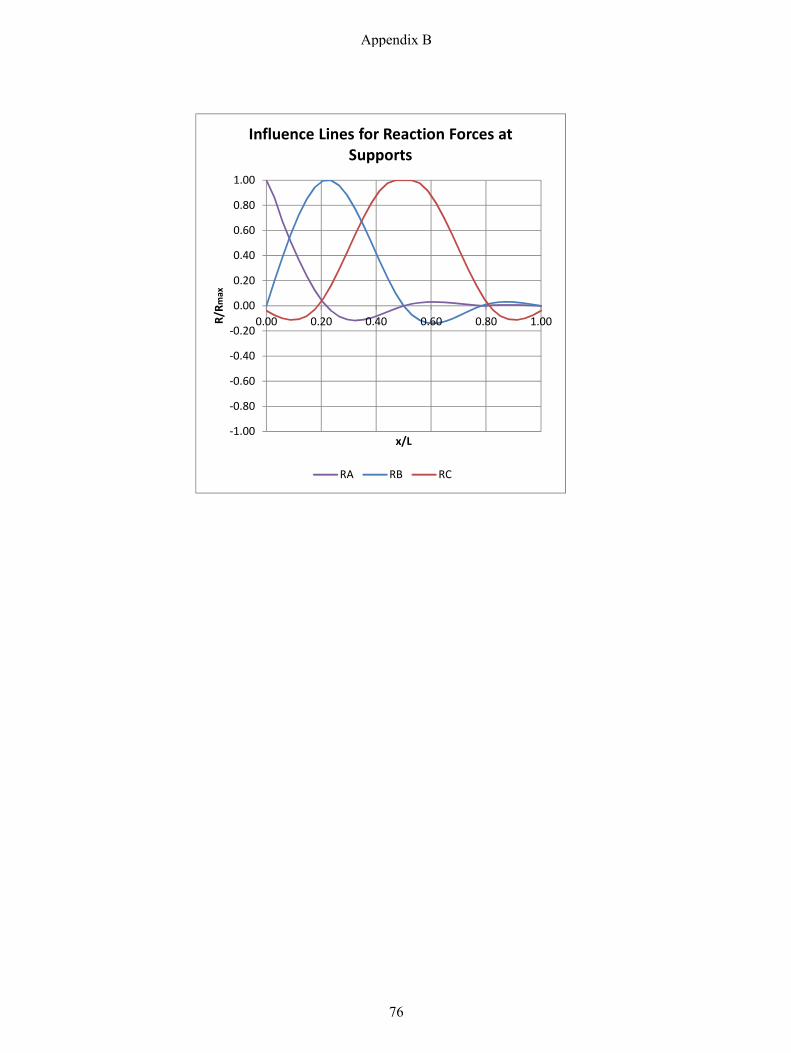
‐1.00
‐0.80
‐0.60
‐0.40
‐0.20
0.00
0.20
0.40
0.60
0.80
1.00
0.00 0.20 0.40 0.60 0.80 1.00R/Rm
ax
x/L
Influence Lines for Reaction Forces at Supports
RA RB RC
Appendix B
76

Appendix B
77

Appendix B
78

Appendix B
79

Appendix B
80

Appendix B
81

Calculations of secondary moment with the three-momentequation
w1 99.023−kNm
:= w2 79.685−kNm
:=
Span lengths:
L1 37m:= L2 48m:=
L4 L1:= L3 L2:=
MA 0kN m⋅:= ME 0kN m⋅:=
MB 1kN m⋅:=
MC 1kN m⋅:=
MD 1kN m⋅:=
EIθ1w1 L1
3⋅
24:= EIθ2
w2 L23
⋅
24:=
EIθ4 EIθ1:= EIθ3 EIθ2:=
Given
MA L1⋅ 2 MB⋅ L1 L2+( )⋅+ MC L2⋅+ 6− EIθ1 EIθ2+( )⋅=
MB L2⋅ 2 MC⋅ L2 L3+( )⋅+ MD L3⋅+ 6− EIθ2 EIθ3+( )⋅=
MC L3⋅ 2 MD⋅ L3 L4+( )⋅+ ME L4⋅+ 6− EIθ3 EIθ4+( )⋅=
Thus, solving these equations, the total moment, with primary and secondary effects, are:
MB
MC
MD
⎛⎜⎜⎜⎝
⎞⎟⎟⎟⎠
Find MB MC, MD, ( )16134
14882
16134
⎛⎜⎜⎝
⎞⎟⎟⎠
kN m⋅⋅=:=
Appendix B
82

Secondary moment from prestress
Prestress forces at service and eccentrities at corresponding positions after losses:
PsupportA 35890kN:= eA 0mm:= MprimaryA PsupportA eA⋅ 0 kN m⋅⋅=:=
Pspan1 36875kN:= e1 410− mm:= Mprimaryspan1 Pspan1 e1⋅ 15119− kN m⋅⋅=:=
PsupportB 37441kN:= eB 283.6mm:= MprimaryB PsupportB eB⋅ 10618 kN m⋅⋅=:=
Pspan2 35482kN:= e2 420− mm:= Mprimaryspan2 Pspan2 e2⋅ 14902− kN m⋅⋅=:=
PsupportC 34795kN:= eC 283.6mm:= MprimaryC PsupportC eC⋅ 9868 kN m⋅⋅=:=
Hence the secondary moments become:
MsecondaryA 0kN m⋅:=
MsecondaryB MB MprimaryB− 5515 kN m⋅⋅=:=
Msecondaryspan11387537000
MsecondaryB⋅ 2068 kN m⋅⋅=:=
MsecondaryC MC MprimaryC− 5015 kN m⋅⋅=:=
Msecondaryspan2 MsecondaryBMsecondaryC MsecondaryB−
2+ 5265 kN m⋅⋅=:=
Total bending from prestress:
MpA MsecondaryA MprimaryA+ 0 kN m⋅⋅=:=
Mp1 Msecondaryspan1 Mprimaryspan1+ 13050− kN m⋅⋅=:=
MpB MsecondaryB MprimaryB+ 16134 kN m⋅⋅=:=
Mp2 Msecondaryspan2 Mprimaryspan2+ 9637− kN m⋅⋅=:=
MpC MsecondaryC MprimaryC+ 14882 kN m⋅⋅=:=
Appendix B
83

Calculations of ultimate moment capacity
Ap1 4200mm2:= Ep 195000MPa:=
Ap 8 Ap1⋅:= Ec 36000MPa:=
Igsupport 1.5648 1012⋅ mm4
:= Agsupport 3770000mm2:=
Igspan 1.3462 1012⋅ mm4
:= Agspan 3230000mm2:=
Bending from self-weight and traffic loads in ULS:
MsupportA1 0kN m⋅:=
Mspan11 30314kN m⋅:=
MsupportB1 40838− kN m⋅:=
Mspan21 31954kN m⋅:=
MsupportC1 43737− kN m⋅:=
Bending in ULS with prestress:
MA.ULS MsupportA1 MA+ 0 kN m⋅⋅=:=
M1.ULS Mspan11 Msecondaryspan1+ Mprimaryspan1+ 17264 kN m⋅⋅=:=
MB.ULS MsupportB1 MsecondaryB+ MprimaryB+ 24704− kN m⋅⋅=:=
M2.ULS Mspan21 Msecondaryspan2+ Mprimaryspan2+ 22317 kN m⋅⋅=:=
MC.ULS MsupportC1 MsecondaryC+ MprimaryC+ 28855− kN m⋅⋅=:=
Appendix B
84

Effective depth, d: Width of the girder:
d1 1163.3mm:= bspan 1100mm:=
dB 1523.5mm:= bsupport 1400mm:=
Allowable yield strength of the steel (figure 3.10 in EC2):d2 1173.3mm:=
fpk 1860MPa:= fp0.1k 1640MPa:=
dC 1523.5mm:=γp 1.15:=
fck 45MPa:= fpdfp0.1k
γp1426 MPa⋅=:=
fpdEp
0.007313=
γc 1.5:=εud 0.02:= Strain limit recommended by EC2.
α 1:=
Appendix B
85

Ultimate moment capacity at span 1:Ultimate compressive strain in concrete:
εult 0.0035:=
Concrete strain due to prestress at the level of the tendon:
εce.11Ec
Pspan1Agspan
Mp1 e1⋅
Igspan+
⎛⎜⎝
⎞⎟⎠
⋅ 0.000428=:=
Total ultimate strain in concrete at the level of the tendons:
εct.1εult− d1 x1−( )⋅
x1=
Tendon strain:
εpu.1Pspan1−
Ap Ep⋅εct.1+ εce.1−=
Concrete compressive force:
Fc.1 0.8 x1⋅ bspan⋅α fck⋅
γc⋅=
Total force in tendon:
Fp.1 Ap Ep εpu.1⋅( )⋅=
Equilibrium of forces:
Fp.1 Fc.1+ 0=
Which leads to:
x1 1mm:=
Given
Ap EpPspan1−
Ap Ep⋅
εult− d1 x1−( )⋅
x1+ εce.1−
⎡⎢⎣
⎤⎥⎦
⋅⎡⎢⎣
⎤⎥⎦
⋅ 0.8 bspan⋅ x1⋅α fck⋅
γc⋅+ 0=
x1 Find x1( ) 1.371 m=:=
Check if steel stress is ok:
εct.1εult− d1 x1−( )⋅
x10.000531=:=
εpu.1Pspan1−
Ap Ep⋅εct.1+ εce.1− 0.005525−=:= Less than fpd/Ep=0.007313
Appendix B
86

Ultimate moment capacity:
z1 d1 0.4 x1⋅−( ) 0.615 m⋅=:=
Fc1 0.8 bspan⋅ x1⋅α fck⋅
γc⋅ 36199 kN⋅=:=
Mult1 Fc1 z1⋅ 22256 kN m⋅⋅=:=
Appendix B
87

Ultimate moment capacity at support B:Ultimate compressive strain in concrete:
εult 0.0035=
Concrete strain due to prestress at the level of the tendon:
εce.B1Ec
PsupportBAgsupport
MpB eB⋅
Igsupport+
⎛⎜⎝
⎞⎟⎠
⋅ 0.000357=:=
Total ultimate strain in concrete at the level of the tendons:
εct.Bεult− dB xB−( )⋅
xB=
Tendon strain:
εpu.BPsupportB−
Ap Ep⋅εct.B+ εce.B−=
Concrete compressive force:
Fc.B 0.8 xB⋅ bsupport⋅α fck⋅
γc⋅=
Total force in tendon:
Fp.B Ap Ep εpu.B⋅( )⋅=
Equilibrium of forces:
Fp.B Fc.B+ 0=
Which leads to:
xB 1mm:=
Given
Ap EpPsupportB−
Ap Ep⋅
εult− dB xB−( )⋅
xB+ εce.B−
⎡⎢⎣
⎤⎥⎦
⋅⎡⎢⎣
⎤⎥⎦
⋅ 0.8 bsupport⋅ xB⋅α fck⋅
γc⋅+ 0=
xB Find xB( ) 1.301 m=:=
Check if steel stress is ok:
εct.Bεult− dB xB−( )⋅
xB0.000599−=:=
εpu.BPsupportB−
Ap Ep⋅εct.B+ εce.B− 0.006671−=:= Less than fpd/Ep=0.007313
Appendix B
88

Ultimate moment capacity:
zB dB 0.4 xB⋅−( ) 1.003 m⋅=:=
FcB 0.8 bsupport⋅ xB⋅α fck⋅
γc⋅ 43707 kN⋅=:=
MultB FcB zB⋅ 43846 kN m⋅⋅=:=
Appendix B
89

Ultimate moment capacity at span 2:Ultimate compressive strain in concrete:
εult 0.0035=
Concrete strain due to prestress at the level of the tendon:
εce.21Ec
Pspan2Agspan
Mp2 e2⋅
Igspan+
⎛⎜⎝
⎞⎟⎠
⋅ 0.000389=:=
Total ultimate strain in concrete at the level of the tendons:
εct.2εult− d2 x2−( )⋅
x2=
Tendon strain:
εpu.2Pspan2−
Ap Ep⋅εct.2+ εce.2−=
Concrete compressive force:
Fc.2 0.8 x2⋅ bspan⋅α fck⋅
γc⋅=
Total force in tendon:
Fp.2 Ap Ep εpu.2⋅( )⋅=
Equilibrium of forces:
Fp.2 Fc.2+ 0=
Which leads to:
x2 1mm:=
Given
Ap EpPspan2−
Ap Ep⋅
εult− d2 x2−( )⋅
x2+ εce.2−
⎡⎢⎣
⎤⎥⎦
⋅⎡⎢⎣
⎤⎥⎦
⋅ 0.8 bspan⋅ x2⋅α fck⋅
γc⋅+ 0=
x2 Find x2( ) 1.335 m=:=
Check if steel stress is ok:
εct.2εult− d2 x2−( )⋅
x20.000424=:=
εpu.2Pspan2−
Ap Ep⋅εct.2+ εce.2− 0.00538−=:= Less than fpd/Ep=0.007313
Appendix B
90

Ultimate moment capacity:
z2 d2 0.4 x2⋅−( ) 0.639 m⋅=:=
Fc2 0.8 bspan⋅ x2⋅α fck⋅
γc⋅ 35248 kN⋅=:=
Mult2 Fc2 z2⋅ 22532 kN m⋅⋅=:=
Appendix B
91

Ultimate moment capacity at support C:Ultimate compressive strain in concrete:
εult 0.0035=
Concrete strain due to prestress at the level of the tendon:
εce.C1Ec
PsupportCAgsupport
MpC eC⋅
Igsupport+
⎛⎜⎝
⎞⎟⎠
⋅ =:=
Total ultimate strain in concrete at the level of the tendons:
εct.Cεult− dC xC−( )⋅
xC=
Tendon strain:
εpu.CPsupportC−
Ap Ep⋅εct.C+ εce.C−=
Concrete compressive force:
Fc.C 0.8 xC⋅ bsupport⋅α fck⋅
γc⋅=
Total force in tendon:
Fp.C Ap Ep εpu.C⋅( )⋅=
Equilibrium of forces:
Fp.C Fc.C+ 0=
Which leads to:
xC 1mm:=
Given
Ap EpPsupportC−
Ap Ep⋅
εult− dC xC−( )⋅
xC+ εce.C−
⎡⎢⎣
⎤⎥⎦
⋅⎡⎢⎣
⎤⎥⎦
⋅ 0.8 bsupport⋅ xC⋅α fck⋅
γc⋅+ 0=
xC Find xC( ) 1.25 m=:=
Check if steel stress is ok:
εct.Cεult− dC xC−( )⋅
xC0.000767−=:=
εpu.CPsupportC−
Ap Ep⋅εct.C+ εce.C− 0.006409−=:= Less than fpd/Ep=0.007313
Appendix B
92

Ultimate moment capacity:
zC dC 0.4 xC⋅−( ) 1.024 m⋅=:=
FcC 0.8 bsupport⋅ xC⋅α fck⋅
γc⋅ 41990 kN⋅=:=
MultC FcC zC⋅ 42982 kN m⋅⋅=:=
Appendix B
93


