job. The Albania National Employment Service Functional...
43
job. The Albania National Employment Service Functional Review: An Overview May 2018 . . Social Protection and Labor Global Practice (GSPDR) Europe and Central Asia Region . .h . Public Disclosure Authorized Public Disclosure Authorized Public Disclosure Authorized Public Disclosure Authorized
Transcript of job. The Albania National Employment Service Functional...
job.
The Albania National Employment Service
Functional Review: An Overview
May 2018
.
.
Social Protection and Labor Global Practice (GSPDR)
Europe and Central Asia Region
.
.h
.
Pub
lic D
iscl
osur
e A
utho
rized
Pub
lic D
iscl
osur
e A
utho
rized
Pub
lic D
iscl
osur
e A
utho
rized
Pub
lic D
iscl
osur
e A
utho
rized
ii
Standard Disclaimer:
.
This volume is a product of the staff of the International Bank for Reconstruction and Development/ The World Bank. The
findings, interpretations, and conclusions expressed in this paper do not necessarily reflect the views of the Executive
Directors of The World Bank or the governments they represent. The World Bank does not guarantee the accuracy of the
data included in this work. The boundaries, colors, denominations, and other information shown on any map in this work
do not imply any judgment on the part of The World Bank concerning the legal status of any territory or the endorsement
or acceptance of such boundaries.
.
Copyright Statement:
.
The material in this publication is copyrighted. Copying and/or transmitting portions or all of this work without permission
may be a violation of applicable law. The International Bank for Reconstruction and Development/ The World Bank
encourages dissemination of its work and will normally grant permission to reproduce portions of the work promptly.
For permission to photocopy or reprint any part of this work, please send a request with complete information to the
Copyright Clearance Center, Inc., 222 Rosewood Drive, Danvers, MA 01923, USA, telephone 978-750-8400, fax 978-750-
4470, http://www.copyright.com/.
All other queries on rights and licenses, including subsidiary rights, should be addressed to the Office of the Publisher, The
World Bank, 1818 H Street NW, Washington, DC 20433, USA, fax 202-522-2422, e-mail [email protected].

iii
Co-financed by
The Austrian Ministry of Finance

iv
Content
Acknowledgments ........................................................................................................................................ vi
Acronyms and Abbreviations ...................................................................................................................... vii
Key Messages ............................................................................................................................................. viii
1. Introduction .......................................................................................................................................... 1
2. Context .................................................................................................................................................. 3
3. Data Envelopment Analysis: Methodology and data .......................................................................... 10
4. Main findings ...................................................................................................................................... 14
4.1 The NES became more productive between 2013 and 2016 ..................................................... 14
4.2 Average effectiveness has increased but remains very low ....................................................... 15
4.3 Vast differences arise in effectiveness between regional offices ............................................... 17
4.4 Savings and substantial jobs gains would arise from increasing efficiency, impact, and
effectiveness ........................................................................................................................................... 18
4.5 Branch offices vary in their performance over time and depending on the model ................... 20
4.6 Reorganizing and/or merging branch offices would not substantially increase efficiency ........ 21
4.7 Environmental factors influence NES branches’ success ............................................................ 22
4.8 A mix of activities is likely to be most effective for increasing jobs placements ........................ 23
4.9 Offices could learn from peers .................................................................................................... 24
5. Conclusions ......................................................................................................................................... 26
References .................................................................................................................................................. 28
Annex 1. Additional tables and figures ....................................................................................................... 29

v
Boxes
Box 1: Functional PES reviews in the Western Balkan………………………………………………………………………………2 Box 2: Data Envelopment Analysis (DEA): Key points ................................................................................. 11
Figures
Figure 1: Challenges in Albania’s labor markets ........................................................................................... 1 Figure 2: Budget and spending on employment promotion programs increased over time ....................... 6 Figure 3: Albania’s spending on ALMPs is low compared to EU comparators (%of GDP) ............................ 6 Figure 4: Jobs placements performance of NES services and programs, 2013–2016 .................................. 7 Figure 5: Number of people trained in public training centers by employment status at completion ........ 7 Figure 6: NES caseload compared to European standards ........................................................................... 8 Figure 7: Employment situation over time and by region ............................................................................ 9 Figure 8: DEA of branch offices in Albania .................................................................................................. 13 Figure 9: Total staff (input) and those unemployed transitioning into jobs (outcomes) ........................... 16 Figure 10: Distribution of offices according to class of effectiveness score ............................................... 17 Figure 11: Scale efficiency by model ........................................................................................................... 22
Tables
Table 1: NES Employment Promotion programs .......................................................................................... 5 Table 2: Changes in performance and causes, 2013–2016......................................................................... 15 Table 3: Average efficiency, impact, and effectiveness, 2013–2016 .......................................................... 16 Table 4: Potential savings and improvements from improving efficiency in activities (M1), 2013–2016 . 19 Table 5: Potential savings and improvements from improving impact ...................................................... 19 Table 6: Potential savings and improvements from improving overall effectiveness ................................ 20 Table 7: Top 10 offices (based on mean scores 2013–2016) ...................................................................... 21 Table 8: Effects of one additional unit of output on the number of jobs ................................................... 23 Table 9: Effects of one additional unit of input on the number of jobs ..................................................... 24 Table 10: Peer offices identified by model (2016) ...................................................................................... 25
Annex Tables
Annex Table 1: Ranking and efficiency scores by branch ........................................................................... 29 Annex Table 2: Key data, branch offices ..................................................................................................... 30 Annex Table 3: Econometric analysis of Effectiveness Model (M3) with constant returns to scale,
assumption of technical development ............................................................................................... 31

vi
Acknowledgments
This overview note was prepared by Maddalena Honorati and Sara Johansson de Silva. The note benefited from comments by Ms. Dajna Sorenson, Albanian Deputy Minister of Finance and Economy, and by all participants in the dissemination workshop held at the Tirana World Bank Office on November 6, 2017. Special thanks go to Ms. Etleva Gjelaj from the National Employment Service for sharing detailed data on employment services and training program participation. Part of this note is based on a technical report prepared by a team from the Institute for Advanced Studies Vienna, led by Alexander Schnabl and including Helmut Hofer, Sarah Lappöhn, Alina Pohl, and Hannes Zenz. The technical report is available upon request as:
Schnabl, A., H. Hofer, S. Lappöhn, A. Pohl, and H. Zenz (2017): “Albania Functional Review: Efficiency Analysis of the National Employment Service – 2013–2016, Technical Report.” Background paper. Washington, DC: World Bank.
The team is grateful for the administrative support provided by Dung Ngoc Tran in Washington, D.C., and
Elda Hafizi in Albania. This study benefited from the excellent editorial work of Amy Gautam.
Generous financing for this project was provided by the Austrian Ministry of Finance.

vii
Acronyms and Abbreviations
ALL Albanian lek
ALMP Active labor market program
CRS Constant returns to scale
DEA Data Envelopment Analysis
EP Employment promotion
EU European Union
GDP Gross domestic product
LFS Labor Force Survey
M&E Monitoring and evaluation
NE Ndihma Ekonomike
NES National Employment Service
VRS Variable returns to scale

viii
Key Messages
Efficient and effective public services aimed at fostering job matching can make a significant difference in improving labor market outcomes. This note looks at the performance of the local branch offices of Albania’s National Employment Service (NES) in helping the unemployed find jobs in the formal sector. The methodology, best described as a quantitative benchmarking of best practices of NES branch offices at national level, compares how efficiently different branch offices use their resources to produce different services and the impact of these activities on the number of unemployed who can find jobs in the formal sector. The methodology provides each branch office with an analysis of weaknesses and strengths.
Key analytical findings are:
• The NES became more productive – i.e., better at placing the unemployed in formal jobs for a given level of resources and activities – between 2013 and 2016. This general improvement was mostly due to a strong catch-up process, whereby the performance of less efficient offices caught up with that of better offices.
• NES offices’ average effectiveness in using resources to produce better jobs outcomes is still very low, however, meaning that most offices’ performance remains far from that of the best-performing offices.
• On average, increasing the number of vacancies and contacting employers pay off more than involving the unemployed in active measures on education/employment to increase jobs placement.
• Vast differences exist in effectiveness between different branch offices. In 2016, more than one-half of branch offices had efficiency scores below 40 percent. The divergence in outcomes and the high share of very poor-performing offices is different from patterns observed in neighboring countries (Serbia).
• No one office performs consistently high. Offices vary significantly in their performance over time and across different segments of the results chain (efficiency in producing activities, or efficiency in producing jobs placements with those activities).
• The local context for job creation, which is beyond the influence of the NES, matters for office outcomes. This is particularly true for measures of local labor demand. Given this, it is critical for each office to adapt the mix of activities to the local context. Any performance evaluation must take local conditions into account.
The policy implications are:
• Data availability and data accuracy were problematic in the collection of information for this exercise. The limited availability of basic information on budget specificities at a local office level, for example, suggests that monitoring and evaluation for the purpose of performance management needs to be strengthened.

ix
• The NES could save substantially on resources and, more importantly, increase jobs placements significantly, if more offices emulated the most successful ones.
• The NES’s scale of operation appears to be efficient. This means that reorganizing the NES geographically (by merging or splitting offices) would not substantially increase effectiveness. Efforts should be made within the current structures of each office.
So what could branch offices do in practice with the information provided here?
o First, by looking at the different efficiency measures they could disentangle where, in the process of converting resources into jobs placements, difficulties emerge. Are there inefficiencies in how resources (staff, expenditures) are used to produce different activities aimed at improving jobs outcomes? Or are these activities ineffective in helping the unemployed find jobs? A process evaluation of a selected group of offices could be carried out to better understand how top-ranked offices manage inputs and activities better than offices with similar inputs.
o Second, offices could learn from peer offices. This internal benchmarking exercise identifies, for each office that is not fully effective, other offices that use a similar mix of inputs and outputs (resources, staff, activities) but see better results. As a first step, branch offices can approach these offices and try to evaluate differences in context, processes, and approaches and adapt their own management.
o Third, more office resources and staff efforts should be paid on contacting employers and registering vacancies, as these activities consistently stand out as more effective in fostering jobs placements.

1
1. Introduction
Albania’s labor markets improved between 2014 and 2016: more people than before found jobs and unemployment rates fell. However, many challenges remain to channel the jobless into jobs. By 2016, about 0.9 million persons remained jobless (either inactive or unemployed). Young people are significantly less likely to be employed, as are low-skilled adults. Women are more likely to be excluded from good job opportunities compared to men. Unemployment is predominantly structural rather than short term – more than two-thirds of the unemployed have been unemployed for more than one year, and one-third for more than four years. Discouraged workers who have dropped out of the labor force because they gave up hope of finding a job comprise a significant share of the labor force (Honorati and Johansson de Silva 2018).
Figure 1: Challenges in Albania’s labor markets
Source: Estimates based on Labor Force Survey (LFS) 2014–2016.
Efficient and effective public employment services aimed at fostering successful job matching can make a significant difference in reducing unemployment rates. Certain types of job matching might be especially valuable for the poor and vulnerable, who tend to be less connected with economic opportunities. The role of Albania’s National Employment Service (NES) is to assist jobseekers in job search and increase their employability or capacity for entrepreneurship, through skills training and other active labor market programs (ALMPs). The services offered by the NES include registration of jobseekers, job intermediation, counseling services and guidance for jobseekers, preparation of and checking eligibility documents for unemployment benefits, vocational training, and employment promotion. The NES works through 36 branch offices, of which 24 are local offices and 12 operate at the regional level.
A core part of Albania’s current reform program is to increase the capacity of public institutions to provide effective public services, including modern performance management of the NES. To inform this process, the World Bank, together with the Institute for Advanced Studies, prepared an analysis of the efficiency and staffing levels of the NES by benchmarking the inputs, activities, and outcomes of its 36 branch offices, using the Data Envelopment Analysis (DEA) methodology, for the years 2013–2016. The DEA approach allows for quantification of how well NES branches use resources to improve labor
0%
10%
20%
30%
40%
50%
60%
70%
80%
Tota
l
Mal
e
Fem
ale
15
-29
30
-64
Prim
ary
or
less
Seco
ndar
y
Tert
iary
Shar
e o
f po
pu
lati
on in
age
gro
up
(%)
Employment-to-population ratios
2014 2015 2016
0%
5%
10%
15%
20%
25%
30%
35%To
tal
Mal
e
Fem
ale
15-2
9
30-6
4
Pri
mar
y o
r le
ss
Seco
nd
ary
Tert
iary
Shar
e o
f act
ive
po
pu
lati
on
(%)
Unemployment rates
2014 2015 2016

2
market outcomes (defined as jobs in the formal sector) of NES beneficiaries in three efficiency indicators. The methodology helps identify areas of adjustment for each branch office —in both inputs and outputs – and as such provides reform and policy advice at a very detailed level.
This overview note provides a summary of the main findings of the analysis, with a focus on providing policy-relevant insights. The overview is based on a technical report in which details, including detailed benchmarking for each branch office, are available (Schnabl et al. 2018).
The purpose of this exercise is to benchmark Albania’s NES branch offices against each other to identify “best practices” and pathways to increase their overall efficiency (good use of resources in delivering outcomes) and effectiveness (delivering highest possible outcome). The analysis aims at addressing the following questions:
• How much improvement could be achieved overall?
• How do branch offices compare with one another?
• What could each individual branch offices do to become more efficient?
• Have branch offices become more efficient over time?
• What is driving changes in efficiency and productivity?
• Which adjustments in inputs (level of expenditures, staff reductions or increases) have most impact on efficiency?
This note provides a brief description of the labor market challenges and constraints facing the NES (Section 2), an overview of the methodology (Section 3), and a summary of key findings (Section 4). Section 5 concludes.
Box 1: Functional PES reviews in the Western Balkan
As part of the World Bank’s analytical and technical support to help build capacity in the Public Employment Services in the Western Balkan, a set of functional reviews of the PES have been prepared, for five countries: Albania, Bosnia-Herzegovina, Former Yugoslav Republic of Macedonia, Montenegro, Serbia. The reviews are based on the methodology of Data Envelopment Analysis (DEA), best described as a benchmarking exercise comparing the inputs (resources), outputs (activities) and outcomes (jobs placements) across branches. The DEA methodology, providing just one tool for performance management, can help identify areas of adjustment for each branch offices as well as offices that can serve as peer model offices in exchanges around policy options and approaches. However, the results are not comparable across countries – best practice in one country may in fact compare poorly with best practice in another country.
A synthesis note summarizing key results from the functional reviews of the five countries is forthcoming. In addition, for each country, a detailed technical report exists, as well as a synthesis focusing on main analytical results and policy implications. The reader is referred to these reports for details.

3
2. Context
The performance of the NES is conditioned on several factors beyond the control of the agency. These include the overall economic environment, as well as specific local challenges facing local branch offices related to economic activity, demand for labor, characteristics of unemployed jobseekers, and the scale and availability of employment promotion (EP) programs.
Recent years brought some positive developments to Albania’s labor market. Economic growth began to pick up and employment increased; at the same time, more jobs and workers moved out of agriculture and into sectors with higher productivity. The employment rate increased from 50 percent in 2013 to 57 percent in 2017 (second quarter), low by European standards but the highest in the Western Balkans. The increase in the employment rate reflected an increase in labor force participation. Specifically, women increased their participation rate by 9 percentage points over two years, from 50 percent in 2013 to 58 percent in 2017. This increase represented a catch-up with past levels in 2012 (Honorati and Johansson de Silva forthcoming 2018).
The youth unemployment rate reached a peak in 2014 (34 percent, about three times higher than the adult unemployment rate), to then start a downward trend in the last two years. Signs also indicate that the quality of jobs has improved over time: workers are shifting into jobs that, on average, provide higher and more secure income, from the agriculture to the service sector. The level of informality fell slightly in the nonagriculture sectors – from 35 percent in 2011 to 30 percent in 2013 in the industry sector and from 46 percent to 42 percent in the services sector over the same period. The share of wage employment overall increased from 39 percent in 2011 to 41 percent in 2013 (LFS 2013).
Challenges remain, however. First, there are still not enough jobs. Almost 1 million adult Albanians (one-half of the working-age population) are jobless, either unemployed or inactive. About one in four youth are inactive and not in any form of education and training (23 percent of the age group 15–29). Similarly, the group of jobless youth who are either unemployed or inactive not in school (NEETs) make up 34 percent of the age group 15–29 in Albania, the highest level among European countries and more than twice the European Union (EU) average of 14.8 percent.
Second, despite overall labor market improvements, men’s employment rate is still about 13 percentage points higher than women’s. Gender disparities are also evident in the workforce, as women are more vulnerable in the kind of work they do, tend to work in less productive sectors, and earn less than men do; for women, transition from school to work is slower and more likely to be incomplete.
Third, the quality of work still needs to improve, as labor productivity is low, even by regional standards. Low productivity of employment reflects the structure of the workforce, which is predominantly engaged in agriculture and trade services. With over 43 percent of all jobs in agriculture, Albania has the highest share of agricultural employment among countries in the Europe and Central Asia region. And its relative (labor) productivity of agriculture (the ratio of sector share in value added and sector share in employment) is the lowest in the region. Albania has also the lowest wage level, the highest informality rate (although decreasing), and high levels of self-employment in the region (Honorati and Johansson de Silva, 2018).
4
Finally, job creation should be more inclusive of the poor, who have worse labor market outcomes and challenges, reflecting their lower education levels, lower mobility, and other constraints to access better job opportunities.
The role of the NES is to respond to these challenges. The number of registered unemployed jobseekers in Albania was more or less stable during the past decade, ranging from 149,000 in 2006 to 145,000 in 2015. However, the number of registered jobseekers sharply decreased in 2016 as a consequence of the 2015 law regulating the registration procedures of all unemployed who look for jobs through the NES. This change in the law affected the number of registered unemployed, which decreased sharply from 145,000 in 2015 to below 100,000 in 2016.
The legal change in the definition of jobseekers also affected the composition of the registered unemployed, with the long-term unemployed representing an even larger share (58 percent) of the total registered unemployed after the reform in 2016. The number of registered jobseekers in Ndihma Ekonomike (NE), the flagship cash transfer program targeted to the poor households, instead also rapidly declined, from 193,000 in 2000 to 85,400 in 2010 to 39,900 in the fourth quarter of 2017.1 The number of NE beneficiaries registered with the NES is, however, expected to increase given the current government’s effort to roll out the new eligibility rule for NE cash transfers nationwide. The national roll-out of NE started on January 1, 2018; registration with the NES for working-age unemployed applicants is an eligibility condition according to the new eligibility rule and procedures to qualify for NE cash support.
Access to employment services is not equal. Among the unemployed, registration with NES offices is strongly skewed toward men, urban areas, and relatively better-educated individuals. NES data show that 54 percent of unemployed jobseekers have only nine years of education at the most, while 42 percent have general secondary or vocational secondary degrees, and the remaining 4 percent have university degrees.
The use of NES services by employers is also low. Only 7.4 percent of firms used NES to recruit workers (Albania STEP Employer Survey, Honorati and Johansson de Silva 2018b). More than one-half of firms use informal channels for recruitment and, perhaps surprisingly, innovative firms, large firms, and foreign-owned firms are even more likely to do so.
The services offered by the NES include (i) registration of jobseekers, (ii) job intermediation, (iii) counseling services and guidance for jobseekers, (iv) preparation of and checking eligibility documents for unemployment benefits, (v) vocational training, and (vi) EP programs. The NES administers seven EP programs, of which four are wage subsidies (Table 1). The Monitoring and Evaluation (M&E) of such EP programs is weak, and there is no rigorous evaluation of the impact of the programs for different subgroups (with a well-defined counterfactual). Overall, evidence is missing to enhance the design of existing EP programs and introduce new programs that would better address Albania’s employment challenges, and both the financing and implementation of existing programs appear quite fragmented and limited in their strategic direction.
1 The share of NE beneficiaries out of all registered jobseekers decreased sharply from 90 percent in 2000, to 76 percent in 2005, to 60 percent in 2010, and to 46 percent as of January 2018 (NES).

5
Table 1: NES Employment Promotion programs
Number Name Instrument Number of beneficiaries
DCM no. 47
Employment promotion program through job training
Wage subsidy 1,975
DCM no. 48
Employment promotion program to unemployed jobseekers in difficulty
Wage subsidy 2,432
DCM no. 27
Employment of women from particular groups Wage subsidy 97
DCM no. 199
Employment of tertiary graduates entering labor market for the first time
Wage subsidy 173
DCM no. 873
Professional training practice for students Internship/On-the-job training
489
DCM no. 248
Employment promotion program for the disabled On-the-job training and wage subsidy
44
DCM no. 64
Employment promotion program for orphans On-the-job training and wage subsidy
1
Source: NES. Note: The number of beneficiaries refers to 2016.
Adult (post-secondary) vocational training programs are limited in scale and diversity and do not respond to the needs of the labor market. Public provision of vocational training is offered through nine vocational training centers (VTCs) located in the main regions and one mobile center. Apart from these VTCs, about 300 private providers deliver training for unemployed jobseekers. The delivery modality of vocational training is class-based. The VTCs offer trainings (mainly between three to four months, but some up to two years), and provide job-specific skills or supplementary skills (computer literacy, languages, etc.). An assessment of training providers conducted by the World Bank shows that in general, the quality of training by private providers is hampered by similar challenges of low quality and relevance.
The NES’s total expenditures increased over time, but are low compared to EU standards. The NES budget includes funds that cover three main cost categories: unemployment benefits,2 vocational training programs, and EP programs. The NES’s total expenditures increased from 0.084 percent of gross domestic product (GDP) in 2013 to 0.098 percent in 2016. The overall budget for unemployment benefits and staff decreased over time, while the average budget for EP programs increased. Unemployment benefits still accounts for 50 percent of the NES total budget as opposed to 32 percent spent on active measures (in 2016). The increase in budget (EP expenses) reflected an increase in both the number of participants in EP programs (especially DCM no. 47 and no. 48) and the average benefit (or wage subsidy in the case of EP programs), especially for the socially vulnerable unemployed and jobseekers with disabilities. Nonetheless, Albania spending on ALMPs is also low compared to EU standards (Fig. 3 and 4).
2 Unemployment benefits were originally planned to be financed by contributions, but instead funds are redistributed internally to other programs (registered as loans from the unemployment fund and mainly used for urban pensions). Unemployment benefits are financed by the state budget and administered directly by NES offices.

6
Figure 2: Budget and spending on employment promotion programs increased over time
Source: Administrative data provided by the NES. Note: *Budget on maintenance plus spending on ALMPs.
Figure 3: Albania’s spending on ALMPs is low compared to EU comparators (%of GDP)
Source: Regional Cooperation Council - Employment and Social Affairs Platform.
While the average budget for EP programs increased over time, the overall coverage of EP programs is still low. Only about 5.5 percent of registered jobseekers participated in EP programs offered by the NES and 8.5 percent participated in vocational training courses in 2016. Overall, only a minor fraction of the registered unemployed are able to ultimately benefit from NES services and programs, relative to the needs.
The overall jobs placements performance of the NES mediation services, EP programs, and vocational training is low, although it has improved over time. In 2016, almost 17,000 unemployed jobseekers were employed through NES mediation services (about 18 percent of registered unemployed), 1,989 through EP programs (38 percent of participants), and 691 in vocational training (about 9 percent of participants). Overall, jobseekers employed through active measures represent 3 percent of the total registered jobseekers.
Only 9 percent of NES jobseekers who are certified in VCTs are employed immediately after completing the training courses. Women represent one-third of those employed (and about 40 percent of total registered trainees). Employment rates among vocational training graduates vary depending on the
0
1000
2000
3000
4000
5000
6000
7000
2013 2014 2015 2016
Number of participants in ALMPs
Other
Program 873
Program 199
Program 27
Program 48
Program 47
0.0%
0.5%
1.0%
1.5%
2.0%
Alb
ania
Bo
snia
-He
rz.
Ko
sovo
*M
ace
do
nia
Mo
nte
ne
gro
Serb
ia
Au
stri
aB
elg
ium
De
nm
ark
Ger
man
yIr
ela
nd
Gre
ece
Spai
nFr
ance
Ital
yC
ypru
sLu
xem
bo
urg
Mal
taN
eth
erla
nd
sP
ort
uga
lFi
nla
nd
Swed
en
Bu
lgar
iaC
roat
iaC
zech
Rep
ub
licEs
ton
iaLa
tvia
Lith
uan
iaH
un
gary
Po
lan
dR
om
ania
Slo
ven
iaSl
ova
kia
ALMPs Services Active measures Region average (ALMP)

7
profession. Repair of electrical equipment, hairdressing, and cooking have the largest numbers of participants, followed by other courses like tailoring, plumbing service, and car repair. The demand for vocational training in service professions in part reflects the highest jobs placements rates (and job demand) in tailoring, computer repair, and accounting trades (Figure 5).
Figure 4: Job placements performance of NES services and programs, 2013–2016
Source: NES administrative data.
Figure 5: Number of people trained in public training centers by employment status at completion
Source: NES administrative data 2016.

8
Based on LFS data, jobs placement is also low. Fifteen percent of the current employed found a job through NES offices, compared to 31 percent through friends and relatives. Moreover, although youth are often the target of job information and intermediation services, they are in fact unlikely to find employment using NES services – only 4 percent found a job through an NES office, possibly reflecting the types of vacancies available. This is also the case for the less educated, of whom only 3 percent found a job through an NES office, compared to 23 percent of those with a tertiary education.
Finally, the NES operates under constrained resources. The caseload (or the ratio of unemployed jobseekers per NES counselor) was 327 in 2016, relatively high compared to EU countries, although lower than in Serbia and FYR Macedonia (Figur). Set against a staff/client ratio of 1:150 in the EU and 1:100 according to the International Labour Organization’s (ILO) recommendations (Kuddo 2012), the NES ratios are quite high and preclude individualized and intensive services for the unemployed. However, Albania compares well in terms of registered jobseekers per vacancy: on average, nine jobseekers are registered per one vacancy, pointing to the fact that local labor demand is not binding; rather NES performance constraints are more on management practices, staffing, and overall low scale of services provided.
Figure 6: NES caseload compared to European standards
Source: NES administrative data (Albania), Kuddo 2012 (for other countries).
Challenges differ across the 36 branch areas and NES offices. This is illustrated in: the share of registered unemployed in total population of the branch case area; the share of long-term unemployed, who represent the hardest to serve; and the caseload (Figure). NES data on the registered unemployed show that the highest numbers of unemployed jobseekers are in highly populated urban areas (e.g., Tirana, Elbasan, Durres, Fier) but also in less urbanized districts in the north (like Kukes). However, Figure 7a shows that unemployed jobseekers (as a share of total district population) are more highly concentrated in the northern districts of Kukes, Kolonje, Tropoja, and Has. This is to be expected given that these are mountainous areas with less concentration of industry, worse infrastructure, and higher poverty rates on average. Caseload also varies by NES branch. Despite the reduction in the number of registered unemployed in 2016, caseloads did not decrease proportionally across branches (Figure 7b).
0 100 200 300 400 500
Germany
Sweden
Belgium
Czechia
Austria
Hungary
France
Slovenia
Lithuania
Finland
Croatia
Netherlands
Albania
FYR Macedonia
Ratio of registered job seekers to PES staff (caseload)

9
Figure 7: Employment situation over time and by region
a. Unemployment as share of population
b. Caseload
Source: Estimates based on NES administrative data on numbers of registered unemployed and staff employed.
0%
2%
4%
6%
8%
10%
12%
BER
AT
BU
LQIZ
E
DE
LVIN
E
DEV
OLL
DIB
ER
DU
RRE
S
ELBA
SAN
FIER
GRA
MSH
GJIR
OKA
STER
HA
S
KAV
AJE
KOLO
NJE
KO
RC
E
KR
UJE
KUCO
VE
KUKE
S
LAC
LEZ
HE
LIB
RA
ZH
D
LUSH
NJE
M.M
ADH
E
MA
LLA
KAST
ER
MA
T
MIR
DIT
E
PEQ
IN
POG
RAD
EC
PER
MET
PUKE
SA
RA
ND
E
SKRA
PAR
SHKO
DER
TE
PE
LEN
E
TIR
AN
E
TRO
PO
JE
VLO
RE
Unemployed as % of population
10
3. Data Envelopment Analysis: Methodology and
data
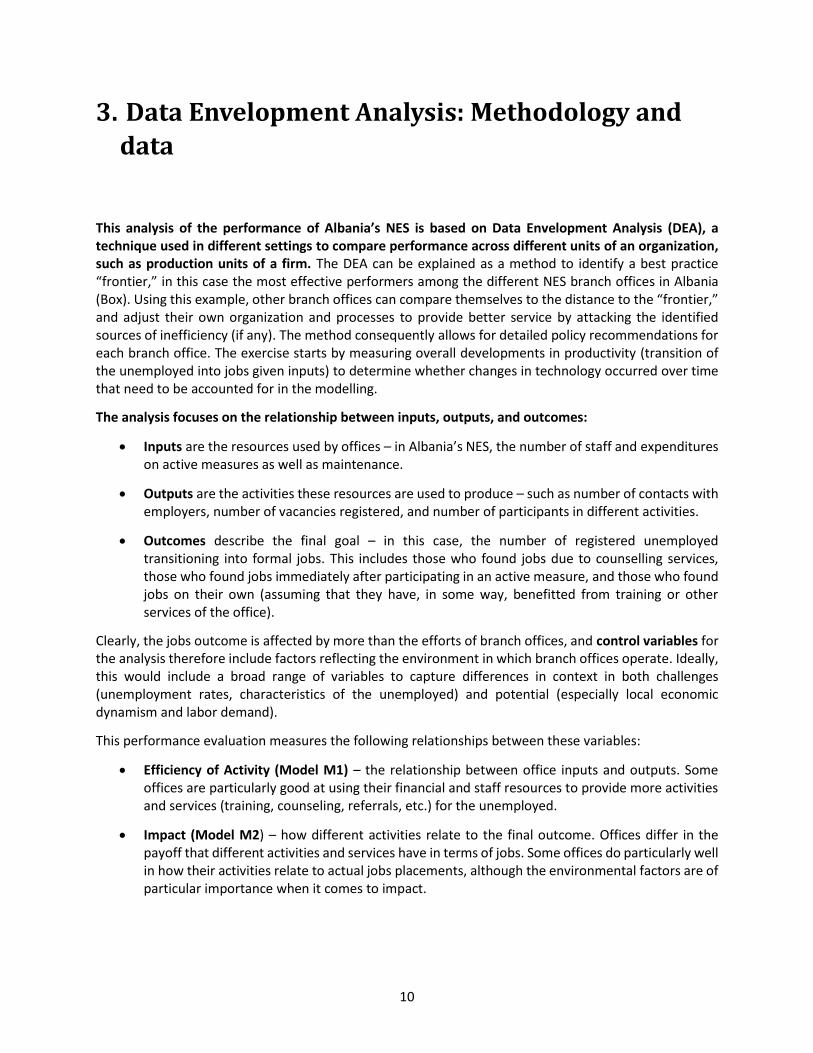
This analysis of the performance of Albania’s NES is based on Data Envelopment Analysis (DEA), a technique used in different settings to compare performance across different units of an organization, such as production units of a firm. The DEA can be explained as a method to identify a best practice “frontier,” in this case the most effective performers among the different NES branch offices in Albania (Box). Using this example, other branch offices can compare themselves to the distance to the “frontier,” and adjust their own organization and processes to provide better service by attacking the identified sources of inefficiency (if any). The method consequently allows for detailed policy recommendations for each branch office. The exercise starts by measuring overall developments in productivity (transition of the unemployed into jobs given inputs) to determine whether changes in technology occurred over time that need to be accounted for in the modelling.
The analysis focuses on the relationship between inputs, outputs, and outcomes:
• Inputs are the resources used by offices – in Albania’s NES, the number of staff and expenditures on active measures as well as maintenance.
• Outputs are the activities these resources are used to produce – such as number of contacts with employers, number of vacancies registered, and number of participants in different activities.
• Outcomes describe the final goal – in this case, the number of registered unemployed transitioning into formal jobs. This includes those who found jobs due to counselling services, those who found jobs immediately after participating in an active measure, and those who found jobs on their own (assuming that they have, in some way, benefitted from training or other services of the office).
Clearly, the jobs outcome is affected by more than the efforts of branch offices, and control variables for the analysis therefore include factors reflecting the environment in which branch offices operate. Ideally, this would include a broad range of variables to capture differences in context in both challenges (unemployment rates, characteristics of the unemployed) and potential (especially local economic dynamism and labor demand).
This performance evaluation measures the following relationships between these variables:
• Efficiency of Activity (Model M1) – the relationship between office inputs and outputs. Some offices are particularly good at using their financial and staff resources to provide more activities and services (training, counseling, referrals, etc.) for the unemployed.
• Impact (Model M2) – how different activities relate to the final outcome. Offices differ in the payoff that different activities and services have in terms of jobs. Some offices do particularly well in how their activities relate to actual jobs placements, although the environmental factors are of particular importance when it comes to impact.

11
• Effectiveness (Model M3) – how outcomes are related to the inputs. This can be seen as the “reduced form” of the two models above, namely how the resources used actually transfer to successful jobs placements.
The main purpose of the NES is to improve outcomes (jobs placements) rather than save on inputs. In what follows, most emphasis is therefore placed on the M3 model: how the financial resources and staffing of different offices affect their ability to find jobs for the unemployed.
Important limitations of the analysis should be emphasized. Two of these relate to the DEA model itself. First, the DEA only provides benchmarking within the NES system; i.e., relative efficiency among Albania’s different regional NES offices. A branch office deemed fully efficient is hence the best among the Albanian NES branch offices but would not necessarily be efficient or effective in another context, for example in comparison with employment offices in other countries.
A second and substantial limitation is the role of environmental factors, which are not well captured. Labor market conditions and challenges likely vary significantly across regions, both on the supply and demand side; for example, the overall skills levels and age of the unemployed, the number and kind of job offers available, dominant economic sectors, and so on. As an example, NES staff are likely to have much less control over how many unemployed they can refer to companies than they do over how many profiles of unemployed they can create – the former depends on local labor demand. The outcomes of the benchmarking exercise should therefore be interpreted as implications for what could be improved given the environment in which the regional office operates.
A third and significant issue is that data constraints limit the scope of the analysis in Albania. Specifically, important input data (operating costs, expenditures for goods and services), output data (number of contacts with the unemployed, profiles, or referrals), and control variables that provide the local context including challenges such as hard-to-serve youth (characteristics of the unemployed) or lack of labor demand (e.g., number of job vacancies in an area) are not available. For 2015 in particular, budget data are not available at a catchment area level, only at the regional level. Hence, the 2015 data are less informative and so are shaded in the tables below and excluded from the productivity analysis.
A fourth issue to keep in mind is that the period analyzed involved some important changes that affect the stability of the analysis. As mentioned in the previous section, one such change was the redefinition of unemployment (stricter) in 2016; this caused the number of unemployed to drop from 2015 to 2016 by 50,000 people, and led to greater concentration on more hard-to-serve clients, which affected efficiency and effectiveness. In addition, active measures increased significantly between 2013–2016, with a near quadrupling of the ALMP budget and a significant, but less strong, increase in the number of ALMPs participants who found jobs (for more details, see the technical report).
Box 2: Data Envelopment Analysis (DEA): Key points
First developed for nonprofit organizations, Data Envelopment Analysis (DEA) is a nonparametric frontier estimation technique that is used to benchmark performance. The “frontier” that is estimated consists of the most efficient organizations within a group, which are used as a standard against which the performance of other organizations is evaluated. The DEA hence verifies whether a specific unit is efficient relative to others, and identifies an “ideal” unit that the specific decision making unit can imitate to achieve higher efficiency. As such, the DEA focuses on relative, not absolute, efficiency – the “best” unit can still be inefficient in absolute terms. In Box Figure 1a, Offices P1–P4 are fully efficient – on the so-called “technological frontier” – whereas Offices P5–P7 could achieve more output/outcomes with fewer resources.

12
The Malmquist productivity index is used to diagnose changes in productivity of these processes over time, which in turn determines whether the DEA exercise should be undertaken under the assumption of productivity development or not. The index can be decomposed into a “catch-up” effect and a “frontier shift” effect. The former relates to the convergence of poorer-performing units to better ones. The latter refers to technological improvement that helps a unit produce more with the same input – the best offices move ahead (see Box Figure 1b). “Technical development” describes not only progress in a technical sense but also changes in processes, applied methodologies, and political environment that affect outcomes. For this analysis, the Malmquist index did indicate technological progress and the results reported are based on a model assuming that the “technology” is different in each year.
Box Figure 1: DEA analysis and the technological frontier
a. Basics of the DEA model b. Frontier shift between t and t+1
Compared to parametric methods for data analysis, such as Ordinary Least Square regressions, the DEA method requires less data, allows for combining multiple inputs and multiple outputs into a single summary measure of efficiency without a priori weights, and allows for comparisons of the performance when prices of inputs or outputs are not known. DEA can also be used for both static and dynamic analysis. Progress over time can be separated into technological progress (everybody is getting better due to technical progress or changes in processes, applied methodologies, and the political environment) versus convergence (poor-performing offices approach the better-performing ones).
For this analysis, each model was calculated for the case of constant returns to scale (CRS: double inputs lead to double outputs, in the efficient cases) and variable returns to scale (VRS: diminishing or increasing returns to scale may occur). The use of both models allows for a comparison of scale efficiency – whether efficiency is affected by the size of a particular branch office. If the ratio of the efficiency value of the CRS model to the VRS model is lower than 100 percent, the particular unit does not have the optimal size. Because scale efficiency on average was high, most of the information presented in this report is based on the CRS model.
Source: Schnabl et al. 2018.
P1
P2
P3
P4
P5
P6
P7
0
1
2
3
4
5
6
7
8
9
10
0 1 2 3 4 5 6 7 8 9 10
Output (M1)Outcomes (M2, M3)
Input (M1, M3)Output (M2)
VariableReturns toScale
Constant Returns toScale

13
M3
The conceptual framework of the DEA is described in Figure 8. The analysis focuses not only on the efficiency, impact, and effectiveness of branch offices (the relationships between resources, activities, and outcomes) but also on their efficiency of scale; i.e., whether their size (whether measured in inputs such as staff, expenditures, or outputs such as activities) is optimal to achieve the highest productivity.
Figure 8: DEA of branch offices in Albania
Source: Authors.
INPUTS [resource use by offices]
No. of staff (counselors, directors, administrators)
Budget (spending on active measures+maintenance)
OUTPUTS [activities by offices]
No. of employers contacted
No. of vacancies registered
No. of participants in active measures
OUTCOMES [final goal]
Number of registered unemployed transitioning into formal jobs
ENVIRONMENTAL [outside the purview of office organization]
Unemployment rate in region
Density of enterprises, building activity
Population

14
4. Main findings
4.1 The NES became more productive between 2013 and 2016
Aggregate productivity for the NES as a whole (the translation of input and output into jobs for the registered unemployed) can improve over time (i) due to a general change in how branch offices use inputs/outputs to achieve outputs/outcomes (here referred to as “frontier shift” or “technological development”) or (ii) because poor-performing branch offices catch up with more efficient ones (here referred to as “catch-up” or “convergence”). For the modelling exercise, this is in fact the first step to investigate, since evidence (or not) of whether any technological progress occurred during the period decides the format of the model. (If there is technological progress, each year is treated separately; if not, the information is pooled and benchmarking done against the best-performing offices in any year.)
In Albania, the NES became moderately more productive in translating inputs into jobs (M3) between 2013 and 2016. The index is 109 percent; 100 percent indicates no change. The productivity increase in overall effectiveness (M3) was entirely due to catch-up effects, with poorer offices improving compared to better ones in how inputs were used to produce outputs (M1) (Table 2). In fact, the M3 frontier, as well as the M1 and M2 frontier, moved back in this period. Disentangling the developments by year, the models suggest that these developments were driven by a very strong reversal in productivity in 2013–2014 combined with strong convergence in office performance. These changes were partially reversed in 2014–2016, with the technological frontier improving (“the best became better”) and some offices lagging behind again. The frontier setback was likely driven by the substantial increase in expenditures on active measures, which did not translate into either sufficient increases in the intermediate output (the number of ALMP participants, which quadrupled, came closest) or in the final outcome (the total number of unemployed who found jobs nearly doubled from 2013 to 2016).
Looking at individual offices, the estimates suggest that the technology frontier changed over 2013–2016, for better and for worse. For different reasons, including those beyond the control of NES offices such as economic and political context, the ability to combine inputs (or activities, in the case of M2) to produce jobs placements for the unemployed (or activities, in the case of M1) changed over time. Hence, the remainder of the report presents models based on the assumption of technical development.

15
Table 2: Changes in performance and causes, 2013–2016
M1 M2 M3
2013–2014
Overall change in performance
100% 75% 109%
Catch-up 141% 123% 291%
Frontier shift 84% 61% 44%
2014–2016
Overall change in performance
96% 118% 109%
Catch-up 106% 95% 88%
Frontier shift 94% 124% 123%
2013–2016
Overall change in performance
94% 84% 109%
Catch-up 154% 96% 234%
Frontier shift 79% 89% 54%
Source: Schnabl et al. 2018.
Note: *The overall change in performance is represented by the Malmquist productivity index. 100% represents no change. M1: how expenditures and staffing decisions result in employer contacts, vacancies registered, and enrolment of unemployed in active measures. M2: how these activities lead to jobs placements. M3: how expenditures and staffing decisions lead to jobs placements.
4.2 Average effectiveness has increased but remains very low
Average effectiveness (M3) was low in 2016, although it improved compared to 2013. Table 3 presents the average activity input efficiency, impact, and effectiveness of all NES branch offices. If all branch offices had been fully efficient, the efficiency rate would be 100 percent for all three models. As can be seen, average efficiency levels are much lower, however. Under CRS assumptions, only one office (Durres) was fully effective (M3) in the 2013–2016 period; it was also the only office that was fully efficient (M1) in 2013, 2014, and 2016 (Schnabl et al. 2018). Under VRS assumptions, five offices were fully efficient.
Average effectiveness increased between 2013 and 2014, but fell again between 2014 and 2016. This fall was driven by a significant drop in the effectiveness of office activities in generating jobs placements (M2), together with a smaller drop in the efficiency in generating outputs (M1). Taken together, these changes resulted in a partial reversal of efficiency gains made between 2013–2014.
16
Table 3: Average efficiency, impact, and effectiveness, 2013–2016
Period M1 M2 M3
2013 56% 68% 26%
2014 64% 71% 52%
2015 59% 78% 47%
2016 61% 50% 42%
2013–2016 59% 65% 42%
Source: Schnabl et al. 2018. Note: Based on CRS models.
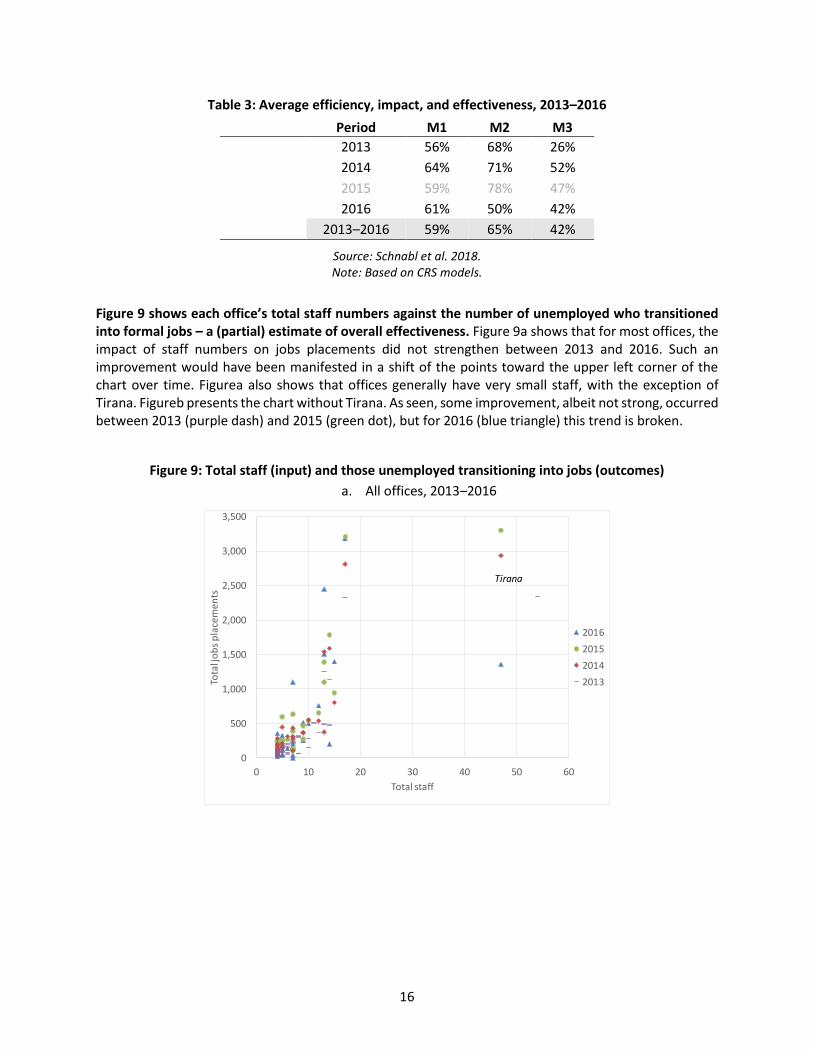
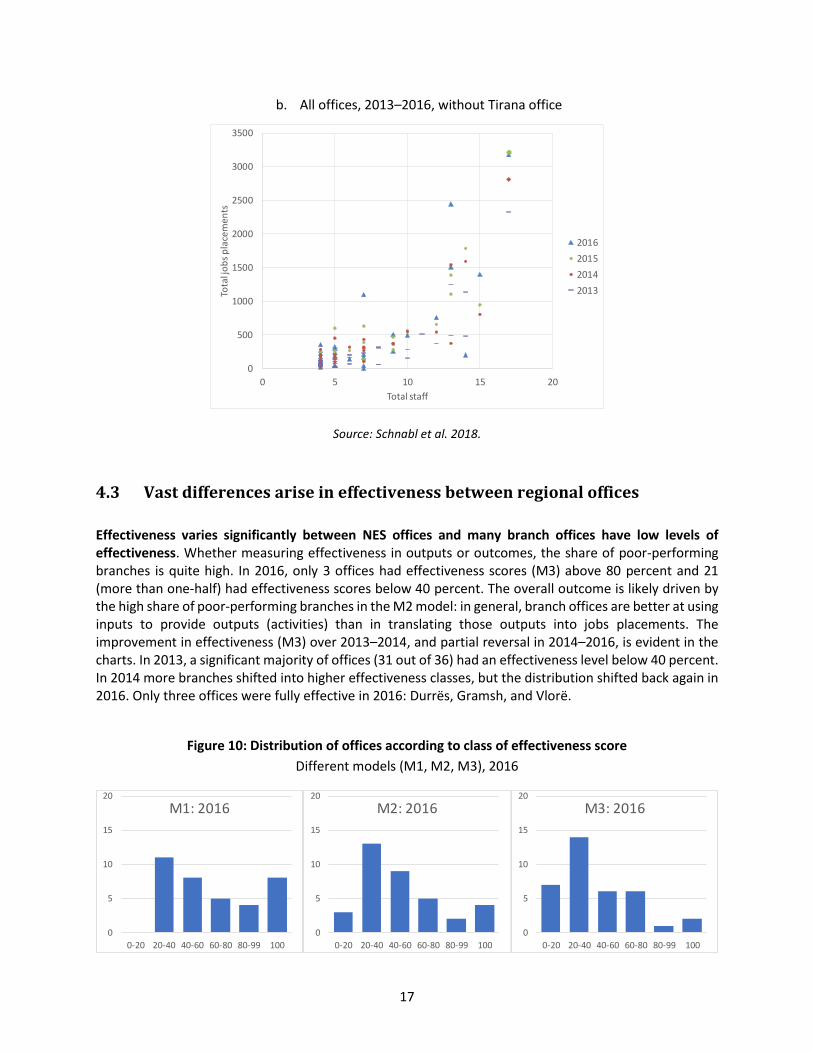
Figure 9 shows each office’s total staff numbers against the number of unemployed who transitioned into formal jobs – a (partial) estimate of overall effectiveness. Figure 9a shows that for most offices, the impact of staff numbers on jobs placements did not strengthen between 2013 and 2016. Such an improvement would have been manifested in a shift of the points toward the upper left corner of the chart over time. Figurea also shows that offices generally have very small staff, with the exception of Tirana. Figureb presents the chart without Tirana. As seen, some improvement, albeit not strong, occurred between 2013 (purple dash) and 2015 (green dot), but for 2016 (blue triangle) this trend is broken.
Figure 9: Total staff (input) and those unemployed transitioning into jobs (outcomes)
a. All offices, 2013–2016
0
500
1,000
1,500
2,000
2,500
3,000
3,500
0 10 20 30 40 50 60
Tota
l jo
bs
pla
cem
ents
Total staff
2016
2015
2014
2013
Tirana
17
b. All offices, 2013–2016, without Tirana office
Source: Schnabl et al. 2018.
4.3 Vast differences arise in effectiveness between regional offices
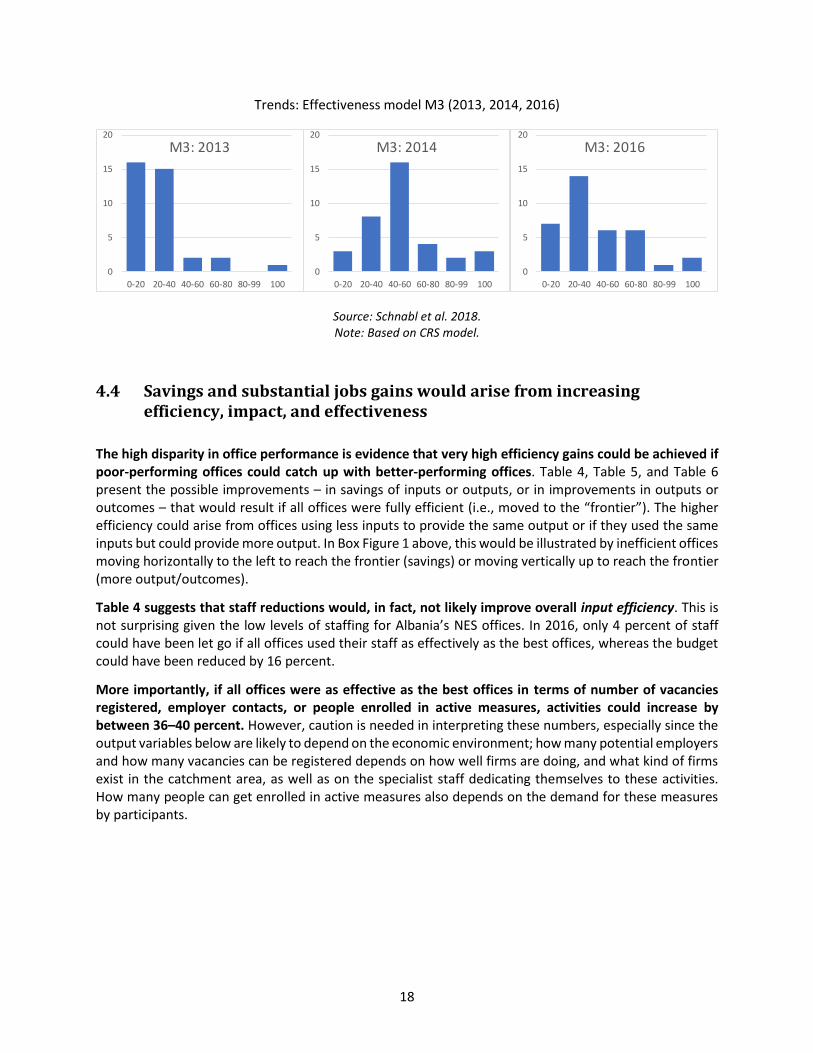
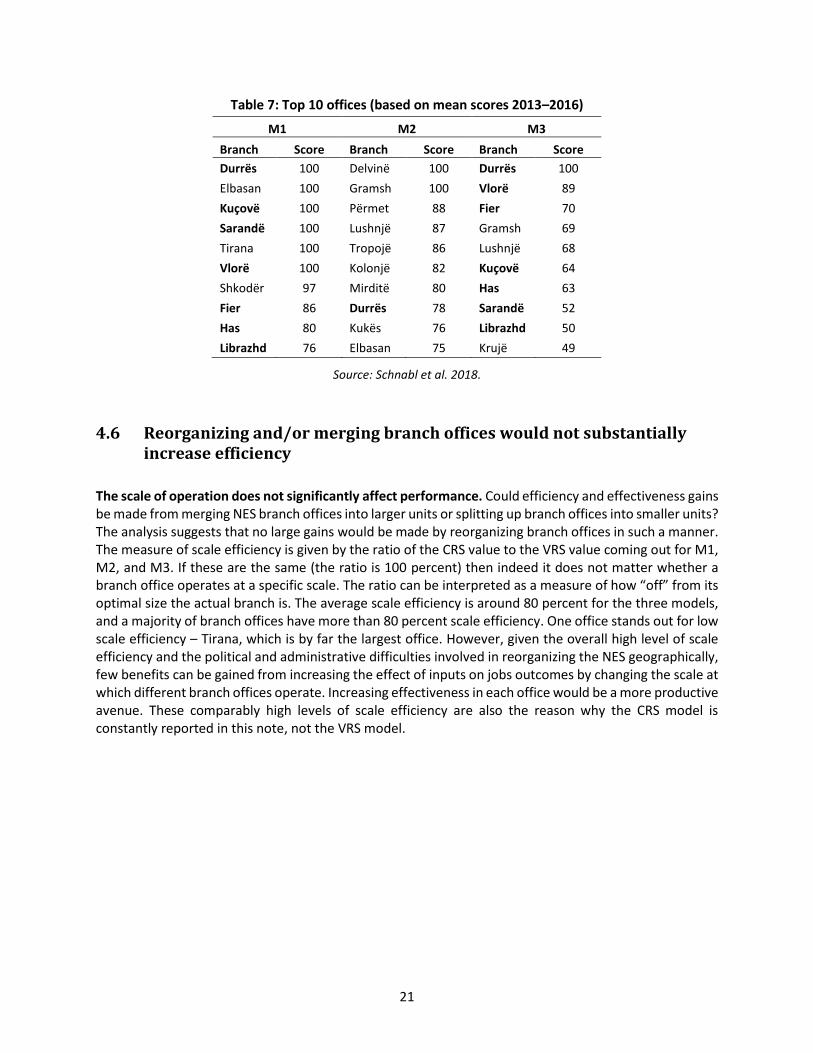
Effectiveness varies significantly between NES offices and many branch offices have low levels of effectiveness. Whether measuring effectiveness in outputs or outcomes, the share of poor-performing branches is quite high. In 2016, only 3 offices had effectiveness scores (M3) above 80 percent and 21 (more than one-half) had effectiveness scores below 40 percent. The overall outcome is likely driven by the high share of poor-performing branches in the M2 model: in general, branch offices are better at using inputs to provide outputs (activities) than in translating those outputs into jobs placements. The improvement in effectiveness (M3) over 2013–2014, and partial reversal in 2014–2016, is evident in the charts. In 2013, a significant majority of offices (31 out of 36) had an effectiveness level below 40 percent. In 2014 more branches shifted into higher effectiveness classes, but the distribution shifted back again in 2016. Only three offices were fully effective in 2016: Durrës, Gramsh, and Vlorë.
Figure 10: Distribution of offices according to class of effectiveness score
Different models (M1, M2, M3), 2016
0
500
1000
1500
2000
2500
3000
3500
0 5 10 15 20
Tota
l jo
bs
pla
cem
ents
Total staff
2016
2015
2014
2013
0
5
10
15
20
0-20 20-40 40-60 60-80 80-99 100
M1: 2016
0
5
10
15
20
0-20 20-40 40-60 60-80 80-99 100
M2: 2016
0
5
10
15
20
0-20 20-40 40-60 60-80 80-99 100
M3: 2016
18
Trends: Effectiveness model M3 (2013, 2014, 2016)
Source: Schnabl et al. 2018. Note: Based on CRS model.
4.4 Savings and substantial jobs gains would arise from increasing efficiency, impact, and effectiveness
The high disparity in office performance is evidence that very high efficiency gains could be achieved if poor-performing offices could catch up with better-performing offices. Table 4, Table 5, and Table 6 present the possible improvements – in savings of inputs or outputs, or in improvements in outputs or outcomes – that would result if all offices were fully efficient (i.e., moved to the “frontier”). The higher efficiency could arise from offices using less inputs to provide the same output or if they used the same inputs but could provide more output. In Box Figure 1 above, this would be illustrated by inefficient offices moving horizontally to the left to reach the frontier (savings) or moving vertically up to reach the frontier (more output/outcomes).
Table 4 suggests that staff reductions would, in fact, not likely improve overall input efficiency. This is not surprising given the low levels of staffing for Albania’s NES offices. In 2016, only 4 percent of staff could have been let go if all offices used their staff as effectively as the best offices, whereas the budget could have been reduced by 16 percent.
More importantly, if all offices were as effective as the best offices in terms of number of vacancies registered, employer contacts, or people enrolled in active measures, activities could increase by between 36–40 percent. However, caution is needed in interpreting these numbers, especially since the output variables below are likely to depend on the economic environment; how many potential employers and how many vacancies can be registered depends on how well firms are doing, and what kind of firms exist in the catchment area, as well as on the specialist staff dedicating themselves to these activities. How many people can get enrolled in active measures also depends on the demand for these measures by participants.
0
5
10
15
20
0-20 20-40 40-60 60-80 80-99 100
M3: 2013
0
5
10
15
20
0-20 20-40 40-60 60-80 80-99 100
M3: 2014
0
5
10
15
20
0-20 20-40 40-60 60-80 80-99 100
M3: 2016

19
Table 4: Potential savings and improvements from improving efficiency in activities (M1), 2013–2016
2013 2014 2015 2016 2013–2016
Inputs (savings)
No. of staff -2% 0% -7% -4% -3%
Budget -36% -7% -7% -16% -17%
Outputs (increases)
# active measures 39% 29% 38% 36% 36%
Employer contacts 35% 43% 39% 29% 37%
Registered vacancies 47% 29% 38% 44% 40%
Source: Schnabl et al. 2018. Note: Based on CRS model.
Similarly, Table 5 shows the potential increase in the number of permanent jobs that could be undertaken with savings from activities if all offices were fully efficient in terms of impact. In fact, the number of unemployed transitioning into jobs could more than double (except in 2015, when they could increase by two-thirds), and in 2016 almost triple, if branch offices could emulate best practices in how activities translate into impact. Improvements could be achieved with much fewer enrolments in active measures. The higher potential for jobs in 2016 reflects the budget increase.
Table 5: Potential savings and improvements from improving impact
2013 2014 2015 2016 2013–2016
Outputs (savings)
# active measures -15% -39% -48% -33% -34%
Employer contacts 0% -2% -1% -2% -1%
Registered vacancies
-1% 0% -4% -6% -3%
Outcomes (increases)
Jobs 113% 103% 67% 192% 119%
Source: Schnabl et al. 2018. Note: Based on CRS model.
Finally, a review shows potential savings and gains to be made from bringing all NES branch offices to 100 percent overall effectiveness as measured by best practices, or the “frontier,” in how inputs are transformed into jobs mediation. Considerable potential indeed remains for improvements in jobs outcomes, all else equal. Although the potential for increased jobs varies by year, on average, jobs created for the unemployed could have doubled if all offices performed as the best one(s). On average, this represents about 20,000 additional jobs per year. These outcomes would be achievable even with some significant streamlining of the budget.

20
Table 6: Potential savings and improvements from improving overall effectiveness
2013 2014 2015 2016 2013–2016
Inputs (savings)
No. of staff -13% -1% 0% 0% -4%
Budget -81% -4% -5% -26% -29%
Outcome (increase)
Jobs 201% 79% 91% 104% 119%
Source: Schnabl et al. 2018. Note: Based on CRS model.
4.5 Branch offices vary in their performance over time and depending on the model
Few offices are consistently high-performing. Table 7 presents the top 10 ranked offices, measured in the three different models and according to the CRS model. It is noteworthy that only one office – Durres – is among the top 10 for all three models. Overall, in fact, rankings differ significantly between the different models. The Tirana office is a notable example, as it is fully efficient in translating inputs into activities (M1), but has the lowest efficiency score of all offices for translating those activities into jobs (M2). A possible reason for these swings in ratings is that there is not an entirely clear causal link between inputs, outputs, and outcomes because of environmental factors that differ significantly between areas but that are much beyond the influence of NES offices. The full table of rankings is presented in Annex Table 1. The annex table permits each office to identify its ranking and where in the results chain (M1, M2) it has particular weaknesses (as evidenced by lower ranking).
21
Table 7: Top 10 offices (based on mean scores 2013–2016)
M1 M2 M3
Branch Score Branch Score Branch Score
Durrës 100 Delvinë 100 Durrës 100
Elbasan 100 Gramsh 100 Vlorë 89
Kuçovë 100 Përmet 88 Fier 70
Sarandë 100 Lushnjë 87 Gramsh 69
Tirana 100 Tropojë 86 Lushnjë 68
Vlorë 100 Kolonjë 82 Kuçovë 64
Shkodër 97 Mirditë 80 Has 63
Fier 86 Durrës 78 Sarandë 52
Has 80 Kukës 76 Librazhd 50
Librazhd 76 Elbasan 75 Krujë 49
Source: Schnabl et al. 2018.
4.6 Reorganizing and/or merging branch offices would not substantially increase efficiency
The scale of operation does not significantly affect performance. Could efficiency and effectiveness gains be made from merging NES branch offices into larger units or splitting up branch offices into smaller units? The analysis suggests that no large gains would be made by reorganizing branch offices in such a manner. The measure of scale efficiency is given by the ratio of the CRS value to the VRS value coming out for M1, M2, and M3. If these are the same (the ratio is 100 percent) then indeed it does not matter whether a branch office operates at a specific scale. The ratio can be interpreted as a measure of how “off” from its optimal size the actual branch is. The average scale efficiency is around 80 percent for the three models, and a majority of branch offices have more than 80 percent scale efficiency. One office stands out for low scale efficiency – Tirana, which is by far the largest office. However, given the overall high level of scale efficiency and the political and administrative difficulties involved in reorganizing the NES geographically, few benefits can be gained from increasing the effect of inputs on jobs outcomes by changing the scale at which different branch offices operate. Increasing effectiveness in each office would be a more productive avenue. These comparably high levels of scale efficiency are also the reason why the CRS model is constantly reported in this note, not the VRS model.

22
Figure 11: Scale efficiency by model
Source: Schnabl et al. 2018.
4.7 Environmental factors influence NES branches’ success
Each NES branch operates in a local context and the challenges each face can differ significantly. Differences include the number and “employability” of the unemployed and the level of dynamism at the local economic level (and the matching of labor demand with the profile of the unemployed), which together influence how easy it is to place the unemployed in jobs. As seen, strong variations arise in how well an office performs in different models. For example, in 2016, Kavajë and Sarandë were both fully efficient in using inputs to produce their activities, but their efficiency score for the M2 model was below 30 percent. Environmental factors are likely to influence these differences. These differences need to be taken into account when comparing offices and when identifying offices that provide peer-to-peer learning for other offices. For example, in contexts with very low economic dynamism, contacts-to-employers, at least if this is understood to be firms in the catchment area, may be a less useful approach to ensuring jobs placements. Training that permits workers to relocate to more dynamic zones may be more efficient.
Labor demand appears to affect outcomes. When the influence of a set of environmental factors on overall effectiveness is tested in a multivariate regression, a few things stand out (see Annex Table 3). The coefficients for the density of enterprises, a measure of labor demand, are positive and mostly significant. Similarly, labor market tightness – the share of vacancies per unemployed – is generally positive and significant in different versions of the regressions, and the same holds for branch offices in urban areas where economic opportunities are likely to be higher. Finally, the share of industry – as a sector with job creation and potential multipliers – is positive and significant. This suggests, quite logically, that branch offices in dynamic regions (urban) hosting many companies (in relation to their population) that are
Pequin
Tirana
Pequin
0
10
20
30
40
50
60
70
80
90
M1 M2 M3
Scale efficiency
Mean score Share over 80% Worst office (score)

23
looking for workers (vacancies) can bring people into employment using fewer resources. The long-term unemployment rate at the regional level3 (as a measure of the jobs challenge) is not significant, however.
4.8 A mix of activities is likely to be most effective for increasing jobs placements
Different activities have different effects on jobs placements depending on the year. What activities or combination of activities in particular appear to increase outcomes, and what resource mix seems most conducive to lead to jobs for the unemployed, all else equal? The analysis of such marginal effects shows how many additional jobs could be achieved if different activities were increased by one unit, under the assumption that the efficiency of how these units translate into jobs would not change (Table 8). On average, registering vacancies and contacting employers pay off more than involving the unemployed in active measures on education/employment. For three persons enrolled in active measures, one job results. For each vacancy registered, the number of jobs would almost increase one to one. This is not surprising as vacancies are an indicator of the availability of jobs.4 (It is important to recall that these are averages, however – the models do not permit tracing whether a job resulted from contact with employers, vacancies, or training.)
Table 8: Effects of one additional unit of output on the number of jobs
2013 2014 2015 2016 2013–2016
No. contacts with employers 0.52 0.64 0.59 0.75 0.63
No. vacancies 0.81 0.83 0.87 0.82 0.83
No. active measures on education/employment N/A 0.37 0.31 0.33 0.34
Source: Schnabl et al. 2018. Note: Based on CRS model. N/A = not available.
A similar review of how different inputs could influence outcomes shows that an additional employee makes a significant difference to the jobs outcomes (Table 9). Given the small size of offices in Albania and relatively high caseloads, this is perhaps not surprising, although the scale analysis suggested that offices are well sized in general. Whether the additional staff are specialists (e.g., counsellors) or other staff does not matter – but this could be due to the fact that specialists are not clearly defined in the data. Increasing the budget also brings potential jobs. By adding ALL 1 million to the budget (some €7,500), all else equal, jobs could increase by between 30 and 34, implying a cost of less than an additional €200 per additional job created.
3 Unfortunately, unemployment rates are not available at the local/office/catchment area. 4 A version of the model not including ALMP expenditures or outputs (people enrolled) was also run to separate out effects from the rapid increase in ALMP expenditures over the period of study. This reduced model showed stronger productivity developments (not surprising, since ALMP expenditures increased significantly without a concomitant increase in jobs placement), but a lower average level of efficiency than the main model.

24
Table 9: Effects of one additional unit of input on the number of jobs
2013 2014 2015 2016 Mean
Budget (million ALL) n/a 34 29 30 31
# staff 63 147 157 155 130
# specialists 68 161 169 169 142
Source: Schnabl et al. 2018. Note: Based on CRS model.
4.9 Offices could learn from peers
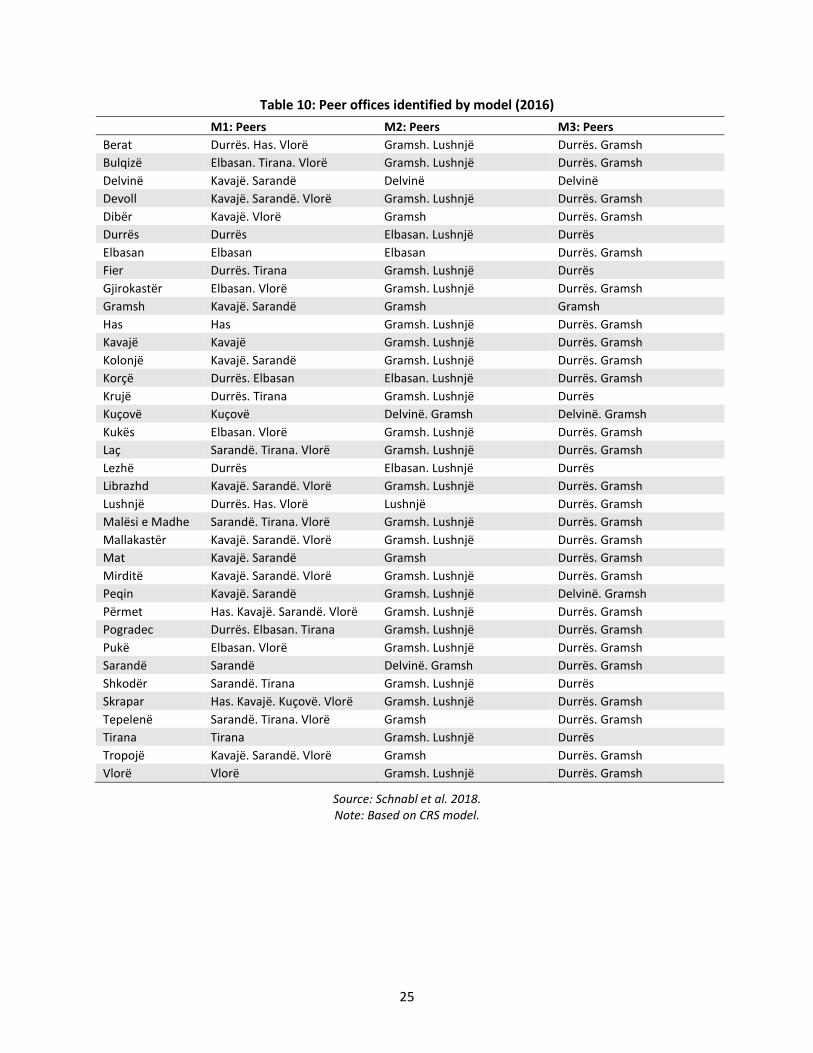
Since the analysis is focused on the branch level, it identifies the results chain for each office. Hence, branch offices can look at their own development in efficiency over 2013–2016, and where potential sources of inefficiencies may lie: in the transformation of resources into activities (M1) or in the transformation of those activities into jobs (M2). Because of the focus on best practices within Albania, the optimization method provides useful information on which offices could serve as peers – here, this is taken to mean offices that, using the same mix of inputs and outputs, are more efficient or effective than the office in question. Table 10 provides an overview of these peers, for each branch office and for each model.
Durres and Gramsh are the peers for most offices in how to effectively translate budget and staff into jobs placements. As seen in Annex Figure 1, these two offices define the frontier for jobs placements for a given level for expenditure and (to a lesser extent) for jobs placements for a given level of staffing in the offices. Durres is one of the larger offices, with higher levels of expenditures and more staff, whereas Gramsh is a small office with only four people. Much more variation arises in peer learning for the M1 model. Although Durres still features prominently, Sarandë and Vlorë in particular are common peer offices. For each model, less successful offices could look at how peer learning branches operate, and what accounts for their success – environmental factors, or a better technology/good practices in approaches to activities or jobs placements.
25
Table 10: Peer offices identified by model (2016)
M1: Peers M2: Peers M3: Peers
Berat Durrës. Has. Vlorë Gramsh. Lushnjë Durrës. Gramsh
Bulqizë Elbasan. Tirana. Vlorë Gramsh. Lushnjë Durrës. Gramsh
Delvinë Kavajë. Sarandë Delvinë Delvinë
Devoll Kavajë. Sarandë. Vlorë Gramsh. Lushnjë Durrës. Gramsh
Dibër Kavajë. Vlorë Gramsh Durrës. Gramsh
Durrës Durrës Elbasan. Lushnjë Durrës
Elbasan Elbasan Elbasan Durrës. Gramsh
Fier Durrës. Tirana Gramsh. Lushnjë Durrës
Gjirokastër Elbasan. Vlorë Gramsh. Lushnjë Durrës. Gramsh
Gramsh Kavajë. Sarandë Gramsh Gramsh
Has Has Gramsh. Lushnjë Durrës. Gramsh
Kavajë Kavajë Gramsh. Lushnjë Durrës. Gramsh
Kolonjë Kavajë. Sarandë Gramsh. Lushnjë Durrës. Gramsh
Korçë Durrës. Elbasan Elbasan. Lushnjë Durrës. Gramsh
Krujë Durrës. Tirana Gramsh. Lushnjë Durrës
Kuçovë Kuçovë Delvinë. Gramsh Delvinë. Gramsh
Kukës Elbasan. Vlorë Gramsh. Lushnjë Durrës. Gramsh
Laç Sarandë. Tirana. Vlorë Gramsh. Lushnjë Durrës. Gramsh
Lezhë Durrës Elbasan. Lushnjë Durrës
Librazhd Kavajë. Sarandë. Vlorë Gramsh. Lushnjë Durrës. Gramsh
Lushnjë Durrës. Has. Vlorë Lushnjë Durrës. Gramsh
Malësi e Madhe Sarandë. Tirana. Vlorë Gramsh. Lushnjë Durrës. Gramsh
Mallakastër Kavajë. Sarandë. Vlorë Gramsh. Lushnjë Durrës. Gramsh
Mat Kavajë. Sarandë Gramsh Durrës. Gramsh
Mirditë Kavajë. Sarandë. Vlorë Gramsh. Lushnjë Durrës. Gramsh
Peqin Kavajë. Sarandë Gramsh. Lushnjë Delvinë. Gramsh
Përmet Has. Kavajë. Sarandë. Vlorë Gramsh. Lushnjë Durrës. Gramsh
Pogradec Durrës. Elbasan. Tirana Gramsh. Lushnjë Durrës. Gramsh
Pukë Elbasan. Vlorë Gramsh. Lushnjë Durrës. Gramsh
Sarandë Sarandë Delvinë. Gramsh Durrës. Gramsh
Shkodër Sarandë. Tirana Gramsh. Lushnjë Durrës
Skrapar Has. Kavajë. Kuçovë. Vlorë Gramsh. Lushnjë Durrës. Gramsh
Tepelenë Sarandë. Tirana. Vlorë Gramsh Durrës. Gramsh
Tirana Tirana Gramsh. Lushnjë Durrës
Tropojë Kavajë. Sarandë. Vlorë Gramsh Durrës. Gramsh
Vlorë Vlorë Gramsh. Lushnjë Durrës. Gramsh
Source: Schnabl et al. 2018. Note: Based on CRS model.

26
5. Conclusions
The overall objective of public employment services is to assist jobseekers in finding employment by connecting them with job opportunities and helping them improve their employability. No blueprint exists on how to provide such services efficiently and effectively. However, well-functioning performance management systems can help offices improve their internal management.
The DEA model presented here can form part of such a performance management system. It provides each office with information on efficiency and effectiveness compared to other offices, and helps disentangle the results chain into inputs-to-outputs (e.g., number of staff to number of employer contacts made) and outputs-to-outcomes (e.g., number of employer contacts to number of unemployed placed in jobs). Other modern European public employment services use annual performance agreements with each branch office to manage—and improve—the effectiveness and efficiency of each branch office. Various methodologies have been developed by European public employment services, ranging from corporate scorecards to sophisticated data analysis to monitor performance, define key performance indicators, and set targets. All of these methodologies need to take into account local labor market conditions, available resources, activities implemented, and outcomes achieved. The NES should develop its own methodology for performance management to strengthen its ability to monitor the performance of its branch offices to inform efficient case management of beneficiaries. Elements to monitor include inputs used, activities implemented, outputs produced, and outcomes achieved by EP programs, vocational training, and intermediation services for various subgroups .
The analytical exercise presented herein shows that many NES offices in Albania struggle with low efficiency and effectiveness in fulfilling their mandate. Substantial gains, in terms of both jobs placements and resources saved, would be achieved by increasing efficiency among poorer-performing branch offices to emulate the outcomes of the best performers.
The analysis shows that reaching out to employers and collecting vacancies is likely to enhance jobs placement more than investment in active measures in Albania. This finding has important operational implications on how employment counselors and resources should be best allocated (between intermediation services and active measures). Given the rapid increase in ALMP expenditures and scope in the past few years, there is a specific need to look closely at the outcomes of those measures. Another important operational implication of the analysis is the need for the NES to develop a strategy to improve its outreach to employers and collect more vacancies, but also to provide more specialized and expanded hiring services for firms. Reorganization of the NES branch office map – through merging or splitting offices – does not seem to be the best way forward. The analysis shows that branch offices, generally, are relatively efficient in scale and that no significant gains would be made by changing their scale (Tirana, by far the largest office, is an exception, but it would not make sense to split it up into smaller units). Instead, different branch offices could use the information available to (i) analyze whether key issues arise in input activity or outputs-to-outcomes effectiveness, and (ii) look to those offices that appear to be similar in the level and mix of resources they use and the activities they provide, but that perform better. As a complement to this analysis, it is recommended to carry out a process evaluation of a group of offices with similar inputs (staff, budget) and better understand and identify the practices that lead top-ranked offices to perform better, either by executing budget on time and churning out activities (M1 model) or by implementing activities
27
with quality (translating active and intermediation services into higher jobs placement) (M2 efficiency model).
A final observation is that effective performance management depends on the timely availability of reliable data. In this respect, Albania’s NES needs to strengthen its capacity to maintain readily available data on key indicators and to track them over time. An online platform exists to provide information on vacancies and training courses, but information on vacancies is not shared across districts, limiting the tool’s potential to reduce spatial mismatches. The NES online information system needs to be upgraded to automate certain processes. Data availability and data accuracy were problematic in the collection of basic monitoring data on the number of employers contacted, number of contacts with employers, number of vacancies, number of jobs placements due to mediation services and after participation in EPs, and number of staff (counselors spending disaggregated by staff at the NES branch office level). The NES’s M&E capacity could be enhanced by upgrading its IT software and introducing M&E tools (and related training to NES staff) to: (i) enable data exchange among NES branches; (ii) offer online services; (iii) track progress on services provided to jobseekers (EP programs, vocational training and intermediation services); (iv) monitor services offered to employers; and (vi) monitor NES performance based on agreed performance indicators and regularly disseminate and update labor market trends.

28
References
Kuddo, A. 2012. “Public Employment Services, and Activation Policies.” Social Protection and Labor
Discussion Paper 1214, World Bank, Washington, DC.
Schnabl, A., H. Hofer, S. Lappöhn, A. Pohl, and H. Zenz. 2018. “Albania Functional Review: Efficiency
Analysis of the National Employment Service – 2013–2016, Technical Report.” Background
paper, World Bank, Washington, DC.
Simar, L. and P. Wilson. 2007. “Estimation and inference in two-stage, semi-parametric models of
production processes”, Journal of Econometrics, 136, (1), 31-64.
Honorati, M. and S. Johansson de Silva. 2018 (forthcoming). “Job Dynamics in Albania: A Note Profiling
Albania’s Labor Market.” World Bank, Washington, DC.
Honorati, and Johansson. 2018 (forthcoming). “Demand for Skills in Albania: An Analysis of the Skills
Toward Employment and Productivity Survey”, the World Bank, Washington, DC.
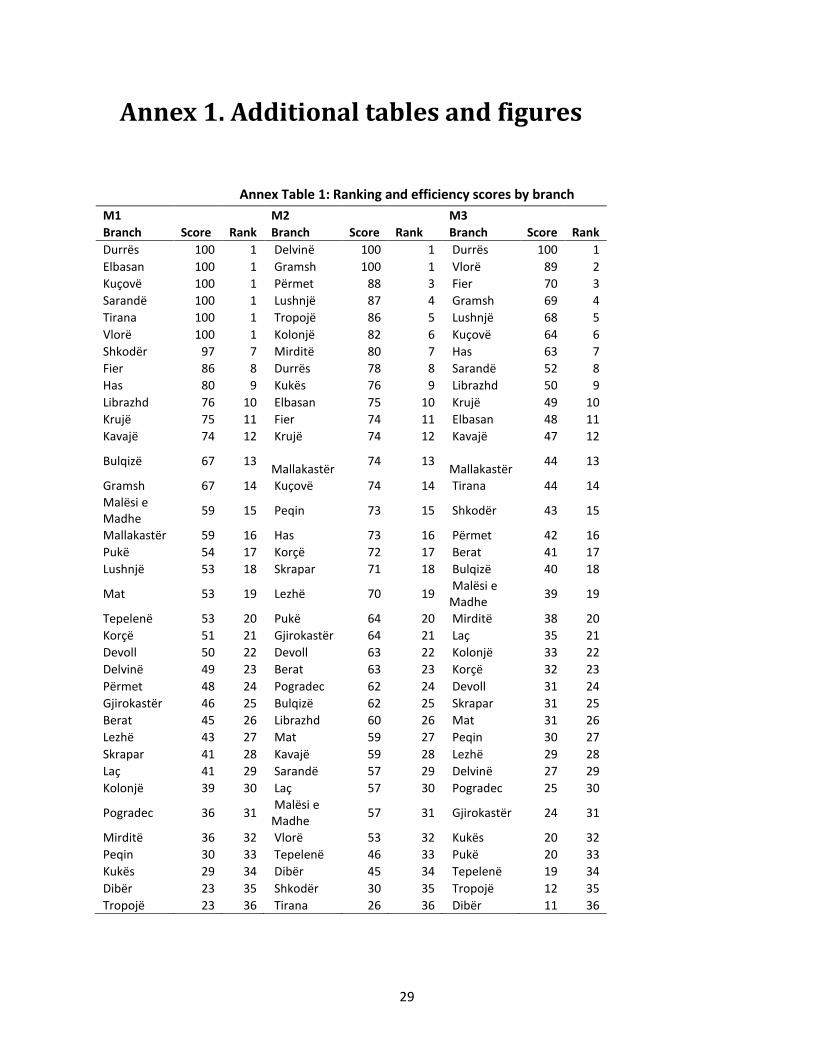
29
Annex 1. Additional tables and figures
Annex Table 1: Ranking and efficiency scores by branch
M1 M2 M3
Branch Score Rank Branch Score Rank Branch Score Rank
Durrës 100 1 Delvinë 100 1 Durrës 100 1
Elbasan 100 1 Gramsh 100 1 Vlorë 89 2
Kuçovë 100 1 Përmet 88 3 Fier 70 3
Sarandë 100 1 Lushnjë 87 4 Gramsh 69 4
Tirana 100 1 Tropojë 86 5 Lushnjë 68 5
Vlorë 100 1 Kolonjë 82 6 Kuçovë 64 6
Shkodër 97 7 Mirditë 80 7 Has 63 7
Fier 86 8 Durrës 78 8 Sarandë 52 8
Has 80 9 Kukës 76 9 Librazhd 50 9
Librazhd 76 10 Elbasan 75 10 Krujë 49 10
Krujë 75 11 Fier 74 11 Elbasan 48 11
Kavajë 74 12 Krujë 74 12 Kavajë 47 12
Bulqizë 67 13 Mallakastër
74 13 Mallakastër
44 13
Gramsh 67 14 Kuçovë 74 14 Tirana 44 14
Malësi e Madhe
59 15 Peqin 73 15 Shkodër 43 15
Mallakastër 59 16 Has 73 16 Përmet 42 16
Pukë 54 17 Korçë 72 17 Berat 41 17
Lushnjë 53 18 Skrapar 71 18 Bulqizë 40 18
Mat 53 19 Lezhë 70 19 Malësi e Madhe
39 19
Tepelenë 53 20 Pukë 64 20 Mirditë 38 20
Korçë 51 21 Gjirokastër 64 21 Laç 35 21
Devoll 50 22 Devoll 63 22 Kolonjë 33 22
Delvinë 49 23 Berat 63 23 Korçë 32 23
Përmet 48 24 Pogradec 62 24 Devoll 31 24
Gjirokastër 46 25 Bulqizë 62 25 Skrapar 31 25
Berat 45 26 Librazhd 60 26 Mat 31 26
Lezhë 43 27 Mat 59 27 Peqin 30 27
Skrapar 41 28 Kavajë 59 28 Lezhë 29 28
Laç 41 29 Sarandë 57 29 Delvinë 27 29
Kolonjë 39 30 Laç 57 30 Pogradec 25 30
Pogradec 36 31 Malësi e Madhe
57 31 Gjirokastër 24 31
Mirditë 36 32 Vlorë 53 32 Kukës 20 32
Peqin 30 33 Tepelenë 46 33 Pukë 20 33
Kukës 29 34 Dibër 45 34 Tepelenë 19 34
Dibër 23 35 Shkodër 30 35 Tropojë 12 35
Tropojë 23 36 Tirana 26 36 Dibër 11 36

30
Annex Table 2: Key data, branch offices
Branch office
Jobseekers (total)
% of all unempl.
% Long-term
unempl. Number of staff
Unempl per
staff
Unempl. per reg. vacancy.
1 BERAT 1959 2 58% 10 196 2
2 BULQIZE 771 1 90% 5 154 3
3 DELVINE 358 0 58% 4 90 4
4 DEVOLL 735 1 26% 4 184 7
5 DIBER 1993 2 23% 7 285 22
6 DURRES 6781 7 28% 17 399 1
7 ELBASAN 8805 9 74% 13 677 5
8 FIER 5481 6 84% 13 422 2
9 GRAMSH 1858 2 33% 4 465 18
10 GJIROKASTER 1340 1 93%
9 149 3
11 HAS 1283 1 64% 4 321 3
12 KAVAJE 4326 5 86% 6 721 10
13 KOLONJE 908 1 68% 4 227 13
14 KORCE 3142 3 45% 12 262 3
15 KRUJE 1508 2 27% 5 302 3
16 KUCOVE 1231 1 74% 4 308 4
17 KUKES 4802 5 98% 7 686 35
18 LAC 3231 3 66% 7 462 6
19 LEZHE 1410 2 49% 9 157 1
20 LIBRAZHD 1085 1 46% 4 271 5
21 LUSHNJE 3895 4 61% 7 556 5
22 M.MADHE 1455 2 76% 4 364 4
23 MALLAKASTER 1427 2 85%
4 357 10
24 MAT 1758 2 75% 5 352 17
25 MIRDITE 1292 1 69% 4 323 11
26 PEQIN 1185 1 66% 4 296 16
27 POGRADEC 1056 1 82% 7 151 4
28 PERMET 3057 3 19% 4 764 17
29 PUKE 1202 1 63% 4 301 19
30 SARANDE 1674 2 48% 5 335 4
31 SKRAPAR 5263 6 26% 5 1053 26
32 SHKODER 832 1 48% 15 55 0
33 TEPELENE 551 1 7% 4 138 8
34 TIRANE 11443 12 44% 47 243 1
35 TROPOJE 1615 2 34% 4 404 45
36 VLORE 3177 3 85% 14 227 1
Source: Estimates based on NES data.

31
Annex Table 3: Econometric analysis of Effectiveness Model (M3) with constant returns to scale, assumption of technical development
(1) (2) (3) (4) (5) (6) (7) (8) (9) (10)
pooled cross-
section OLS
panel regression
with random effects
Tobit
pooled cross-
section
Tobit panel regression
with random effects
Simar & Wilson (2007)
pooled cross-
section OLS
panel regression with random effects
Tobit
pooled cross-
section
Tobit panel
regression with random effects
Simar &
Wilson (2007)
Labor market tightness
0.397** 0.277** 0.414** 0.275** 0.394*** 0.547*** 0.566*
* 0.593*
* 0.606*
* 0.386*
*
Long term unemployed
0.00132 0.00107 0.00128 0.000881 0.00197** 0.000474 0.0008
57 0.0004
27 0.0006
42 0.0010
5
Density of enterprises
0.000222 0.00364* -0.000104 0.00374* 0.00270 0.00280 0.0057
3** 0.0026
4 0.0056
4* 0.0043
2*
Building activity 0.137 -0.101 0.149 -0.131 -0.0161 0.0539 -0.0166 0.0571 -0.0380 -0.0930
Urbanization 0.00312* 0.00224 0.00358* 0.00280* 0.000706 0.00366** 0.0025
3 0.0041
3* 0.0030
8 0.0023
1
GDP per capita - - - - - -5.38e-07 -7.32e-07**
-5.73e-07*
-7.64e-07**
-4.77e-07
Industry share - - - - - 0.0148*** 0.0123
** 0.0156
*** 0.0132
** 0.0140
***
Year Dummies
2013 - - - - - - - - - -
2014 0.246*** 0.241*** 0.251*** 0.246*** 0.271*** 0.236*** 0.233*
** 0.238*
** 0.236*
** 0.256*
**
2015 0.197*** 0.131** 0.209*** 0.134** 0.159** 0.134** 0.0879 0.140*
* 0.0901 0.117*
2016 0.0717 0.0334 0.0772 0.0358 0.0601 - - - - -
Constant 0.00784 -0.0119 0.00261 -0.0176 -0.0786 -0.0261 0.0198 -0.0339 0.0175 -0.0985
R² 0.3334 0.3034 - - - 0.4435 0.4243 - - -
Observations 144 144 144 144 144 108 108 108 108 108
Source: Scnhabl et al. 2018. Note: * p < 0.1; ** p < 0.05; *** p < 0.01. The dependent variable is the efficiency scores from model M3.
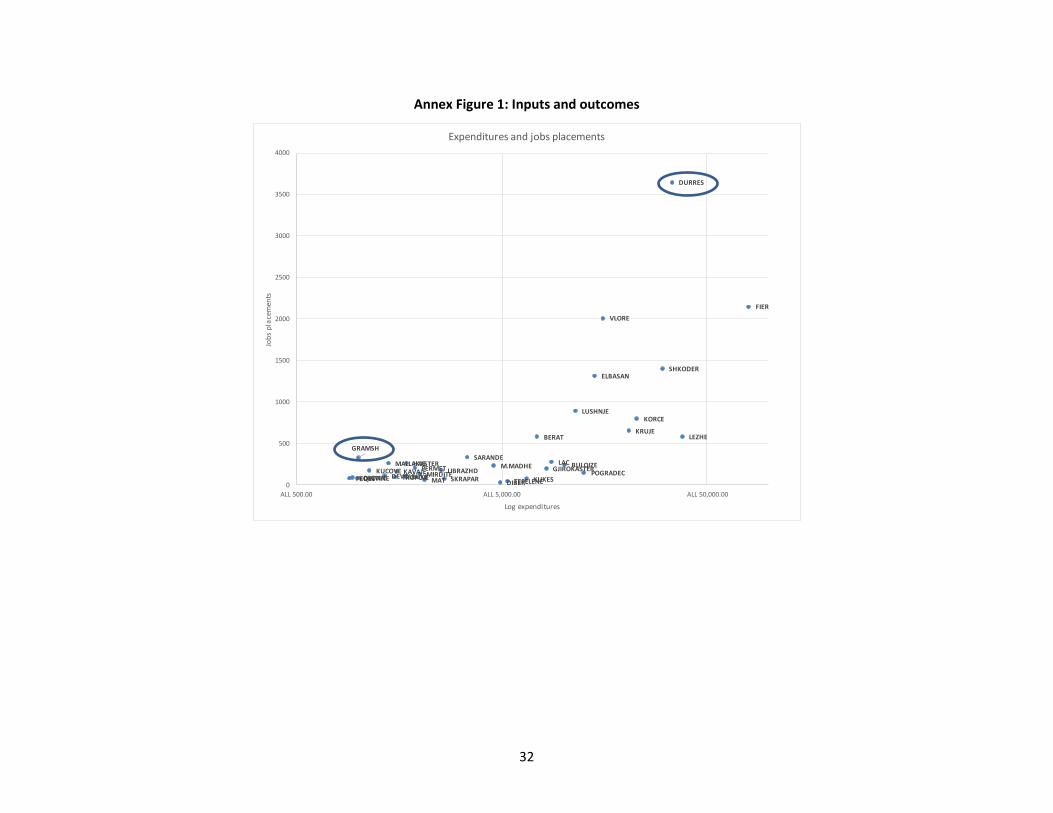
32
Annex Figure 1: Inputs and outcomes
BERAT
BULQIZE
DELVINE DEVOLLDIBER
DURRES
ELBASAN
FIER
GRAMSH
GJIROKASTERHAS
KAVAJEKOLONJE
KORCE
KRUJE
KUCOVEKUKES
LAC
LEZHE
LIBRAZHD
LUSHNJE
M.MADHEMALLAKASTER
MATMIRDITE
PEQINPOGRADEC
PERMETPUKE
SARANDE
SKRAPAR
SHKODER
TEPELENETROPOJE
VLORE
0
500
1000
1500
2000
2500
3000
3500
4000
ALL 500.00 ALL 5,000.00 ALL 50,000.00
Job
s p
lace
men
ts
Log expenditures
Expenditures and jobs placements

33
Source: Schnabl et al. 2018.
BERAT
BULQIZE
DELVINEDEVOLLDIBER
DURRES
ELBASAN
FIER
GRAMSH
GJIROKASTERHAS
KAVAJEKOLONJE
KORCE
KRUJE
KUCOVEKUKES
LAC
LEZHE
LIBRAZHD
LUSHNJE
M.MADHEMALLAKASTER
MATMIRDITEPEQIN
POGRADECPERMETPUKE
SARANDE
SKRAPAR
SHKODER
TEPELENETROPOJE
VLORE
0
500
1000
1500
2000
2500
3000
3500
4000
0 2 4 6 8 10 12 14 16 18
Job
s p
lace
men
ts
Total staff
Staff and jobs placements

34