JJoouurrnnaall ooff AApppplliieeddaanndd ... · PDF fileDwi Sumarwati, Subriyer Nasir dan...
11
CHEMICAL ENGINEERING, GRADUATE SCHOOL FACULTY OF ENGINEERING, UNIVERSITY OF SRIWIJAYA J J o o u u r r n n a a l l o o f f A A p p p p l l i i e e d d a a n n d d E E n n g g i i n n e e e e r r i i n n g g C C h h e e m m i i s s t t r r y y ISSN 2301-9077 Volume 1 No. 1 June 2011
Transcript of JJoouurrnnaall ooff AApppplliieeddaanndd ... · PDF fileDwi Sumarwati, Subriyer Nasir dan...
CHEMICAL ENGINEERING, GRADUATE SCHOOLFACULTY OF ENGINEERING, UNIVERSITY OF SRIWIJAYA
JJoouurrnnaall ooff AApppplliieedd aanndd
EEnnggiinneeeerriinngg CChheemmiissttrryy
ISSN 2301-9077
Volume 1 No. 1 June 2011
iii
CONTENT
Study Of Palm Oil Residue Potential For Electricity GenerationIn South Sumatra IndonesiaMuhammad D. Bustan, Hafsah, P.Abdul Salam, and S. Kumar 1
Studi Kinerja Low Temperature Shift Converter (LTSC) padaPabrik Pusri 1B berbasis Neraca Massa dan Neraca PanasDwi Sumarwati, Subriyer Nasir dan Muhammad Faizal 10
Pegujian Performance Adsorben Serat Buah Mahkota Dewa(Phaleria marcocarpa (Scheff) dan Clay terhadap Larutanyang Mengandung Logam KromiumSri Haryati, Endang Supraptiah dan Muhammad D. Bustan 18
Pemodelan Computational Fluid Dynamics untukMempelajari Hidrodinamika Fluida-Solid dalamAutoclave Skala BatchWidya Grantina, Muhammad Said dan Novia 24
Pengolahan Air Limbah Pewarna Sintetis denganMetode Adsorpsi dan UltravioletNurlela, Muhammad Faizal dan Tuty E. Agustina 29
Observasi Morfologi Khamir dari Minuman Tradisional Tuakyang Digunakan untuk Fermentasi EtanolHermansyah dan Heni Yohandini 35
Crystal Structure of Novel Ternary Intermetallic Compoud CA3CD8PT4
Fakhli Gulo, Saroj L. Samal and John D. Corbett 39
Produksi Listrik dari Limbah Cair Industri Tahu denganMenggunakan Salt Bridge Microbial Fuel CellH. E. Putra, A. S. Putra, D. Permana, Djaenudin dan H. R. Hariyadi 45
Kinetics of Methane Oxidation on Binary PT-CR CatalystMardwita, Hideki Matsune, Sakae Takenaka and Masahiro Kishida 50
Vol. 1, No. 1, June 2011
Graduate Program of Chemical Engineering, Sriwijaya UniversityJournal of Applied and Engineering Chemistry, Vol. 1, pp. 1-9, June 2011
1
STUDY OF PALM OIL RESIDUE POTENTIAL FOR ELECTRICITYGENERATION IN SOUTH SUMATRA INDONESIA
Muhammad Djoni Bustan a, Hafsaha, P.Abdul Salamb, S.Kumarb
aDepartment of Chemical Engineering, University of Sriwijaya, Inderalaya, Ogan Ilir 30662,
Sumatera Selatan, IndonesiabEnergy Field Study, School Of Environment, Resources and Development,
Asian Institute of Technology, ThailandCorresponding author: [email protected]
ABSTRACT
This study was aimed to asses technical and economic potential of palm oil residue in south Sumatrataking into account availability, present usage, cost involved and other issues to review the state ofart of palm oil residue conversion technology and identify suitable technologies for using in SouthSumatra and to identify possible biomass electricity generation and carry techno-economical andenvironmental analysis of the system. The results show that the potential energy that can beextracted from oil palm solid residue in South Sumatera province taking the efficiency of biomasspower generation is about 4.4 PJ/year.It can generate electricity up to 308 GWh/year. The wastewater generated was about 1 Million meter cube POME/year. This POME can produce 11,058 m3
methane which is equivalent to 0.4 PJ/year and generate electricity as much as 150 GWh /year.Based on the scenario have been analyzed using GIS software shows that the potential area for 15MW independent power plant constructions have been identified taking into account availability offeedstock and the maximum allowable distances. Analysis of the financial viability of the projectsevaluated using RETScreen. The results for independent power plant showed that the project IRR islower than the discount rate. However, with the implementation of CER for CDM, the project financialanalysis becomes viable. Moreover, other advantages that can be obtained from these projects arethe reduction of GHG emission. Overall, the study clearly indicates the high potential for thegeneration and use of palm oil residue in South Sumatra.
Keywords: Palm Oil residue, power plant, CHP, methane capture, RETScreen, GIS Software
1. INTRODUCTIONEnergy consumption in Indonesia is
growing rapidly as a consequence ofmassive economic development as well aspopulation growth. The dependence ofIndonesia on imported oil has burdenedthe government when the world oil pricecontinued to increase and consequentlyincrease of subsidies that the governmenthad to pay. Utilization of alternative energysource using locally available resourcessuch as biomass and other renewableenergies can be one of the options toincrease the accessibility of energy.
South Sumatera is the one ofagricultural regions in Indonesia which hasabundant biomass source. Approximately33.5% of land used in this province is usedfor plantations and agriculture (BPS,2009). The major commodities are palm oiland rubber. Based on agriculture economicstructure, South Sumatera has beenidentified as the potential region forpenetration of renewable energy from
biomass. Despite the fact that its potentialis enormous, the utilization of biomassenergy in south Sumatera still not yet beendeveloped, especially from agricultureresidue and plantation. With respect to thebiomass residue, it has been reported thata considerable amount of biomass residuehas a great potential to be substituted forfossil fuels. The most significant potentialsources of biomass residue for energy ispalm oil residue where the development ofoil palm plantation is growing rapidly(Agricultural Department, 2009).
2. POTENTIAL OF PALM OIL RESIDUEIn recent years, palm oil is the most
promising commodity in South Sumatrawhich is produced significantly comparedto other commodities. The production of oilpalm reached 2 million tons in 2009 withtotal area of plantation reached 775,503Ha. Based on data from South Sumatracrops estate agencies during 2006 to 2009there was an increasing of land area for oil
Graduate Program of Chemical Engineering, Sriwijaya UniversityJournal of Applied and Engineering Chemistry, Vol. 1, pp. 1-9, June 2011
2
palm plantation as much as 10-12 %/year.Therefore the optimal utilization of biomassresidue from oil palm as a potential sourceof energy production can move forward byusing appropriate technology.
At present fiber and shell as residuesof palm oil processing in South Sumatraare used as a fuel for boiler to meetelectricity need in the plant besides usingdiesel engine for electricity generation. Thecomposition of fiber and shell as fuel is85:15; this composition is aimed to preventbreakage of boiler due to high silicacontent in shell. In general 60% of Fiberand shell are used as a fuel and it can bedirectly feed into boiler; it doesn’t needfurther treatment because the moisturecontent of fiber and shell are sufficient forboiler fuel. The cogeneration technology
has been used in most of palm oil mill insouth Sumatera. The high pressure steamaround 18-20 kg/cm2 that is produced fromthe boiler is utilized to drive turbine andgenerate electricity. The electricityrequirement for plant with capacity 60 tonFFB/hour is as much as 850 KW. The backpressure steam with a pressure of 3kg/cm2 is used for heating process. Duringpeak production of palm oil, the availabilityof fiber and shell are plentiful, andsometimes be sold to other factory (Kurnia,2009).
Residue to product ratio of fiber, shelland EFB based on site survey are taken as0.119, 0.069 and 0.244 at moisture content23%, 20% and 60% respectively. Thecharacteristics of solid waste from oil palmprocessing are summarized in the Table 1.
Table 1. Characteristic of solid waste from oil palm processing
Parameter Fiber Shell EFBRPRMoisture content (%)Surplus availability factorEnergy Use FactorOil content (%)LHV (MJ/kg)
0.119230
0.857
10.11
0.069200
0.65-
15.23
0.244600.7
0.031.23
Meanwhile for EFB because of its highmoisture content (±60%), it can not beused directly for boiler fuel. It needs furthertreatment to use it as a fuel. Only 3% ofEFB is used for boiler fuel, therefore theenergy use factor for EFB is taken to be0.03. Traditionally, 10% of EFB is used asanimal feed and 20% as fertilizer andorganic mulch in plantation to reduceconsumption of synthetic fertilizer. It isclaimed that production of FFB alsoincreases up to 10 to 20% by using EFB asfertilizer due to its potassium content. It willdecompose naturally in aerobic conditionafter 6 month to several years and releasethe nutrition for soil fertility. Oil palm is oneof agriculture crop that requires heavydemand on nutrient. However, thedecomposition of EFB as an aerobicfermentation can generates methane gas,which contributes to the environmentalproblem due to its stability as green housegas in the atmosphere. More over, thetransportation cost for delivering EFB tothe plantation is also an emerging issue forthe owner of POM to apply it as mulch orfertilizer. With thousand hectares of palm
oil plantation, it is not economically viabledue to the cost of transportation and otherdisposal issues onto plantation, such asapplication of inappropriate EFB mulch canlead to the growth of oil palm pest in thearea of plantation (Kurnia, 2009).
Table 2. Characteristic of waste water fromoil palm processing*
Parameter RangepHTemperature (oC)Total Solid (mg/L)Total Dissolve Solid (mg/L)BOD (mg/L)COD (mg/L)
4.0-4.660-80
30,000-60,00015,000-30,00020,000-40,00040,000-70,000
*Kurnia, 2009
Other disposal issue of palm oilplantation is waste water discharge. Thewaste water is mainly from cleaning,clarifying and sterilization process. Thetemperature of waste water fromsterilization process is around 70oC. Thequantity of waste water in oil palmprocessing depends on type of process,capacity of plant and clarifier condition. Forinstance, if the plant using decanter toclarify the sludge, the waste water
Graduate Program of Chemical Engineering, Sriwijaya UniversityJournal of Applied and Engineering Chemistry, Vol. 1, pp. 1-9, June 2011
3
produced is less than using sludgecentrifuge as clarifier. The characteristic ofwaste water in oil palm processing industryis in Table 2.
In most of the cases, POME is utilizedas liquid fertilizer and pumped into theplantation after treatment by anaerobicprocess. The treated water is pumped intoreservoir which is located in the highestplace of plantation area. The liquid fertilizeris used to irrigate the land on the basis ofdifferences on elevated area. It will flowinto a lower location through channelprovided for this purpose; this method isknown as land application. The utilizationof treated water as fertilizer is claimed toreduce fertilizer consumption by 30% / ha.However from environmental view, the
weak point of this method is in the rainyseason, when the soil in plantation areabecomes saturated with the water and itcan not hold optimally water runoff fromrain as well as liquid fertilizers. As aconsequence, the water will flow to thelowest part of the land and finally will go towater bodies. The BOD content of thistreated water is still high in range of 3500-5000 mg/L. As a result, this might polluteto the environment (Kurnia, 2009).
The possibility to convert theseresidues to energy is an attractive optionwhile the quantities are available insignificant amount. Table 3 and 4 showtheoretical potential as well as technicalpotential of palm oil solid residues andPOME to energy.
Table 3. Palm Oil Solid Residue Potential
RegencyProduction(Ton/year)
Energy potential(GJ Thermal /yr)
Technical Potential(MWh/yr)
Lahat 151,708 330,708 22,965.8Pagaralam 10.1 22 1.5Empat Lawang 0 0 0Musi Banyuasin 486,846 1,061,274 74,699.6Banyuasin 253,449 552,493 38,367.6Musi Rawas 332,548 724,921 50,341.7Lubuk Linggau 63 137 9.5OKU 111,783 243,675 16,921.9OKU Timur 80,843 176,229 12,238.2OKU Selatan 36 79 5.5OKI 376,081 819,818 56,931.8Ogan Ilir 22,935 49,996 3,471.9Muara Enim 216,992 473,020 32,848.6Prabumulih 3,258 7,102 493.2Total 2,036,553 4,439,476 308,297
Table 4. Potential of POME
RegencyProduction(m3/year)
Theoretical potential(GJ thermal/yr)
Technical potential(MWh electricity/yr)
Lahat 75,854 29,491 11,207Empat Lawang 5 2 1Pagar Alam 0 0 0Musi Banyuasin 243,423 94,640 35,963Banyuasin 126,725 49,269 18,722Musi Rawas 166,274 64,645 24,565Lubuk Linggau 32 12 5Ogan Komering Ulu 55,892 21,730 8,257Ogan Komering Ulu Timur 40,422 15,715 5,972Ogan komering Ulu Selatan 18 7 3Ogan Komering Ilir 188,041 73,108 27,781Ogan Ilir 11,468 4,458 1,694Muara Enim 108,496 42,182 16,029Prabumulih 1,629 633 241Total 1,018,276 395,894 150,440
The total amount of oil palm residueabove is coming from forty five POMs with
production capacity range from 30-120 TonFFB/hour (BPS,2009). With conversion
Graduate Program of Chemical Engineering, Sriwijaya UniversityJournal of Applied and Engineering Chemistry, Vol. 1, pp. 1-9, June 2011
4
efficiency 25%, the potential energy thatcan be extracted from solid residue reach4.4 PJ/year which can generate electricityequivalent to 308 GWh/year. Whereaswaste water generated reached 1 Millionmeter cube POME/year. This amount ofPOME can produce as much as 11,058 m3
methane which is equivalent to 395,894GJ/year and generate electricity as muchas 150 GWh/year. This energy can berecovered either by using it as fuel or as adriver of gas/steam turbine to generateelectricity.
This potential amount of energyindicates a plentiful biomass source whichcan be harnessed from palm oil residue togenerate electricity or produce energy. Theshare of biomass based power generationmight be very significant. Further researchneed to be done to find the viability of theproject to use this residue for energyproduction taking into account technical,social, environmental and other factors.
3. THE PROPOSED TECHNOLOGY FORPALM OIL RESIDUE CONVERSION
There are some scenarios of wastemanagement that can be implemented inpalm oil mill. The utilization of palm oilresidue can be varied depend upon theavailable technology and adoptability oftechnology proposed and its costeffectiveness. One of the technologyoptions is to build independent powerplant where the distance between POMand the location of the power plant istaken into consideration. Than thepotential site and viability of the projectwere analyzed with the help of GISarcview and RETScreen Software.. Thecalculation of amount of heat generatedfrom palm oil residue where taking of 10ton/hr of FFB as basis of calculation byusing parameter defined in Table 1 and 2can be seen in Table 5.
Table 5. Heat generated from oil palm residueParameter Production (t/h) Lower Heating Value
(MJ/kg)Heat Generated (GJ)
Fiber 1.1 10.11 11.12Shell 0.6 15.23 9.13EFB (moisture 60%) 2.44 3 7.32POME 5.0Methane 54 m3 38.5 MJ/m3 2.079
Based on Table 5, the feedstockneeded for energy production in certainamount can be estimated. To analyzepotential of site to build independent powerplant, GIS Arcview and RETScreensoftware was used as follows:1. Input the coordinate of each POM to
GIS arcview with known capacity ofFFB/hour
2. The candidate power plant location isobtained with distance 50 km from thePOM
3. Define the potential site of power planttaking into account biomass availabilityaround the site according to power plantcapacity
4. Define the economical andtechnological potential of the selectedsite taking into consideration thetransportation cost of EFB feedstockusing RETScreen software
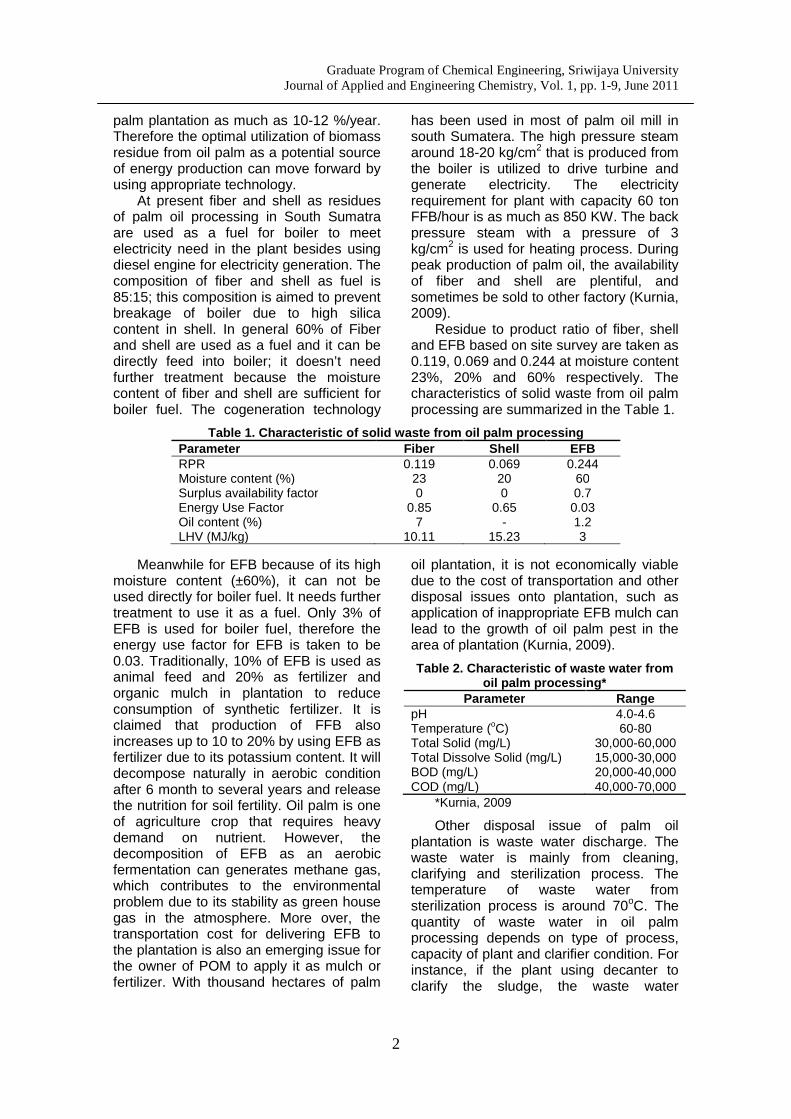
Step1. Input of coordinates of POMlocation. Figure 1 shows the POM location
in south Sumatera with known capacity ofton FFB/hour.
Figure 1. POM coordinate
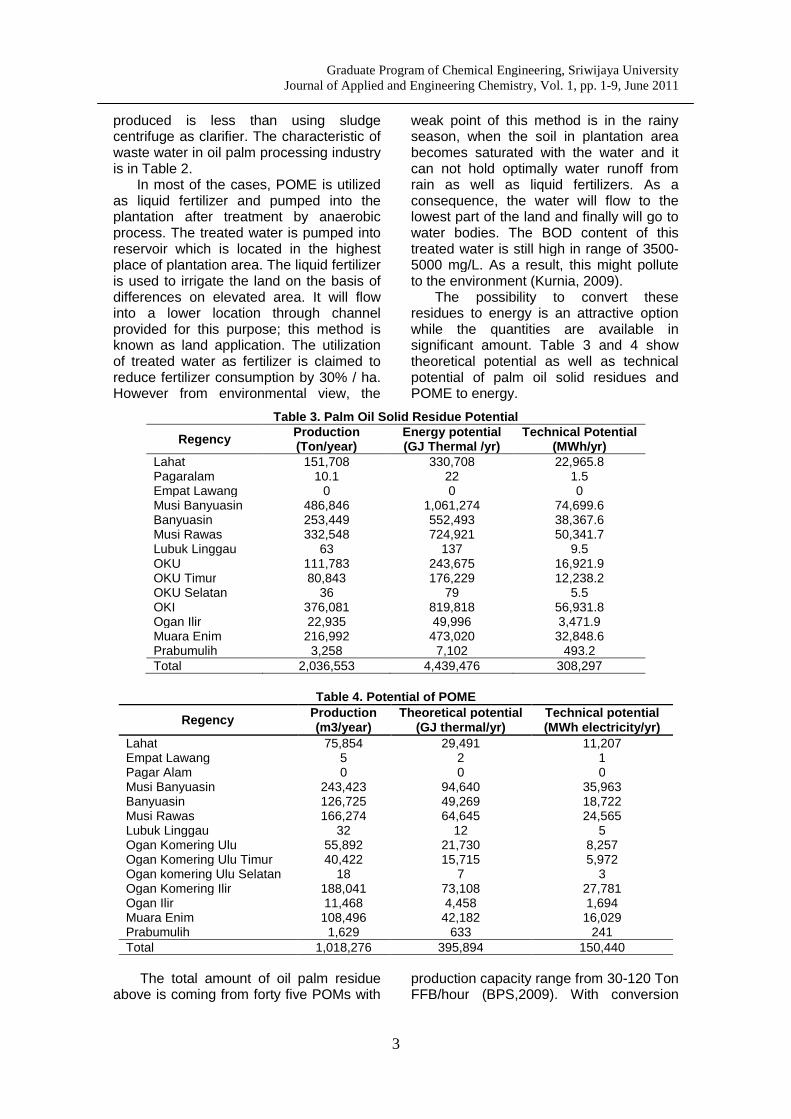
Step2. The candidate of power plant isdefined with distance 50 km (maximum)from POM location. Figure 2 shows theresult of GIS for the candidates of powerplant. From simulation in GIS software thepotential location of the plant project canbe defined by inputing the maximumallowable distance to be as much as 50 km
POM location
Graduate Program of Chemical Engineering, Sriwijaya UniversityJournal of Applied and Engineering Chemistry, Vol. 1, pp. 1-9, June 2011
5
(Lin, 2009). The result of GIS is shown inthe Figure 2.
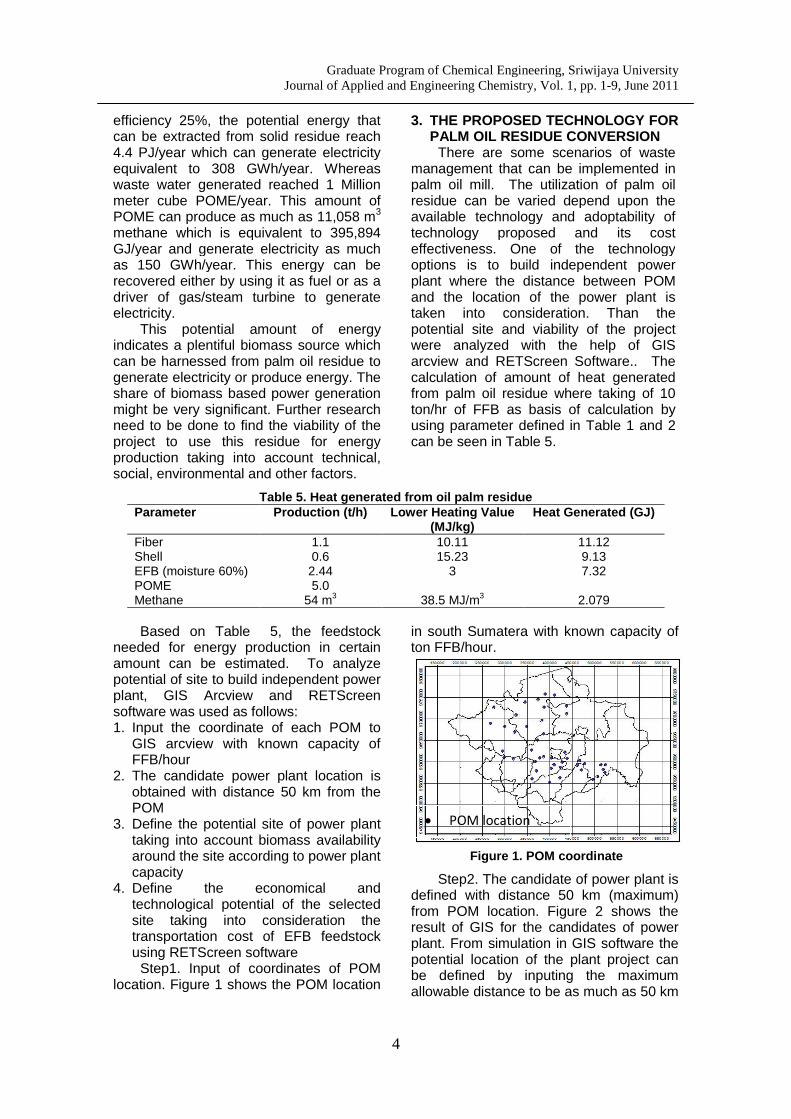
Step 3. The potential sites withsufficient amount of feed stock from POMcan be defined using GIS arcview. Basedon the calculation using RET Screen tobuild power Plant with capacity 15 MW
needs 134 kT EFB which is fulfilled byPOM around the selected 50 km distance.Figure 3 shows the potential site in southSumatera Province taking into account thetransportation distance of the project tobuild an independent power plant andavailability of EFB.
.Figure 2. Map showing the area that are within 50 km from POM
Figure 3. The potential sites for independent power plant
Step 4. Analysis of the financialviability of the potential site of the project.With respect to independent power plant,
the availability of feed stock should beensured. The production of FFB is variedseasonally during the year, and so the
POM location
BayungLincir, MUBA
Ujan Mas,Muara Enim
Mesuji, OKI
50km
50 km distance from POM
Graduate Program of Chemical Engineering, Sriwijaya UniversityJournal of Applied and Engineering Chemistry, Vol. 1, pp. 1-9, June 2011
6
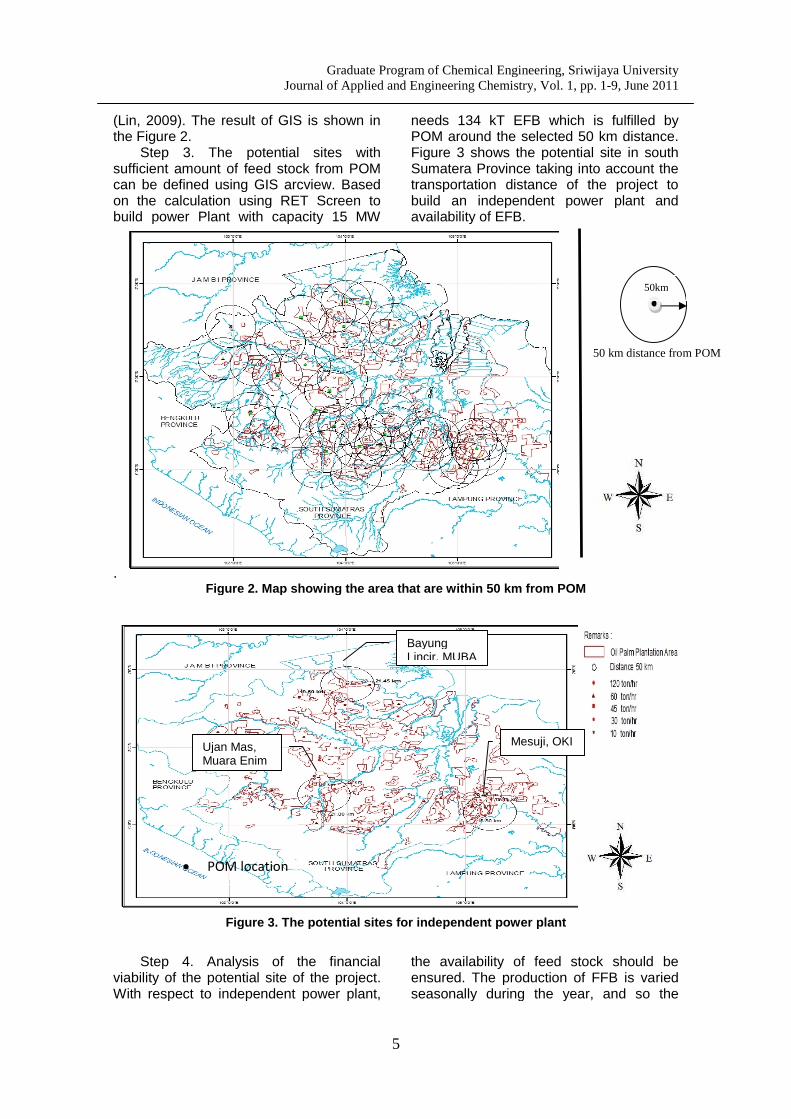
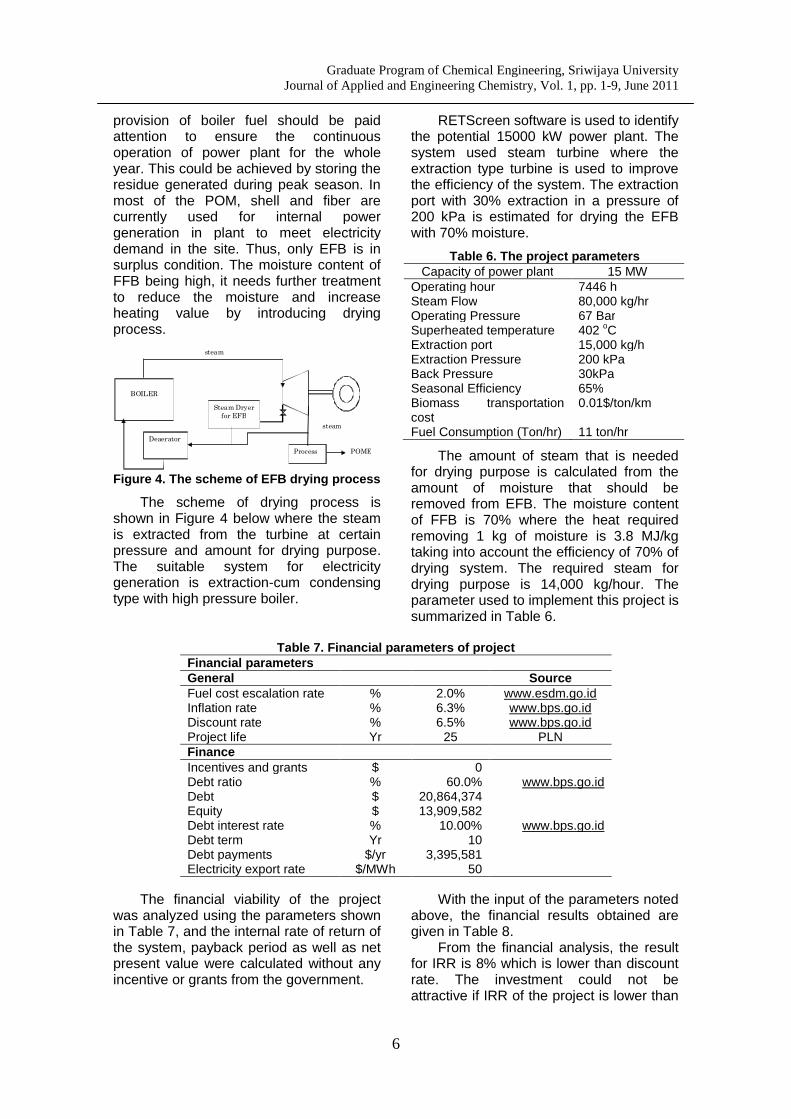
provision of boiler fuel should be paidattention to ensure the continuousoperation of power plant for the wholeyear. This could be achieved by storing theresidue generated during peak season. Inmost of the POM, shell and fiber arecurrently used for internal powergeneration in plant to meet electricitydemand in the site. Thus, only EFB is insurplus condition. The moisture content ofFFB being high, it needs further treatmentto reduce the moisture and increaseheating value by introducing dryingprocess.
BOILER
Process
steam
Deaerator
POME
steam
Steam Dryerfor EFB
Figure 4. The scheme of EFB drying process
The scheme of drying process isshown in Figure 4 below where the steamis extracted from the turbine at certainpressure and amount for drying purpose.The suitable system for electricitygeneration is extraction-cum condensingtype with high pressure boiler.
RETScreen software is used to identifythe potential 15000 kW power plant. Thesystem used steam turbine where theextraction type turbine is used to improvethe efficiency of the system. The extractionport with 30% extraction in a pressure of200 kPa is estimated for drying the EFBwith 70% moisture.
Table 6. The project parametersCapacity of power plant 15 MW
Operating hour 7446 hSteam Flow 80,000 kg/hrOperating Pressure 67 BarSuperheated temperature 402 oCExtraction port 15,000 kg/hExtraction Pressure 200 kPaBack Pressure 30kPaSeasonal Efficiency 65%Biomass transportationcost
0.01$/ton/km
Fuel Consumption (Ton/hr) 11 ton/hr
The amount of steam that is neededfor drying purpose is calculated from theamount of moisture that should beremoved from EFB. The moisture contentof FFB is 70% where the heat requiredremoving 1 kg of moisture is 3.8 MJ/kgtaking into account the efficiency of 70% ofdrying system. The required steam fordrying purpose is 14,000 kg/hour. Theparameter used to implement this project issummarized in Table 6.
Table 7. Financial parameters of projectFinancial parametersGeneral SourceFuel cost escalation rate % 2.0% www.esdm.go.idInflation rate % 6.3% www.bps.go.idDiscount rate % 6.5% www.bps.go.idProject life Yr 25 PLNFinanceIncentives and grants $ 0Debt ratio % 60.0% www.bps.go.idDebt $ 20,864,374Equity $ 13,909,582Debt interest rate % 10.00% www.bps.go.idDebt term Yr 10Debt payments $/yr 3,395,581Electricity export rate $/MWh 50
The financial viability of the projectwas analyzed using the parameters shownin Table 7, and the internal rate of return ofthe system, payback period as well as netpresent value were calculated without anyincentive or grants from the government.
With the input of the parameters notedabove, the financial results obtained aregiven in Table 8.
From the financial analysis, the resultfor IRR is 8% which is lower than discountrate. The investment could not beattractive if IRR of the project is lower than

Graduate Program of Chemical Engineering, Sriwijaya UniversityJournal of Applied and Engineering Chemistry, Vol. 1, pp. 1-9, June 2011
7
other similar projects, Competitive IRRbased on many experiences for the projectshould be more than 15% (Boukis et.al,2008). Based on this IRR value, it can beseen that the project without any incentivewill not be attractive.
But with application of CER sale for 7years, the IRR of project increasessignificantly to 18.3% with credit rate is
20$/ton CO2, Table 9 shows the effect ofCER income to the viability of the project.
The government could play importantrole to set the regulation to encourage theinvestment on utilization of renewableenergy such as feed in tariff for theelectricity produced by renewable energy,Renewable Port-Folio Standards, orholiday for income tax and rebate.
Table 8. Financial Result of projectFinancial viability Units 15 MW With CER
Pre-tax IRR – equity % 8.0% 18.3%
Pre-tax IRR – assets % 1.3% 4.9%
After-tax IRR – equity % 8.0% 18.3%
After-tax IRR – assets % 1.3% 4.9%
Simple payback Yr 8.7 5.6
Equity payback Yr 12.9 4.8
Net Present Value (NPV) $ 3,726,204 20,570,258
Annual life cycle savings $/yr 305,480 1,686,380
Benefit-Cost (B-C) ratio 1.21 2.16
Debt service coverage 1.09 1.84
Energy production cost $/MWh 47.88 38.32
Table 9. Financial results with CER income
Parameters Unit
Pre-tax IRR – equity % 18.3%
Pre-tax IRR – assets % 4.9%
After-tax IRR – equity % 18.3%
After-tax IRR – assets % 4.9%
Simple payback Yr 5.6
Equity payback Yr 4.8
Net Present Value (NPV) $ 20,570,258
Annual life cycle savings $/yr 1,686,380
Benefit-Cost (B-C) ratio 2.16
Debt service coverage 1.84
Energy production cost $/MWh 38.32
GHG reduction cost $/tCO2 (12)
Figure 5. Risk analysis
Graduate Program of Chemical Engineering, Sriwijaya UniversityJournal of Applied and Engineering Chemistry, Vol. 1, pp. 1-9, June 2011
8
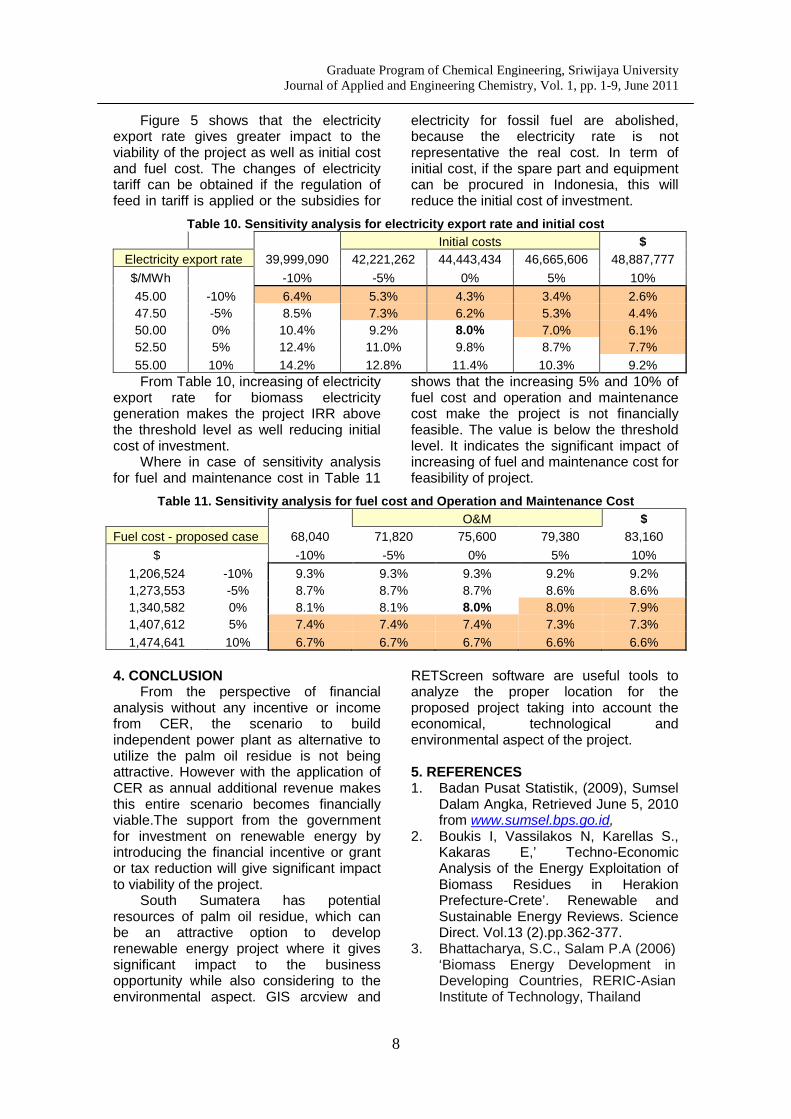
Figure 5 shows that the electricityexport rate gives greater impact to theviability of the project as well as initial costand fuel cost. The changes of electricitytariff can be obtained if the regulation offeed in tariff is applied or the subsidies for
electricity for fossil fuel are abolished,because the electricity rate is notrepresentative the real cost. In term ofinitial cost, if the spare part and equipmentcan be procured in Indonesia, this willreduce the initial cost of investment.
Table 10. Sensitivity analysis for electricity export rate and initial cost
Initial costs $
Electricity export rate 39,999,090 42,221,262 44,443,434 46,665,606 48,887,777
$/MWh -10% -5% 0% 5% 10%
45.00 -10% 6.4% 5.3% 4.3% 3.4% 2.6%
47.50 -5% 8.5% 7.3% 6.2% 5.3% 4.4%
50.00 0% 10.4% 9.2% 8.0% 7.0% 6.1%
52.50 5% 12.4% 11.0% 9.8% 8.7% 7.7%
55.00 10% 14.2% 12.8% 11.4% 10.3% 9.2%
From Table 10, increasing of electricityexport rate for biomass electricitygeneration makes the project IRR abovethe threshold level as well reducing initialcost of investment.
Where in case of sensitivity analysisfor fuel and maintenance cost in Table 11
shows that the increasing 5% and 10% offuel cost and operation and maintenancecost make the project is not financiallyfeasible. The value is below the thresholdlevel. It indicates the significant impact ofincreasing of fuel and maintenance cost forfeasibility of project.
Table 11. Sensitivity analysis for fuel cost and Operation and Maintenance Cost
O&M $
Fuel cost - proposed case 68,040 71,820 75,600 79,380 83,160
$ -10% -5% 0% 5% 10%
1,206,524 -10% 9.3% 9.3% 9.3% 9.2% 9.2%
1,273,553 -5% 8.7% 8.7% 8.7% 8.6% 8.6%
1,340,582 0% 8.1% 8.1% 8.0% 8.0% 7.9%
1,407,612 5% 7.4% 7.4% 7.4% 7.3% 7.3%
1,474,641 10% 6.7% 6.7% 6.7% 6.6% 6.6%
4. CONCLUSIONFrom the perspective of financial
analysis without any incentive or incomefrom CER, the scenario to buildindependent power plant as alternative toutilize the palm oil residue is not beingattractive. However with the application ofCER as annual additional revenue makesthis entire scenario becomes financiallyviable.The support from the governmentfor investment on renewable energy byintroducing the financial incentive or grantor tax reduction will give significant impactto viability of the project.
South Sumatera has potentialresources of palm oil residue, which canbe an attractive option to developrenewable energy project where it givessignificant impact to the businessopportunity while also considering to theenvironmental aspect. GIS arcview and
RETScreen software are useful tools toanalyze the proper location for theproposed project taking into account theeconomical, technological andenvironmental aspect of the project.
5. REFERENCES1. Badan Pusat Statistik, (2009), Sumsel
Dalam Angka, Retrieved June 5, 2010from www.sumsel.bps.go.id,
2. Boukis I, Vassilakos N, Karellas S.,Kakaras E,’ Techno-EconomicAnalysis of the Energy Exploitation ofBiomass Residues in HerakionPrefecture-Crete’. Renewable andSustainable Energy Reviews. ScienceDirect. Vol.13 (2).pp.362-377.
3. Bhattacharya, S.C., Salam P.A (2006)‘Biomass Energy Development inDeveloping Countries, RERIC-AsianInstitute of Technology, Thailand

Graduate Program of Chemical Engineering, Sriwijaya UniversityJournal of Applied and Engineering Chemistry, Vol. 1, pp. 1-9, June 2011
9
4. Director General for Electricity andEnergy Utilization Ministry of Energyand Mineral Resources. Blueprintpengelolaan energy national 2005–2025.
5. Faaij, Andre (2006),’ Modern biomassConversion technologies’, Mitigationand adaptation Strategies for GlobalChange, Spriger scienceVol.11(2006), pp.343-375
6. Kurnia, E. (2009). Tinjauan ProsesPengolahan Limbah Crude Palm Oil(CPO) di PT. Guthrie PecconinaIndonesia (EPI) Kec. Babat TomanMusi Banyuasin. South Sumatra.Indonesia
7. Opiso E.M. (2010), Assessment ofRenewable Energy Resources;potential and its Application fordecentralized Rural ElectrificationUsing Geographic Information System(GIS), Asian Institute Of TechnologyPublication
8. Sorensen B. and Meibom P. (1999),‘GIS Tools for Renewable EnergyModeling’, Renewable Energy, Vol. 16(1999), pp.1262-1267
9. Tampubolon, Agustinus P (2008),‘Kajian Kebjakan Energi BiomassaKayu bakar’, Jurnal AnalisisKebijakanKehutananVol.5 No.1 pp.29-37
10. Voivontas D., Assimacopoulos D.Mourelatos A., (1998), ‘Evaluation ofRenewable Energy Potential using aGIS Decision Support System’,Renewable Energy, Vol. 13, No. 3,pp.333-334
11. Voivontas D., AssimacopoulosD.Koukios E.G., (2001), ‘Assessment ofBiomass Potential for PowerProduction: A GIS Based Method’,Biomass and Bioenergy, Vol. 20(2001), 101-112.