Jisc digital experience insights survey 2019: findings ... · I am delighted to introduce the...
41
September 2019 Digital experience insights survey 2019: findings from students in UK further and higher education Authors: Mark Langer-Crame, Tabetha Newman, Helen Beetham, Clare Killen and Sarah Knight
Transcript of Jisc digital experience insights survey 2019: findings ... · I am delighted to introduce the...

September 2019
Digital experience insights survey 2019: findings from students in UK further and higher education
Authors: Mark Langer-Crame, Tabetha Newman, Helen Beetham, Clare Killen and Sarah Knight

What the data tells us: question-by-question analysis 32
Section 3
Appendix 1 78
Acknowledgements 80
Section 5
Theme one: the digital lives of learners 34
Theme two: digital in the institution 46
Theme three: digital at course level 54
Theme four: student attitudes to digital 62
Additional detailed analysis 70
Year-on-year analysis 70
What drives student satisfaction with digital teaching and learning? 71
Comparing attitudes by student age 74
Comparing attitudes by gender 76
Comparing attitudes by range of HE organisational measures 77
Section 4
3
Foreword 4
Introduction 7
Key statistics 10
Summary of student findings and key messages 13
Section 1
ContentsWhat is the digital experience insights service? 22
See the digital experience through the eyes of your students and staff 22
Key elements of our digital experience insights service 23
Additional resources and future publications 23
Methodology 24
The survey template 24
The question set 24
Response rates 25
Participating organisations 26
Participating students 28
Is our sample representative? 28
Uses and limitations of this data 31
Section 2

During my time as NUS president, I have seen first-hand the ways in which digital technology is being used to enhance teaching, learning and inclusion. We know that the future is digital and this is why it is essential to use digital technologies within the learning environment to equip students with skills and knowledge – so that they are not just training for a job but for a global career.
5
I am delighted to introduce the findings from Jisc’s 2019 digital experience insights student survey. This report provides a detailed picture of how students experience technology as part of their learning in colleges and universities across the UK.
This year, nearly 30,000 participants from 50 further education (FE) and higher education (HE) organisations have told us about their digital learning experiences. Since the first survey was launched in 2016 more than 100,000 students have had their say and are helping to shape the digital experience for future learners.
Colleges and universities already invest heavily in technology and the digital environment, so it is vital that they understand how their students are using the technology they provide, what works well and where improvements can be made.
At a national level this report reveals that although student satisfaction levels are generally high there are areas where we all need to work together to
address issues such as improving students’ understanding of data privacy and protecting their wellbeing.
I encourage all leaders to use this report to enhance their students’ digital experience and to take full advantage of the expert advice and support provided by Jisc in approaching areas such as curriculum design and the learning environment in a fully digital way.
Finally, I call on universities and colleges to work in partnership with their students to ensure they are providing the best possible education experience – one in which digital technology is fully integrated and offers opportunities for all learners to develop the skills they need to thrive in today’s fast changing world.
Shakira Martin
Outgoing president of the National Union of Students (NUS) and head of student experience at Rose Bruford College
Foreword
Section 1 Back to contents page
7
As technology becomes ever more pervasive, it is vital that the skills, knowledge and behaviours required by industry 4.01 are cultivated in education – building an education 4.0. The UK government’s industrial strategy2 outlines a vision for our economic prosperity and highlights digital skills as one of its core pillars – a challenge also picked up in the government’s report on the potential of technology in education3.
Meanwhile, the World Economic Forum warns of the potential of technology to exacerbate exclusion unless the skills gap is addressed4. Employers are already reporting concerns about this critical issue5 and the need to prepare the workforce of the future for jobs that don’t yet exist6.
Jisc’s digital experience insight service provides colleges and universities with meaningful, robust and actionable data which can be used to make a real difference to the student digital experience, prepare them for the future workplace and inform investment decisions.
The data presented in this report was collected during the digital experience insights service’s first year of full service. It builds on three years of research and consultation with the sector as we work together to understand students’
expectations and experiences of technology and align these with the skills students need to live and work in a digital society.
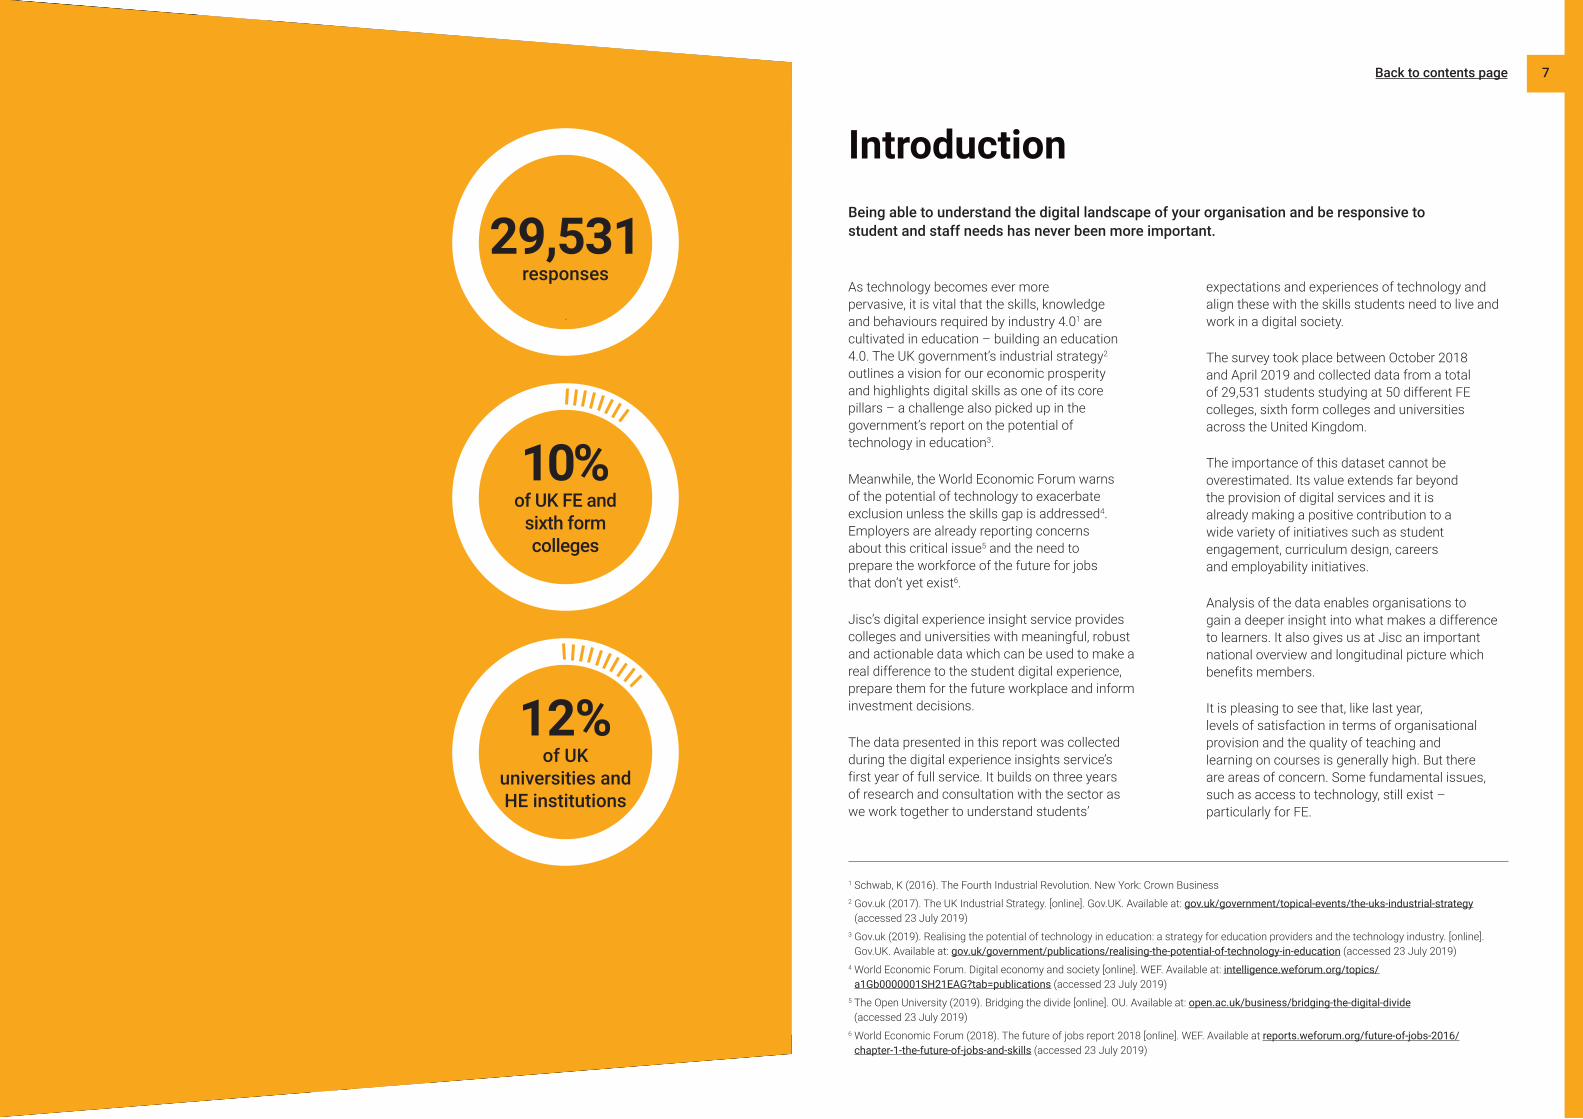
The survey took place between October 2018 and April 2019 and collected data from a total of 29,531 students studying at 50 different FE colleges, sixth form colleges and universities across the United Kingdom.
The importance of this dataset cannot be overestimated. Its value extends far beyond the provision of digital services and it is already making a positive contribution to a wide variety of initiatives such as student engagement, curriculum design, careers and employability initiatives.
Analysis of the data enables organisations to gain a deeper insight into what makes a difference to learners. It also gives us at Jisc an important national overview and longitudinal picture which benefits members.
It is pleasing to see that, like last year, levels of satisfaction in terms of organisational provision and the quality of teaching and learning on courses is generally high. But there are areas of concern. Some fundamental issues, such as access to technology, still exist – particularly for FE.
IntroductionBeing able to understand the digital landscape of your organisation and be responsive to student and staff needs has never been more important.
1 Schwab, K (2016). The Fourth Industrial Revolution. New York: Crown Business2 Gov.uk (2017). The UK Industrial Strategy. [online]. Gov.UK. Available at: gov.uk/government/topical-events/the-uks-industrial-strategy
(accessed 23 July 2019)3 Gov.uk (2019). Realising the potential of technology in education: a strategy for education providers and the technology industry. [online].
Gov.UK. Available at: gov.uk/government/publications/realising-the-potential-of-technology-in-education (accessed 23 July 2019)4 World Economic Forum. Digital economy and society [online]. WEF. Available at: intelligence.weforum.org/topics/
a1Gb0000001SH21EAG?tab=publications (accessed 23 July 2019)5 The Open University (2019). Bridging the divide [online]. OU. Available at: open.ac.uk/business/bridging-the-digital-divide
(accessed 23 July 2019)6 World Economic Forum (2018). The future of jobs report 2018 [online]. WEF. Available at reports.weforum.org/future-of-jobs-2016/
chapter-1-the-future-of-jobs-and-skills (accessed 23 July 2019)
10%of UK FE and
sixth form colleges
12%of UK
universities and HE institutions
29,531responses
Back to contents page

9
7 Jisc (2018). The potential of education 4.0 is huge – the UK must take the lead [online]. Jisc. Available at: jisc.ac.uk/blog/the-potential-of-education-4-is-huge-the-uk-must-take-the-lead-now-12-sep-2018 (accessed 23 July 2019)
“Digital insights is like a dandelion seed head – the seeds go off in many different directions and the outputs contribute to many different activities, services and teams.”
Rob Howe, head of learning technology, University of Northampton
We need to do more to support students to develop the digital skills that will help them to thrive in the workplace. We also need to provide and promote health and wellbeing services online. And, in a data-driven world, more can be done to improve students’ understanding of how their personal data is used and how to manage their digital identity. A continuing issue is the disparity between students’ recognition of the importance of digital skills for future employability and how prepared they feel for the workplace. All of these are areas where we can work with the sector.
Our support doesn’t end with the survey results – each year we provide additional briefings on areas of concern and we also interrogate the data in different ways. This year we added key driver analysis, which showed that the single biggest target for improving overall digital teaching and learning satisfaction is providing students with regular opportunities to review and update their digital skills. More information can be found in section 4.
2019 sees equal weight for the teaching staff voice, with the teaching staff insights survey becoming a full part of the insights service. This allows organisations to make a direct comparison between student and staff responses on many questions. This year we also piloted a survey for professional services staff, which will become a full feature of our 2019–20 service. Subscribers running all three surveys will gain a truly holistic perspective on the digital experience they provide.
Finally, many colleges and universities have reflected on the value of using the data gained from their surveys as a conversation starter. Our ambition is that this report encourages more organisations to have these conversations with their students, to work together as partners and to develop a first-class education experience that lives up to the vision and insight of Education 4.07.
Back to contents page
Gender
29,531Responses 45%
591of average
responses per organisation
6%
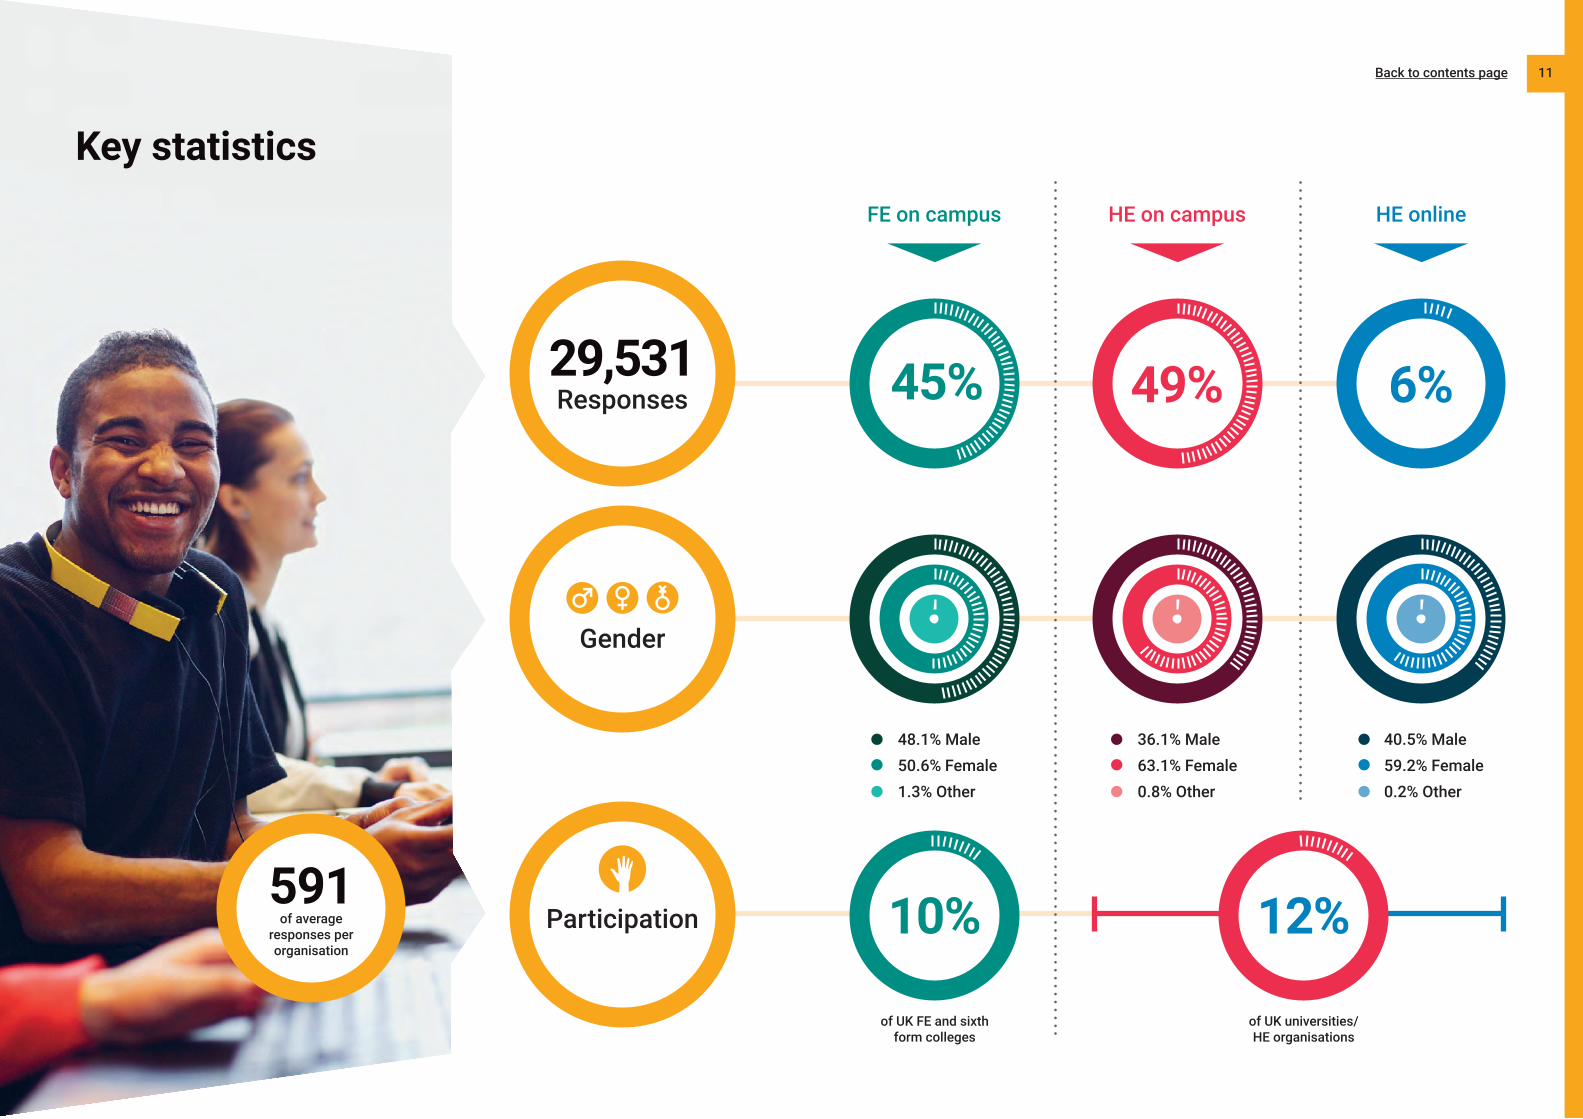
48.1% Male 50.6% Female1.3% Other
36.1% Male63.1% Female0.8% Other
40.5% Male 59.2% Female 0.2% Other
12%10%
FE on campus HE on campus HE online
49%
Participation
of UK FE and sixth form colleges
of UK universities/HE organisations
11
Key statistics
Back to contents page

Summary of student findings and key messages
These tables provide an at-a-glance summary of findings and our key messages across the four themes explored throughout the 2018–19 student digital experience survey. A full analysis of the data for each theme is given in section three.
13Back to contents page

Facts and figures
Theme one: the digital lives of learners
HE students owned and used more devices than FE students to support their learning. More HE than FE students owned a laptop (FE: 65%, HE: 93%). FE students are more likely to own and use a desktop computer. About eight in ten students used a smartphone to support their learning. 5% of FE and fewer than 1% of HE students said that they didn’t own any personal device
72% of HE students used digital tools on a weekly basis to look for additional resources not recommended by their lecturer, compared with 51% of FE students
10% of HE students considered assistive technologies to be vital for their learning needs compared with 6% of FE students. A further 8% of FE students and 9% of HE students said that they chose to use assistive technologies to help them in their studies
Mainstream tools and resources were the most useful assistive technologies for both FE and HE. HE students were more likely to nominate specialist tools designed to support specific learning needs especially for reading, writing and note-making
72%HE
51%FE
“I use the voice memos app to record - my department doesn't record lectures.”
HE student
15
The most popular digital activity for FE students was making notes or recordings – 57% of FE students said they did this on a weekly basis
The most popular digital activity for HE students was accessing lecture notes or recorded lectures – 85% of HE students said they did this on a weekly basis
Our key messages
Lack of ownership/access to technologies limits learning
The disparity between FE and HE students in ownership of, and access to, technologies is noticeable. However, approximately 80% of both FE and HE students have access to smartphones, so ensure all services and resources are mobile optimised.
Consider whether assisted purchase schemes for laptops/tablets will be of greater benefit than loans for the most disadvantaged students and extend loan schemes to allow off-campus use.
BYOD is more than just access to wifi
Facilitating bring your own device (BYOD) benefits both students and organisations – students can use devices familiar to them, customised to meet their needs and available whenever and wherever they choose. Organisations benefit from being able to invest finite resources where they will add most value. Secure storage for personal devices reassures students that their devices will be safe on campus.
BYOD is changing behaviours and expectations. Both FE and HE students want access to course-specialist software on their own (or borrowed) devices and see this as a value for money issue. Consider free/subsidised access to software.
Assistive technology is for everyone
Assistive technologies are vital for many students and a valued choice for many more. Accessibility is becoming ‘built in’ to devices and software although students still need help to realise its potential for their needs. Specific needs aside, making more use of freely available adaptive features could support transition to employment.
Staff confidence is an important enabler
Digital ownership and access are key parts of the equation but being able to use technology effectively to learn is just as important. We know that students are most likely to turn to their tutors for support and this requires staff to be knowledgeable and confident users.
Back to contents page

72% of FE students and 87% of HE students rated their organisation’s digital provision as above average (from ‘good’, ‘excellent’ or ‘best imaginable’). Those universities with above average National Student Survey (NSS) student satisfaction scores also had statistically significant higher mean digital provision ratings (compared to the universities scoring below the NSS satisfaction score)
Theme two: digital in the institution
71% of FE students and 82% of HE students had access to reliable wifi
Both FE and HE students were most likely to turn to lecturers on their course for help in using technology in their learning (FE: 48%, HE: 37%). FE students were less likely than HE students to turn to other students for support (FE: 21%, HE: 26%) and were less likely to use online videos and resources (FE: 12%, HE: 23%)
Analysis of qualitative comments revealed that the top issues for FE students were access to computers on campus, reliable wifi and stable software. For HE students the top issue related to lecture recordings. Students have come to rely on recordings and expect them to be available
There has been a trend towards a significant improvement between last year’s survey and this in the perception that colleges and universities protect student data privacy
When asked about accessing health and wellbeing services online, the average response from HE students was ‘agree’ whereas for FE students it was ‘neutral’
As for whether organisations helped students to stay safe online, the trend was for FE students to agree that they did but for HE students to give a neutral response
61% of FE students and 54% of HE students agreed that their organisation protected their data privacy
70% of HE students agreed that their organisation supported them to use their own digital devices, in contrast to 53% of FE students
Facts and figures
“Improve the range of the college wifi – some places you have amazing signal, others none.”
FE student
17
71% 82%
72%FE
87%HE
HEFE
Get the basics right
While the level of satisfaction with digital in the organisation was generally high there is still room for improvement. Reliable cross-campus access to wifi is essential for flexible learning and this should include student accommodation areas. This dovetails with BYOD requirements such as robust infrastructure and estates provision (eg charging points, appropriate furniture and spaces, secure storage) and clear policies on topics such as safe working practices, GDPR and how to keep own devices up to date.
Provide good quality digital resources
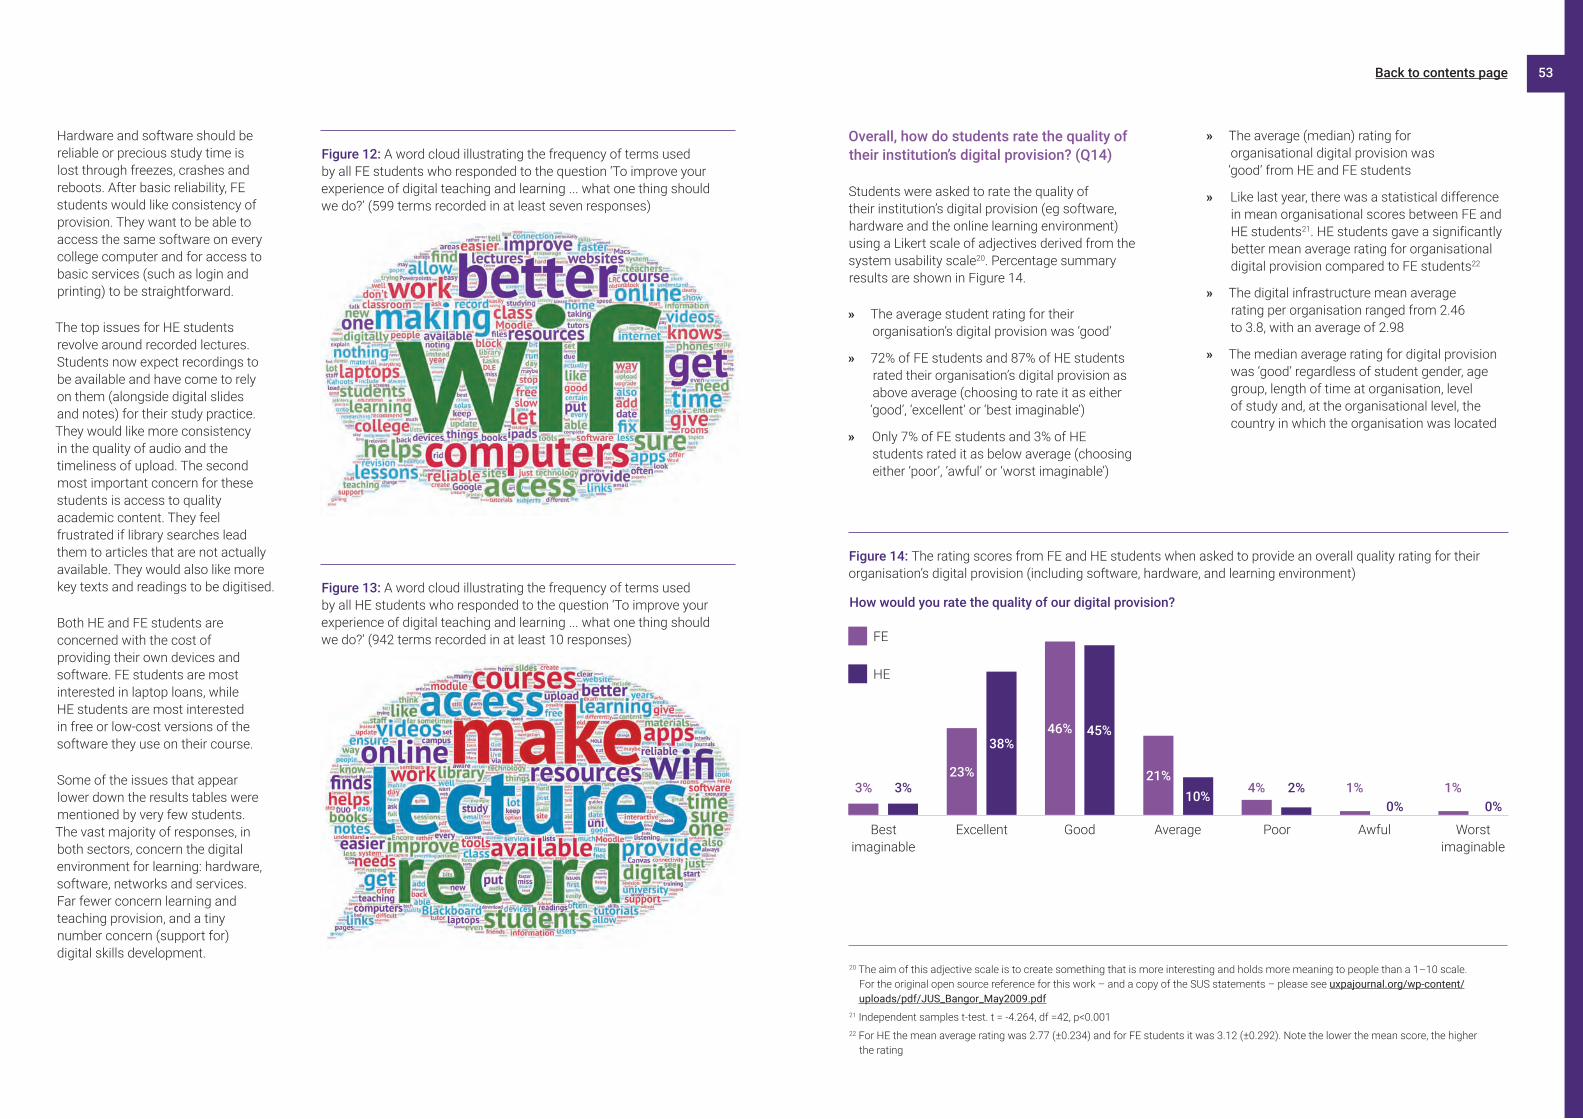
The top issues for HE students revolve around recorded lectures. Students expect these to be available and have come to rely on them (alongside digital slides and notes). They would like more consistency in audio quality and upload timeliness. The second most important concern for these students is access to quality academic content. They feel frustrated if library searches lead them to articles that are not available. They would also like more key texts and readings to be digitised.
Provide a variety of support options and signpost these well
Students rely most on their tutors for support with their use of technology for learning, so it is vital that all staff are sufficiently confident to provide this, know what support is available and can guide users to it (whether online or specialist staff).
Digital student ambassador and champion roles can help students to help each other with digital issues.
Actively promote health, wellbeing and online safety
As last year’s data showed, more needs to be done to promote student health and wellbeing online. Signpost support for all students and ensure issues such as cyberbullying and cybercrime are addressed. Support students with a sense of belonging – their log-ins should give access to personalised services, student societies and social networks. All of this can be put in place prior to arrival.
Our key messages
Back to contents page

HE
FE
Around half of students (FE: 48%, HE: 57%) agreed they could find things easily on their virtual learning environment (VLE). 11% disagreed (both FE and HE). 72% of HE students agreed that they relied on their VLE to do their coursework in contrast to 41% of FE students
“Have more ICT/digital information in induction week. Very few students know how to use the software they end up needing for their course.”
FE student
Only around a third of all students (FE: 34%, HE: 31%) agreed that they were told how their personal data is stored and used. 30% of HE students disagreed with this statement
Theme three: digital at course level
Around a quarter (FE: 29%, HE: 24%) of students never work online with others
Approximately a third of students agreed that they were told what digital skills they would need before their course started (FE: 36%, HE: 29%) but appreciable numbers disagreed (FE: 23%, HE: 36%)
70% of HE students agreed that digital skills were important for their chosen career but only 42% agreed that their course prepared them for the digital workplace – a sizeable 19% disagreed on the latter point. In contrast, 49% of FE students agreed that digital skills were important but 40% agreed that their course prepared them for work –15% disagreed
Facts and figures
57%HE
70% of FE students and 75% of those in HE rated the quality of digital teaching and learning on their course as above average (from ‘good’, ‘excellent’ or ‘best imaginable')
Approximately half of all students were neutral as to whether they would like the VLE to be used more regularly by their tutors (FE: 55%, HE: 49%). 41% of HE and 28% of FE students wanted their tutors to use it more
70%
75%
Only around three in ten FE and HE students agreed that they were given the chance to be involved in decisions about digital services
3 10IN
19
48%FE
40% of FE and 37% of HE students agreed that they had regular opportunities to review and update their digital skills
40%FE
37%HE
Our key messages
Encourage collaboration to emulate business practices
Colleges and universities could do more to promote workplace practices that are valued by employers, such as making collaborative technologies available and building opportunities to experience and practice these in curriculum activities. Assessment approaches should allow for individual recognition within collaborative tasks. Estates provision can support this by providing large monitors with shared working spaces.
Students want to be in control of their own learning progress
Organisations support learner autonomy when they offer students: online access to grades and feedback; clear calendars of assessments and milestones; access to practice questions and other revision materials (eg recorded lectures and notes); and use of e-portfolios.
Diverging approaches to VLEs
FE and HE sectors are diverging in their approach to providing VLE services. In HE there is convergence with institutional portals. In FE, free-standing systems such as Showbie and Google Classroom are widely used.
Embed digital skills through curriculum design
Support students to develop their digital skills prior to study, during induction and throughout their course. Ensure they know what digital skills they need to have
before they start and provide opportunities to develop these online. Familiarise students with the platforms and tools they will use. Ensure digital skills development opportunities are signposted and reinforced throughout their study by embedding these within curriculum design.
Use digital tools and approaches in order to design interactive and engaging curricula activities and assessment, taking advantage of interactive features within VLEs and other learning platforms or apps. Live quizzing and polling are highly valued for making the learning experience interactive and engaging. Recognise and reward the digital skills and knowledge acquired (eg badges, Higher Education Achievement Report, institutional awards).
Raise awareness of the importance of digital skills
Not all students are fully aware of the importance of digital skills within the workplace. Clear articulation and alignment of study and workplace practices throughout learning can help to ensure these skills are recognised and understood.
Courses must include digital skills in an integral way, relevant to the subject of study. The fast pace of digital change means it is more important that students have the skills to learn to use new digital tools and apply existing knowledge to new situations than that they should learn any one specific technology.

Theme four: student attitudes to digital learning
76% of HE students agreed that they could fit learning into their life more easily when digital was used. Only 58% of FE students agreed
Around seven in ten HE and six in ten FE students agreed that when digital was used they understood things better and enjoyed learning more
The majority of students (FE: 54%, HE: 53%) said they would like digital technology to be used to about the same extent on their course as it is now. However, around four in ten FE and HE students would like it to be used more than it is now. Very few said they would like it to be used less on their course
In general, the majority of students in both FE and HE preferred to learn using a mixture of individual and group work (both 54%). A high percentage also stated they preferred to learn on their own (FE: 36%, HE: 43%)
In terms of access to technology, FE students were more likely to prioritise more laptops/tablets being available in class (other choices were ‘more computers in computer rooms’ and ‘more laptops/tablets available on long term loan’)
When asked to select what options would be most useful to learners, FE learners were most likely to choose more interactive polls/quizzes in class (29%), practice questions available online (24%) and course-related videos (21%). The most popular choices for HE students were more practice questions available online (35%), course-related videos (23%) and references and readings (20%). Few students said that time working online with other students was ‘most useful’ (FE: 15%, HE: 8%)
54%
HE FE
4 10IN
Facts and figures
7 10IN
HE6 10IN
FE
Three-quarters of HE and 63% of FE students agreed that they were more independent in their learning when digital was used
“Online workshops and critiquing sessions ahead of the lecture meant I engaged more in class.”
HE student
21
Make it easy for learning to be a part of everyday life
Access to personalised programmes and progress data, along with encouragement to use apps to conduct tasks such as managing time, taking notes and managing references, encourage learner autonomy.
Make learning interactive and engaging
Students are generally happy with the amount of technology that features in their learning but there is demand and potential for more use — for example, participatory learning using mobile phones as voting devices, and use of polling and quizzing software. Online support, course-related videos, practice questions and reinforcement and revision activities
Our key messages
add value and provide opportunities to extend learning. Student expectations are that technology will feature in learning and that not having it is detrimental.
Ensure staff know how to use digital systems and have opportunities and support to develop their digital practices and confidence.
Involve students
Colleges and universities that are working with their students on partnership projects around curriculum innovation and technology are realising the benefits of seeing their students develop not only their digital skills but transferable skills for the workplace such as team working and collaboration.
Back to contents page
Section 2
What is the digital experience insights service?
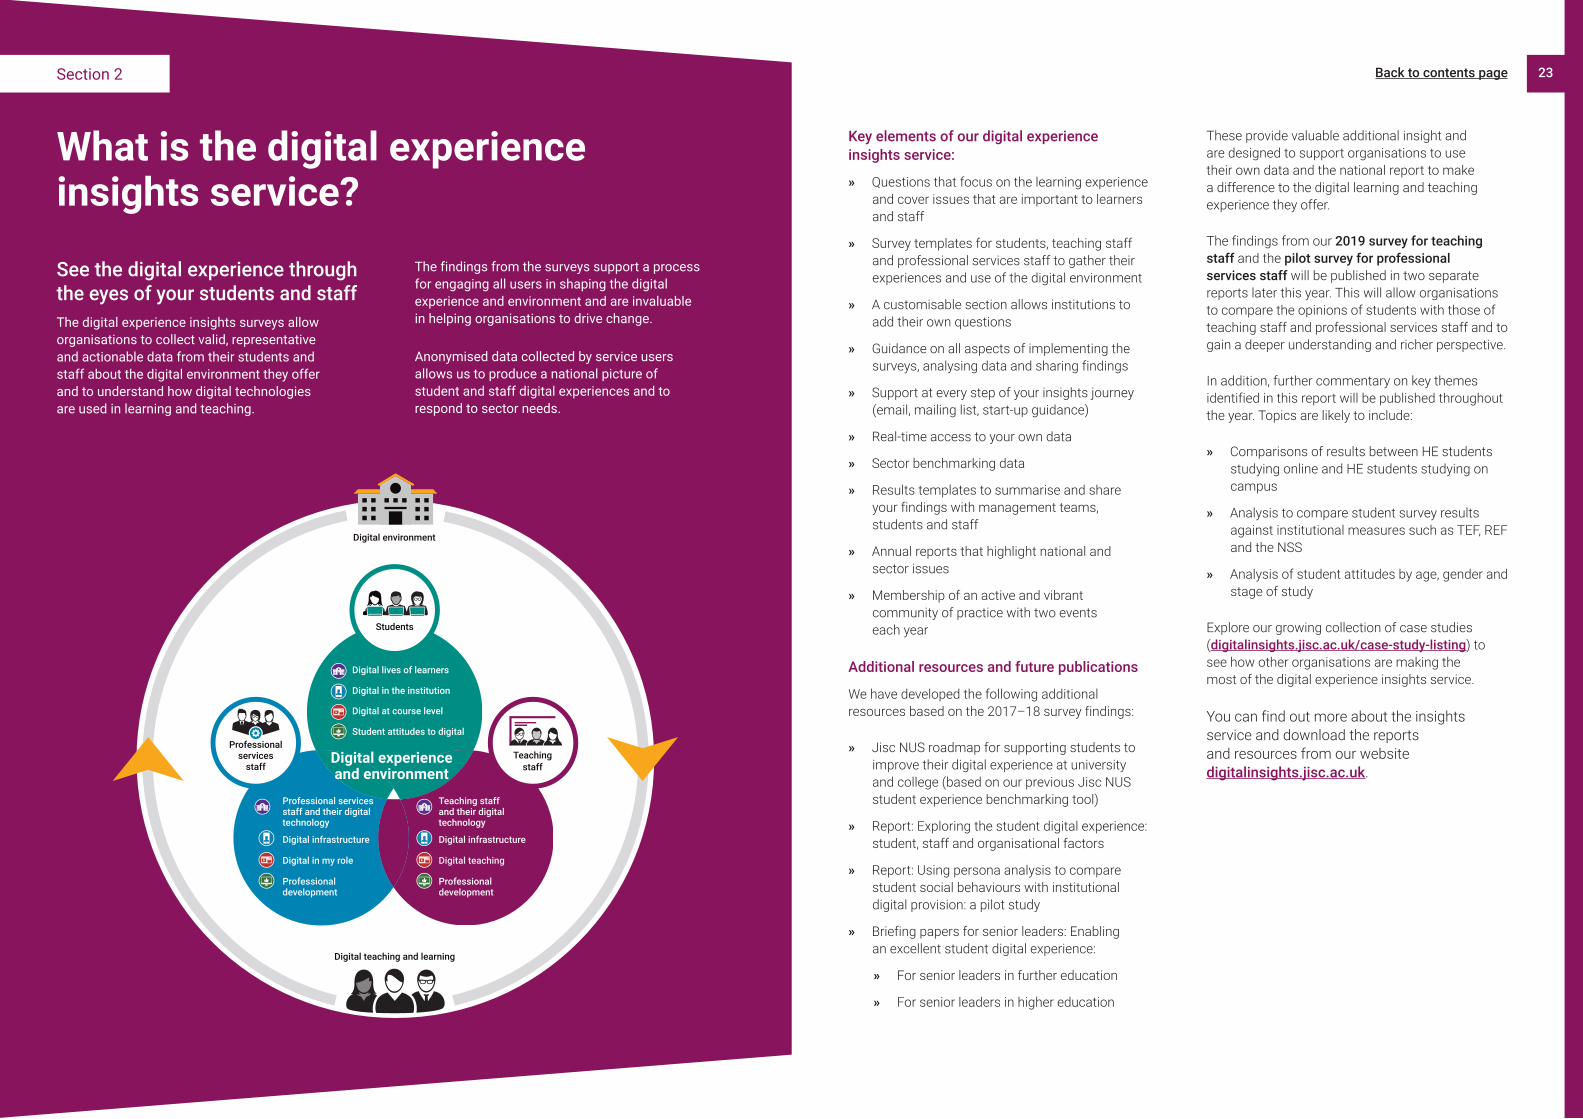
See the digital experience through the eyes of your students and staffThe digital experience insights surveys allow organisations to collect valid, representative and actionable data from their students and staff about the digital environment they offer and to understand how digital technologies are used in learning and teaching.
The findings from the surveys support a process for engaging all users in shaping the digital experience and environment and are invaluable in helping organisations to drive change.
Anonymised data collected by service users allows us to produce a national picture of student and staff digital experiences and to respond to sector needs.
23
Professionalservices
staff
Digital lives of learners
Student attitudes to digital
Digital in the institution
Digital at course level
Professional services staff and their digital technology
Professional development
Digital infrastructure
Digital in my role
Teaching staff and their digital technology
Professional development
Digital infrastructure
Digital teaching
Teachingstaff
Digital experienceand environment
Digital environment
Students
Digital teaching and learning
Key elements of our digital experience insights service:
» » Questions that focus on the learning experience and cover issues that are important to learners and staff
» » Survey templates for students, teaching staff and professional services staff to gather their experiences and use of the digital environment
» » A customisable section allows institutions to add their own questions
» » Guidance on all aspects of implementing the surveys, analysing data and sharing findings
» » Support at every step of your insights journey (email, mailing list, start-up guidance)
» » Real-time access to your own data
» » Sector benchmarking data
» » Results templates to summarise and share your findings with management teams, students and staff
» » Annual reports that highlight national and sector issues
» » Membership of an active and vibrant community of practice with two events each year
Additional resources and future publications
We have developed the following additional resources based on the 2017–18 survey findings:
» » Jisc NUS roadmap for supporting students to improve their digital experience at university and college (based on our previous Jisc NUS student experience benchmarking tool)
» » Report: Exploring the student digital experience: student, staff and organisational factors
» » Report: Using persona analysis to compare student social behaviours with institutional digital provision: a pilot study
» » Briefing papers for senior leaders: Enabling an excellent student digital experience:
» » For senior leaders in further education
» » For senior leaders in higher education
These provide valuable additional insight and are designed to support organisations to use their own data and the national report to make a difference to the digital learning and teaching experience they offer.
The findings from our 2019 survey for teaching staff and the pilot survey for professional services staff will be published in two separate reports later this year. This will allow organisations to compare the opinions of students with those of teaching staff and professional services staff and to gain a deeper understanding and richer perspective.
In addition, further commentary on key themes identified in this report will be published throughout the year. Topics are likely to include:
» » Comparisons of results between HE students studying online and HE students studying on campus
» » Analysis to compare student survey results against institutional measures such as TEF, REF and the NSS
» » Analysis of student attitudes by age, gender and stage of study
Explore our growing collection of case studies (digitalinsights.jisc.ac.uk/case-study-listing) to see how other organisations are making the most of the digital experience insights service.
You can find out more about the insights service and download the reports and resources from our website digitalinsights.jisc.ac.uk.
Back to contents page

“Using Kahoot in class allows us to engage - it creates a good mix of competitiveness and knowledge use.”
FE student
Methodology
The survey template
The digital experience insights surveys for students, teaching staff and professional services staff are delivered and managed in Jisc online surveys (onlinesurveys.ac.uk), an online survey service specially developed for the UK education sector.
The survey template is based around a concise core set of questions that have been intensively tested with students in further and higher education for relevance, readability and ease of response. The questions ask students about issues that are relevant to them as well as their university or college, organised across four themes:
» » Theme one: you and your digital technology
» » Theme two: digital at your institution
» » Theme three: digital on your course
» » Theme four: attitude to digital learning
Three versions of the student insights survey template are available for the following learner groups:
» » FE on campus
» » HE on campus
» » HE online learners
Welsh translations of each version are also available.
The question set
The core question set contains 25 questions (22 for the HE online version). These often have sub-questions making the total number of individual questions a maximum of 66. All questions were optional so that learners could leave questions blank if they did not wish to answer.
We added some new questions for the 2019 student survey in response to user feedback and analysis of the most frequent free text responses from the 2017–18 surveys. These included:
» » Splitting a previous question about stage of course into two separate questions:
» » Q1: How many years have you studied here?
» » Q2: What level is the course you are studying?
» » Q12: the wording of this question changed from ‘who supports you first to use digital technology in your learning?’ to ‘who supports you most to use digital technology in your learning?’
» » Q20: a new question asking which of five activities would be most useful to support student learning ('interactive polls/quizzes in class', 'time working online with other students', 'practice questions available online', 'references and readings' or 'course related videos')
» » Q23: a new question which asked which infrastructure investment would be most useful to students ('more computers in rooms', 'more laptops/tablets in class', or 'more laptops/tablets available on long-term loan')
» » Q24: a new question to ascertain student preferences on use of mobile devices within class ('at any time', 'only to carry out class activities', or 'none of the time')
25
Most questions were locked (ie they were standardised across all insights surveys) to allow benchmark comparisons. One page was customisable so that organisations could add additional questions pertinent to their local needs.
Most of the questions were identical throughout the three versions but some were worded to be relevant to students in a specific sector (eg “my university… “ or “my college…”) while others were only relevant to that specific set of learners (eg non-online learners were asked ‘in class, would you prefer students to be allowed to use their own mobile devices?’).
Response rates
All closed questions had a non-response rate below 3%, other than the four questions about VLEs (Q16) which had an 8% non-response rate (note that for the VLE questions we explicitly asked users to leave them blank if they were unsure). The increase in the use of locally named portals suggests that this question may need to evolve next year.
As in 2017–18, the low non-response rate indicates that the question set is robust overall and that students find it interesting and worth answering.
Back to contents page

Table 2: Learner group descriptions
Insights survey type/learner group Learner group description
FE Learners studying for a qualification that is not a degree, within a FE/sixth form college setting.
HE Learners studying for a degree. Nearly always in a university setting, although some FE colleges offer degree-level courses.
HE online Learners studying via online resources and activities, usually but not always provided by a university. They rarely if ever visit the physical location of the learning provider.
Table 1: The number of each type of learning provider organisation
Learning provider typeNumber of each type involved in this service
University 20
FE college 25
Sixth form college 5
Total 50
27
Participating organisations
A total of 50 organisations ran at least one of the insights survey versions (FE on campus, HE on campus or HE online) and collected at least five responses. Of these 50 organisations, 56% had also taken part in last year’s (2017–18) final pilot.
Thirty were from FE or sixth form colleges and 20 were from HE. This represents participation from approximately 10% of UK FE/sixth form colleges and 12% of UK HE. A list of these organisations can be found in appendix 1 at the end of this report.
The mean average ± standard deviation of respondents was 591 ± 497 per institution. Six of the 50 institutions contributed fewer than 100 responses and nine contributed more than 1,000 (compared to five last year).
We have not included the data from the HE online learner group in this report due to their student experience being very different from on-campus students and because of lower participation rates for HE online students, both as a cohort of organisations and as a population of students. This report focuses only on FE and HE on-campus learner groups. We hope to look at the HE online learner group in a later briefing paper.
We have included all learners who used the surveys in Tables 1 to 5 to provide an overview of survey service users. This is then restricted to the main target sample population of on-campus FE and HE students (not HE online students) from Table 6 onwards and in the report itself.
The smallest FE or sixth form college had 1,600 students; the largest had 26,590. On average, participating colleges had a mean ± standard deviation of 6,536 ± 5,353 students (full and part time).
The smallest participating university had 2,255 students in total; the largest had 29,725. On average, participating universities had a mean ± standard deviation of 17,754 ± 7,612 students (full and part time).
On average, universities collected responses from around 5% of their total student population, while FE and sixth form colleges collected responses from around 7% of their total student population.
Some used more than one version of the survey and, as a result, there is not a one-to-one relationship between the organisational type (Table 1) and the insights survey versions used (Table 2).
Back to contents page

Table 7: A comparison of the total number of HE students across the four UK nations against the insights sample (note nation of student is based on where their organisation is located, not where they live)
Total HE student population11
HE insights survey 2017–18
Total HE student population12
HE insights survey 2018–19 Observation
England 81.6% 69.4% 81.6% 57.2% Insights data over-represents Scotland, as well as Northern Ireland and under-represents England
Scotland 10.4% 23.0% 10.5% 32.2%
Wales 5.7% 5.8% 5.6% 5.6%
Northern Ireland 2.4% 1.8% 2.3% 5.0%
Table 6: A comparison of the total number of FE students across the four UK nations against the insights sample (note nation of student is based on where their organisation is located, not where they live)
Total FE student population9
FE insights survey 2017–18
Total FE student population10
FE insights survey 2018–19 Observation
England 81.4% 78.6% 77.8% 80.1% Insights data over-represents Northern Ireland and Wales and under-represents Scotland
Scotland 5.8% 13.7% 11.6% 0.0%
Wales 6.0% 6.0% 5.4% 11.7%
Northern Ireland 6.8% 1.7% 5.2% 8.2%
UK nationNo of responses % responses
No of organisations
England 19,262 68.0% 39
Scotland 4,744 16.8% 3
Wales 2,523 8.9% 4
Northern Ireland 1,822 6.4% 3
Total8 28,351 100% 49
Participating students
Providers chose how they recruited student participants, with guidance from the service team.
For the student-level analysis we treated the entire population of responses from each sector as a sample in its own right. We then investigated how representative it is likely to be of the sector overall by comparing the sample with national student data. The proportion of student responses broken down by age, gender, nation where student studies and level of course are summarised in Tables 6, 7, 8 and 9.
Is our sample representative?
The Higher Education Statistics Agency (HESA) estimates that the UK HE population size is in the region of 2.3 million and the Department for Education (DfE) estimates UK FE student numbers (traditional and vocational qualifications, excluding apprenticeships) at 2.1 million.
Table 3: The number of student responses and participating organisations per UK nation (note nation of student is based on where their organisation is located, not where they live)
Table 4: The number of organisations and student responses per insights survey learner version. Note that an organisation can run more than one type of insights survey, hence the total (62) exceeds the total number of organisations who took part this year (50)
Table 5: The number of student responses per organisational setting
29
8 Excludes providers who are based in more than one UK nation
» » When we look at data across the four nations of the UK, the FE student data in this report over-represents students in Northern Ireland and Wales and under-represents those in Scotland (Table 6)
» » The HE data in this report over-represents students in Scotland, as well as Northern Ireland and under-represents those in England (Table 7)
» » Data for age, gender and level of course (HE only for latter) was compared for England only, as we could only obtain reliable HE and FE data for England, and because HE courses outside
of England run for four years, not three (which impacts on variables such as age)
» » In comparison with English national FE student data, our insights data over-represents FE students aged 18 or under (Table 8)
» » This HE insights data slightly over-represents females in comparison with males, slightly over-represents postgraduate taught (PGT) and slightly under-represents undergraduate students but is a good reflection of the age categories (Table 9)
9 Including sixth form colleges (only found in England) but not apprenticeships. Department for Education for England, Statistics Wales, Department of Economics for Northern Ireland and individual college accounts for Scotland – 2016–17
10 Including sixth form colleges (only found in England) but not apprenticeships. Department for Education for England, Statistics Wales, Department of Economics for Northern Ireland and individual college accounts for Scotland – 2017–18
11 HESA 2016–1712 HESA 2017–18
Organisational setting
No of responses % responses
Insights versions used across the organisational group
University 15,962 54.1% HE, HE online
FE college 11,118 37.6% FE, HE
Sixth form college
2,451 8.3% FE, HE
Total 29,531 100%
Insights survey type/learner group
No of organisations
No of responses % responses
FE on campus 30 13,389 45.3%
HE on campus 24 14,525 49.2%
HE online 8 1,617 5.5%
Total 62 29,531 100%
Back to contents page

Table 9: A comparison of the national English HE student data for age, gender and level of course in comparison with the insights sample
Total HE student population in England15
HE insights survey 2017–18
Total HE student population in England16
HE insights survey 2018–19 Observation
Age
18 and under 11.7% 10.8% 11.8% 9.5% Good reflection of UK age categories
19–24 59.9% 63.9% 60.6% 62.7%
25+ 28.4% 25.3% 27.6% 27.7%
Gender
Male 42.9% 34.5% 42.7% 36.1% Sample over-represents females
Female 57.0% 64.8% 57.2% 63.1%
Other 0.0% 0.7% 0.1% 0.8%
Level of course
Foundation 1.8%
Question not asked
1.7% 4.4% Sample over-represents foundation and PGT and under-represents undergraduate students
Under-graduate 77.9% 77.7% 72.2%
Post-graduate taught
20.3% 20.7% 23.4%
“Make us more aware of reliable sources we can use and recommend study and revision tools.”
HE student
Table 8: A comparison of the national English FE student data for age and gender in comparison with the insights sample. This includes students studying in sixth form colleges
31
13 Including sixth form colleges (only found in England) but not apprenticeships. 2016–1714 Including sixth form colleges (only found in England) but not apprenticeships. 2017–1815 HESA 2016–1716 HESA 2017–18
Total FE student population in England13
FE insights survey 2017–18
Total FE student population in England14
FE insights survey 2018–19 Observation
Age
18 and under 43.0% 73.8% 41.0% 77.5% Sample over-represents 18 and under
19–2457.0%
16.9%59.0%
14.6%
25+ 9.3% 8.0%
Gender
Male No centralised FE college data source available
49.9% No centralised FE college data source available
48.1% No comparable data
Female 48.6% 50.6%
Other 1.5% 1.3%
Uses and limitations of this data
This report contains a question-by-question summary of all the further and higher education student-level data. The purpose of doing so is to allow all student voices to be heard.
The data is not weighted to match the national student population (eg by age, gender or level of course) and therefore we advise against comparing at the level of individual percentage points across the years, especially as the questions and answer options have evolved through the course of time.
Additionally, different organisations have taken part in the survey year-on-year, so we advise against making direct comparisons across the years, even when the question wording is exactly the same (see section 4 for more information). A more valid use of these findings would be to compare the experiences of further versus higher education students in this specific year.
In order to compare between sectors and organisational groups the data was grouped by organisations and analysed statistically. This allowed robust comparisons between institutional variables (eg National Student Survey (NSS) or Teaching Excellence Framework (TEF) rating of universities).
Charts and tables in this report may have totals that do not add up to 100%. This is due to rounding.
Back to contents page

What the data tells us: question-by-question analysis
34 Theme one: the digital lives of learners
62 Theme four: student attitudes to digital learning
54 Theme three: digital at course level
46 Theme two: digital in the institution
Section 3
33Back to contents page

FE
FE
FE
Do students use assistive technologies to meet their learning needs (and if ‘yes’ has their institution provided support in their use)? (Q5 & Q6)
Students were asked whether they used assistive technologies to meet their learning needs (eg screen readers, voice recognition, switches). They could choose to answer ‘yes (vital)’, ‘yes (optional)’ or ‘no’. Percentage summary results are shown in Figure 1. For those that said ‘yes’, they were then asked if their organisation provided them with any support with assistive technologies (Figure 2).
» » 10% of HE students considered assistive technologies to be vital for their learning needs, with a further 9% saying that they chose to use assistive technologies to help them
» » 6% of FE students considered assistive technologies to be vital to their learning needs, with a further 8% saying that they chose to use assistive technologies to help them
Of those who reported needing or choosing to use assistive technology, 76% of FE and 67% of HE said that their organisation provided support to use them. 24% of FE students and 33% of HE students said they were not supported.
Figure 1: The percentage of FE and HE students who said that they used assistive technologies to meet their learning needs
Do you use any assistive technologies to meet your learning needs? (eg screen readers, voice recognition, switches)
FE
HE
Yes, vital to meet my learning needs
Yes, optional choice
No
6% 10% 8%
86%
9%
81%
Figure 2: The percentage of FE and HE students who said their organisation provided them with any support with assistive technologies or, conversely, did not
If YES, has your [university/college] provided you with any support with assistive technologies?
FE
HE
Yes No
76%67%
24% 33%
35
Theme one: The digital lives of learners
HE students owned and used more devices than FE students to support their learning
Laptops 65% 93%HE
Desktops 41% 28%HE
Smartphone 79% 86%HE
Back to contents page

» » Read&Write (Gold)
» » Screen tints & overlays
» » Google Docs» » MS Word» » Dragon» » Screen reader» » Speech-to-text» » Spelling tool» » Read/write
tool (other)» » Google
Translate» » Typing tool
Figure 3: A word cloud illustrating the frequency of terms used by all FE students who responded to the question ‘Please give an example of any assistive technologies, apps or adaptations that you've found useful' (304 different terms appeared in two or more responses)
Figure 4: A word cloud illustrating the frequency of terms used by all HE students who responded to the question ‘Please give an example of any assistive technologies, apps or adaptations that you've found useful' (487 different terms appeared in two or more responses)
37
What assistive technologies, apps or adaptations do students find useful? (Q7)
This free text question was shown only to students who responded ‘yes’ to the question about whether they used assistive technologies to support their learning, either optionally or out of necessity. Of course, not all of these students chose to provide a response.
There were 1,319 responses to this question from FE students and 2,139 responses to this question from HE students. After functionally meaningless terms such as ‘etc’ were excluded and misspellings were aggregated, 304 (FE) and 487 (HE) different terms appeared in two or more responses. The word clouds here illustrate the frequency of the terms used by FE students [Figure 3] and HE students [Figure 4] to describe the digital apps and tools they used to support their learning needs.
Table 10: The relative importance of themes identified by FE students when asked ‘what assistive technologies, apps or adaptations do students find useful?’ Two themes (‘device’ and ‘read/write’) are further explored below in two pullout tables that list typical sub-themes within the coded main themes
» » Computer» » iPad» » Laptop» » Phone» » Pen» » Voice recorder» » Pen reader» » Mac (other)» » Camera» » Microphone» » Tablet
“I use Sonnocent Sonocent Audio Notetaker, Encore recordings which record lectures to be accessed at a later date: these are CRUCIAL.”
HE student
HE students were more likely to nominate specialist tools that are designed to support specific learning needs. However, mainstream tools and resources dominated both sets of responses, no doubt because adaptive functions are included in most devices and software. This does not mean that students were not receiving support: some described support they had received to set up the adaptive functions in software they already had.
Responses were coded using context searches for clarification, and groups of terms were coded wherever possible. Coded categories were reaggregated to provide a manageable number of themes and of items within themes.
The themes of ‘device’ and ‘read/write’ are pulled out and appear in the two Table 10 pullouts to illustrate the diversity within these categories. Some students who expanded on their responses described adaptive functions of software such as MS Word or their smartphone. This explains why MS Word is included as read/write support rather than simple productivity software. However, with devices such as computers and iPads, students who expanded on their response were likely to say that it was the availability of the device that supported their access to learning rather than any of its specific functions.
Tool type Count % responses
Device 463 35.1
VLE 258 19.6
Read/write 206 15.6
Quizzing 58 4.4
Learning resources 56 4.2
Design/creative 46 3.5
Online search 43 3.3
Student app/portal 32 2.4
Productivity 30 2.3
Study support 15 1.1
Collaboration 12 0.9
File management 9 0.7
Note making 7 0.5
Back to contents page

FE students (%) HE students (%)
Desktop computer 41% 28%
Laptop 65% 93%
Tablet/iPad 33% 33%
Smartphone 79% 86%
Printer 45% 52%
None of the above 5% 0%
Tool type Count % responses
Read/write 858 39.6
Device 491 22.6
VLE 341 15.7
Student app/portal 183 8.4
Note making 150 6.9
Study support 145 6.7
Lecture recording 131 6.0
Library service 101 4.7
Productivity 95 4.4
Learning resources 64 3.0
Design/creative 51 2.4
Data analysis 35 1.6
Assistive software 29 1.3
Time management 22 1.0
Referencing 21 1.0
Online search 20 0.9
Quizzing/polling 12 0.6
Collaboration 7 0.3
Communication 5 0.2
Table 11: The relative importance of themes identified by HE students when asked ‘what assistive technologies, apps or adaptations do students find useful?’ One theme (‘read/write’) is further explored below in a pullout table that lists typical sub-themes within the coded main theme
» » Dragon» » Read&Write (Gold)» » Screen reader» » Text reader» » ClaroRead» » Speech to text» » Sonocent
(not NoteTaker)» » Screen tints/
overlay» » Inspiration» » Voice recognition
(general)
» » DAISY books» » Grammarly» » Dictation software» » Dyslexia software» » Google Voice» » Spellchecker» » Google Translate» » Text/font functions» » MS Voice assistant» » Writing (general)» » MS ReadAloud » » Global AutoCorrect» » Grammar checker
39
library. Again, the absence of this category in FE may be because a wider variety of terms are used for the relevant service (learning support, learning hub, learning resources etc). Devices are less important to HE than to FE students, presumably because HE students are generally less dependent on their organisation to provide one.
The strong attachment HE students show for lecture recording (see Q9) carries over to this question. Careful context searching found that about half of the responses coded as ‘lecture recording’ referred to official recordings (1.9% of all responses), and about half referred to the practice of making personal recordings (1.8%). However, the number of students personally recording lectures is
Table 11 shows the percentage of responses by HE students coded to each theme. Note that the percentage scores do not add up to 100% because items rather than responses were coded (so some responses yielded more than one item), and because some responses did not reference any tools or apps. For example, 39 responses referred to advice and guidance offered and six to adjustments such as extra time in exams. These have not been included.
The HE responses include a category of ‘assistive software’ (not further defined). It may be that this is a term used in HE and not in FE. ‘Library’ was also added as a coding category to represent the number of HE students citing support from the
likely to be larger than 1.8% as some responses coded to ‘note making’ and ‘read/write’ could also have been interpreted this way. Most of the extended comments on this topic asked for lecture recording to be standard across departments and courses.
The theme of ‘read/write’ is pulled out again in the Table 11 pullout to illustrate the diversity within this category. This and 'note making' together accounted for more than 46% of all HE responses, suggesting that support for different approaches to writing and reading was the most significant way that digital technology was giving HE students better access to learning.
17 The mean average per institution was calculated and then an independent samples t-test was used to test mean difference between FE and HE institutions (t-test=3.109, df =33.96, p<0.005).
Which of these personally owned devices do students use to support their learning? (Q8)
Students were asked which of five types of device they own and use to support their learning. They could tick more than one choice. Percentage summary results are shown in Table 12.
» » The average number of digital devices personally owned and used for learning was slightly higher for HE than for FE students and this difference was statistically significant17, with a mean of 2.94 (± 0.13) for HE students and 2.73 (± 0.31) for FE students
» » 30% of HE and 28% of FE students owned and used four or more personally owned devices
» » 5% of FE and less than 1% of HE students said that they didn’t own any personal device
» » FE learners owned and used more desktop computers than HE students (FE: 41%, HE: 28%)
» » HE students owned more laptops, with more than nine out of ten HE students owning and using laptops during their learning (FE: 65%, HE: 93%)
» » One third of FE and HE learners owned and used tablets or iPads to support their learning
» » About eight out of ten FE and nine out of ten HE students used their personal smartphones to support their learning
Table 12: The percentage of students who said they owned and used each of the named devices to support their learning (can tick more than one choice)
Back to contents page

Figure 5: The percentage of FE students who said that they used digital tools or apps to complete the following activities, either 'weekly or more, 'monthly or less, or 'never'
Figure 6: The percentage of HE students who said that they used digital tools or apps to complete the following activities, either 'weekly or more, 'monthly or less, or 'never'
Manage links or references
46% 32% 22%
Manage links or references
64% 26% 10%
Organise your study time
41% 32% 28%
Organise your study time
52% 25% 23%
Make notes or recordings
57% 27% 17%
Make notes or recordings
69% 19% 12%
Look for additional resources not recommended by your lecturer
Look for additional resources not recommended by your lecturer
51%
72%
34%
23%
15%
5 %
4 %
Access lecture notes or recorded lectures
47% 30% 23%
Access lecture notes or recorded lectures
85% 11%
41
FE students
HE students
Weekly or more
Weekly or more
Monthly or less
Monthly or less
Never
Never
18 Statistical differences found between all FE versus HE institutional medians and distributions around the median, as identified using a Kruskal-Wallis test. In all cases df=1 and p<0.005, except for ‘making notes and recordings’ where there was no statistical difference between HE versus FE (df=1, p>0.05).
“I find it useful to film evidence of my practical skills to review later.”
FE student
How often do students use digital tools or apps in their own learning time? (Q9)
Students were asked how often they used digital tools or apps to carry out five named learning activities, and they could answer ‘weekly or more’, ‘monthly or less’ or ‘never’ (Q9). Percentage summary results are shown in Figure 5 and Figure 6.
» » HE students used digital tools or apps more frequently than FE students across all five named activities, except for ‘making notes and recordings’, where there is no statistical difference in the institutional medians between HE and FE18
» » For FE students the most common weekly activity was making notes or recordings (57%)
» » For HE students, the most common weekly activity was accessing lecture notes or recorded lectures (85%). In comparison only 47% of FE students said they accessed lecture notes or recorded lectures on a weekly or more basis
» » The use of digital tools or apps to organise study time was the lowest scoring activity in both groups of learners
Back to contents page

Tool type Count % responses
VLE 2259 24.2
Online research 1457 15.6
Learning resources 862 9.2
Device 785 8.4
Quizzing 760 8.2
Read/write 737 7.9
Note making 334 3.6
Study support 283 3.0
Productivity 247 2.6
File management 223 2.4
Design/creative 129 1.4
Time management 122 1.3
Student app/portal 118 1.3
Reference 56 0.6
Collaboration 52 0.6
e-portfolio 25 0.3
Data analysis 15 0.2
Figure 7: A word cloud illustrating the frequency of terms used by all FE students who responded to the question ‘please give an example of a digital tool or app you find really useful for learning’ (183 terms found in 10 responses or more)
Figure 8: A word cloud illustrating the frequency of terms used by all HE students who responded to the question ‘please give an example of a digital tool or app you find really useful for learning’ (284 terms found in 13 responses or more)
Table 13: The relative importance of themes identified by FE students when asked ‘please give an example of a digital tool or app you find really useful for learning?’ The theme of ‘learning resources’ is further explored in a pull-out that lists typical sub-themes within the coded main theme
» » YouTube» » BBC Bitesize» » Website (general
+ revision)» » iLearn» » Websites
(course related)» » Course notes» » PowerPoint
(slides)
» » Resources (general)
» » Seneca» » Google Books» » e-books/
textbooks» » Kahn Academy» » GCSE Pod» » BBC other» » Library resources
43
What digital tool or app do students find really useful for learning? (Q9a)
In an optional free text question, students were asked to nominate a useful digital app or tool that they used in their own learning time. 9,322 FE and 11,821 HE students answered this question.
Figure 7 shows the weighted word count of terms used by FE students when describing useful digital apps and tools used in their own learning time. There were 183 terms found in ten responses or more.
Figure 8 shows the weighted word count of terms used by HE students when describing useful digital apps and tools used in their own learning time. There were 284 terms found in 13 responses or more.
Responses were coded using context searches for clarification then groups of terms were coded within those searches. Coded categories were reaggregated to provide a manageable number of themes and items within themes.
Around 50% of FE students used Google either on its own or in combination with the word ‘search’ to mean ‘carry out a Google search’. Almost all the other FE Google responses referred to Google Classroom. The figure for Google search among HE students was less than 25%. Google Scholar and the Google suite of shared tools (Docs, Slides etc) were slightly more often cited than Google searches. The remaining uses of ‘Google’ among HE students varied considerably, referencing for example, Google Books, Earth and Translate.
Table 13 shows the number and percentage of responses from FE students coded to each theme. Note that the percentage scores do not add up to 100% because items were coded, so some responses yielded more than one item, while items appearing in fewer than ten responses (0.1%) were excluded because of the difficulty of coding less familiar apps with any accuracy. Including some responses that did not refer to digital tools but did, for example, refer to learning spaces, the proportion of student responses not coded is around 5%.
The category of student app/portal is not always easy to distinguish from the category of VLE as some colleges provided students with a single portal into all of their services, often using a local name.
The theme of ‘learning resources’ is pulled out in greater detail to explore the diversity of responses, and to make some related comments.
Online research by FE students overwhelmingly involves general searching. Most ‘Google’ references (excluding Google Classroom) were unqualified, and from other evidence we concluded that the vast majority referred to generic searches. Google Scholar is not widely used. There were only ten references to library services, though these have been coded to learning resources. One theme (learning resources) is further explored in a pull-out that lists typical sub-themes within the coded theme of ‘learning resources’ as several clearly meant a collation of links rather than a catalogue for searching. Four responses mentioned online journals but this was below the threshold for coding.
However, FE students made good use of learning resources on public websites and on their own college sites.
Back to contents page

Table 14: The relative importance of themes identified by HE students when asked ‘please give an example of a digital tool or app you find really useful for learning?’ The theme of ‘online research’ is further explored in a pull-out that lists typical sub-themes within the coded main theme
» » Library search general
» » Google Scholar» » Google search» » Internet search
general» » JSTOR» » Chrome» » Nelson» » Westlaw
» » Starplus» » Summon» » Database search» » PubMed» » Safari» » Solar» » WorldCat» » Kortext» » Web of Science
45
so if these codes were reaggregated to, for example, ‘producing text’, they would make up the largest category.
‘Online resources’ was used as a code in preference to ‘learning resources’ (used in FE), as context showed these were not provided to HE students but accessed by them, though that could have been after a course recommendation. The provided digital resources that HE students appreciated for their learning were mainly recorded lectures and other resources associated with lectures, such as slides and notes.
‘Online research’ in HE is more likely to involve library search facilities or Google Scholar than an open search of the internet. Specialist databases also featured.
Table 14 shows the number and percentage of responses from HE students coded to each theme. Note that the percentage scores do not add up to 100% because items were coded, so some responses yielded more than one item, while items appearing in fewer than 13 responses (0.1%) were excluded because of the difficulty of coding less familiar apps with any accuracy. Including some responses that did not refer to digital tools but did, for example, refer to learning spaces, the proportion of student responses not coded is around 5%.
The top two items were the same as for FE students but, below that, apps for writing, referencing and note-making took up a large percentage of responses. Taken together they accounted for more than 30% of all responses,
“Google Scholar provides great insights into research topics ... It's a fantastic online tool for building independent learning skills.”
HE student
Tool type Count % responses
VLE 2613 22.1
Online research 2083 17.6
Note making 1452 12.3
Read/write 1056 8.9
Reference 1053 8.9
Device 879 7.4
Online resources 859 7.3
Time management 752 6.4
Lecture recording 705 6.0
Study support 370 3.1
Productivity 367 3.1
File management 271 2.3
Student portal/app 245 2.1
Quizzing/polling 240 2.0
Data analysis 155 1.3
Lecture resources (other)
139 1.2
Communication 32 0.3
Collaboration 24 0.2
Design/creativity 19 0.2
A note on social media
An NVivo word search was conducted across free text Q7, Q9a and Q15a, using terms verified from the data as referring to the use of social media (Facebook or WhatsApp or chat or Instagram or Messenger as distinct terms). We found 49 uses of these social media terms in FE, out of a total of 18,670 non-null responses (a rate of 0.26%), compared with 148 (0.63%) for equivalent social media terms in our 2018 survey. We found 83 uses of these terms in HE responses out of 23,809 responses (0.35%) compared with 173 (0.81%) equivalent terms in 2018.
So, very few of our student respondents chose to nominate social media apps or activities as ‘really useful’ this year. The reasons for this may need further exploration – is social media already well embedded? Or perhaps students don’t see social media as part of their learning but part of their personal lives and therefore keep it separate.
“Give us access to our social media so that we can request help from other students if we need it.”
FE student
Back to contents page

47
Any-time access to digital resources and services (Q10)
Students were asked which of six named resources and services they had access to whenever they needed them while at their college or university. They could tick more than one choice. Percentage summary results are shown in Figure 9.
» » There was a trend for both FE and HE students to be more likely to say they had access to online course materials than reliable wifi
» » 82% of HE students and 71% of FE students had access to reliable wifi
» » For FE students, online course materials (73%) and file storage/back-up (52%) were the most available while recorded lectures were the least available (10%)
» » For HE students, online course materials (89%) and e-books and e-journals (79%) were the most available while video-based skills training (16%) was the least available
» » The largest difference between HE and FE students was access to e-books and e-journals (cited by 79% of HE and only 31% of FE students)
» » Six percent of FE students said they had no access to any of the digital resources listed
Figure 9: The percentage of FE and HE students who said that they had access to six types of digital resource/service whenever they needed them (they could tick more than one choice)
Access to institutional digital resources? (can tick more than one)
None of the above
6%
1%
Reliable wifi
71%
82%
Online course materials
73%
89%
e-books and e-journals
31%
79%
File storage and back-up
52%
44%
Recorded lectures
10%
49%
Video-based skills training eg Lynda.com
12%
16%
Theme two: Digital in the institution
FE HE
82% of HE students and 71% of FE students had access to reliable wifi
FE
71%HE
82%
Back to contents page

“Have space for people to use their own devices.”
FE student
Table 15: Investigating the median differences of responses from FE and HE students
49
How much do students agree with statements about access and support from their institution? (Q11)
Students were asked how much they agreed with five statements about various aspects of institutional support and provision. They could choose to agree, stay neutral, or disagree with each. Data is summarised in Figure 10 and Figure 11. Table 15 summarises the median average answer for each setting.
Median average (FE students)
Median average (HE students)
The institution supports me to use my own digital devices
Agree Agree
I can access institutional health and wellbeing services online
Neutral Agree
I can participate in student union/club/society activities online
Neutral Neutral
The institution helps me stay safe online Agree Neutral
My institution protects my data privacy Agree Agree
Figure 10: The percentage of FE students who agreed, had a neutral opinion, or disagreed when asked about various aspects of institutional support and provision
The institution supports me to use my own digital devices
53%
49%
32%
54%
61%
40%
50%
35%
8%
8%
18%
8%
5 %
I can access institutional health and wellbeing services online
I can participate in student union/club/society activities online
The institution helps me stay safe online
The institution protects my data privacy
Agree Neutral Disagree
42%
39%
FE students
Figure 11: The percentage of HE students who agreed, had a neutral opinion, or disagreed when asked about various aspects of institutional support and provision
The institution supports me to use my own digital devices
70%
52%
41%
43%
54%
45%
7%
13%
8%
4 %
I can access institutional health and wellbeing services online
I can participate in student union/club/society activities online
The institution helps me stay safe online
The institution protects my data privacy
Agree Neutral Disagree
26%
40%
49%
43% 3 %
HE students
» » Only just over half (53%) of FE students agreed that their institution supported them to use their own digital devices, in contrast to 70% of HE students
» » Only around half (49% of FE and 52% of HE students) firmly agreed that they could access health and wellbeing services online
» » 61% of FE students and 54% of HE students agreed that their institution protected their data privacy
» » 54% of FE students agreed that their institution helped them to stay safe online in comparison with only 43% of HE students
» » Around a third (32%) of FE students agreed that they could participate in student union/club/society activities online, compared to 41% of HE students
» » Table 15 summarises the average (median) for FE and HE students. There were two clear differences between FE and HE student average responses:
» » When asked about accessing health and wellbeing services online, the average response from HE students was ‘agree’ whereas for FE students it was ‘neutral’
» » When asked whether their institution helped them to stay safe online, the average FE student agreed that they did, whereas the average HE student had a neutral opinion
Back to contents page

51
Where do students go for digital support? (Q12)
Students were asked ‘Who supports you most to use digital technology in your learning?’ and were provided with a list of five options. Percentage summary results are shown in Table 16.
» » The most likely source of digital support for students was lecturers on their course – especially for FE students (FE: 48%, HE: 37%)
» » HE students were more likely than FE students to use online videos and resources for support (FE: 12%, HE 23%)
» » FE students were more likely than HE students to turn to friends and family for digital support (FE: 13%, HE: 9%)
» » HE students were more likely than FE students to turn to other students for digital support (FE: 21%, HE: 26%)
» » ‘Other support staff’ was the least likely support option that FE and HE students said they turned to. This does not mean that students were not contacting support staff at all: they may have contacted support staff after speaking with other students or lecturers first
» » There is a significant difference between HE and FE students19 in terms of who they turned to the most for digital help and support. More FE students chose to go to their tutors than the analysis predicts, and fewer HE students approached lecturers first in comparison to the analysis prediction. FE students used online videos and resources less than would be expected, and HE students more than had been expected
19 df=4, chi-square = 893.24, p<0.001
“Having online tutor time to help with digital aspects would be useful – as an apprentice I am only in for one day a week.”
HE student
Back to contents page
Table 16: The percentage of students who said the following supports them most to use digital technology in their learning
FE students (%) HE students (%)
Other students 21% 26%
Lecturers on my course 48% 37%
Other support staff 6% 5%
Friends and family 13% 9%
Online videos and resources 12% 23% “It's not just about being
unable to attend the lecture, recordings are really helpful when it comes to revising.”
HE student
What should institutions do to improve students’ experience of digital teaching and learning? (Q13)
Students were asked to describe what their institution could do to improve digital teaching and learning. 8,372 FE and 11,269 HE students completed a free text response to this question.
These questions were designed to yield actionable information to participating organisations. As anticipated, students used this opportunity to raise the issues that they most urgently wanted changed. Their answers do not provide a balanced view of their digital experience, nor do they necessarily reveal the issues that would be at the top of students’ priorities at other colleges and universities. The following figures and analysis should be read with these provisos in mind.
Figure 12 shows the 599 terms recorded in at least seven responses (0.09% of all responses) from FE students, weighted according to the frequency with which they appeared.
Figure 13 shows the 942 terms recorded in at least ten responses (0.09% of all responses) from HE students, weighted according to the frequency with which they appeared.
A word search was carried out on each of the top 150 terms to gather meaning in context and to code for broad themes. A reverse search using words associated with each theme was then carried out to identify major sub-themes and short, indicative quotes for each. The results are shown in Appendix 2 (available to download from digitalinsights.jisc.ac.uk) in descending order of frequency (among themes and within themes).
The top issues for FE students were access to computers on campus, wifi reliability and stable software. In practice these issues need to be seen as a whole: FE students want access to a networked computer with the software they need to complete their assignments.
53
Overall, how do students rate the quality of their institution’s digital provision? (Q14)
Students were asked to rate the quality of their institution’s digital provision (eg software, hardware and the online learning environment) using a Likert scale of adjectives derived from the system usability scale20. Percentage summary results are shown in Figure 14.
» » The average student rating for their organisation’s digital provision was ‘good’
» » 72% of FE students and 87% of HE students rated their organisation’s digital provision as above average (choosing to rate it as either ‘good’, ‘excellent’ or ‘best imaginable’)
» » Only 7% of FE students and 3% of HE students rated it as below average (choosing either ‘poor’, ‘awful’ or ‘worst imaginable’)
» » The average (median) rating for organisational digital provision was ‘good’ from HE and FE students
» » Like last year, there was a statistical difference in mean organisational scores between FE and HE students21. HE students gave a significantly better mean average rating for organisational digital provision compared to FE students22
» » The digital infrastructure mean average rating per organisation ranged from 2.46 to 3.8, with an average of 2.98
» » The median average rating for digital provision was ‘good’ regardless of student gender, age group, length of time at organisation, level of study and, at the organisational level, the country in which the organisation was located
Figure 14: The rating scores from FE and HE students when asked to provide an overall quality rating for their organisation’s digital provision (including software, hardware, and learning environment)
How would you rate the quality of our digital provision?
FE
HE
Best imaginable
3% 3%
Good
46% 45%
Excellent
23%
38%
Average
21%10%
Poor
4% 2%
Awful
1%0%
Worst imaginable
1%0%
20 The aim of this adjective scale is to create something that is more interesting and holds more meaning to people than a 1–10 scale. For the original open source reference for this work – and a copy of the SUS statements – please see uxpajournal.org/wp-content/uploads/pdf/JUS_Bangor_May2009.pdf
21 Independent samples t-test. t = -4.264, df =42, p<0.00122 For HE the mean average rating was 2.77 (±0.234) and for FE students it was 3.12 (±0.292). Note the lower the mean score, the higher
the rating
Figure 13: A word cloud illustrating the frequency of terms used by all HE students who responded to the question ‘To improve your experience of digital teaching and learning ... what one thing should we do?’ (942 terms recorded in at least 10 responses)
Figure 12: A word cloud illustrating the frequency of terms used by all FE students who responded to the question ‘To improve your experience of digital teaching and learning ... what one thing should we do?’ (599 terms recorded in at least seven responses)
Hardware and software should be reliable or precious study time is lost through freezes, crashes and reboots. After basic reliability, FE students would like consistency of provision. They want to be able to access the same software on every college computer and for access to basic services (such as login and printing) to be straightforward.
The top issues for HE students revolve around recorded lectures. Students now expect recordings to be available and have come to rely on them (alongside digital slides and notes) for their study practice. They would like more consistency in the quality of audio and the timeliness of upload. The second most important concern for these students is access to quality academic content. They feel frustrated if library searches lead them to articles that are not actually available. They would also like more key texts and readings to be digitised.
Both HE and FE students are concerned with the cost of providing their own devices and software. FE students are most interested in laptop loans, while HE students are most interested in free or low-cost versions of the software they use on their course.
Some of the issues that appear lower down the results tables were mentioned by very few students. The vast majority of responses, in both sectors, concern the digital environment for learning: hardware, software, networks and services. Far fewer concern learning and teaching provision, and a tiny number concern (support for) digital skills development.
Back to contents page

Figure 15: The percentage of FE students who said that they carried out the following digital activities as part of their course teaching and learning, either 'weekly or more', 'monthly or less', or 'never'
Figure 16: The percentage of HE students who said that they carried out the following digital activities as part of their course teaching and learning, either 'weekly or more', 'monthly or less', or 'never'
Work online with others
32% 39% 29%
Work online with others
Create a digital record/portfolio of your learning
31% 36% 33%
Create a digital record/portfolio of your learning
28% 35% 38%
Find information online
84% 2%13%
Find information online
Use an educational game or simulation for learning
21% 40%39%
Use an educational game or simulation for learning
14% 55%31%
Use a polling device or online quiz to give answers in class
23% 31%47%
Use a polling device or online quiz to give answers in class
17% 38%45%
Produce work in digital formats other than Word/PowerPoint
45% 23%32%
Produce work in digital formats other than Word/PowerPoint
36% 30%33%
94% 1%5%
31% 24%45%
55
FE students HE students
» » Perhaps unsurprisingly, 84% of FE students and 94% of HE students searched online for information on a weekly or more basis
» » 40% of FE and 55% of HE students had never used an educational game or simulation for learning
» » Around a quarter (FE: 29%, HE: 24%) had never worked online with others
» » There was a trend for FE students to prefer to produce work in digital formats other than Word/PowerPoint on a weekly or more basis, compared to HE students (FE: 45%, HE: 36%)
As part of their course, how often do students carry out the following digital activities? (Q15)
Students were asked how often they carried out six different named digital activities during their course teaching, and could answer ‘weekly or more’, ‘monthly or less’ or ‘never’. Percentage summary results are shown in Figure 15 and Figure 16.
Theme three: Digital at course level
Weekly or more Weekly or moreMonthly or less Monthly or lessNever Never
Back to contents page

Figure 19: The percentage of FE students who agreed, had a neutral opinion or disagreed when asked about various aspects of their VLE experience
I can easily find things on the VLE
48%
41% 19%
I rely on it to do my coursework
Agree Neutral Disagree
11%40%
40%
I regularly access it on a mobile device
25%35%
28% 17%
I would like it to be used more by my tutors
55%
57
How much do you agree with these statements about your VLE? (Q16)
Students were asked how much they agreed with four statements about their VLE. They could choose to 'agree', remain 'neutral', or 'disagree'. Percentage summary results are shown in Figure 19 and Figure 20.
» » Around half of students (FE: 48%, HE: 57%) agreed that they could find things easily on their VLE. Only around one in ten disagreed (11%)
» » 41% of FE students agreed that they relied on their VLE to do their coursework as opposed to 72% of HE students
» » 61% of HE students accessed their VLE regularly via their mobile in comparison to 40% of FE students
» » The majority of all students were neutral on whether they would like the VLE to be used more regularly by their tutors. About a quarter of FE students (28%) and 41% of HE students wanted their tutors to use the VLE more
FE students
Figure 20: The percentage of HE students who agreed, had a neutral opinion or disagreed when asked about various aspects of their VLE experience
Agree Neutral Disagree
I can easily find things on the VLE
57% 11%31%
I rely on it to do my coursework
72% 6%21%
I regularly access it on a mobile device
61% 16%22%
I would like it to be used more by my tutors
41% 10%49%
HE students
40%
Figure 18: A word cloud illustrating the frequency of terms used by all HE students who responded to the question ‘please give an example of a digital activity you have found really useful on your course’ (559 terms recorded in at least 10 responses)
Figure 17: A word cloud illustrating the frequency of terms used by all FE students who responded to the question ‘please give an example of a digital activity you have found really useful on your course’ (304 terms recorded in at least 8 responses)
What digital activities do students find useful on their course? (Q15a)
Students were asked in a free text question to describe useful digital activities they carried out as part of their course. 8,029 FE students and 9,819 HE students responded to this question. After non-meaningful terms such as ‘use’ and ‘etc’ were excluded and misspellings were aggregated, 304 terms appeared in the FE responses at a level above 0.01% (eight responses). 559 terms were found at a level above 0.01% (ten or more) responses in the HE data. The two word clouds in Figure 17 and Figure 18 show the frequency of the terms used by FE and HE students to describe useful digital activities on their course.
Using the coding frame from the 2018 survey as a starting point, the data was further analysed. The same broad learning activities were used as top-level themes. Activity verbs were added in line with the 2018 coding, and with contextual searching to establish how these terms were being used by students. Digital tools or resources were also added, where they could be associated with one or more of these verbs. In practice there was considerable overlap with 2018, particularly in the verbs used. New student quotes were sought to illustrate each group of learning activities, verbs and tools/resources. Appendix 2 (available to download from digitalinsights.jisc.ac.uk) shows the top-level themes, associated verbs, digital tools and resources, and indicative quotes from the students.
Back to contents page

41%
Figure 21: The percentage of FE students who agreed, had a neutral opinion or disagreed when asked about various aspects of their digital teaching and learning experiences
I am told how my personal data is stored and used
The software used on my course is industry standard and up to date
34%
50%
42%
Online assessments are delivered and managed well
46% 46% 8%
24%
47%
Teaching spaces are well designed for the technologies we use
44% 9%
9%
Agree Neutral Disagree
59
FE students
Figure 22: The percentage of HE students who agreed, had a neutral opinion or disagreed when asked about various aspects of their digital teaching and learning experiences
Online assessments are delivered and managed well
34%60% 7%
The software used on my course is industry standard and up to date
60% 33% 7%
I am told how my personal data is stored and used
31% 39% 30%
Teaching spaces are well designed for the technologies we use
51% 36% 13%
Agree Neutral Disagree
HE students
How does digital provision impact on course experience? (Q17)
Students were asked how much they agreed with four statements about the use of digital activities on their course. They could choose to ‘agree’, remain ‘neutral’ or ‘disagree’. Percentage summary results are shown in Figure 21 and Figure 22.
» » Only around a third of all students (34% for FE, 31% for HE) agreed that they were told how their personal data was stored and used. 30% of HE students disagreed with this statement
» » 46% of FE and 60% of HE students agreed that online assessments were delivered and managed well
» » About half of all FE and HE students agreed that teaching rooms were well designed for the technologies they use
» » 50% of FE and 60% of HE students agreed that the software on their course was industry standard and up to date
“Provide more software keys so we can use the same applications on our own computers as we have at college.”
FE student
Back to contents page
career, only 40% felt their course prepared them for the digital workplace, suggesting that their college may not be meeting their expectations. Indeed, 15% disagreed when asked if their course prepared them for this
» » This difference is even larger for HE students: 70% agreed that digital skills were important for their chosen career yet only 42% said their course prepared them for the digital workplace. 19% disagreed when asked if their course prepared them for this
» » Only 29% of HE and 36% of FE students agreed that they were told what digital skills they would need before their course started
» » 40% of FE and 37% of HE students agreed that they had regular opportunities to review and update their digital skills
» » Only around three in ten FE and HE students agreed that they were given the chance to be involved in decisions about digital services
Do courses support the development of digital skills and awareness? (Q18)
Students were asked how much they agreed with five further statements relating to digital aspects of their course experience and how it helped them to develop digital skills and awareness. They could choose to ‘agree’, remain ‘neutral’, or ‘disagree’.
Percentage summary results are shown in Figure 23 and Figure 24.
» » Only 49% of FE and 70% of HE students thought digital skills were important for their chosen career. This suggests that they are not fully aware of the importance of digital within the workplace, although many FE students were also neutral on the statement, which may indicate ambivalence or uncertainty
» » While around half of FE students agreed that digital skills would be useful in their chosen

Figure 25: The rating scores from students in FE and HE when asked to provide an overall quality rating for the digital teaching and learning on their course
How would you rate the quality of digital teaching and learning on your course?
FE
HE
Best imaginable
4% 3%
Excellent
22%27%
Good
44% 45%
Average
24%19%
Poor
4% 5%
Worst imaginable
1%0%
Awful
1% 1%
61
Overall, how do students rate the quality of digital teaching and learning on their course? (Q19)
Students were asked to rate the quality of teaching and learning on their course, using a Likert scale of adjectives derived from the system usability scale23. Percentage summary results are shown in Figure 25.
» » The average student rated their digital teaching and learning as ‘good’
» » Unlike the rating for organisational digital provision (see Q14), the rating results for quality of teaching and learning from FE and HE students are more similar. 70% of students in an FE setting, and 75% of those in an HE setting rated the quality of digital teaching and learning on their course as above average (choosing to rate it as either ‘good’, ‘excellent’ or ‘best imaginable’)
» » Only 6% of students in FE and HE settings rated the quality of digital teaching and learning as below average (choosing either ‘poor’, ‘awful’ or ‘worst imaginable’)
» » Unlike last year, there was a statistical difference in mean organisational scores between FE and HE students24. HE students gave a significantly better mean average rating for the quality of digital teaching and learning on their course compared to FE students25
» » The digital infrastructure mean average rating per organisation ranged from 2.78 to 3.61, with an average of 3.09
» » The median average rating for the quality of digital teaching and learning on their course is ‘good’ regardless of student gender, age group, length of time at organisation, level of study and at the organisational level, the country in which the organisation was located
Agree Neutral Disagree
Figure 23: The percentage of FE students who agreed, had a neutral opinion or disagreed when asked about various aspects of digital within their course experience
I have regular opportunities to review and update my digital skills
44%40% 16%
45%
My course prepares me for the digital workplace
40% 15%
Before I started my course I was told what digital skills I would need
36% 23%41%
Learners are given the chance to be involved in decisions about digital services
31% 19%49%
Digital skills are important in my chosen career
49% 9%42%
FE students
39%
Agree Neutral Disagree
Figure 24: The percentage of HE students who agreed, had a neutral opinion or disagreed when asked about various aspects of digital within their course experience
I have regular opportunities to review and update my digital skills
39%37% 24%
My course prepares me for the digital workplace
42% 19%
Before I started my course I was told what digital skills I would need
29% 36%35%
27%
Learners are given the chance to be involved in decisions about digital services
29% 45%
Digital skills are important in my chosen career
70% 5 %25%
HE students
23 The aim of this adjective scale is to create something that is more interesting and holds more meaning to people than a 1–10 scale. For the original open source reference for this work – and a copy of the SUS statements – please see uxpajournal.org/wp-content/uploads/pdf/JUS_Bangor_May2009.pdf
24 Independent samples t-test. t = -2.614, df =42, p<0.0525 For HE the mean average rating was 3.01 (±0.164) and for FE students it was 3.16 (±0.217). Note the lower the mean score, the higher
the rating
“Give support to students who may be struggling to understand digital work. I am not a young person and I am unsure what apps exist that could support my learning.”
HE student
Back to contents page

63
Table 17: The percentage of FE and HE students who, when asked which of these choices would be most useful to them as a learner, said more… (can only tick one choice)
Which of these would be most useful to them as a learner? (Q20)
Students were asked which of these choices would be most useful to them as a learner and could only tick one choice. Results are summarised in Table 17.
Theme four:Student attitudes to digital learning
“Online practice quiz helped prepare me for the actual test.”
HE student
FE students preferred more interactive polls/quizzes in class compared to HE students
29% 15%HE
» » The most popular choice for FE students was more interactive polls/quizzes in class (29% of respondents), followed by practice questions available online (24%) and course-related videos (21%)
» » The most popular choices for HE students were more practice questions available online (35%), course-related videos (23%) and references and readings (20%)
» » The least popular choice for FE students was references and readings and for HE it was time working online with other students. In general, time working online with other students was not cited as a high priority by either FE or HE students. Perhaps this explains the finding in Q15 that around a quarter of students (FE: 29%, HE: 24%) never worked online with others
» » There was a trend for FE students to prefer more interactive polls/quizzes in class compared to HE students (FE: 29%, HE: 15%)
» » On the other hand, there was a trend for HE students to prefer practice questions available online, compared to FE students (FE: 24%, HE: 35%)
FE
Back to contents page
Which of these would be more useful to you? FE students (%) HE students (%)
Interactive polls/quizzes in class 29 % 15 %
Time working online with other students 15 % 8 %
Practice questions available online 24 % 35 %
References and readings 11 % 20 %
Course-related videos 21 % 23 %

Figure 27: The percentage of HE students who agreed, had a neutral opinion or disagreed when presented with four positively worded statements about the use of digital within their course experience
I understand things better
69% 28% 3 %
I am more independent in my learning
22%75% 3 %
Agree Neutral Disagree
I enjoy learning more
68% 28% 4 %
I can fit learning into my life more easily
76% 21% 3 %
Do students prefer to learn on their own, in groups, or a mix? (Q22)
Students were asked to describe their preference as a learner for individual versus group work. Results are summarised in Figure 28.
» » In general, the majority of students (54% of both FE and HE) preferred to learn through a mixture of individual and group work. HE students were more likely to want to learn on their own when compared to FE students (FE: 36%, HE: 43%). Conversely, FE students were more likely to want to learn in groups when compared to HE students (FE: 11%, HE: 3%)
» » There is a statistically significant difference26 between HE and FE students in terms of their preferences as learners: more HE students preferred to learn on their own than the analysis predicted, and more FE students preferred to learn in a group than the analysis predicted
When digital technologies are used on my course I … (agreement with positive statements) (Q21)
Students were asked how much they agreed with four positively phrased statements about the use of digital technologies on their course. Percentage summary results are shown in Figure 26 and Figure 27.
» » 75% of HE and 63% of FE students agreed that they were more independent in their learning when digital was used
» » 76% of HE students agreed that they can more easily fit learning into their life when digital was used, but this fell to 58% for FE students
» » 68% of HE and 59% of FE students agreed that when digital was used they enjoyed learning more
» » 69% of HE and 61% of FE students agreed that when digital was used they understood things better
» » There was a trend for more HE students than FE students to agree with all statements
HE students
Figure 26: The percentage of FE students who agreed, had a neutral opinion or disagreed when presented with four positively worded statements about the use of digital within their course experience
I can fit learning into my life more easily
I am more independent in my learning
I understand things better
61% 36% 3 %
58% 36% 6%
I enjoy learning more
59% 36% 5 %
32%63% 4 %
Agree Neutral Disagree
FE students
65
26 Chi square = 673.72, df=2, p<0.001
Back to contents page
“Google Slides helped me learn how to work collaboratively – I feel this is useful for the world of work.”
HE student
Figure 28: The percentage of FE and HE students who said they prefer to learn in a group, a mix of group and individual work or on their own
Which best describes your preferences as a learner?
FE
HE
I prefer to learn on my own
I like a mix of individual and
group work
I prefer to learn in a group
36%43%
54%
11%
54%
3%

How much would you like digital technologies to be used on your course?
Figure 31: The percentage of FE and HE students who said they want digital technologies to be used more, the same or less often than they are now
FE HE
More than they are now
The same as they are now
Less than they are now
42% 44%54%
4%
53%
2%
Figure 30: The percentage of FE and HE students who said they would prefer students to be allowed to use their own mobiles at any time, only to carry out class activities and none of the time in class (can only tick one choice)
In class, would you prefer students to be allowed to use their own mobile devices:
FE HE
At any time Only to carry out class activities
None of the time
51% 48% 45%
3%
47%
6%
Student preferences about the use of mobile devices in class (Q24)
Students were asked for their preferences about the use of mobile devices in class and could only tick one choice. Results are summarised in Figure 30.
In general, the responses for FE and HE students were broadly similar and indicated a strong preference for use of mobile devices.
» » Around half of students (FE: 51%, HE 48%) preferred mobile devices to be used at any time and around half (FE: 45%, HE:47%) preferred only to use mobile devices to carry out class activities
» » There’s a trend for FE students to prefer the use of mobile devices at any time and HE students were split between anytime and only to carry out class activities
» » Very few FE or HE students wanted mobile devices not to be used in class
How much would students like digital technologies to be used on their course? (Q25)
Students were asked how much they would like digital technologies to be used on their course, and could answer ‘more’, ‘same’ or ‘less than now’. Results are summarised in Figure 31.
» » Results from FE and HE students were broadly similar. In general, the majority of students (FE: 54%, HE: 53%) would like digital technology to be used at about the same extent on their course as it is now
» » However, 42% of FE and 44% of HE students would like digital technologies to be used on their course more than is currently used. Very few said they would like digital technology to be used less than it is now
Figure 29: The percentage of FE and HE students who, when asked which of these choices would be most useful to them, said more… (can only tick one choice)
Which of these would be most useful to you?
FE
HE
More computers in computer
rooms
More laptops and tablets available in
class
More laptops and tablets available on
long-term loan
34%43%
48%
17%
32%25%
27 df=2, chi-square = 793.60, p<0.001
67
Availability of desktop computers and laptops (Q23)
Students were asked which of three choices would be most useful to them as a learner in terms of the availability of desktop computers and laptops. They could only tick one choice. Results are summarised in Figure 29.
» » FE students were much more likely to say more laptops and tablets available in class is a priority to them (FE: 48%, HE: 32%)
» » HE students were most likely to say more desktop computers in computer rooms is a priority (FE: 34%, HE: 43%)
» » Both FE and HE students were least likely to say more laptops and tablets available on long-term loan is a priority, although HE students were more likely than FE students to choose this option
» » As FE students were less likely to own a laptop (see Q8) to use in their learning, possibly due to financial constraints, it makes sense that they would want more college laptops/tablets available for free in class rather than on long term loan
» » There is a significant difference between HE and FE students27 in terms of which of the options would be most useful to them. Many more FE students would like additional laptops and tablets available in class than the analysis predicts, and more HE students would like either additional computers in computer rooms or additional laptops and tablets available on long-term loan than had been expected
Back to contents page

“GoogleDocs and EndNote allow us to work together collaboratively.”
FE student
69Back to contents page

Section 4
Additional detailed analysis
71
The full results by question can be found in Appendix 3 and show that for all but one question (which had borderline significance), there was not a statistically significant change in median score between the two years for the 17 organisations.
The question ‘the institution protects my data privacy’ had a borderline statistically significant change in the median score (p=0.083) between the years. This trend towards significance saw three organisations improve in median score from ‘neutral’ to ‘agree’ to the statement (and no change for the rest).
In a one-year period we did not expect organisations to change significantly on the issues represented by the insights questions. It was therefore of interest to note a trend towards significant improvement in the perception that the organisation protects student data privacy. We suggest this could be due to organisations reacting to their insights findings and going for this as a clear quick win by ensuring this was improved, highlighting the usefulness of the insights surveys. Issues surrounding data privacy are a key focus at present, given the recent changes in GDPR regulations, and this may have also had an effect in raising student awareness of data privacy issues.
Next year we intend to look at two-year changes with the same 17 colleges and universities to see if this longer time period allows more statistically significant changes to be identified within the group.
Year-on-year analysis
Being able to track trends for the UK sector as a whole on specific questions in the student insights survey and across different years brings added value. However, from a methodological and statistical perspective, this is problematic in that each year different universities, colleges and students take part so comparisons across the insights surveys over different years would mean that we are not comparing like with like.
In an attempt to overcome this issue we compared a subset of organisations who completed the student insights survey both this year and last and also had a minimum response rate of 37028.
The subset consisted of 17 organisations (with an approximate balance from FE and HE) and the list on which we based our year-on-year analysis can be found in Appendix 3 (available to download from digitalinsights.jisc.ac.uk). This ensured that any comparison of scores on specific questions were made between the same organisations across both years (but with the caveat that they will not have been the same students across both years). The questions compared across both years can also be found in Appendix 3.
28 Representing the response needed to reflect the views of a population sized 5,000+ in both years, assuming a 95% confidence level and 5% margin of error
What drives student satisfaction with digital teaching and learning?
Over the past three years we have investigated ways to interrogate the insights survey data using advanced analysis methods. The aim has been to provide useful and actionable information to UK colleges and universities. This has involved factor analysis (to corroborate the integrity of the survey instrument and identify the relative importance of themes in describing the student digital experience) and persona analysis (to investigate the digital behaviours and opinions of students in terms of digital persona types).
In 2019 we have included key driver analysis (KDA), more commonly used in private sector companies to investigate customer satisfaction and identify the areas to focus on to improve the overall satisfaction score.
The insights surveys contain two student satisfaction scores, the first rating the quality of institutional digital provision (Q14) and the second rating digital teaching and learning (Q19). For this analysis we focused on the latter.
As well as a measure of overall student satisfaction with digital teaching and learning, the survey questions gathered student opinions about a variety of specific aspects of digital teaching and learning experience and delivery. Together, these questions can be used – via KDA analysis – to investigate which aspects of the digital teaching and learning experience are most important in driving overall student digital teaching and learning satisfaction.
We identified 12 variables (all questions within the student insights survey) which we felt might influence the overall student digital teaching and learning satisfaction score.
The KDA analysis identified their relative importance, as summarised in Figure 32. From this we can conclude that the two most influential questions in terms of influencing a student’s digital teaching and learning satisfaction were:
» » My course prepares me for the digital workplace (agreement question)
» » I have regular opportunities to review and update my digital skills (agreement question)
Back to contents page

73
29 n=10,429 students with data available for all relevant questions
Figure 32: The relative importance of various aspects of digital teaching and learning in terms of their influence on a student’s overall digital teaching and learning satisfaction score
My course prepares me for the digital workplace (agreement)
I have regular opportunities to review and update my digital skills (agreement)
Teaching spaces are well designed for the technologies we use (agreement)
The software used in my course is industry standard and up to date (agreement)
Online assessments are delivered and managed well (agreement)
Use a polling device or online quiz to give answers in class (frequency)
Use an educational game or simulation for learning (frequency)
Produce work in digital formats other than Word/PowerPoint (frequency)
Create a digital record/portfolio of your learning (frequency)
Work online with others (frequency)
I can easily find things on the VLE (agreement)
Access to online course materials and recorded lectures
22.5%
17.54%
13.77%
12.49%
11.48%
2.39%
1.84%
1.47%
0.92%
8.45%
5.79%
1.29%
Bett
er
Figure 33: The performance of 12 variables relating to the student digital teaching and learning experience, and their relative importance in driving overall student (digital teaching and learning) satisfaction ratings
-2
Perf
orm
ance
My course prepares me for the digital
workplace
Use an educational game or simulation for learning
Online course plus recorded
lectures
Use a polling device or online quiz to give answers in class
Create a digital record/portfolio of your learning
Produce work in digital formats other than Word/PowerPoint
I can easily find things on the VLE
Teaching spaces are well designed for the technologies we use
Online assessments are delivered and managed well
I have regular opportunities to review and update my digital skills
The software used on my course is industry standard and up to date
Work online with others
Important and highly rated Important but poorly rated
Not important and poorly rated Not important but highly rated
Wor
se
The two least important were:
» » Work online with others (frequency question)
» » Produce work in digital formats other than Word/PowerPoint (frequency question)
KDA analysis then allows us to identify which variables are performing well at a national level and which are underperforming. These low performing variables represent the areas where actions to improve the student experience will have the biggest impact on overall digital teaching and learning student satisfaction and generate the greatest improvement in student satisfaction for any effort expended.
For this report we have focused our detailed analysis only on data from HE undergraduate students29. We hope to carry out further analysis on FE students in the future. The results are plotted in Figure 33, which shows the variables displayed across four quadrants. The most important part of this chart is the lower right quadrant. The items plotted there have primary importance to students (in terms of influencing their overall digital teaching and learning score) but the national data shows that, at present, organisational performance in those areas is low (ie they are ‘performing’ poorly). Variables falling in the bottom left quadrant are also performing poorly but are of secondary importance to students when choosing their digital teaching and learning score.
In contrast, variables falling within the top right quadrant are of primary importance and performing well, and variables in the top left quadrant are of secondary importance and also performing well.
Back to contents page
ImportanceMoreLess
3
2
0
-1
1
-2 20-1 1

75
Figure 34: The length of time students aged 18 and under have studied at their institution, by FE and HE
Length of time students 'aged 18 and under' have studied at their institution, by FE and HE
FE
HE
Less than 1 year
59%
95%
1 to 2 years
36%
5%
2 to 3 years
5% 1%
More than 3 years
0%
30 ANOVA f=1.96, df=2, p>0.05 31 ANOVA f=4.75, df=2, p<0.01 (pairwise Tukey ’18 and under’ vs other age groups, p<0.01)32 ANOVA f=1.11, df=2, p>0.0533 ANOVA f=6.47, df=2, p<0.01 (pairwise Tukey ’18 and under’ vs ’19–21’, p<0.01 and ’18 and under’ vs ’22 and over’, p<0.05)34 df=3, chi-square = 685.17, p<0.001
It may be that for HE students in this age group, the vast majority being new to their institution, may be more impressed with the digital provision and highly rate the quality of their digital teaching and learning. In comparison, FE students in the same age category may have been at their institution for a longer period (possibly in their second year by now) and may be less impressed with their digital provision and digital teaching and learning than they were when they first started.
Although these appear to be non-institutional specific issues, it’s still important for individual organisations to be aware of, even if there is little they can do about it. Further analysis of the student insights survey will be needed to explore these findings in more detail.
For FE students there was no effect of the age category on the average organisational digital provision rating scores (Q14) of students30. In contrast, younger HE students were shown to have significantly more positive satisfaction with organisational digital provision31.
Age category had no effect on the opinions of FE students32 when it comes to satisfaction ratings for the quality of digital teaching and learning (Q19). However, younger HE students were significantly more positive in their rating of digital teaching and learning than older HE students33.
We assumed that this might not be due to age in itself but instead due to the length of time students aged 18 and under have been at their institution (see Figure 34). The differences in length of time at their institution and whether they were FE or HE students (aged 18 or under) were statistically significant34.
The age categories used were the same for both FE and HE students. Nearly all students aged 18 and under within HE will have been studying for less than one year, as the earliest age students usually start HE is around 18. However, students in FE can start as early as 14 (16 most usual), so within the category ’18 and under’ there will be more students who have been at their college for a longer period.
Back to contents page
The analysis suggests that the following aspects of HE undergraduate student digital teaching and learning are currently performing poorly in comparison with the other variables. These are given in order of relative importance:
1. I have regular opportunities to review and update my digital skills
2. Teaching spaces are well designed for the technologies we use
3. The software used on my course is industry standard and up-to-date
4. Online assessments are delivered and managed well
5. I can easily find things on the VLE
Given the national picture, we suggest that organisational efforts to improve student digital teaching and learning satisfaction scores for HE are focused on these five areas.
Note: this represents the overall picture using national HE undergraduate data and only includes the factors measured in the insights student survey. Other issues may, of course, also be important in driving student digital teaching and learning satisfaction, but have not been measured within this survey. We recommend that organisations consider carrying out KDA at a local level in order to see whether their dataset follows this national summary, or whether the variables are of a different relative importance within their institution.
Comparing attitudes by student age
We have investigated whether student age has a significant effect on responses to the two seven-point scale attitudinal questions (Q14 and Q19) from the student insights survey. The hypothesis is that a student’s age does influence how they score on questions of rating organisational digital provision and how they rate the quality of digital teaching and learning on their course. A fuller briefing paper will look at this in more detail, with a wider range of questions.
The age variable was recoded into three categories (see Appendix 3, available to download from digitalinsights.jisc.ac.uk). Mean scores for all age categories, by FE and HE, for Q14 and Q19 can also be found in Appendix 3.

77
Comparing attitudes by gender
We have looked at whether gender has a significant effect on responses to the two seven-point scale attitudinal questions (Q14 and Q19) from the student insights survey. The hypothesis is that certain gender groups may be more excluded from the digital environment in their organisations compared to others and may give lower rating scores to the two attitudinal questions. Note that the gender category ‘other’ was excluded from the analysis due to its small sample size. A fuller briefing paper will look at this in more detail, with a wider range of questions.
As before, mean scores for all gender groups, by FE and HE, for Q14 and Q19 can also be found in Appendix 3 (available to download from digitalinsights.jisc.ac.uk).
For FE students, women were shown to have a significantly more positive satisfaction rating compared to men in relation to their organisational digital provision35. In contrast, for HE students there was no effect of gender on the average organisational digital provision rating36.
When it comes to satisfaction ratings for the quality of digital teaching and learning (Q19), gender had no effect on the opinions of FE students37. However, for HE students, men were shown to have a significantly more positive satisfaction rating compared to women in relation to how they rated the quality of their digital teaching and learning38.
It’s difficult to say whether these significant differences are organisational or whether they are societal in relation to gender (or both). Again, further analysis of the student survey will be needed to explore these findings in more detail.
35 ANOVA f=30.57, df=2, p<0.001 (pairwise Tukey ‘male’ vs ‘female’, p<0.001)
36 ANOVA f=7.19, df=2, p<0.01 (pairwise Tukey ‘male’ vs ‘female’, p>0.1)
37 ANOVA f=26.42, df=2, p<0.001 (pairwise Tukey ‘male’ vs ‘female’, p>0.1)
38 ANOVA f=17.32, df=2, p<0.001 (pairwise Tukey ‘male’ vs ‘female’, p<0.001)
Back to contents page
39 Source – NSS 2018. Average NSS score for group was 84.2%40 Source – REF 2014. Average REF GPA score for group was 2.71 41 Source – HESA 2017–18. It is calculated by taking the total income from all sources for the university and dividing it by the total number
of students (headcount) in the same year. Average income per student for group was £13,823.8942 Source HESA 2014–15 and 2015–16 (1st year students only) (from Guardian league table 2019). The HESA continuation rate is a measure
of the percentage of students predicted to complete their year and move onto the next year of study. Average score for group was 90.6%.43 Independent samples t-test, t = -2.357, df=14, p<0.05
Comparing attitudes by range of HE organisational measures
The average score was taken for a range of organisational measures and, for HE only, organisations were placed in either of two categories (‘above the HE group average’ and ‘below HE group average’). This was to test the hypothesis that organisations that score well at certain national organisational performance measures will also have students who will also rate organisations more highly on the two attitudinal measures (Q14 and Q19).
These organisational measures were:
» » NSS (National Student Survey) overall satisfaction39
» » REF (Research Excellence Framework) GPA (Grade Point Average) score40
» » Institutional total financial income per student41
» » Student continuation rates42
An independent samples t-test was carried out to see if there was any significant difference in mean ratings for the two attitudinal questions (Q14 and Q19) between the two organisational groups created (‘above the HE group average’ and ‘below HE group average’) for the range of organisational measures listed above. Mean differences can again be found in Appendix 3 (available to download from digitalinsights.jisc.ac.uk).
There was no statistically significant difference in the mean average rating for either Q14 or Q19 between groups who were above and below average in relation to REF GPA, total income per student or student continuation rates (all p>0.05). However, there was a statistical difference in the mean average rating for Q14 between the two groups (but not for Q19). The group of organisations with an above average NSS overall satisfaction score had students who gave a higher rating when asked to rate their organisation’s digital provision43.
It is possible that the NSS overall student satisfaction measure and the insights ‘student digital satisfaction’ measure are two different ways of measuring what is essentially the same thing: a single overarching measure of overall student experience. So improving digital provision could be seen as a component of improving overall student satisfaction as measured by the NSS. Briefing papers to look into this in greater detail will be published in 2020.

Section 5
Appendix 1Our thanks to the following organisations that took part in the Jisc digital experience insights student survey 2018–19 and collected at least five responses from students between September 2018 and April 2019:
» » Aberystwyth University
» » Barton Peveril Sixth Form College
» » Belfast Metropolitan College
» » Bexhill College
» » Bishop Burton College
» » Bishop Grosseteste University
» » Bradford College
» » Canterbury Christ Church University
» » Carmel College
» » Cheadle and Marple Sixth Form College
» » Chesterfield College
» » City of Sunderland College
» » City of Wolverhampton College
» » City, University of London
» » Coleg Gwent
» » Cranfield University
» » DN Colleges Group
» » Exeter College
» » Fareham College
» » Furness College
» » Grimsby Institute of Further and Higher Education
» » Harlow College
» » John Leggott Sixth Form College
» » Lakes College West Cumbria
» » Lincoln College
» » Newham Sixth Form College
» » Northern Regional College
» » Oldham Sixth Form College
» » Open University
» » Pembrokeshire College
» » Petroc
» » RNN Group
» » Tameside College
» » The City Literary Institute
» » The Sheffield College
» » The University of Sheffield
» » Ulster University
» » University of Aberdeen
» » University of Derby
» » University of Durham
» » University of Glasgow
» » University of Hertfordshire
» » University of Huddersfield
» » University of Northampton
» » University of Portsmouth
» » University of Salford
» » University of South Wales
» » University of Stirling
» » University of Westminster
» » Wiltshire College
Appendices 2 and 3 can be downloaded from digitalinsights.jisc.ac.uk.
Back to contents page 79

Jisc is a registered charity (number 1149740) and a company limited by guarantee that is registered in England under Company No. 5747339, VAT No. GB 882 5529 90. Jisc’s registered office is: One Castlepark, Tower Hill, Bristol, BS2 0JA. @jiscjisc.ac.uk
Acknowledgements
Our thanks go to our expert panels of further and higher education representatives who assisted us in shaping this report, to John McConnell for his advice regarding the KDA and to Caitlin Bloom for assistance in sourcing national demographic and collating organisational data. We are grateful to students and staff at City of Wolverhampton College and the University of Northampton for photographs used in this report. We would also like to thank all the colleges and universities who took part in the student insights survey this year.