Jim Lloyd_2007 Educational Value Added Assessment System (EVAAS) Phase 2 Presentation.
51
Jim Lloyd_2007 Educational Value Added Assessment System (EVAAS) Phase 2 Presentation
-
Upload
priscilla-flynn -
Category
Documents
-
view
218 -
download
0
Transcript of Jim Lloyd_2007 Educational Value Added Assessment System (EVAAS) Phase 2 Presentation.
Jim Lloyd_2007
Educational Value Added Assessment System (EVAAS)
Phase 2 Presentation
Learning OutcomesUnderstand the difference between
achievement and growthUnderstand how teachers can have an effect
on growth varianceUnderstand that growth data is displayed in
various methodsAnalyze student value added dataBegin to consider how you could apply/use
value added data in order to leverage student growth
Value Added 101It is very complicated statistical procedure
to measure student growth, but it is highly reliable and valid.
It’s not meant to be a hammer or stick to prove that people are not doing their jobs. It’s another data tool to help us improve.
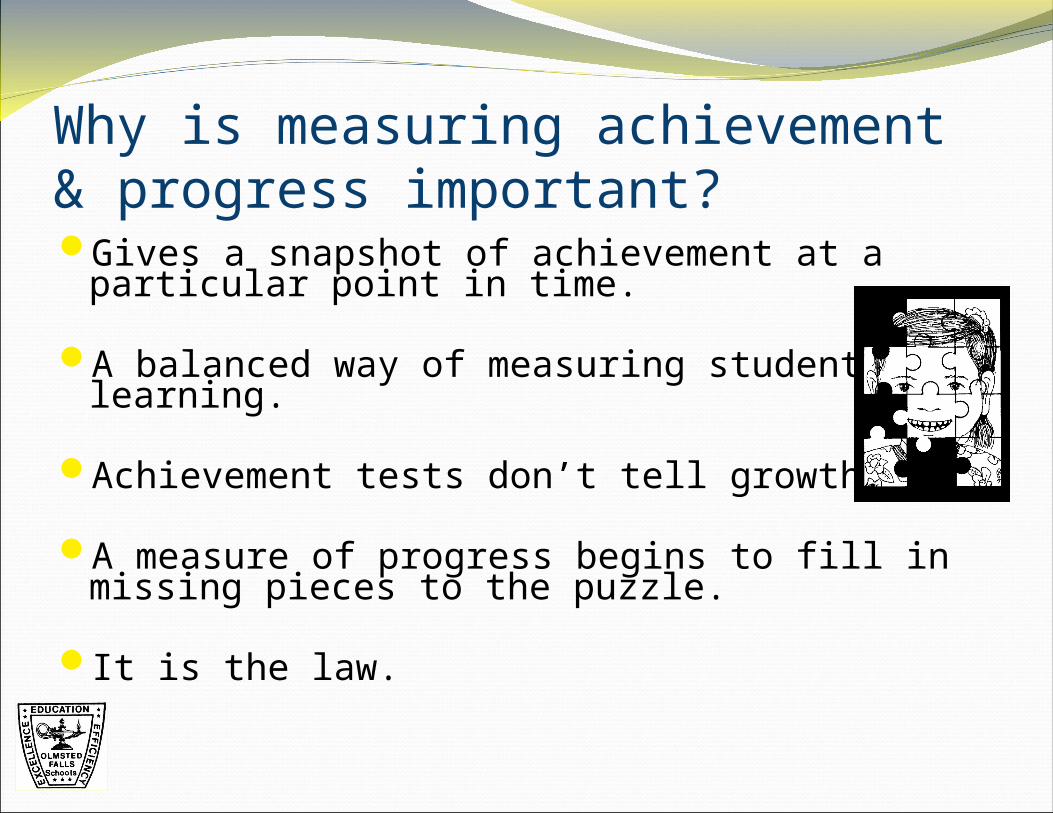
Why is measuring achievement & progress important?Gives a snapshot of achievement at a
particular point in time.
A balanced way of measuring student learning.
Achievement tests don’t tell growth.
A measure of progress begins to fill in missing pieces to the puzzle.
It is the law.
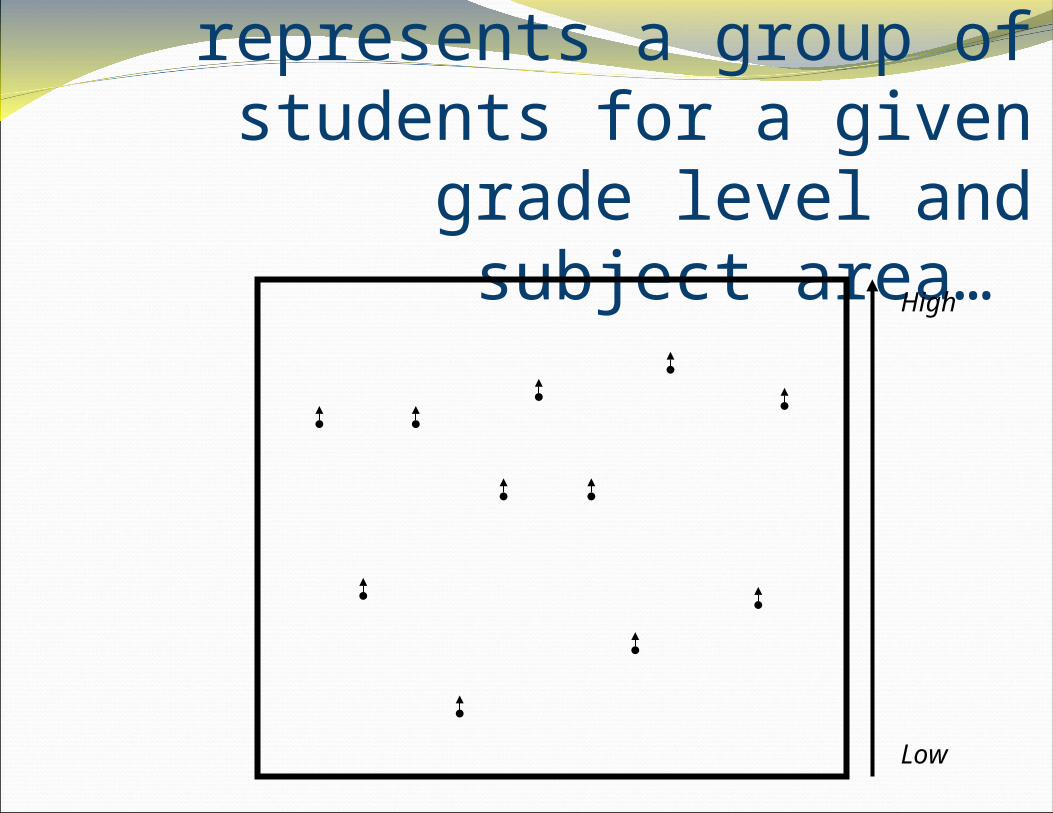
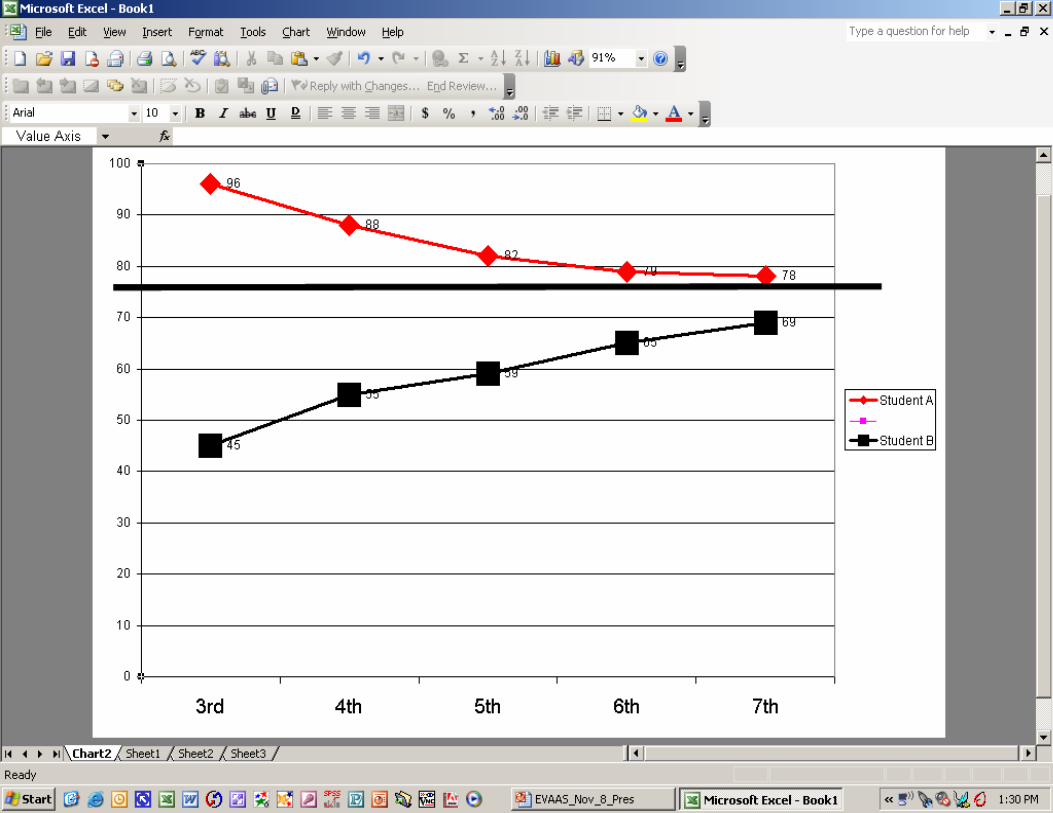
Suppose this box represents a group of students for a given
grade level and subject area…
Low
High
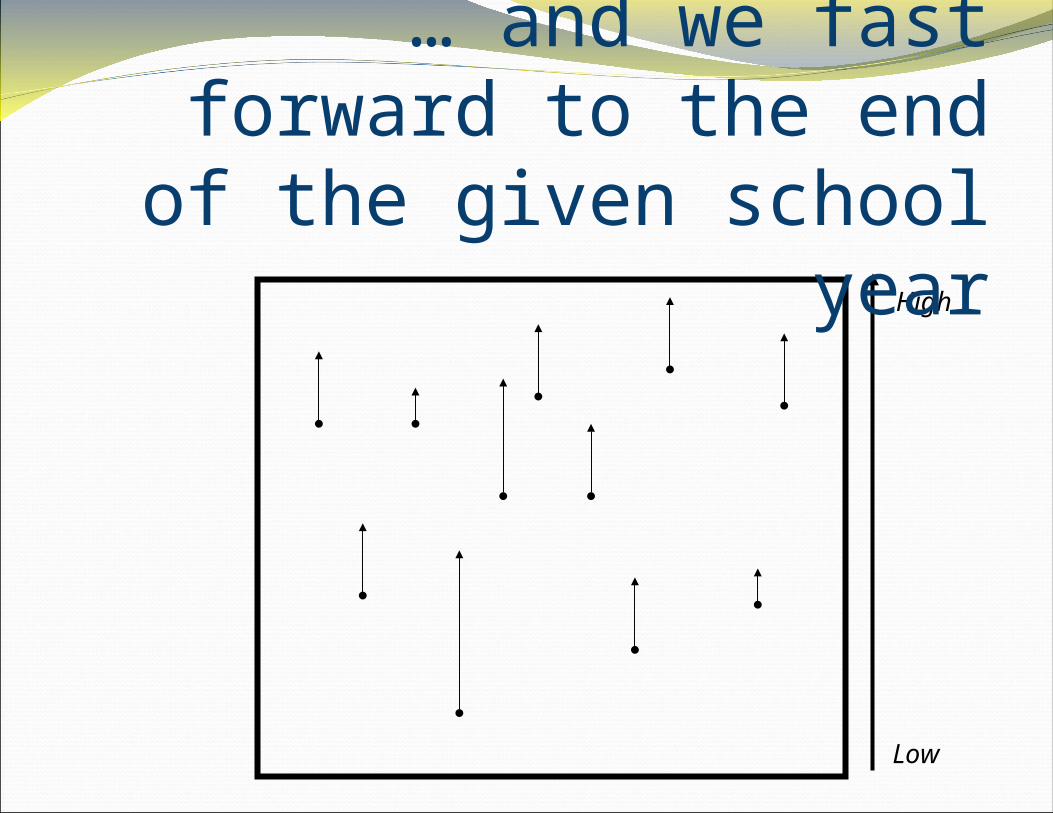
High
Low
… and we fast forward to the end of the given school year
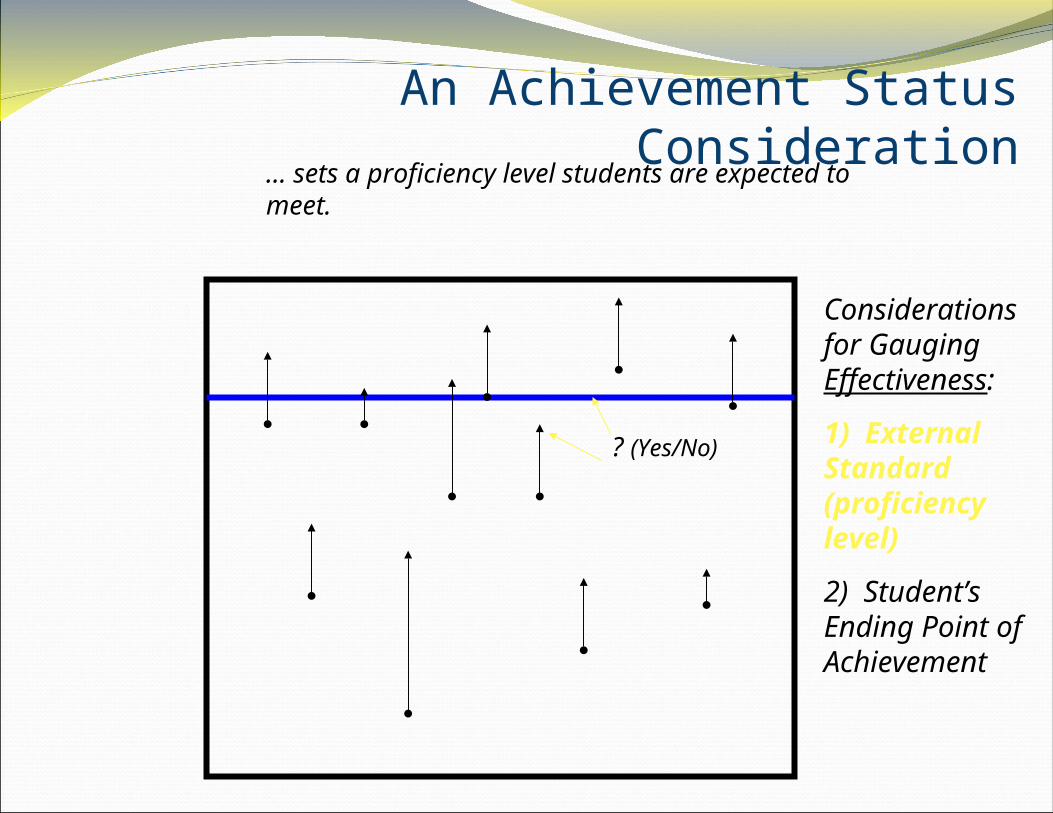
An Achievement Status Consideration
Considerations for Gauging Effectiveness:
1) External Standard (proficiency level)
2) Student’s Ending Point of Achievement
? (Yes/No)
… sets a proficiency level students are expected to meet.
Teacher Effects

Factors related to student learning - District, School, and Teacher Influence
on Student ProgressFollowing inferences were shared at the
Governors Education Symposium (2004)
Based on 22 years of Value-Added Study, Dr. Sanders draws the following conclusions:
Variation in student academic progress can be attributed this way:
5% attributed to District quality
30% attributed to School quality
65% attributed to Teachers quality
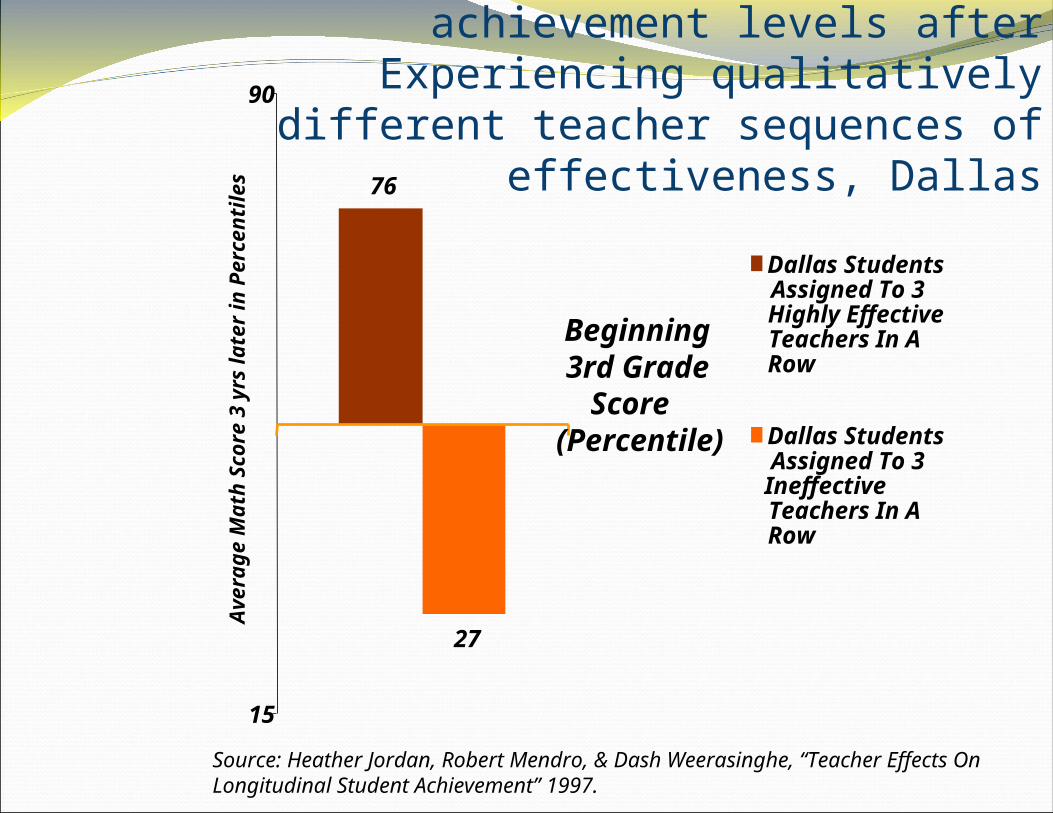
Difference in student achievement levels after Experiencing qualitatively different teacher
sequences of effectiveness, Dallas
Source: Heather Jordan, Robert Mendro, & Dash Weerasinghe, “Teacher Effects On Longitudinal Student Achievement” 1997.
76
27
15
90
Beginning 3rd Grade
Score (Percentile)
Ave
rag
e M
ath
Sco
re 3
yrs
late
r in
Per
cen
tile
sDallas StudentsAssigned To 3Highly EffectiveTeachers In ARow
Dallas StudentsAssigned To 3IneffectiveTeachers In ARow
Rivers (1999)Can varying sequences of teacher quality
vary student chances of passing a high stakes test? o Rivers (1999) followed students from 4th through 9th grade
from two large urban districts.
o Students were grouped into quartiles on the basis of achievement on the 4th grade standardized test.
o Math teachers were identified for grades 5-8 and were linked to effectiveness levels (Low, Avg, High), based on their success in facilitating value-added achievement with a prior group of students.
o Do these quality distinctions apply to another cohort of students and offer reliable information about how a student will do on a high stakes in the future?
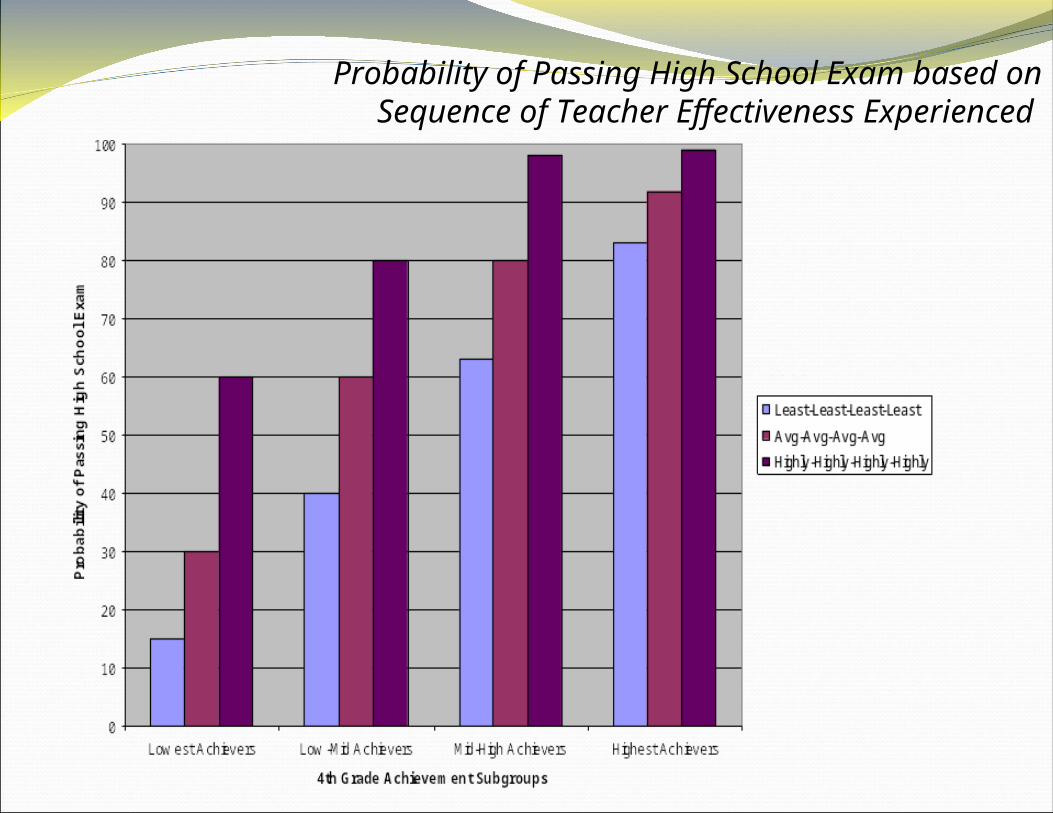
Probability of Passing High School Exam based on Sequence of Teacher Effectiveness Experienced
Jim Lloyd_2006
How is value added different than what we’re currently doing?
Current system measures only achievement (what percentage of kids pass the test).
New system measures progress towards the standard, so can more accurately reflect the growth of ALL students, especially those who may be hard-pressed to ever reach the passing rate.
Jim Lloyd_2006

How will this help me as an educator?Measures growth from
where the student enters the grade level.
Measures progress at building/grade levels.
Shows if programs/instruction are impacting student growth.
Aligns classroom resources to help all.
Jim Lloyd_2006
EVAAS
How to view a summary report
Jim Lloyd_2006
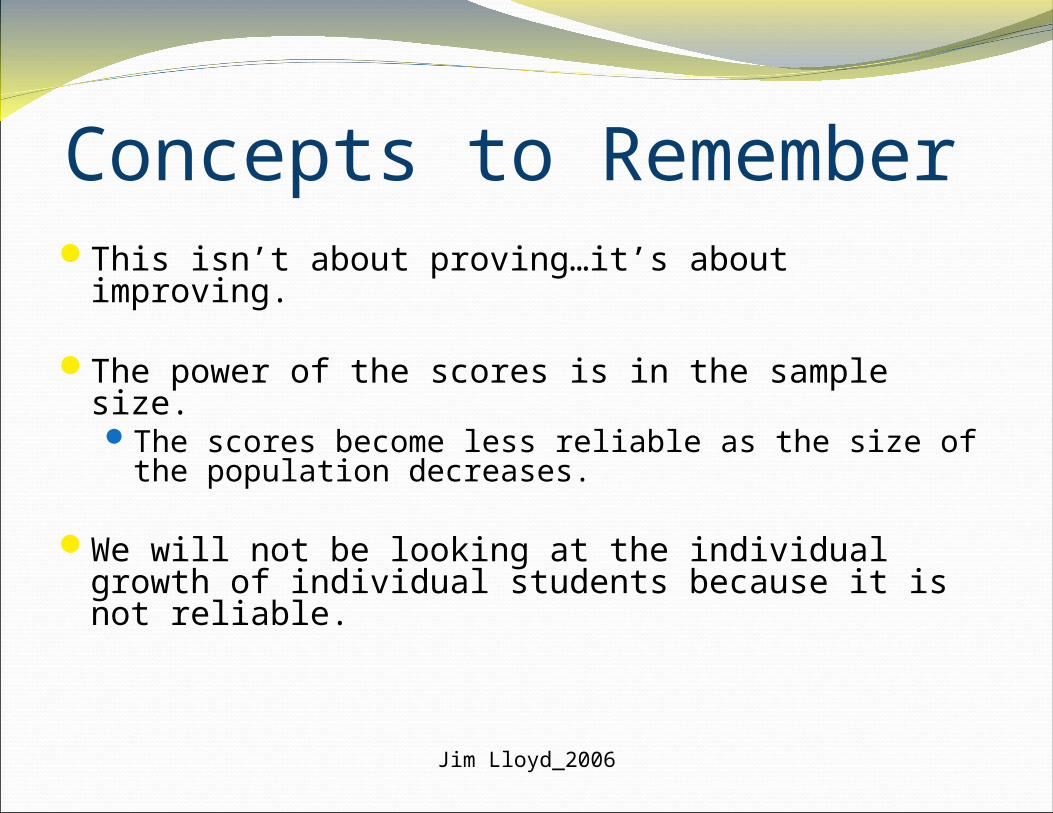
Concepts to RememberThis isn’t about proving…it’s about improving.
The power of the scores is in the sample size. The scores become less reliable as the size of the
population decreases.
We will not be looking at the individual growth of individual students because it is not reliable.
Jim Lloyd_2006
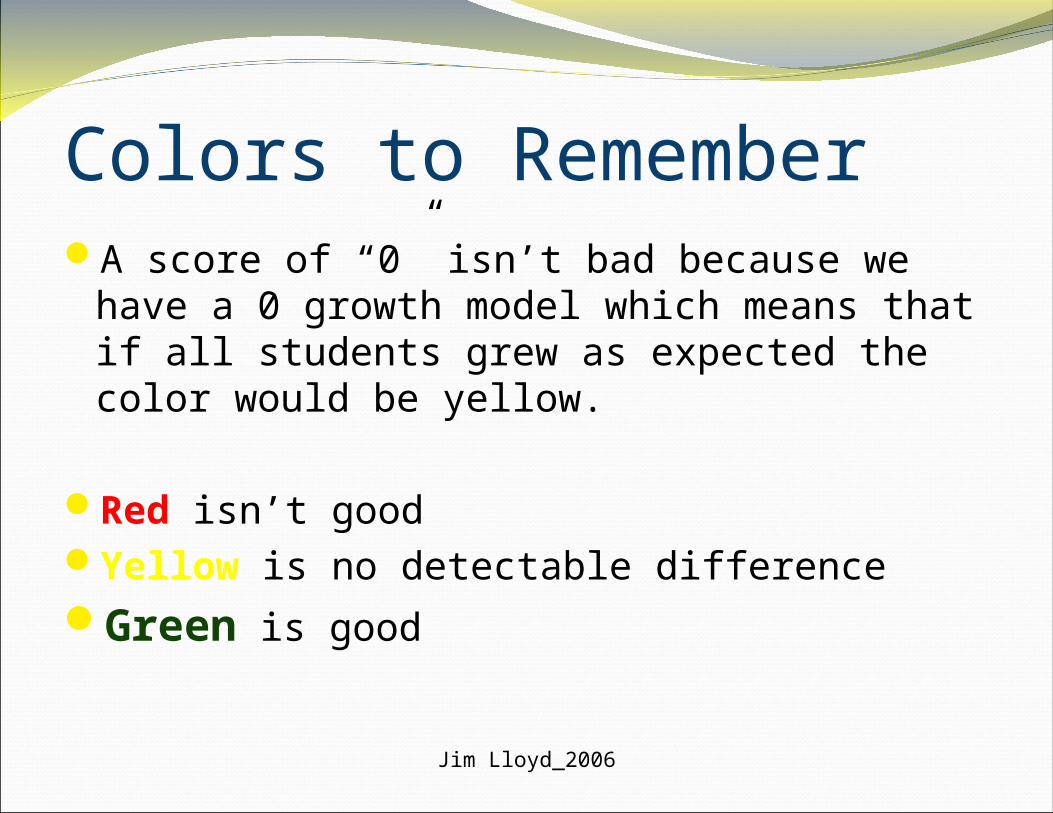
Colors to RememberA score of “0” isn’t bad because we have a 0
growth model which means that if all students grew as expected the color would be yellow.
Red isn’t goodYellow is no detectable differenceGreen is good
Jim Lloyd_2006
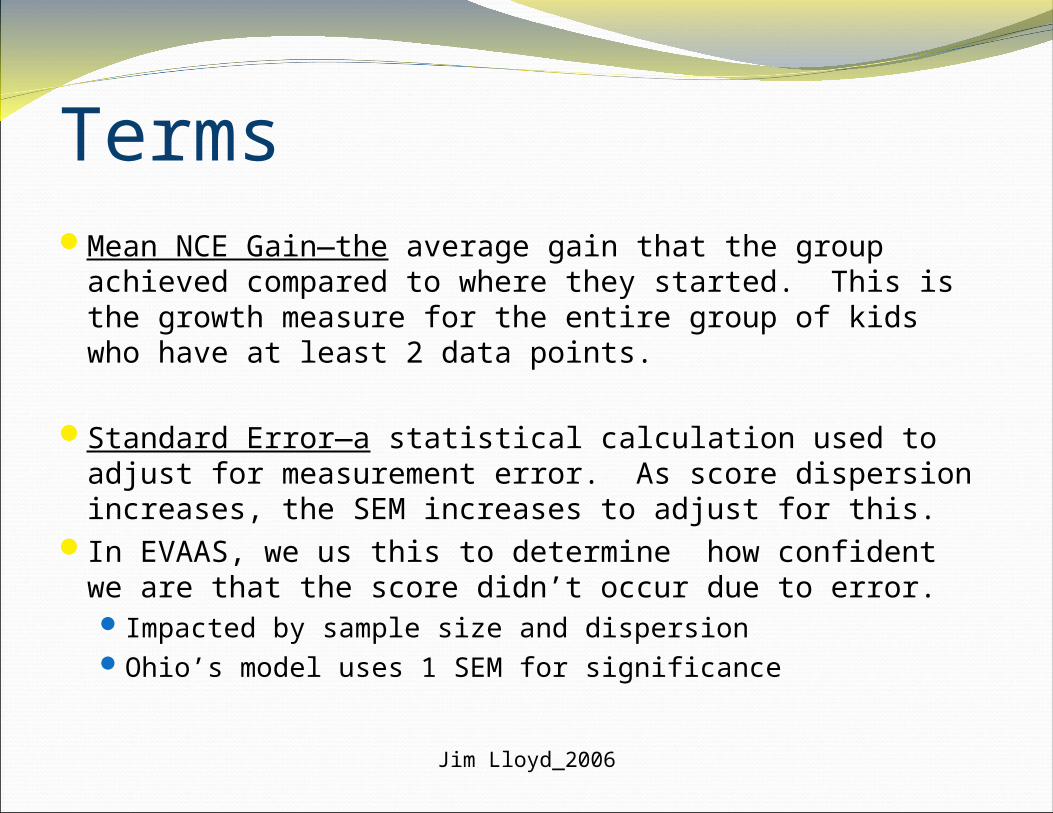
Terms Mean NCE Gain—the average gain that the group
achieved compared to where they started. This is the growth measure for the entire group of kids who have at least 2 data points.
Standard Error—a statistical calculation used to adjust for measurement error. As score dispersion increases, the SEM increases to adjust for this.
In EVAAS, we us this to determine how confident we are that the score didn’t occur due to error.Impacted by sample size and dispersionOhio’s model uses 1 SEM for significance
Jim Lloyd_2006
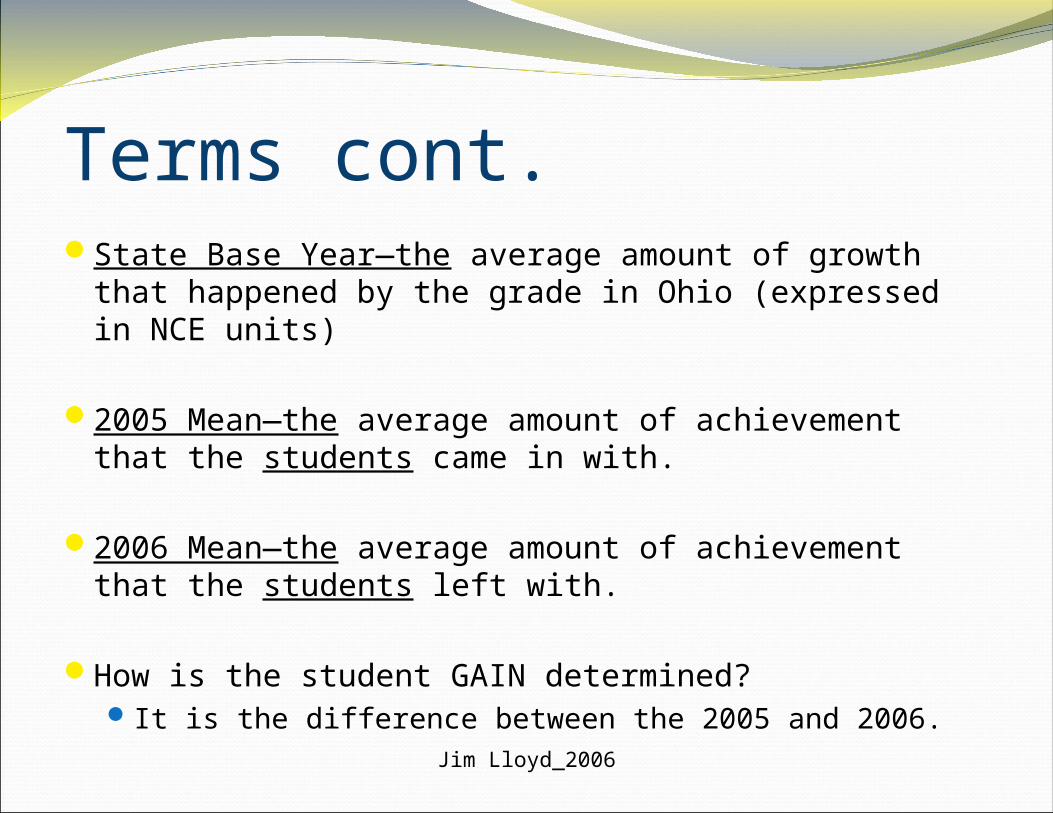
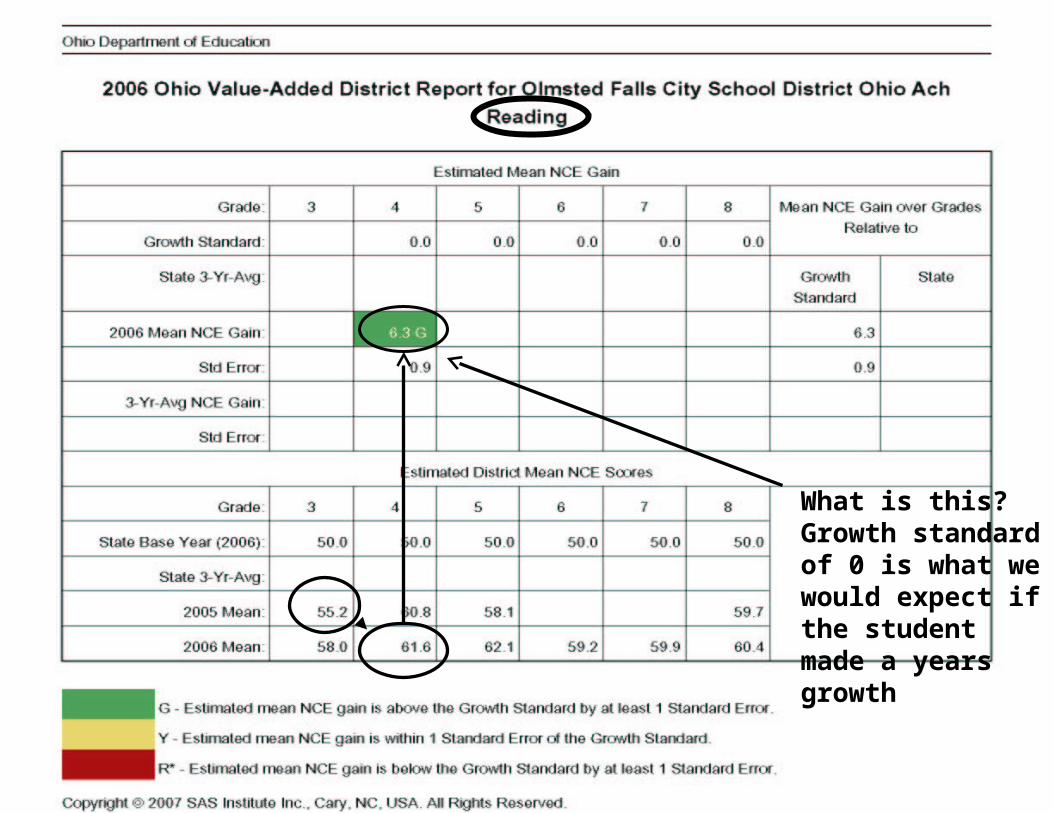
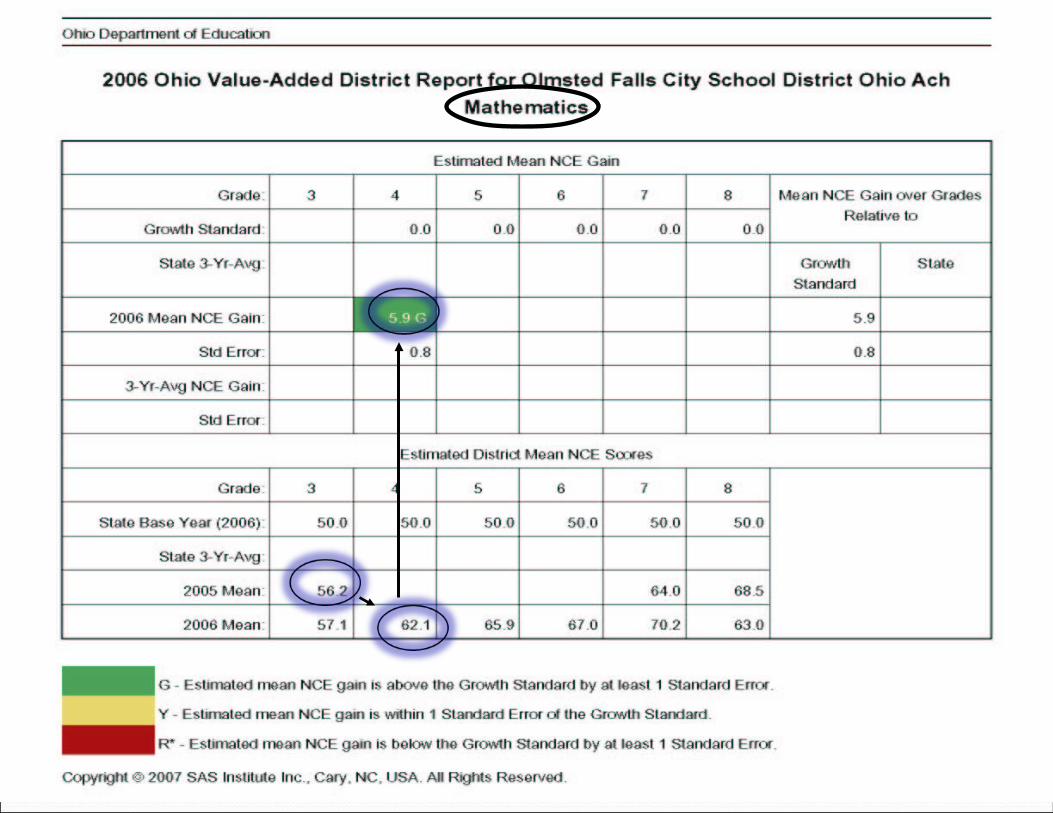
Terms cont.State Base Year—the average amount of growth that
happened by the grade in Ohio (expressed in NCE units)
2005 Mean—the average amount of achievement that the students came in with.
2006 Mean—the average amount of achievement that the students left with.
How is the student GAIN determined?It is the difference between the 2005 and 2006.
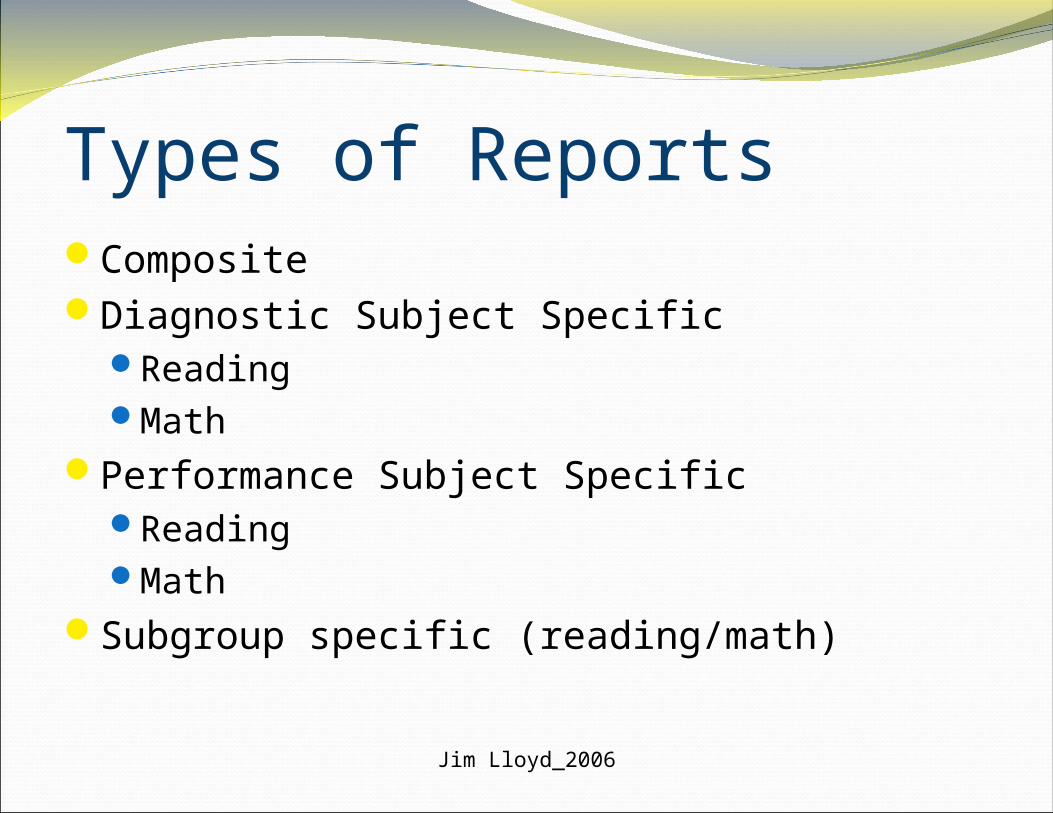
Types of ReportsCompositeDiagnostic Subject Specific
ReadingMath
Performance Subject SpecificReadingMath
Subgroup specific (reading/math)
Jim Lloyd_2006
Composite Reports
Jim Lloyd_2006
Jim Lloyd_2006
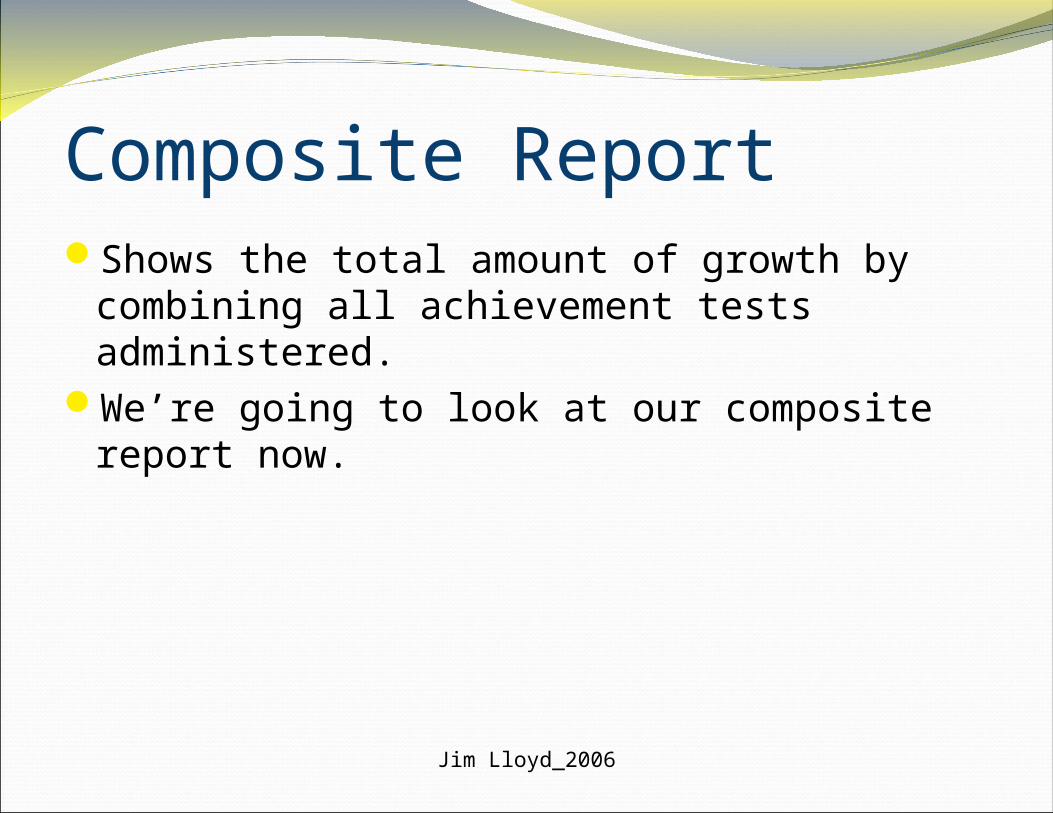
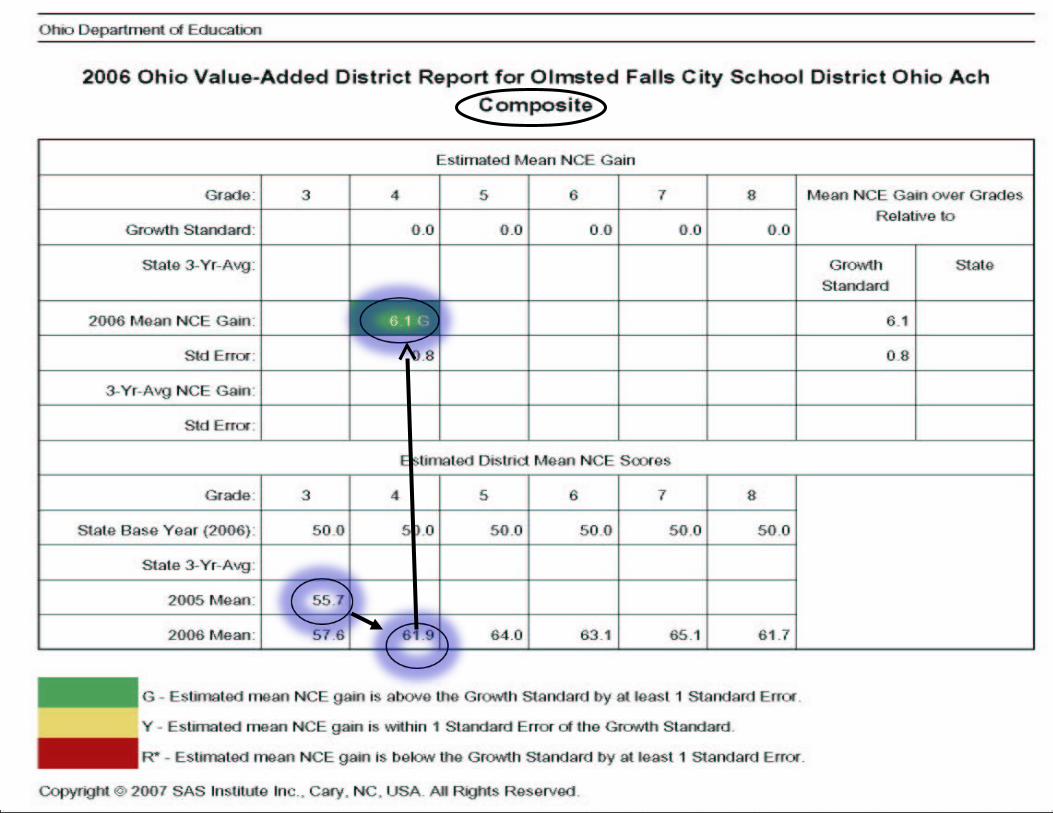
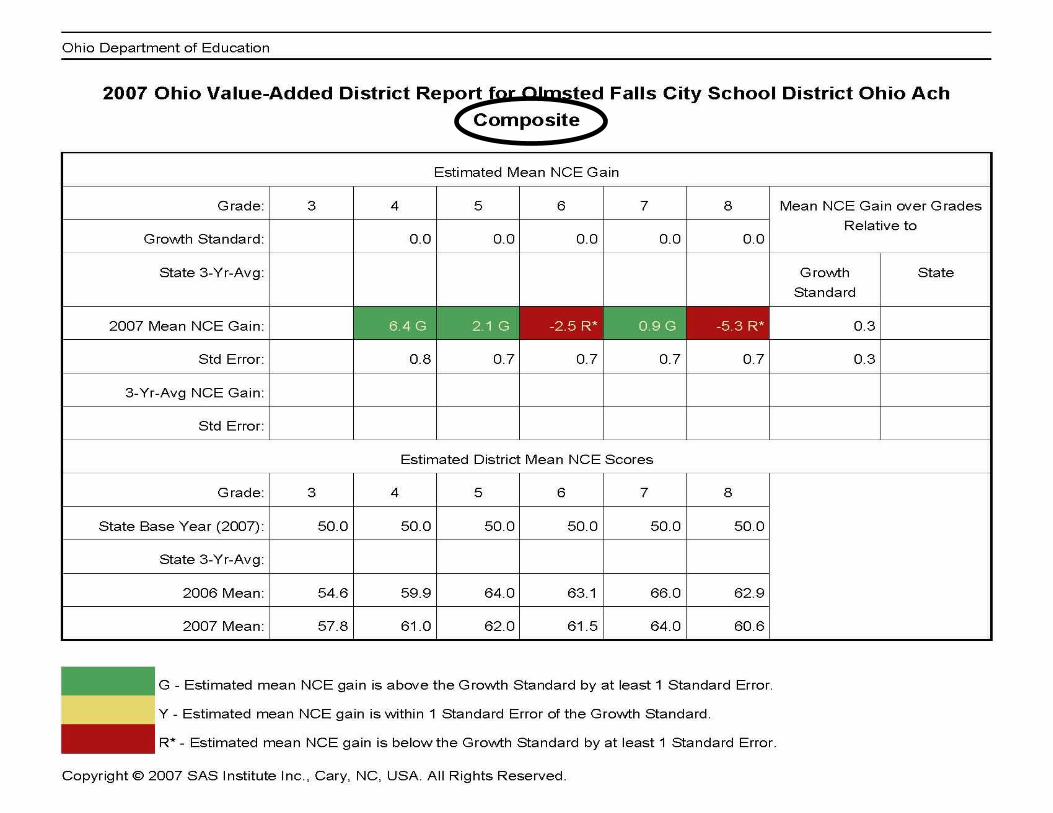
Composite ReportShows the total amount of growth by
combining all achievement tests administered.
We’re going to look at our composite report now.
What are Building Summary Reports?
Jim Lloyd_2006
Jim Lloyd_2006
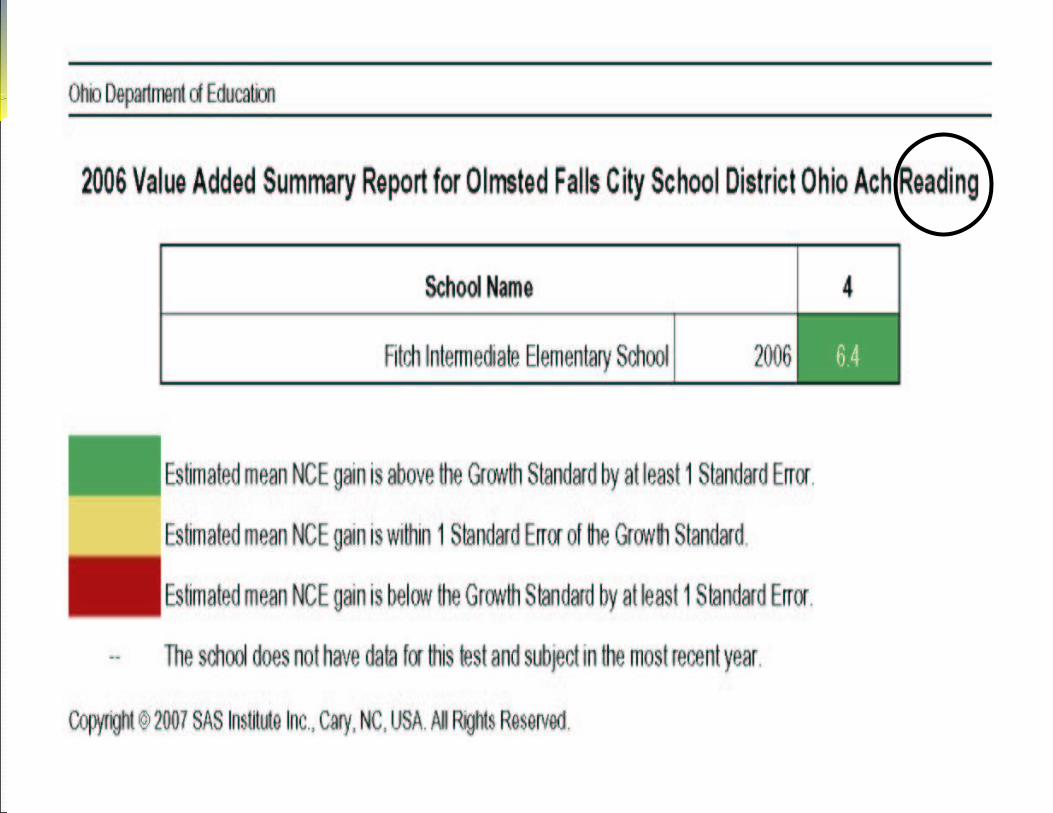
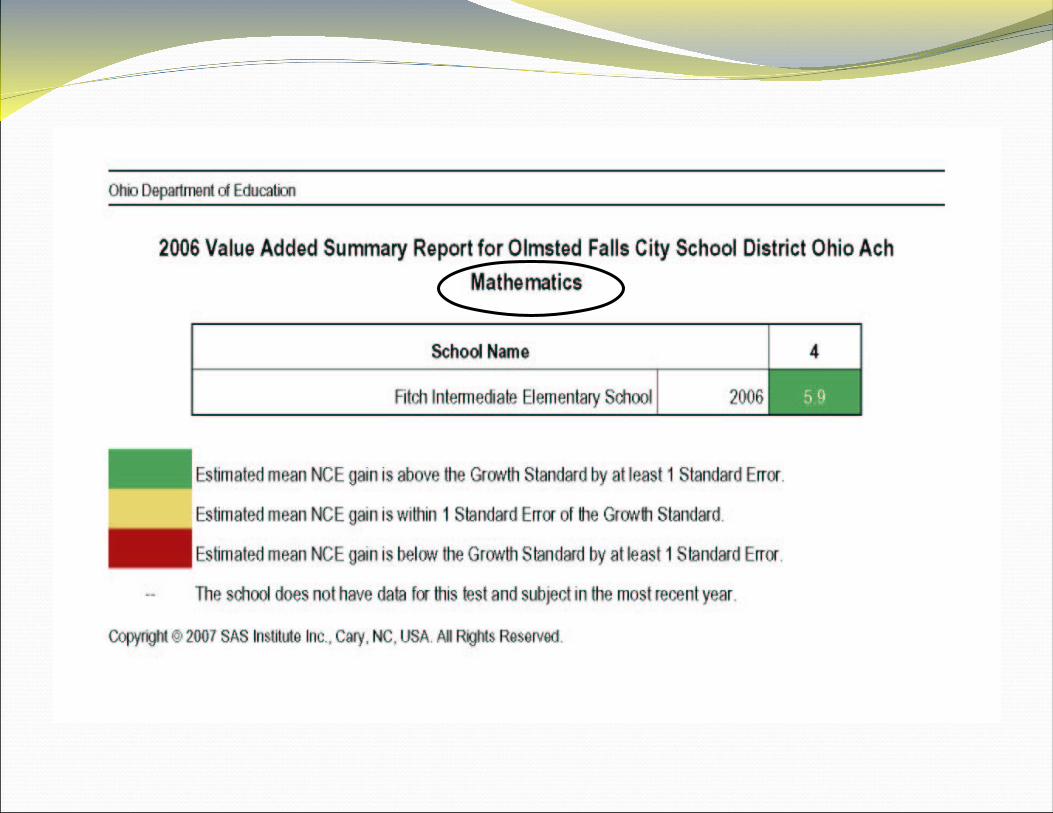
Building Summary ReportsThere are summary reports for each building
as well that are subject specific.
Here is reading building summary report...
Jim Lloyd_2006
Subject Specific Reports
Jim Lloyd_2006
Jim Lloyd_2006
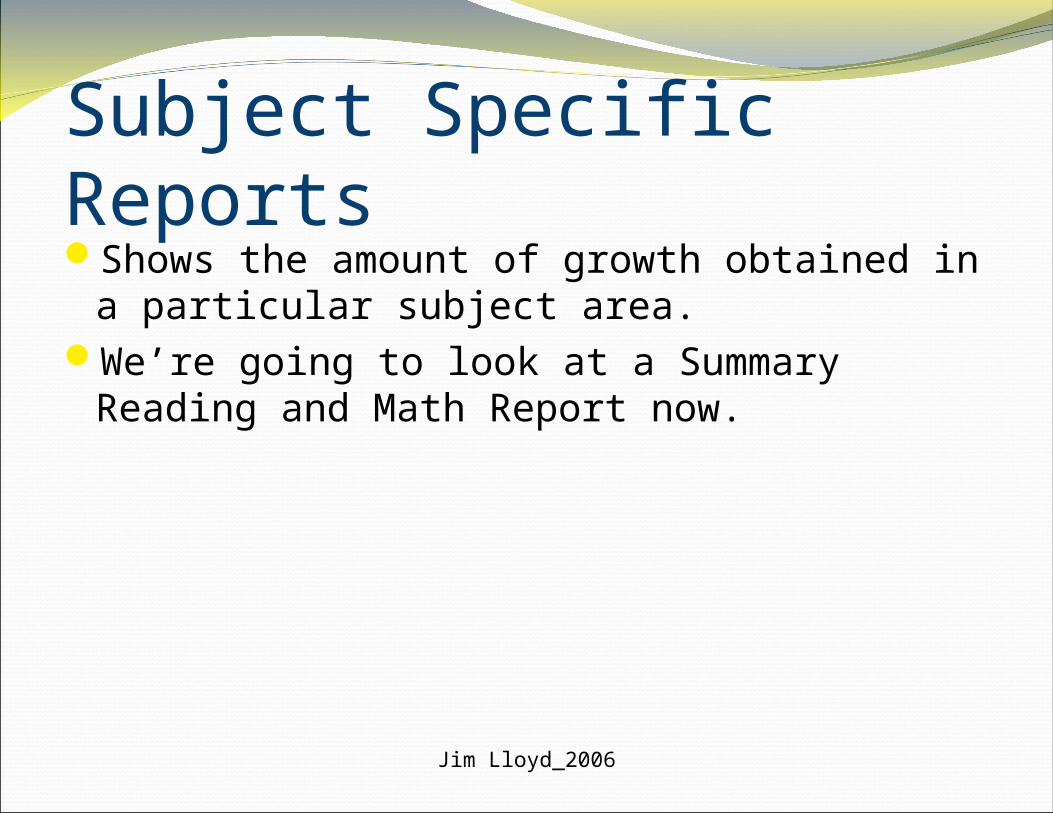
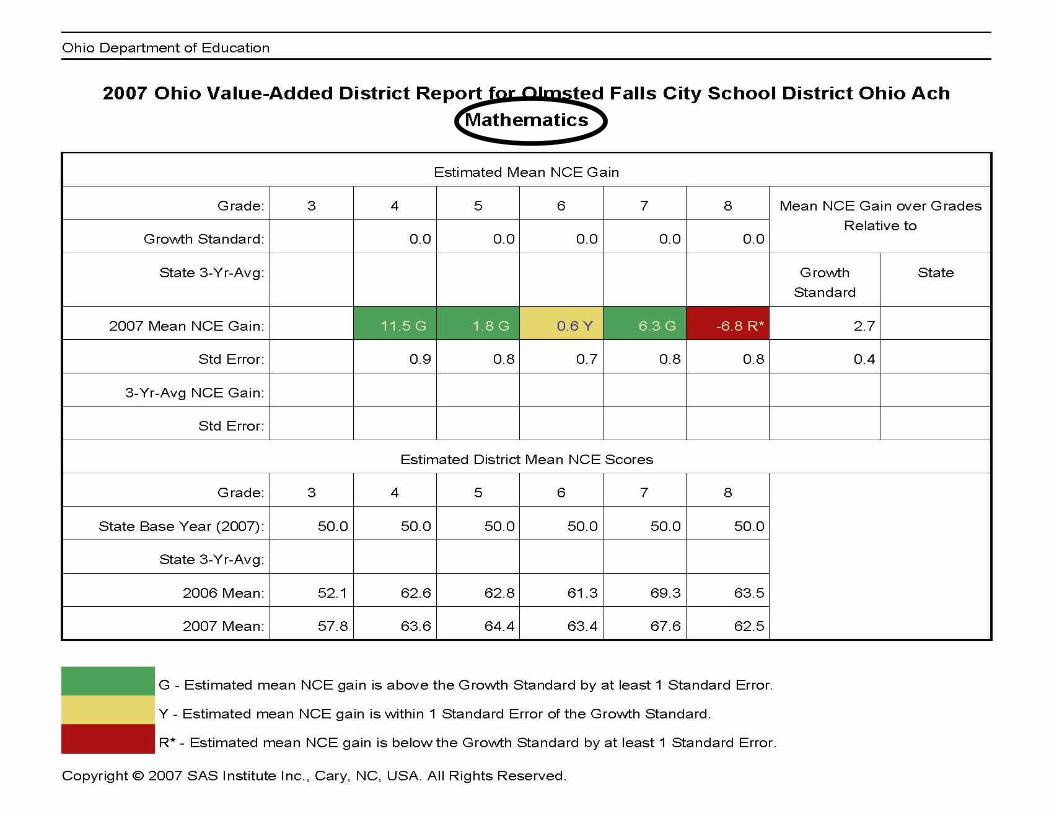
Subject Specific ReportsShows the amount of growth obtained in a
particular subject area.We’re going to look at a Summary Reading
and Math Report now.
Jim Lloyd_2006
What is this? Growth standard of 0 is what we would expect if the student made a years growth
Jim Lloyd_2006
EVAAS
How to view a Building Diagnostic Report
Jim Lloyd_2006
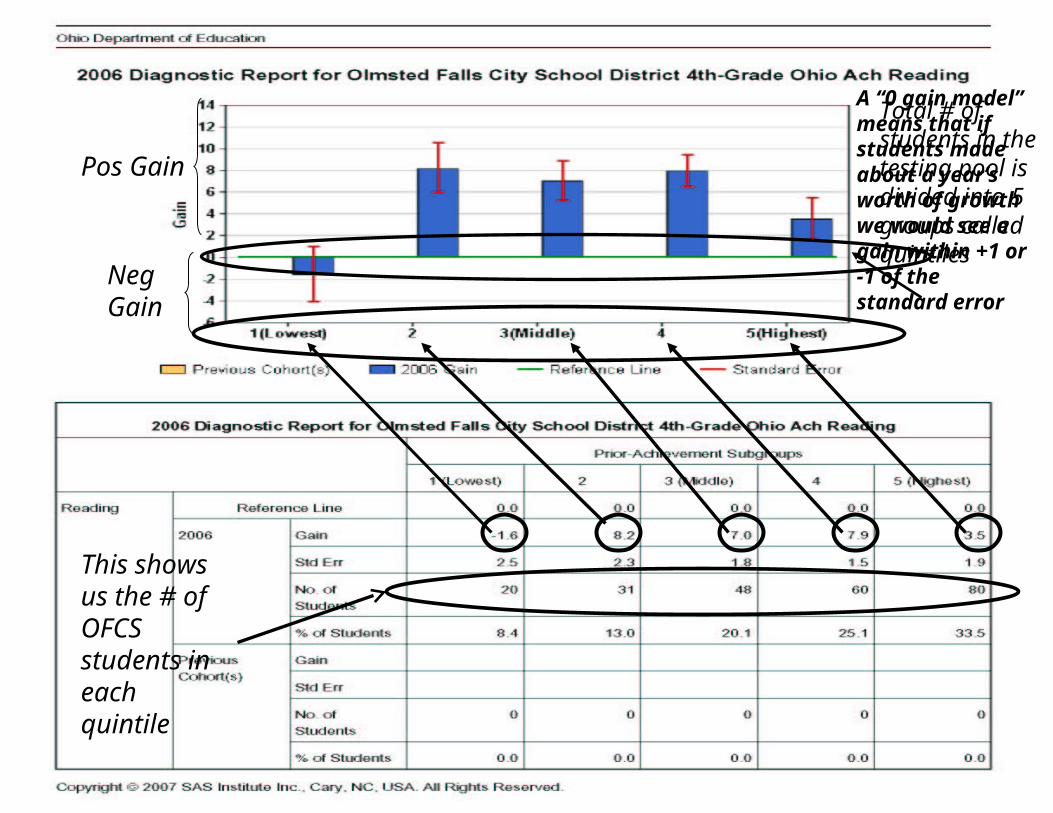
Pos Gain
Neg Gain
This shows us the # of OFCS students in each quintile
Total # of students in the testing pool is divided into 5 groups called quintiles
A “0 gain model” means that if students made about a year’s worth of growth we would see a gain within +1 or -1 of the standard error
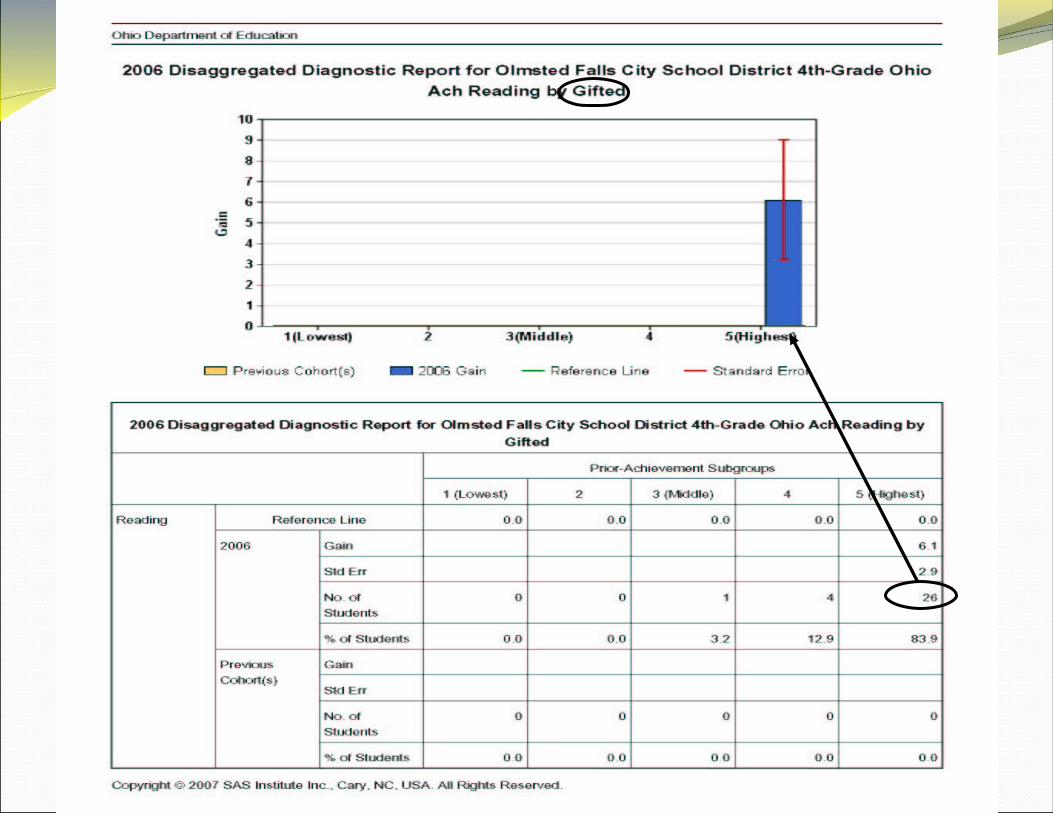
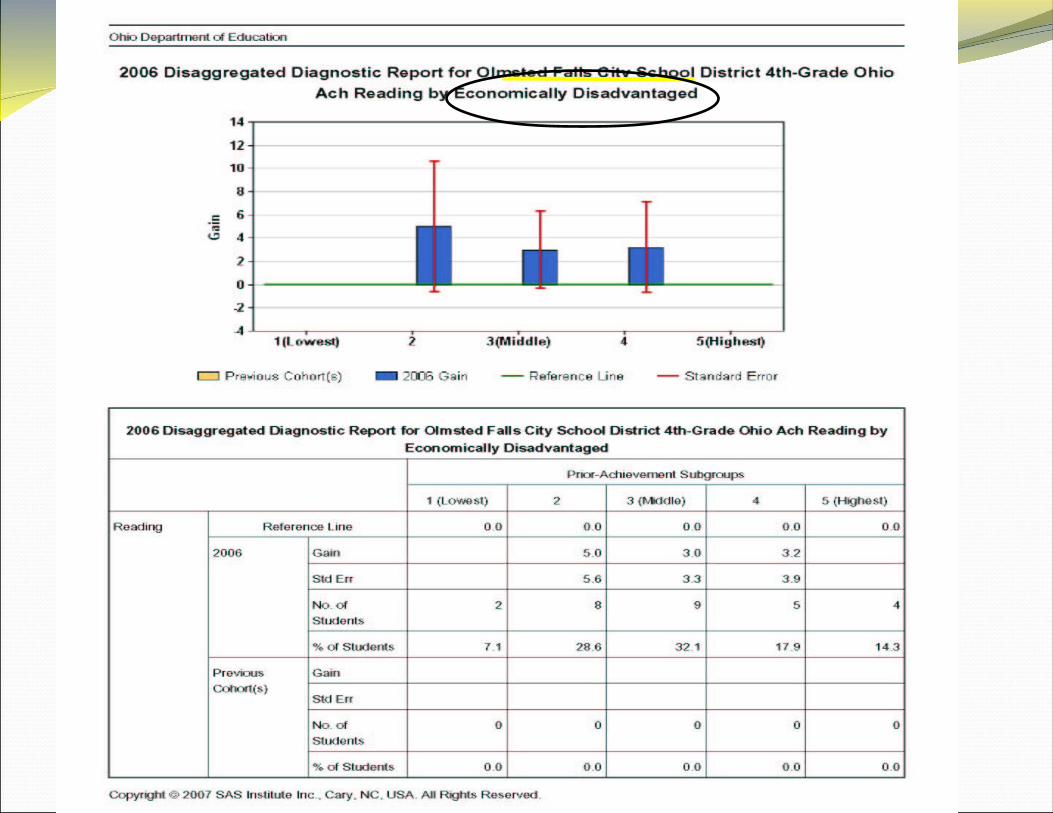
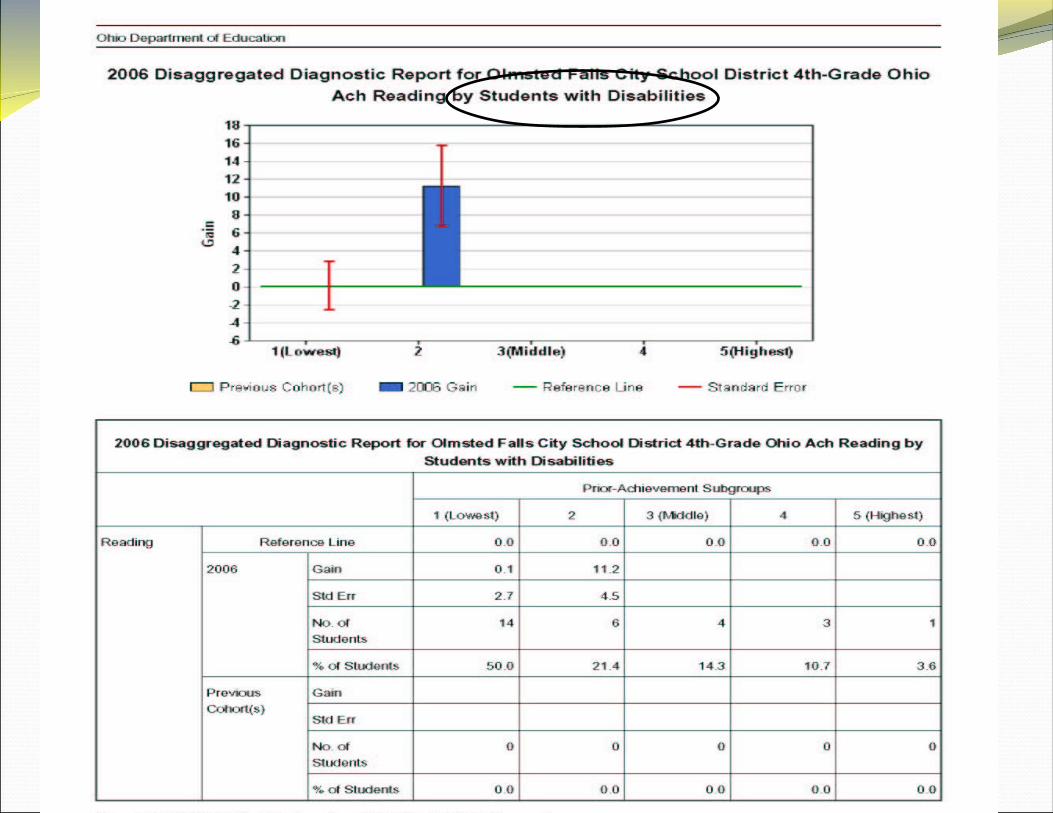
Disaggregated Building Report
You can look at value added data for different reported groups as well.
Jim Lloyd_2006
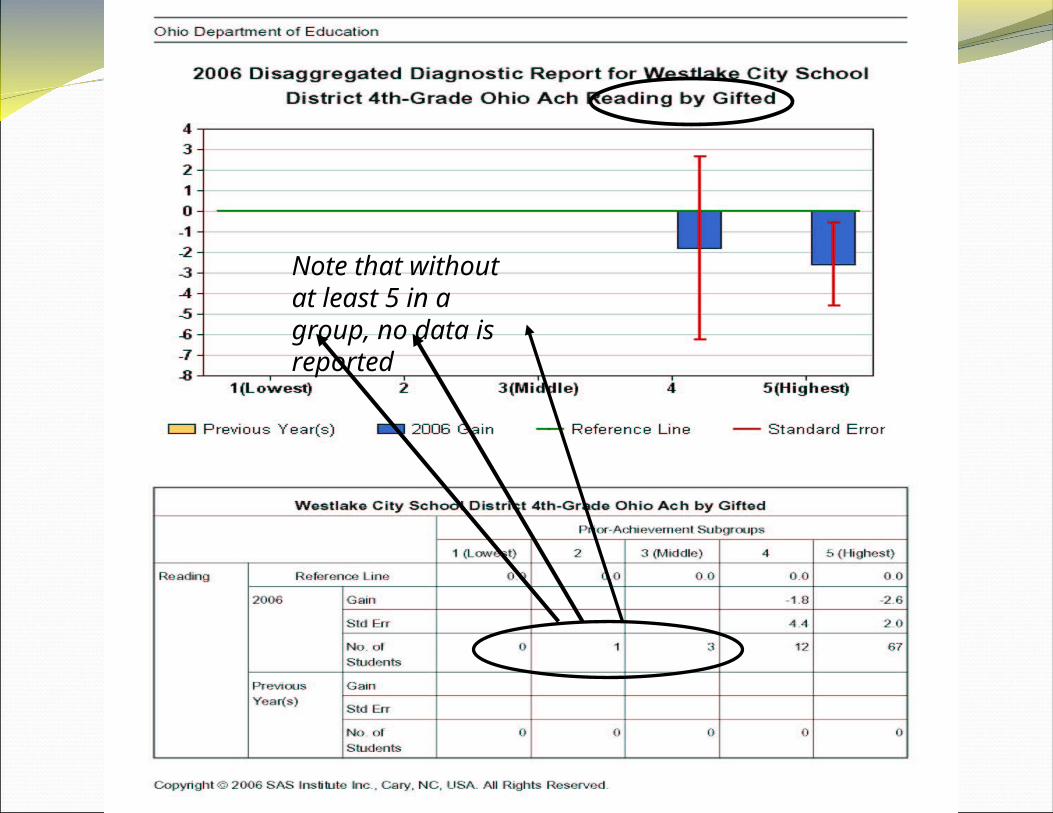
Note that without at least 5 in a group, no data is reported

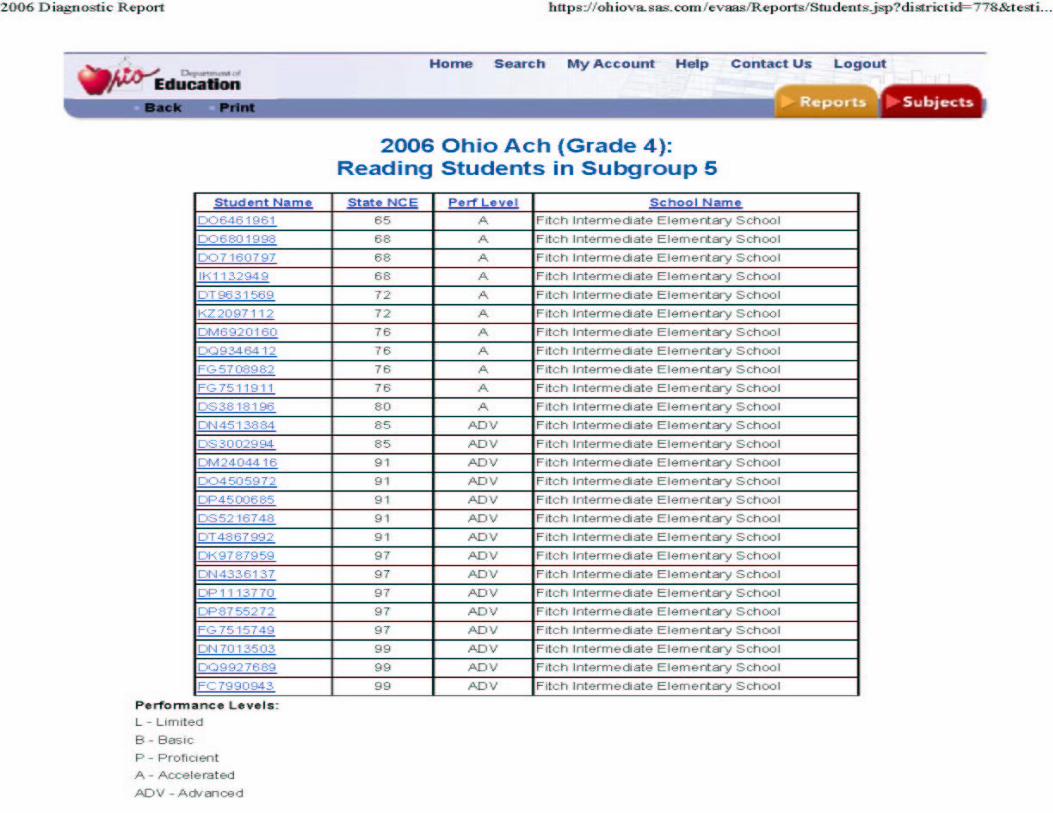
Disaggregated Building Report
You can ask to show you who the students are too
Jim Lloyd_2006
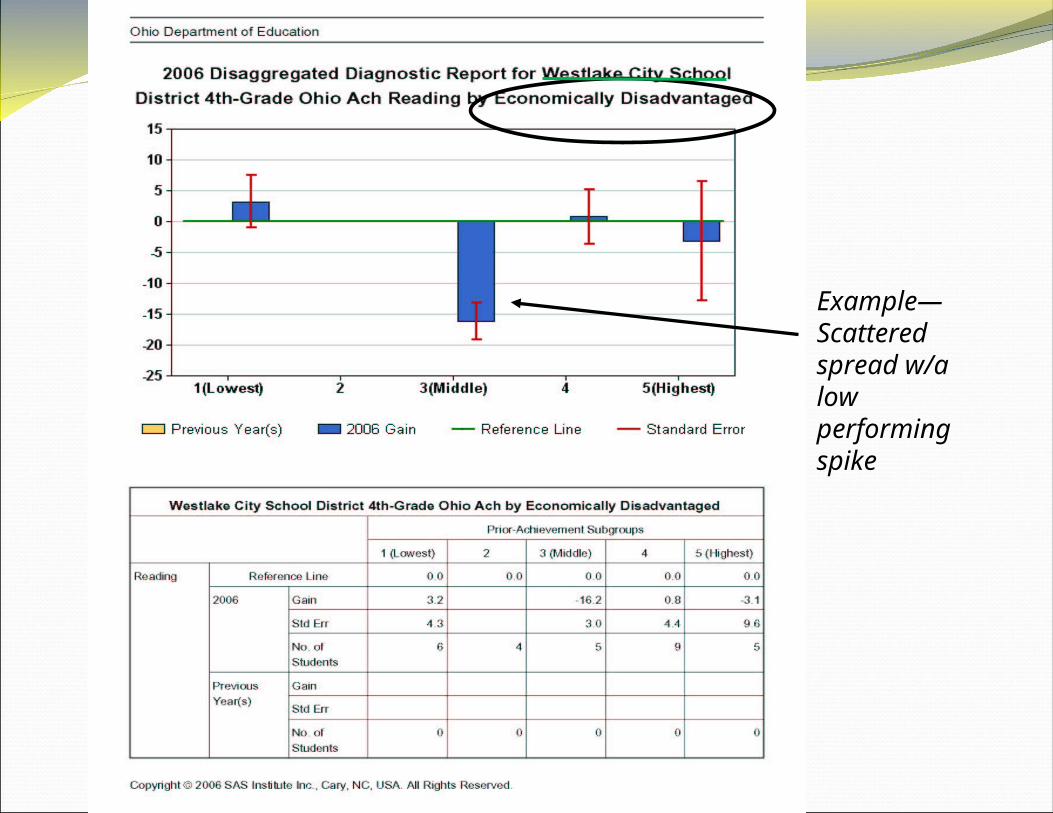
Example—Scattered spread w/a low performing spike
Jim Lloyd_2006
EVAAS Math Reports
District Reports 2006Current 6th Grade Students
Jim Lloyd_2006
Building Summary ReportThere are summary reports for each building
as well that are subject specific.Here is mathematics.
Jim Lloyd_2006
Math Diagnostic Reports
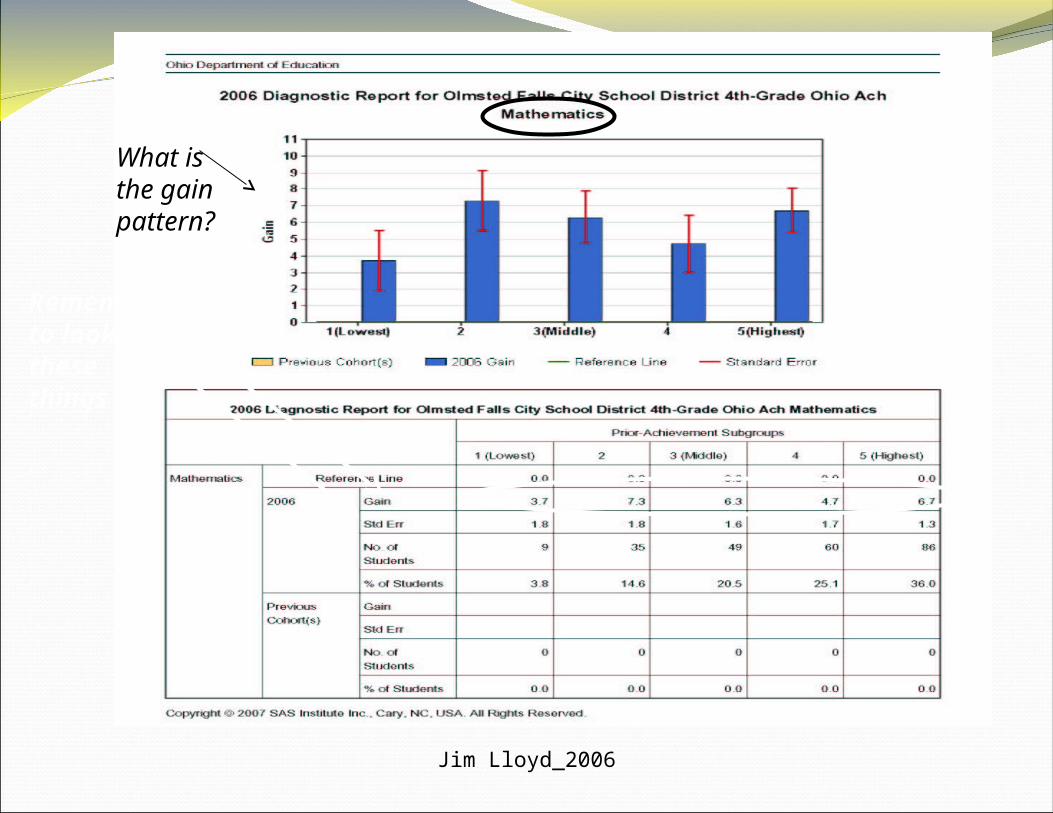
Jim Lloyd_2006
What is the gain pattern?
Remember to look @ these things
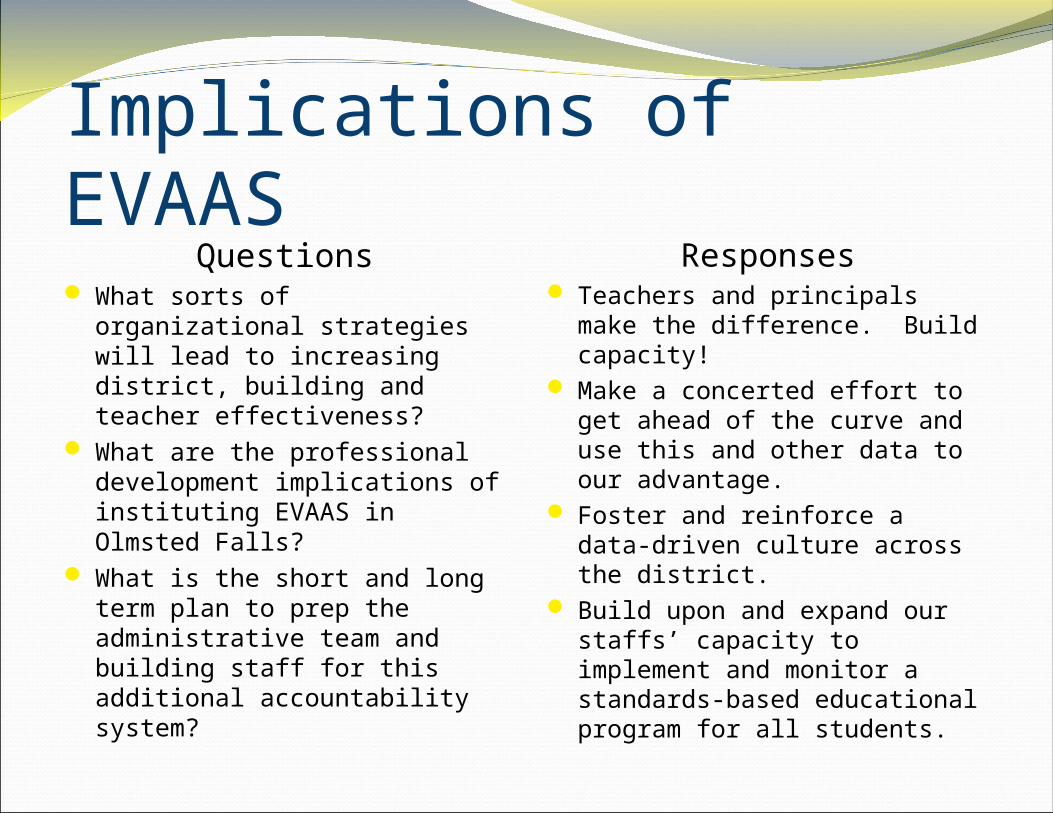
Implications of EVAASQuestions
What sorts of organizational strategies will lead to increasing district, building and teacher effectiveness?
What are the professional development implications of instituting EVAAS in Olmsted Falls?
What is the short and long term plan to prep the administrative team and building staff for this additional accountability system?
Responses Teachers and principals make
the difference. Build capacity! Make a concerted effort to get
ahead of the curve and use this and other data to our advantage.
Foster and reinforce a data-driven culture across the district.
Build upon and expand our staffs’ capacity to implement and monitor a standards-based educational program for all students.
What’s Next?EVAAS Phase 3
Review of Spring 2007 value added data
Discussion of the implications of the data
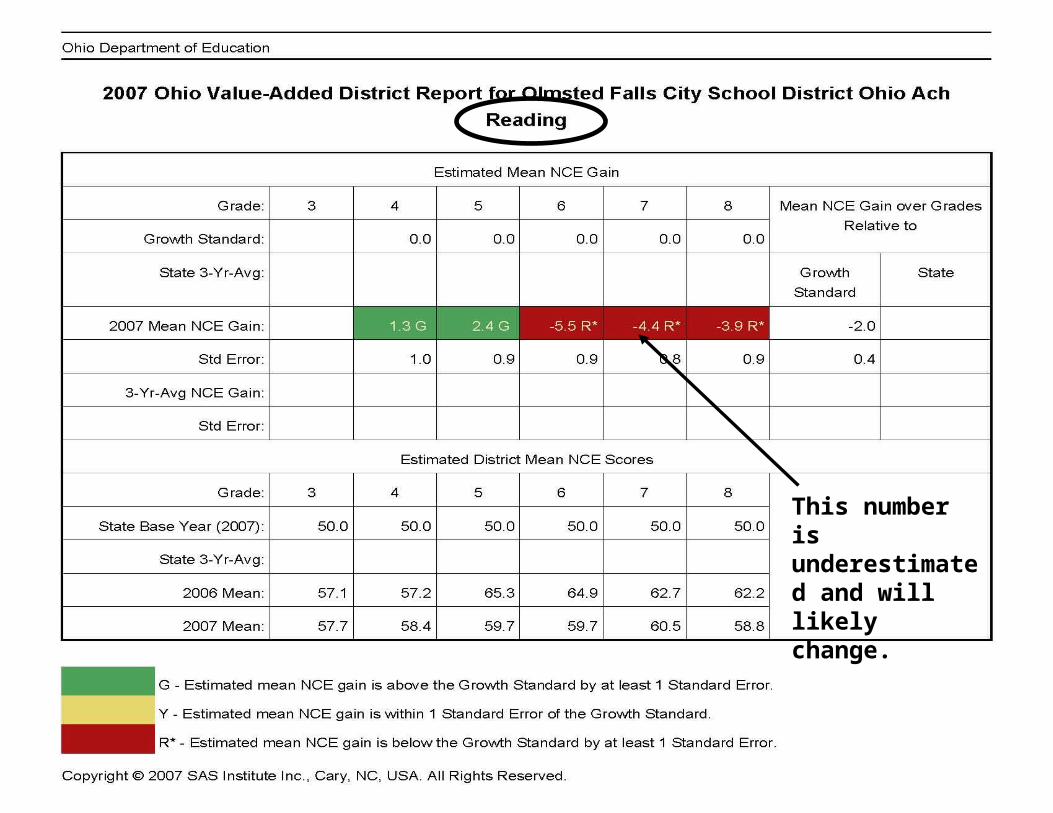
This number is underestimated and will likely change.