jI!!/Ill'/!1/tJl!lII.I/-/!I!/ BELL
34
jI!!/Ill'/!1/tJl!lII.I/-/!I!/_ f BELL LABORATORIES RECORD O . PI. .vA. -arc `ßu0 FILTERS IN CARRIER SYSTEMS R. H. Mills BINAURAL ILLUSION Harvey Fletcher MUSHROOMS AND MAINTENANCE R. H. Colley W-1 R O . fr JUNE I 9 3 3 VOL. 1 1 No. I o r1Yf!/z.'1lJ/'!lJ!!'lJ'/IIJJ1l11--/" =' O www.americanradiohistory.com
Transcript of jI!!/Ill'/!1/tJl!lII.I/-/!I!/ BELL

jI!!/Ill'/!1/tJl!lII.I/-/!I!/_ f
BELL LABORATORIES
RECORD O
.
PI.
.vA. -arc `ßu0
FILTERS IN CARRIER SYSTEMS
R. H. Mills
BINAURAL ILLUSION Harvey Fletcher
MUSHROOMS AND MAINTENANCE
R. H. Colley
W-1
R
O
.
fr JUNE I 9 3 3 VOL. 1 1 No. I o
r1Yf!/z.'1lJ/'!lJ!!'lJ'/IIJJ1l11--/" =' O
www.americanradiohistory.com

BELL LABORATORIES RECORD
Edited by the Bureau of Publication: PAUL B. FINDLEY Managing Editor PHILIP C. JONES Associate Editor
Board of Editorial Advisors:
O. E. BUCKLEY W. FONDILLER H. A. FREDERICK
O. M. GLUNT H. H. LOWRY W. H. MATTHIES
JOHN MILLS D. A. QUARLES J. G. ROBERTS
W. B. SANFORD G. B. THOMAS R. R. WILLIAMS
BELL TELEPHONE LABORATORIES, INCORPORATED 463 West Street, New York, N. Y.
In this Issue
Frontispiece 285 Apparatus employed at the Summit laboratories for measuring the rate of flow of humidified gases through wood sections.
An Acoustic Illusion Telephonically Achieved . 286 Harvey Fletcher
A Compression Test for Soft Solids 290 R. L. Peek, Jr.
Uses of Filters in Carrier Systems 296 R. H. Mills
Mushrooms and Maintenance 301 R. H. Colley
Delayed Speech 308 C. N. Hickman
Improved Current Control for Low Range Meter Calibration 31 I
F. R. Dennis
www.americanradiohistory.com
BELL LA
RECO
,
I 0, ORATORiES D
VOLUME ELEVEN -NUMBER TEN
for
JUNE 1933
www.americanradiohistory.com

An Acoustic Illusion Telephonically Achieved
By HARVEY FLETCHER Acoustical Research Director
DURING the Winter and Spring of last year a strange figure inhabited the American
Academy of Music in Philadelphia. Looking him full in the face, one met unblinking eyes, and a slight smile, fixed and unfading; and this evidence of inhumanity was confirmed by looking at him in profile, for just in front of his ears, microphones were set into his cheek bones. Thus Oscar, the tailor's dummy, though less than human in appearance, was given one capacity that was more than human: that of instantly communicating to
others exactly what he heard, exactly as he heard it. To listen through the receivers connected to Oscar's micro- phones was to put oneself in Oscar's place. This capacity of Oscar's gave him an important position in the tests of musical reproduction con- ducted by the Laboratories in co- operation with Dr. Leopold Stokowski and the Philadelphia Symphony Or- chestra.
When one hears a sound, one can usually locate approximately its point of origin -its distance and direction. The mechanism by which this location
[ 286 ]
www.americanradiohistory.com

is accomplished is not altogether understood, but the interaction of the two ears seems to have much to do with it, for stopping up one ear destroys the ability almost com- pletely. In listening to an orchestra under the two conditions, the differ- ence in effect is quite similar to that between a view seen in full per- spective with both eyes and in flat panorama with only one.
It is to be expected that any two sound -apprehending devices could double for the ears. Two microphones, placed the same distance apart as human ears, could be independently connected to two receivers. A person putting the receivers to his two ears would be acoustically transported to the location of the microphones, no matter at what distance from them he might actually be, hearing all sounds as he would if his ears were in the positions of the microphones. Oscar duplicates the conditions of normal hearing as nearly as possible, not only by supporting the micro- phones the proper distance apart but by modifying the sound field near them as a human head modifies it near the ears.
In the extent to which they ap-
proach the conditions of normal hear- ing, systems for transmitting sound can be roughly divided into four classes, as diagrammed in Figure 2. In "monaural" systems, such as the commercial telephone, a single trans- mitter is connected to a single receiver. "Diotic" systems, in which the trans-
A B D
Fig. 2- Systems of transmission can be roughly divided into four classes: monaural (21), diotic (B), mixed (C), and bi-
naural (D)
mitter is connected to two receivers, one for each ear, are familiar to those who have used double head -receivers on telephone lines and the like. "Mixed" reception is found in the similar use of double receivers to monitor a loud- speaking public ad- dress system, in which two micro- phones are used to pick up the pro-
Fig. i -drrangement by which several pairs of receivers were multiply connected to Oscar, for binaural observation by several persons at once
[287]
www.americanradiohistory.com

gram and their outputs are mixed. Of "binaural" systems, in which the out- puts of two microphones are sepa- rately conducted to the two receivers, only a few experimental examples such as that used in Philadelphia have been built.
From the familiar monaural con- dition, the change to the diotic pro- duces mainly the effect of an increase in the loudness and fullness of the sound, and of a shift of its apparent source to the center of head. Changing to the mixed condition adds a rough- ness to the sound but leaves its loud- ness and apparent source as they were when reception was diotic. With the final change to the binaural condition, the apparent sources of sound move to approximately their proper loca- tions in space, and the apparent re- verberation is greatly reduced.
Fig. 3 -The amplifiers and equalizers for the binaural system were adapted for use at the Century of Progress Exposition by
L. B. Cooke
To provide, for the experiments in Philadelphia, a binaural system which would reproduce speech and music faithfully in all respects, microphones, amplifiers and receivers of the highest quality were used in the two channels, transmitting extremely wide ranges of frequency and volume. Since the response of a receiver depends upon the person's ear upon which it is placed, perfect reproduction requires a different equalization for each per- son. In these experiments, however, only a single equalizer was used, which was an average for a group of listeners. By its use the frequency characteristics of the system were corrected so that all observers agreed that the reproduction was excep- tionally faithful.
Striking evidence of the naturalness which can be secured with such a binaural system was obtained at several formal demonstrations in Philadelphia. When the guests had put to their ears the receivers con- nected to Oscar, who was in another room, someone would say confi- dentially in Oscar's ear, "Please move over." A surprisingly large number of the guests would start to obey the command before realizing that it came from the receivers. Afterwards some- one would whisper in first one and then the other of Oscar's ears, and would tear paper, jingle keys or thump a tambourine to illustrate the fidelity of the system to sounds of high frequency. Finally Oscar would be brought out and set in the midst of the audience so that they could com- pare direct with transmitted sounds.
Experiment showed that the ad- vantage of using Oscar, instead of two microphones less dramatically mounted, was confined to cases in which the sounds originated quite near the microphones. For tests of
[288]
www.americanradiohistory.com

the reproduction of music, therefore, two microphones were hung from a bar. It was found that, when the localization effect of the system is dis- regardea, the best place for the micro- phones is relatively near the orchestra, where the tones are brilliant because absorption has not diminished the high- frequency components as it has by the time the sounds reach remote parts of the hall. The localization is such, however, that observers sitting at the rear of the hall where they can see the orchestra prefer to have the microphones near them, even at the expense of tonal brilliance, for other- wise they find themselves discom- forted by being acoustically in one place and visually in another. This effect has even been noticed by ob- servers in another room where a screen placed the source of sound at a certain apparent visual distance.
In comparisons of binaural with loud- speaker reproduction, even the inconvenience of wearing head re- ceivers does not prevent most ob- servers from preferring the binaural system. In an attempt to rate the worth of the binaural system, ob- servers were asked to note their preference between monaural repro- duction of the full frequency range and binaural reproduction of various limited frequency ranges. Even when all frequencies over about 2800 cycles per second were suppressed in the binaural system, more than a third of the observers preferred it.
To give a wider public the unique experience of being put in the other
Fig. 4 -Into Oscar's head two microphones are set, one on each side
man's place by a trick of the ear, a binaural system (Figure 3) has been installed at the Century of Progress Exposition in Chicago. Here Oscar II will appear in a glass booth some- what similar to that shown in the headpiece, and observers who hold to their ears one of the sets of receivers on a nearby balcony, will feel as if transported to his position, there to be addressed by Oscar's companion. The system will furnish to those who use it dramatic proof that there is no longer any limitation, except expense, to the acoustic fidelity which electrical transmission systems can achieve.
www.americanradiohistory.com

A Compression Test for Soft Solids By R. L. PEEK, Ji .
Telephone Apparatus Development
THE simplest way to judge the physical character of a ma- terial is to squeeze a sample of
it between the fingers. In this way it may be classified as hard or soft, rigid or elastic. The test may be made quantitative if rigid metallic plates are substituted for the fingers, and a measured load for the pressure of the muscles. Such a compression test is in common use to determine the load required to fracture sam- ples of metal, wood, and other ma- terials, and has also been employed to measure "cold flow" -slow deforma- tion under load -of such soft ma- terials as asphaltic compounds. In the
latter case the load is usually left con- stant, and the amount of deformation measured at various times from the start of the test. Performed in this way, the test has a number of experi- mental advantages, because the appa- ratus and procedure required are very simple, applicable to a wide va- riety of materials, and adapted to close control of temperature.
As commonly employed, this test is empirical and comparative, so that the results serve to predict only com- parative behavior under conditions similar to those of the test. Incidental to several studies of different ma- terials carried out in the Laboratories,
[ 2901
www.americanradiohistory.com

however, there have been developed methods of analyzing data by which the physical constants of several types of materials may be evaluated from the results of such compression tests.
These studies have required facili- ties for testing materials over a wide range of temperature, and this has made it desirable to use two types of testing apparatus. Both employ the same method of applying load and reading deformation, but differ in design to accommodate the range of temperature over which they are to be employed. For materials tested at temperatures below the boiling point of water, an apparatus has been em- ployed similar to the Williams plas- tometer -used to some extent in the rubber industry. In this a cylindrical sample is compressed axially between parallel plates under a constant load. A sectional diagram of the apparatus is given in Figure 1. Both sample and plates are surrounded by a water bath which can be kept at a constant tem- perature by means of a heating ele- ment and a motor -driven stirrer. The separation of the plates, and hence the height of the sample, can be read at any time by a micrometer gauge, which records the position of the movable upper plate with respect to the fixed lower plate. The load, which is held constant during a test, con- sists of the upper plate and the shaft to which it is attached, together with the plate on the top of the shaft, on which additional load may be placed.
For higher temperatures, the ap- paratus shown in the photograph at the head of this article has been de- veloped. Here the lower plate is at the bottom of a well drilled in a massive steel block, and the upper plate is a steel plunger which fits in the well. Both block and plunger are provided with heating elements and with ther-
mocouples for temperature determi- nations. With this apparatus, used in studies of lead -cable sheathing alloys and wiping solders, accurate tem- perature control may be maintained to well above 300° C.
With either type of apparatus, the load and the volume of the sample are fixed during any one run, and the readings taken are sample height and time - sample height being read on the micrometer gauge and time being taken by a stopwatch. From these there may be derived the rate of com- pression, or change in sample height
with time, dh. A convenient method
of obtaining h is to plot values of h
against t. The slope of the resulting
curve for any value of h, is dh. For
convenience the test data is usually studied from plots of the logarithm of
Fig. 1 - Sectional diagram of parallel plate plastometer
[2911
www.americanradiohistory.com
+0.4
o
z O
Ñ-0.4 re a p 0.8 V W 0 W 1.2
ce
O -1.6
0 J -2.0
-2.4 22 21 20 1.9 18 17 16
LOG OF SAMPLE HEIGHT
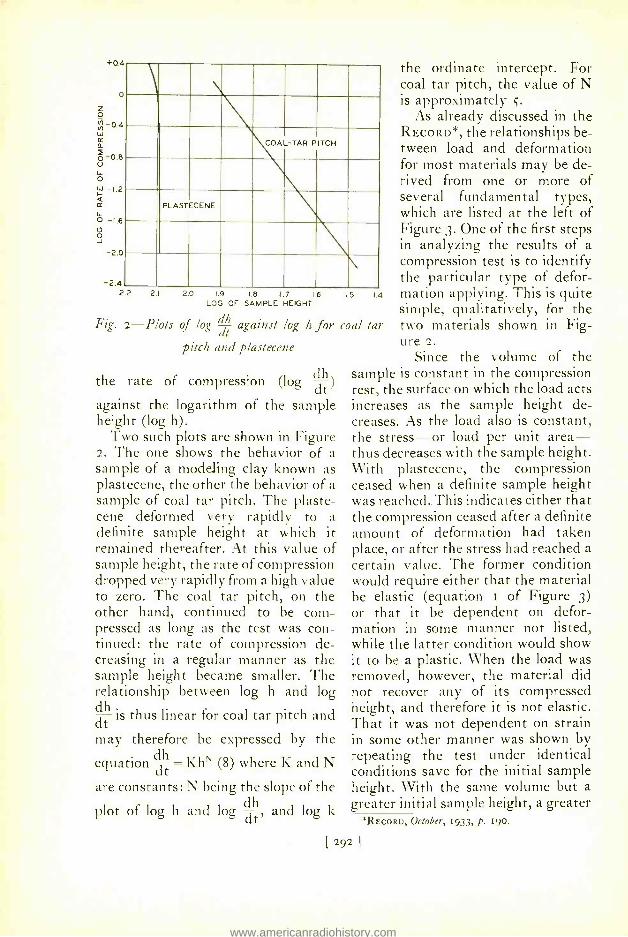
Fig. 2 -Plots of log dt against log h for pitch and plastecene
COAL -TAR PITCH
PLASTECENE
the rate of compression (log dt ) against the logarithm of the sample height (log h).
Two such plots are shown in Figure 2. The one shows the behavior of a sample of a modeling clay known as plastecene, the other the behavior of a sample of coal tar pitch. The plaste- cene deformed very rapidly to a definite sample height at which it remained thereafter. At this value of sample height, the rate of compression dropped very rapidly from a high value to zero. The coal tar pitch, on the other hand, continued to be com- pressed as long as the test was con- tinued: the rate of compression de- creasing in a regular manner as the sample height became smaller. The relationship between log h and log
dtis thus linear for coal tar pitch and
may therefore be expressed by the
equation dh = KhN (8) where K and N
are constants: N being the slope of the
plot of log h and log dt, and log k
the ordinate intercept. For coal tar pitch, the value of N is approximately 5.
As already discussed in the RECORD *, the relationships be- tween load and deformation for most materials may be de- rived from one or more of several fundamental types, which are listed at the left of Figure 3. One of the first steps in analyzing the results of a compression test is to identify the particular type of defor-
15 1.4 mation applying. This is quite simple, qualitatively, for the two materials shown in Fig- ure 2.
Since the volume of the sample is constant in the compression test, the surface on which the load acts increases as the sample height de- creases. As the load also is constant, the stress -or load per unit area - thus decreases with the sample height. With plastecene, the compression ceased when a definite sample height was reached. This indicates either that the compression ceased after a definite amount of deformation had taken place, or after the stress had reached a certain value. The former condition would require either that the material be elastic (equation i of Figure 3) or that it be dependent on defor- mation in some manner not listed, while the latter condition would show it to be a plastic. When the load was removed, however, the material did not recover any of its compressed height, and therefore it is not elastic. That it was not dependent on strain in some other manner was shown by repeating the test under identical conditions save for the initial sample height. With the same volume but a greater initial sample height, a greater
*RECORD, October, 1933, p 190.
coal tar
1 292
www.americanradiohistory.com

amount of deformation is required to reach the same final height. Since the same final height was reached re- gardless of the initial height, however, the material cannot be one for which the stress depends on the strain.
Plastecene is thus shown to be a pure plastic, deforming rapidly as long as the stress exceeds a constant value and then abruptly ceasing to deform. If it had been a plastico- viscous material, it would have shown a more gradual approach to the final height. Having identified the type of deformation, one may compute the value for final sample height (ho) in terms of the load, the volume of sam- ple, and the yield value, C, from equation .}. This relation is given as equation io in Figure 3. Thus from this simple compression test not only may the law of deformation for this material be determined, but the yield value may be found as well, which makes it possible to predict the be- havior of the material under any con- ditions.
To determine the type of deforma- tion holding for the coal tar pitch, a similar analysis may be undertaken. As al- ready pointed out, the stress decreases with the sample height be- cause the area over which the constant load is applied in- creases as the sample height decreases. Since the rate of compres- sion, as shown by the curve of Figure 2, also decreases with the sample height, it is evident that the rate of compression de- creases with the stress. This type of deforma-
TYPE
ELASTIC
2 VISCOUS
3 INERTIA
4 PLASTIC
S ELASTICO -PLASTIC
6 QUASI- VISCOUS
tion is that of a viscous material, given as equation 2 in Figure 3. By mathe- matical manipulation of equation involving an integration and an analy- sis of the conditions existing in the compression test, equation 9 of Figure 3 is derived. This is obviously of the same form as equation 8, appearing in the text on page 292, which was obtained from the plot of Figure 2.
For equation 8 to apply to a purely viscous material, the constant N must be equal to 5, as shown by equation 9, and the constant K must depend upon the load and sample volume. That N for the coal tar pitch is equal to 5 has already been pointed out, and that K depended upon the load and volume in the required manner was proved by additional tests in which both of these parameters were changed. In this case, also, therefore, it is possible from the compression test not only to show that coal tar pitch is a viscous sub- stance, but to determine the coeffi- cient of viscosity, ,, so that the behavior of the material under any conditions may be determined.
The stress -strain relationships for
BASIC EQUATION COMPRESSION TEST
F=)LS (I)
d5 dh 2WWh F =que (2)
F =mom (3)
dt 3)V2 (9)
FC (4) hoz- 2nWC UO)
F=)rS (S< (5) F=C(S>SC)
I
F-a¡ \dtYb (6)
7 PLASTICO- VISCOUS F =C+,) dL (7)
bal xbal) dh if i 3b+1 ib Wbh Z (II) dt b+2 \ 2.35 /
V
dh \1 d! 1)2s ( Y Wf5/2/
(12)
Fig. 3 -On the left are seven basic types of stress -strain re- lationships, and on the right the equations derived from four of these relationships applying to compression between
parallel plates
,931
www.americanradiohistory.com

these two substances are of simple forms, but the general method of analysis of the results of compression tests is applicable to the more compli- cated forms as well. In Figure 4, for example, are given curves obtained from the compression test applied to three cable insulating compounds at
+0.5
z o
ó
-2.5
--O
Figure 4. For these curves the ex- ponent N, of equation 8, is a function of b of equation 6. Here also since N is known, being 4.72 for B and 6.30 for C, both "a" and "b" may be calculated, which allows the be- havior of the material to be predicted for any conditions.
By similar methods it is pos- sible to show that the ma-
MEER N\\ MINIM ui ,.
SLOPE = 6.30
2.2 2.1 2.0 1.9 1.8 17 16 LOG OF SAMPLE HEIGHT
Fig. 4- Curves of log h and log dt obtained from compression tests on three cable insulating com-
pounds
15
terial yielding curve A of Figure 4 is plastico- viscous, corresponding to equation 7 of Figure 3. This equation, trans- formed to apply to the com- pression test, becomes equa- tion 12. Thus materials which are viscous, plastic, quasi - viscous, or plastico- viscous- equations 2, 4, 6, and 7 of Figure 3 -may be conven- iently studied by means of the
1.4 1.3 parallel plate plastometer. From tests on them with this apparatus, the constants in their basic equations may be determined and thus the be- havior of the materials under
any conditions may be determined. For materials having an elastic com- ponent, however, such as those de- scribed by equations i or 5 of Figure 3, it is preferable to apply the more familiar type of compression test in which the load is applied gradually. The only basic type of deformation not so far discussed, equation 3 of Figure 3, is of only theoretical im- portance as applied to a test of this type.
Materials are sometimes encount- ered whose stress -strain relationships are more complex than any of the types listed in Figure 3. Rubber com- pounds, for example, may have elas- tic, plastic, and viscous components, and the appearance of the three types and their relative magnitudes gener-
extrusion temperatures, about 8o° C. Two of these, B and C, are straight lines -thus indicating a relationship between sample height and rate of compression as given in equation 8. The constant N for these substances, however, is not 5. They are not pure viscous substances, therefore, but belong to one of the other types for which stress is dependent on strain velocity, such as the group of quasi - viscous materials whose stress -strain relationship is given by equation 6.
By mathematical manipulation similar to that which produced equa- tion 9 from 2, an expression applicable to the results of the compression test may be derived from equation 6. The result is given in equation II, and this equation fits curves B and C of
[294
www.americanradiohistory.com

ally depends on temperature. Their behavior is thus too complex to be described by any equation so far avail- able. The best that can be done is to recognize their type of deformation over limited temperature or strain ranges. Also the yield values of some materials which are predominantly plastico- viscous, such as lead alloys for cable sheath, can be shown to de- pend on the amount of deformation instead of being constant.
Most soft solids, however, conform closely enough to the simpler types
discussed above to permit their be- havior to be described in terms of constants which may be evaluated. By an analysis of data obtained from compression tests, the viscosity (i,) of viscous materials, the yield value (C) of plastics, and the pairs of con- stants (a, b, and c, ,,) characterizing quasi- viscous and plastico- viscous sub- stances can be determined. With these constants known, the behavior of the materials under any specified conditions of service may readily be predicted.
India and the United States Linked by Telephone
Kipling to the contrary notwithstanding, East and West met when one of the transatlantic radio telephone channels between the United States and England was linked with a short -wave channel connecting London with radio telephone stations near Bombay. Since May 9, regular telephone communication between the United States and India has been available through the co- operation of the American Telephone and Telegraph Company and the British Post Office.
In addition to United States telephones, the service em- braces those in Canada, Cuba and Mexico. At the distant end it will for the present be limited to the telephone sys- tems of Bombay and Poona. A three -minute conversation between New York and either of these cities costs $45, with $15 for each additional minute.
India, the fifty-second country to be brought within telephone reach of the United States, is the third country of Asia to be included in the network. Connections with Siam and Palestine have already been established. Ameri- can subscribers may now talk with more than 92 per cent of the world's telephones, as well as twenty liners on the high seas.
www.americanradiohistory.com

Uses of Filters in Carrier Systems By R. H. MILLS
Telephone Apparatus Development
WHEN you talk over a long distance circuit, the wires over which your conversa-
tion travels between the two terminal cities may be carrying other conversa- tions in addition to yours. At the same time they may also be carrying a number of telegraph communica- tions as well. In spite of this fact you do not hear any of the other con- versations nor are you disturbed by the telegraph signals. Each conver- sation proceeds, as far as the listeners at the two ends of the line are con- cerned, as though the line were being used exclusively by themselves. This multiple use of a single line is made possible by the fact that while a telephone conversation requires a group or band of frequencies about 2,500 cycles wide, an open -wire tele- phone line will transmit efficiently frequencies of 5o,000 cycles or more. To take advantage of this property of telephone lines, means are needed at the sending end for distributing the 2,500 -cycle bands carrying individual conversations over the frequency range that the line can transmit, and then at the receiving end for identify- ing these bands and returning them to their original range of from about 250 to 2,750 cycles. The various voice bands are raised to higher frequency positions by modulation in a vacuum tube circuit and the return to their original position is brought about by the inverse process of demodulation. The important function of discrimi-
nating between the various bands, however, is accomplished by electric filters, one of the developments that have made possible the use of carrier telephony now widely employed for long distance communication.
There are several types of filters, but those most commonly employed in carrier systems are of the low -pass, high -pass, and band -pass types. Typi- cal frequency -loss characteristics of these three types are shown in Figure i. The abscissa scale for these graphs is frequency and the ordinate scale transmission loss, usually measured in db. The curve at the top of Figure i, for example, shows that a low -pass filter will transmit with very little loss all frequencies below f, known as the cut -off frequency, but that it greatly attenuates all frequencies above this value. The high -pass filter has inverse characteristics -passing the higher frequencies and attenuating the lower, while the band -pass filter combines the properties of both -thus readily passing the band of frequencies be- tween fi and f2 and greatly attenuat- ing all frequencies below and above these values.
In addition to these transmission characteristics, carrier system filters that are to be connected in parallel and employed to separate channels or groups of channels are usually de- signed to present a high impedance over their suppression range to cur- rents entering from the line. A low - pass filter of this type, in addition to
[296]
www.americanradiohistory.com

attenuating any high frequencies that enter it, presents a high impedance to such frequencies so that only a negligible amount of high frequency current ever enters it from the line. Comparable characteristics are given to the two other types. It is this com- bination of characteristics that makes filters so uniquely applicable to carrier communication.
Because of the losses incurred by currents in passing over long lines, amplification must be resorted to at intervals along the circuit to restore the currents to approximately their original amplitudes. This requires that repeater stations be provided every few hundred miles along a line, where vacuum tube amplifiers inject new energy into the weakened signals. Since vacuum tubes are essentially one - way devices, allowing energy to flow through them in one direction only, it has been customary at such repeater stations to employ two amplifiers: one serving for amplification in each direction. To direct each telephone channel into the appropriate amplifier, all channels in one direction, for example from east to west, are trans- mitted at frequencies below a certain value, and all those going in the other direction, at frequencies above this value. Thus the eastbound and west- bound, or outgoing and incoming components of a long- distance con- versation are carried by different bands of frequencies.
The arrangement of filters at a re- peater station which permits this two - directional amplification is shown in Figure 2. The line coming from each direction is divided at the repeater through which the low and high fre- quencies, carrying telephone channels in the two directions, pass along sepa- rate circuits and through separate amplifiers. This separation into two
groups of frequencies is accomplished by high -pass and low -pass filters, which because they separate channels proceeding in different directions are called directional filters.
Low -frequency currents, for ex- ample, arriving at point E from the east cannot enter the upper branch at the repeater station because the high -pass filter H blocks them, but they readily pass through the low - pass filter L into the lower branch. Here they are amplified, and then pass through another low -pass filter to the point W where they continue out on the west -bound line. They cannot go
N o J
LOW PASS
HIGH PASS
BAND PASS
FREQUENCY
Fig. i- Transmission characteristics of the three types of filters commonly employed in
carrier systems
[297]
www.americanradiohistory.com

CHANNELS IN J
AM PLI CHANNELS
OUT
HIGH -PASS INPUT DIRECTIONAL LOW -PASS
FILTER FILTER
W
rn
H
£
1.
£
AMPLIFIER
O
HIGH-PASS OUTPUT DIRECTIONAL
FILTER
H
FREQUENCY
L L
LOW -PASS OUTPUT LOW-PASS INPUT DIRECTIONAL AMPLIFIER DIRECTIONAL
FILTER FILTER
AMPLIFIED CHANNELS
OUT
E
HANNELS IN
Fig. 2- /lrrangement of filters at a repeater station which permit east -bound and west- bound conversation to be separated and amplified independently
from W up into the upper branch of the repeater station because they are blocked in this direction by the high - pass filter H. In a similar manner east- bound currents entering the repeater station at W pass along the upper branch and out on the line at E. On the section of the line to the west of W or to the east of E, however, currents of both groups of frequencies are found, although their flow of energy is in opposite directions.
In the high frequency, east -bound branch there appears a third filter, 1,
which has no equivalent in the west- bound branch. This is a low -pass filter but its cut -off frequency is above the highest frequency normally trans- mitted. Sometimes the circuit layout in a central office is such that, in the east -bound branch, an undesirable high- frequency feed -back and "sing- ing" around a repeater, or between two repeaters, would occur were it not for the high- frequency loss interposed by this low -pass filter. In the west- bound branch, such frequencies are naturally eliminated by the low -pass directional filters.
Directional filters are employed at the terminals of the line, to separate the east- and west -bound group of frequency bands, but in addition band pass filters are required to separate the individual channels in each group. A diagram showing the arrangement of a west terminal for a carrier system having three communication channels in each direction is shown in Figure 3. A single two -wire circuit connects the subscriber's station to the outgoing toll office, but here each line is divided into an outgoing and incoming circuit as at the repeater stations. Since the frequencies at this point are all in the voice range, however, the separation of incoming and outgoing conversa- tion is secured by hybrid coils.* From the hybrid coil each outgoing circuit passes to a modulator where as a result of modulation with a carrier frequency two major side bands ap- pear, one just above, and the other just below the carrier frequency as well as a number of other minor
*A balanced, three -winding transformer. This method of directional separation is described in the RECORD for September, 1931, p. 6.
[298]
www.americanradiohistory.com

products. From the modulator the circuit goes to a band pass filter which selects one of the major side bands for transmission and rejects the other side band, the carrier, and the minor products. A similar process is under- gone by the other two channels. These three bands selected for transmission, which come from the three trans- mitting band pass filters designated as a, b, and c, are then united in a single circuit and amplified. From the amplifier they go through a high -pass directional filter out onto the trans- mission line.
In the case of transmission from the east terminal of the line a similar modulation and selection of frequen- cies takes place, but here the outgoing conversations are transmitted by the lower frequency channels and enter
HYBRID COILS
TRANSMITTING CHANNEL
MODULATORS FILTERS
-II
..1 j
N o O
b
C
b' c'
the line through a low -pass directional filter. These conversations, arriving at the west terminal, cannot pass along the upper branch because they are blocked by the high -pass filter. They therefore pass through the low -pass directional filter in the lower branch and then through the receiving ampli- fier. Leaving the amplifier the three bands are separated by a group of receiving band pass filters, a', b', and c', and then each is passed to a de- modulator. These, by demodulation with the same carrier frequency that was used to produce them at the other end of the line, reconvert them to the voice frequency range. In the de- modulation process, however, unde- sired high frequency products also are produced but these as well as the carrier are eliminated by the de-
TRANS- HIGH -PASS MITTING D RECTI ON AL
AMPLIFIER FILTER
d' d
H
FREQUENCY
L C'
b' - L L'
RECEIVING LOW -PASS AMPLIFIER DIRECTIONAL
L' a' FILTER
DEMODULATOR DEMODU- RECEIVING LOW -PASS LATORS CHANNEL FILTERS FILTERS
E
(CHANNELS OUT
OPEN -WIRE
CHANNELS LINE
IN
Fig. 3- AIrrangements of filters at the west terminal which not only separate the west-
bound and east -bound conversations but also combine or separate the individual out- going or incoming conversations respectively
[299]
www.americanradiohistory.com

modulator low -pass filters which have cut -offs such that only the desired voice currents are passed. These re- produced voice- frequency currents then pass to their respective telephone stations through hybrid coils and subscribers' lines.
An ordinary telephone line may carry simultaneously d. c. telegraph and an ordinary telephone channel as well as the carrier channels. Associated with them are other selective ap- paratus such as composite sets, line filters, and equalizers. These in no way affect the basic function of the filters of the carrier telephone system, however, and are omitted in the dia- gram for the sake of simplicity.
The primary function of filters in a carrier system is thus to separate the various frequency bands at repeater stations and at terminals. In a three - channel system each of the three con- versations is carried by two frequency
bands: one carrying the conversation from west to east and the other, that from east to west. The three east -bound conversations are carried at higher frequencies than the three west- bound, but all are carried concurrently by the same pair of wires. At repeater sta- tions the east -bound and west -bound groups are guided by filters into sepa- rate amplifiers, and pass through the repeater in opposite directions, but at each end of the repeater the two groups of channels are combined. At terminals filters are similarly em- ployed to guide the incoming chan- nels to their common amplifier and to guide the outgoing channels from their common amplifier to the line. In addition filters are employed to separate the three conversations after they have been amplified at the incoming end and to remove all un- wanted frequencies which may have arisen at the outgoing end.
www.americanradiohistory.com

Mushrooms and Maintenance By R. H. COLLEY
Outside Plant Development
CCORDING to the story, Alice had been running through the woods and had paused to rest
near a large mushroom. Under the dramatic conditions of the experiment the mushroom was as tall as Alice herself. It may be assumed that she did not know it was a fungus. She probably had never heard of biology. But she was in a most unique position to get a proper perspective of that particular mushroom, and she pro- ceeded to examine it from all sides. The umbrella -like top of the mush- room possessed very special powers. She found that a little bit taken from one side of it would make her grow tall, and that a little bit from the other side would make her grow short; and that by properly balancing the amounts of each piece she could keep herself just about the right size. It is
small wonder, under the circum- stances, that the mushroom assumed such a large though temporary im- portance in Alice's eyes.
Outside of the fable such oppor- tunities for gathering information about fungi are likely to be confined to the realms of the imagination. For- merly the evanescent fairy rings of toadstools in moonlit meadows were the arenas for the sports and games of elves and gnomes and dwarfs. Nowadays these same fairy rings form their strange circles in the grass to spoil the turf on putting greens. The fact that mushrooms appear for a time and then are gone gives them a sort of will -o'- the -wisp character. They are, however, very real.
If for convenience all plants be divided into two groups, those having the green coloring matter called
[ 301 1
www.americanradiohistory.com

chlorophyll on the one hand, and those that do not have it on the other, we may define the position of the fungi by saying that they belong to the latter group. The two groups are continually in opposition. With the aid of chlorophyll and light, and the substances found in air, water, and soil, the green plants make and store up a food supply. Green plants are builders. Fungi, generally speaking, are destroyers or scavengers. Lacking chlorophyll they are dependent for their food supply on the tissues and stored substances made by the green plants. They are often classed, there- fore, either as parasites or sapro- phytes, depending respectively on whether they attack living plants or simply break down the non -living product of the green plants. The forms of fungi are myriad, varying all the way from minute, single -celled organisms, to giant shelf -like brackets. The latter belong in the great group which includes the mushrooms and their relatives, and it is this group which is of special interest to those concerned with Outside Plant.
Certain mushrooms and many
forms of bracket fungi are the most important wood destroyers in the world, probably not excepting fire and man. After a tree reaches a certain age it becomes more and more suscep- tible to infection by such fungi. They attack any exposed sapwood, and they gain entrance to the heartwood through wounds or along old branch stubs. Once established they proceed slowly but surely to turn the wood back into the elements from which it was created. Other fungi, usually dis- tinct as far as species is concerned from those that attack the wood of the living tree, are lying in wait to attack the wood of the tree as soon as it is sawed into lumber or cut and peeled for use as a pole.
Given a potential food supply, such as the sapwood of southern pine, there must be a sufficient amount of moisture present, and a sufficient amount of warmth, before the fungus can attack the wood at all; and the warmth and moisture conditions there- after determine largely the rate of growth and the degree of destruction. Of the two factors, moisture and warmth, moisture is the more im-
Fig. T. Mushrooms and maintenance -a mural in miniature
A. The life cycle of the mushroom is made up of two alternating stages, an indefinite vegetative stage, and a relatively short -lived fruiting stage. In the course of the cycle the fungus filaments (mycelium) mass to- gether and from the tangle the full -sized mushroom develops.
B. A longitudinal vertical section of the mushroom. Thin plates called gills hang from the under surface of the cap.
C. The surfaces of the gills are covered with stubby cells that bear the spores.
D. An enlarged view of a part of one of the gills showing the spore- bearing cells (a), and the spores (b).
E, F, G. The spores ripen on the gills and are then carried by the wind to the ground, or to some likely resting place such as a check in the pole G. The checks in the surface of the pole G, serve as ports of entrance to the inner sapwood and the heartwood of the pole.
H. Germinating spores. The germ tubes de- velop into filaments that either spread through the soil and into the below ground section of pole F, or infect the upper part of the pole directly through a check.
I. A diagrammatic representation of a mycelium of the fungus working its way through the wood cells. Compare Figure 3. 7. The tip of an advancing mycelium fan. Compare Figure 2.
[ 303 I
www.americanradiohistory.com

portant. For instance, thoroughly wet or thor- oughly dry wood will not rot. There is too much moisture in the one case, and too little in the other. Cold slows down or stops fungus activity, but low temperatures rare- ly kill. Favorable growth temperatures range generally be- tween 700 and roo° Fahrenheit. Higher temperatures retard the growth; and more intense heat kills the organism. Moist heat kills more quickly than dry heat.
With this back- ground of generalities, a more specific descrip- tion of the fungus life cycle may be intro-
Fig. 3 -This section of an infected piece of southern pine wood, cut in a radial plane, shows the tubular wood cells that run lengthwise in the tree (a), a patch of ray cells (b) that run radially from pith to bark, and the filaments of the attacking fungus (c). The elliptical bodies in the wood
cells (d) are bordered pits, or openings, that lead from one cell to another
duced. The simplest unit in this life cycle is a single cell, or spore, that cor- responds by analogy to the seed of green plants. The spore germinates, if the moisture conditions are favor- able, by sending out one or more delicate germ tubes. Germination may be said to correspond to the sprout- ing of the seed. If germination has taken place on the ground the germ tubes lengthen out into filaments that branch and rebranch among the soil particles. Food is probably obtained by absorption from the material in solution in the soil water or by direct attack on plant debris in the soil. If a spore happens to be blown into a check in the surface of a pole, or if it is drawn into the check by
Fig. 2 -In this culture, a wood -destroying fungus is growing on an agar jelly on top of which is placed a thin slab of wood. The mycelium of the fungus is spreading in fan-
like wefts over the surface of the wood
[304
www.americanradiohistory.com

capillarity, germination may take place under conditions that make it possible for the germ tube to find its way into the cells of the wood. If there is enough water in the wood, say 25 or more per cent, based on the oven dry weight of the wood, the germ tube develops into a branching system of fungus filaments (my- celium). At first the growth of these filaments depends upon the reserve food material in the spore. Then, as they become longer and longer, they bore through the wood cells and begin to destroy the cell walls.
These walls are laminated struc- tures made up of cellulose and lignin. Just how the fungus breaks down these substances is not clearly understood. It seems probable that enzymes are produced locally at the tips of the filaments and that these enzymes soften the wall so that the filaments can bore through from one cell to another. The destruction process sug- gests a catalysis. In the advanced stages of decay the cell structure of the wood becomes more or less com- pletely disintegrated.
The wood in that part of a pole in contact with the ground probably be- comes infected by fungus filaments that are present in the soil. Above ground the infection appears to result from the germination of spores carried by the wind, by rain water, by birds and animals, and by insects.
All the time the fungus is in the filamentous form, and while it is actually breaking down or rotting the wood, it is said to be in the vegetative stage. After the rot has become well advanced the filaments may or may not mass together. If they do, and the moisture conditions are still favorable, a pronounced change in the behavior of the filaments takes place. They merge into a tangled mass; and
instead of remaining microscopic threads, hidden away from the light, they begin to work to the outside of the pole. From the massed filaments a typical mushroom may appear over- night, to remain for a short time before it is eaten by insects, or before it dries and is blown away by the wind. Before it is destroyed, however, it produces millions of spores, a few of which may in their turn, if the con- ditions are right, germinate and start another revolution of the life cycle.
There is a marked difference in the virulence of wood- destroying fungi. A few appear to be omnivorous. Others are limited to certain woods.
Fig. 4- Localized "pipe rot" is here shown in the heartwood of a northern white cedar pole. Similar localized rots occur in cypress and redwood. They rarely spread after the
tree is felled
Generally speaking, the fungi that attack chestnut, or cedar, will not attack pine, and the common fungi on pine will not attack chestnut and cedar. There are exceptions to the general rule. The woods themselves vary in their natural resistance to at-
www.americanradiohistory.com

tack. The sapwood of all species is non -durable. The heartwood on the other hand is relatively durable. The heartwood of the cedars is among the most durable of woods; the heart- wood of chestnut ranks high for dur- ability among the woods of broad- leaf trees; and the heartwoods of southern pine and Douglas fir are fairly durable if they are kept from contact with infected sapwood.
It so happens that the cedars and chestnut have a relatively thin sap- wood layer surrounding the durable heartwood. The depth of this layer in chestnut averages only about inch; in western red cedar it averages ap- proximately .65, and in northern white cedar approximately .S5 inch. In Douglas fir the sapwood on pole size timber is a little more than twice as thick as the sapwood of western
Fig. 5- Chestnut poles occasionally rot across the whole diameter. Rots of this type cannot be controlled by treating the butts of the poles with creosote because the infection
works from the inside out
cedar. Lodgepole pine sapwood has about the same thickness as Douglas fir. The sapwood of southern pine poles averages about 3.2 inches deep. It may be assumed that this sapwood is a most easily available food supply for fungi. This is another way of say- ing that the sapwood is soon attacked and destroyed under conditions favor- able to fungus growth. Infection may take place while the poles are lying in the woods or in storage piles in yards of the pole producers. In fact infection is so general that it may be regarded as inevitable unless certain precau- tions are taken. These precautions are usually aimed at controlling the moisture conditions, and that amounts to getting the water out of the sap- wood as soon as it is practicable to do so. The faster the sapwood dries the less chance there is of infection; and if the wood is once dried and then kept dry it is not likely to rot, be- cause the moisture content is too low to promote fungus growth.
All things considered, it would ap- pear to be easier to dry out the thin sapwood of the cedars and chestnut than to dry out the sapwood of southern pine, and generally that is the case. However, if a dry pole is placed in the ground two sets of moisture conditions arise. The sap- wood on the part of the pole above ground becomes alternately wet and dry according to the weather condi- tions, while the sapwood on the part of the pole below ground is kept moist by water in the soil. For a time the sapwood in the upper part of the pole may be resistant to fungus attack be- cause of its relative dryness, but the moisture and food supply require- ments of the fungus are met in almost ideal fashion in the sapwood below ground. Except when the ground is frozen, or in the cold weather of
[ 306 ]
www.americanradiohistory.com

spring and fall, the temperature con- ditions are favorable for growth. The result is a fairly rapid disintegration of the moist sapwood. Obviously the pole user, in his fight against decay, cannot depend on controlling moisture content. There is only one other way to handle the situation and that is to poison the food supply. So it appears that as far as fungi are concerned a relatively simple biological fact is the basis of the wood -preserving indus- try, whose business it is to make wood unpalatable to fungi.
The most commonly used wood preservative is coal tar creosote. Durable woods like cedar and chest- nut are butt treated by soaking the butt ends of the poles, up to about one foot above the ground line, in creosote. Lodgepole pine for use in the relatively dry mountain states is also butt treated because the sapwood on the part of the pole above ground does not hold enough moisture to satisfy the water requirements of wood -de- stroying fungi. Southern pine and Douglas fir are treated full length by impregnation with hot creosote under pressure, the purpose being to pene- trate as much of the sapwood as practicable.
Such preservative treatments are
absolutely necessary if the poles are to give long service in the lines, all be- cause, in nature's scheme of things, certain non -green plants called fungi are continually tearing down the wooden products made by the activi- ties of the cells of certain green plants
Fig. 6 -This cross section of a creosoted southern pine pole shows decay of the un-
treated sapwood
called trees. Man interferes in the biological battle, but his best efforts result in merely deferring the victory by the persistent cobwebby filaments of the fungus.
Alice's adventure with the mush- room seems not so wonderful after all.
www.americanradiohistory.com

Delayed Speech By C. N. HICKMAN
Acoustical Research
N any form of speech transmission some delay is involved because a definite time is required for the
transmission. This applies whether the speech travels directly through the air or, converted to electrical cur- rents, passes over wires. In air, sound travels at a rate of about 1,100 feet per second, so that if you stood 1,100 feet from a person who was shouting to you, it would be one second after a sound left his lips be- fore it reached your ears. The speed of electrical transmission is much greater: under some conditions ap- proaching that of light. Electrical cir- cuits may be designed, however, to have quite an appreciable delay and such circuits have been found very helpful at times in improving tele-
308
phone communication. One use to which such circuits have been put has already been described in the RECORD.*
Where the delay required is short, less than a hundredth of a second, elec- trical delay networks are economical and very satisfactory. Their cost for longer delays, however, becomes ex- cessive. When delays of the magnitude of one second are required, therefore, other means of securing them must be sought.
One method takes advantage of the relatively low velocity of sound in air. The electrical speech currents are converted to sound by a telephone re- ceiver, and then the sound is allowed to travel in a tube long enough to
*RECORD- November, 1927, p. 80.
www.americanradiohistory.com

bring about the delay desired. At the far end of the tube the sound is re- converted to electrical speech currents by a transmitter. Such acoustical de- lay circuits have been built,* and used to some extent, but their size alone is sufficient to make them un- desirable for many purposes.
Another method of introducing an appreciable time of transmission is by use of mechanical delay circuits. Such a delay circuits as demonstrated by S. P. Grace in many of his talks, con- sists of a long coiled spring suspended from its two ends. In this case the electrical speech currents are con- verted to mechanical vibrations which pass along the coiled spring at a rela- tively low speed, and are reconverted to electrical currents at the distant end. This method also has certain objectionable features which make it unsatisfactory for general application.
Still another method of obtaining delay, where the actual time intro- duced may be of almost any long du- ration, with equal facility, is to record the sound either on a photographic film or on a wax disk, and to reproduce it from the record after the desired delay period. This method is ordi- narily looked upon as a storing rather than a delaying because there is no transmission time involved. The over- all effect is the same, however, and where very long delays are required, the method is very useful.
So far, therefore, there are very satisfactory methods of securing de- lays of very short duration and of very long duration. Until recently, how- ever, there has not been any very satisfactory method applicable to the intermediate field. Although photo- graphic or disk recording would meet the electrical requirements, the amount
*RECORD -May, 1931, P. 430. tREcoKD- December, 1928, P. 147.
- -,1114.4...
of apparatus required is rather more than is desirable. A method has re- cently been developed by Bell Tele- phone Laboratories, however, by which delays of any value from a frac- tion of a second to several minutes, or even more, if necessary, may be ob- tained by the use of very simple equipment.
Like the photographic and disk method, it is essentially a recording and reproduction, but requires no intermediate processing. It utilizes the principle of magnetic recording sug- gested by Poulsen over thirty years ago. Delay apparatus, built for the Bell System exhibit in the Chicago Century of Progress International Ex- position, is shown in the photograph at the head of this article. A thin steel tape is passed between the poles of a pair of small electromagnets at a speed of about one foot per second. The speech current is flowing through the windings of these magnets, and producing a varying magnetization in the steel tape which corresponds to the speech current. At a short dis- tance from these recording magnets, depending on the delay to be secured, is a second and exactly similar set of magnets. As the steel ribbon, already magnetized in a pattern representing the voice currents, passes between the poles of this second set of magnets, it induces voice currents in their wind- ings corresponding to the magnetic pattern and thus to the original voice currents. In the circuit of the second set of magnets there are thus voice currents practically identical with those in the circuit of the first set, but following them after a number of seconds equal to the distance between the magnets in feet.
One of the great advantages of this method, in addition to the smallness and simplicity of the equipment, is
[3091
www.americanradiohistory.com

that the magnetism in the tape may be completely removed by passing the tape through a strong unvarying magnetic field. A set of magnets for eliminating the speech record from the tape is mounted just to the left of the recording magnets. This enables the same piece of tape to be used over and over again. By making the tape in the form of a loop, long enough to produce the required delay, the speech may be recorded on the tape, delayed the required interval, and then repro- duced. After this the record will be wiped out by the restoring magnets, and this process can be repeated in- definitely. Neither the photographic nor the disk methods lend themselves
readily to this continual re- recording. At the Century of Progress Expo-
sition, a concealed microphone, which is located near where visitors may speak to observe the echo, will be connected to the circuit of the re- cording magnet. Hidden in the wall some distance away will be a loud speaker associated with the repro- ducing magnets. Two seconds after a visitor has spoken a few words into the microphone, the loud speaker will repeat them to him. The effect is like that of an echo from a cliff a thousand feet away except that the sound re- turns not only increased rather than diminished in strength, but also with- out essential distortion.
Telephone Service Extended to Guatemala A third Central American country was given telephone
connection with North America when service was ex- tended on April 17 to Guatemala City. Guatemala is reached by a short -wave radio telephone circuit between stations of the Tropical Radio Telegraph Company at Guatemala City and the stations of the A. T. and T. Company at Miami, linked with the Bell System network. The service embraces all Bell and Bell -connecting tele- phones in the United States, Canada, Cuba and Mexico. The cost of a three -minute conversation between New York and Guatemala City is $21.
www.americanradiohistory.com

I m proved Current Control for Low Range Meter Calibration
By F. R. DENNIS Telephone Apparatus Development
FOR the development work car- ried on in the Laboratories large numbers of ammeters and volt-
meters are in almost constant use, and since decisions made and conclusions reached depend on the readings of these meters, it is essential that the meters give correct indications to the required precision or that their error be known. To insure this, it is standard practice to send all meters periodically to a central laboratory for calibration. All new meters enter- ing the building are subjected to a similar calibration before acceptance. To minimize the effort involved, it is very desirable to arrange the cali- brating equipment so that, without loss of precision, a minimum of time
is required for each calibration. With the object of improving the methods of calibrating low range direct -current meters - ammeters from 15 micro- amperes to 1.5 amperes, and volt- meters from i 5 millivolts to 0.15 volts -new current control equip- ment has recently been designed, which greatly simplifies and accel- erates the operation.
For calibrating meters of this type, there must be a source of current -for which a six volt storage battery is em- ployed-a current control arrange- ment, a standard of resistance, and a voltage measuring device, for which a Leeds and Northrup type -K potenti- ometer is used. Simplified schematics of the calibrating circuits for am-
[ 311
www.americanradiohistory.com

meters and voltmeters are shown in Figure i. Except when a complete calibration is requested, it is customary to calibrate all meters at full and half scale readings, and the function of the current control is to obtain the required de- flections accurately and rap- idly. In all calibrations the true value of current or volt- age is obtained from a po- tentiometer reading. For am- meter calibrations this reading is taken across a standard re- sistance, while for voltmeter calibrations it is taken directly across the terminals of the voltmeter. Although the value of the current flowing in the circuit is not employed in de- termining the correct reading of the meter, it must be ad- justable to 0.1% to be able to obtain the deflection desired, and it must not vary more than 0.05% while a reading is being made.
Previous practice has employed slide -wire rheostats for controlling the current, arranged in the circuit either as shown in Figure i or in a combi- nation of shunt and series resistances. To obtain 1.5 amperes in the circuit, the resistance must be only four ohms and to obtain an accuracy of 0.1% it
Fig. 2-ils formerly set up, the circuit employed slide wire rheostats and the complete equipment
covered the entire surface of a large table
must be adjustable to 0.004 ohms. To obtain 15 microamperes, on the other hand, 400,000 ohms effective series resistance is required. This wide range in resistance has required a considerable amount of space, as shown in Figure 2, and the time re- quired to change from the correct set -up for one calibration to that for
Fig. i- Typical calibrating circuits for ammeters, left, and voltmeters, right
[ 3172
www.americanradiohistory.com

1
another, and the time to obtain the correct current for any one calibration have both been longer than desirable. To overcome these objectionable fea- tures, sets of constant impedance net- works have been provided which pro- duce any desired attenuation over the entire range by the operation of two rotary switches. The circuit arrange- ment is shown in Figure 3.
The ratio of the smallest to the largest current -15 microamperes to 1.5 amperes -is i to ioo,000, and since the loss in db required to reduce the largest current to the smallest is twenty times the logarithm of the ratio of the currents, the total loss required is loo db. By employing nine L type networks, ranging in loss pro- duced from Io to 90 db, and a set of ten L networks, producing losses of from i to io db, the current may be reduced in one -db steps over the entire wo db range by merely select- ing the proper tens and units net-
works. The desired loss is selected by operating two rotary switches, one, S -i, selecting the tens network and the other, S -2, the units network. The requirement of being able to set the current to o.i% means an adjustment to a little less than .009 db, and the final fractional db adjustment is ob- tained from a slide wire resistance net- work, S -3, directly in series with the battery. All of the L type networks present the same impedance to the battery so that the action of the slide wire resistance is not affected by the total loss in the output, and is de- signed to be adjustable to .o5% or better. This additional allowance in control allows the meter to be set to the desired reading rapidly and with ease.
To cover the required range of am- meters, various sizes of standard re- sistances are required. With the earlier system, these were of the Bureau of Standards type, which are
connected in the cir- cuit through mercury contacts. These have
80 R
been replaced in the 90_` new equipment by
small wound units, ad- justed to .o5% and permanently con- nected in the circuit. The one required is selected by a rotary switch, S -4. When the greatest possible ac-
S2 curacy is required the Bureau of Standards resistances can still be
0.1 connected into the cir- cuit.
With this arrange- ment the full scale de- flection of the meter under test is quickly
Fig. 3-Simplified schematic of the new calibrating circuit and accurately ob-
313
S4
AMMETER BEING
CALIBRATED
1000
www.americanradiohistory.com

tained. To avoid the necessity of re- setting the rotary switches for the half scale deflection, a small switch - marked K on the diagram -is pro- vided which throws in an additional L network of 6 db loss, which cuts the current to one half its previous value. After the calibration has been made at full scale, this switch is operated which -after a slight readjustment
of R- allows the calibration to be made at half scale.
The new equipment, shown in the photograph at the head of this article, not only occupies considerably less space than the old but requires much less time in adjusting the current to secure the proper deflection of the meter, and thus greatly expedites the calibration.
Music and Science "One element in all scientific progress is its application
to our life. Here, in my opinion, this new method of con- veying sound to many other places over great distances without distortion or changing the character of the original music, without any kind of electrical disturbance or static -is of national importance.
"For example there are symphony orchestras in only about ten or fifteen cities in the United States and there are thousands of other cities and towns with no orchestra. At the same time the cities which have the orchestras are at the present time finding it difficult to support them. By this method, cities like Cleveland, or Detroit or Chicago, for example, which have fine symphony orchestras, could send out to all the neighboring towns and cities within a generous radius, the symphonic music they create, so that in all these towns and cities music lovers can hear the music exactly as in the original.
"This will enable the city having the orchestra to enlarge its public and improve its orchestra in quality, and will enable other cities which have at present no orchestras, to create them and send out their music to neighboring towns and cities without distortion or any lowering of quality. By this means we could zone the whole country and have a first -class symphonic orchestra in the most important city of each zone, thus giving variety to our music -more op- portunity to the generation of American musicians now growing up -more opportunity for the American com- poser to have his work heard -more opportunity to the new generation of American conductors -and more oppor- tunity to the music lover to hear many types of music variously played, and by comparison of these different methods, less standardization and more individuality."
LEOPOLD STOKOWSKI, at the Washington demonstration of orchestral reproduction in auditory perspective.
314
www.americanradiohistory.com
QINPWWW49M9119MMI9q949M9M19QP/Q:9
Contributors to This Issue
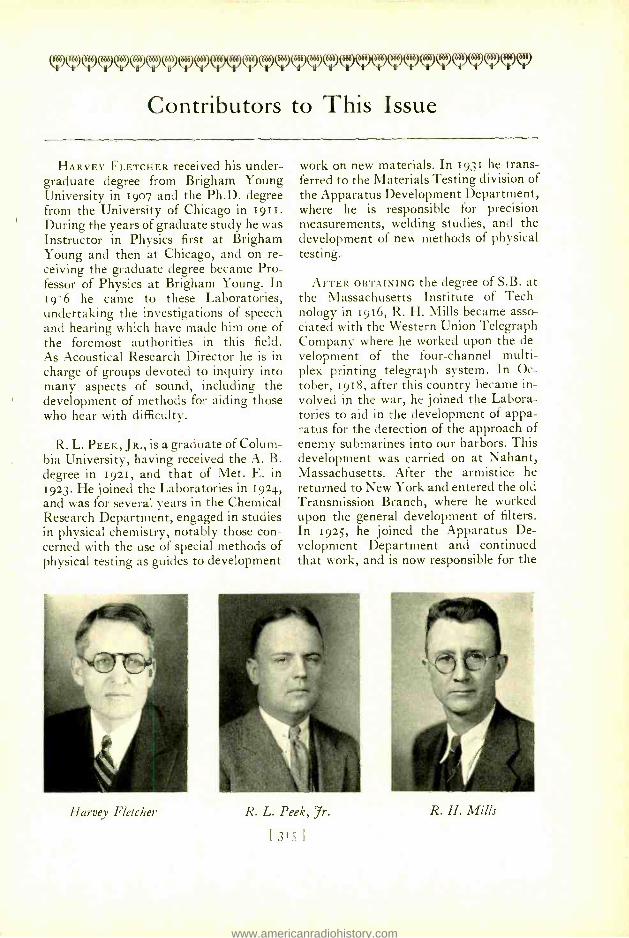
HARVEY FLETCHER received his under- graduate degree from Brigham Young University in 1907 and the Ph.D. degree from the University of Chicago in 1911. During the years of graduate study he was Instructor in Physics first at Brigham Young and then at Chicago, and on re- ceiving the graduate degree became Pro- fessor of Physics at Brigham Young. In 1916 he came to these Laboratories, undertaking the investigations of speech and hearing which have made him one of the foremost authorities in this field. As Acoustical Research Director he is in charge of groups devoted to inquiry into many aspects of sound, including the development of methods for aiding those who hear with difficulty.
R. L. PEEK, JR., is a graduate of Colum- bia University, having received the A. B. degree in 1921, and that of Met. E. in 1923. He joined the Laboratories in 1924, and was for several years in the Chemical Research Department, engaged in studies in physical chemistry, notably those con- cerned with the use of special methods of physical testing as guides to development
Harvey Fletcher
work on new materials. In 1931 he trans- ferred to the Materials Testing division of the Apparatus Development Department, where he is responsible for precision measurements, welding studies, and the development of new methods of physical testing.
AFTER OBTAINING the degree of S.B. at the Massachusetts Institute of Tech- nology in 1916, R. H. Mills became asso- ciated with the Western Union Telegraph Company where he worked upon the de- velopment of the four -channel multi- plex printing telegraph system. In Oc- tober, 1918, after this country became in- volved in the war, he joined the Labora- tories to aid in the development of appa- ratus for the detection of the approach of enemy submarines into our harbors. This development was carried on at Nahant, Massachusetts. After the armistice he returned to New York and entered the old Transmission Branch, where he worked upon the general development of filters. In 1925, he joined the Apparatus De- velopment Department and continued that work, and is now responsible for the
R. L. Peek, Jr.
X3151
R. H. Mills
www.americanradiohistory.com

R. H. Colley C. N. Hickman
development of carrier frequency filters for commercial systems.
AFTER GRADUATING from Dartmouth in 1909 and serving as instructor in biology from 1909 to 1910, R. H. Colley went to Harvard as Austin Teaching Fellow (Botany) and received his A.M. there in 1912. He returned to Dartmouth and taught biology for four years. In 1916 he entered the Division of Forest Pathology, Bureau of Plant Industry, U. S. Depart- ment of Agriculture in Washington, specializing in research on forest tree diseases, particularly white pine blister rust. From 1921 to 1928 he was in charge of the Madison, Wisconsin, branch of the Division of Forest Pathology, in coöpera- tion with the Forest Products Laboratory at Madison, working on causes and con- trol of deterioration of forest products. In 1928 he became a member of Bell Tele- phone Laboratories and has been engaged since then in Timber Products Engineer- ing. He received a Ph.D. degree from George Washington University in 1921.
C. N. HICKMAN received the A.M. degree at Clark University in 1917, and then engaged in ballistic research for the
F. R. Dennis
U. S. Government. At the close of the war he was employed at the Bureau of Standards in the Inductance and Capaci- tance Laboratory. He then returned to Clark University and received the Ph.D. degree in 1922 under Dr. A. G. Webster. Following a short period of service with the Navy Department designing sub- marine mines, he joined the Department of Development and Research of the A. T. and T. Company in 1924. In 1930 he joined the Technical Staff of the Laboratories where he has been making a study of magnetic recording.
F. R. DENNIS received the B.S. degree in E.E. from the State College of Wash- ington in 1929 and joined the Apparatus Development Department of the Labora- tories in August of that year. After spend- ing several months on inspection of new and repaired meters and other apparatus entering the Laboratories, he engaged for some time in making impedance and attenuation measurements on various samples of carrier cable. For the past two years he has been mainly concerned with the development of attenuators and at- tenuation measuring sets for use at radio frequencies.
www.americanradiohistory.com


![vwihgurU jI kw Kwlsw vwihgurU jI kI Piqh ]](https://static.fdocuments.net/doc/165x107/628c210ce8e1862abc3f3353/vwihguru-ji-kw-kwlsw-vwihguru-ji-ki-piqh-.jpg)