JEM-X: The X-RAY MONITOR ON INTEGRAL
12
JEM-X: The X-RAY MONITOR ON INTEGRAL C. Budtz-Jørgensen a ,N. Lund a , N. J. Westergaard a , S. Brandt a , A.Hornstrup a , I. Lundgaard Rasmussen a , S. Laursen a , R. Kristensen a , P. B. Mogensen a , K. Harbo Andersen a , I. Rasmussen a , J. Polny a , P. A. Jensen a , C. A. Oxborrow a ,J. Chenevez a K. Omø a , V. K¨am¨ arinen b , T. Andersson b , O. Vilhu c , J. Huovelin c , E. Costa d , M. Feroci d , A. Rubini d , E. Morelli d , A. Morbidini d , F. Frontera e , G. Zavattini e , V. Carassiti e , M. Morawski f , G. Juchnikowski f , V. Reglero g , J. Peris g , V. Collado g , J. M. Rodrigo g , F. Perez g , J. L. Requena g , S. Larsson h , R. Svensson h , A. Zdziarski j , H. W. Schnopper k a Danish Space Research Institute, Copenhagen, Denmark b Metorex, Espoo, Finland c University of Helsinki, Helsinki, Finland d Instituto de Astrofisica CNR, Rome, Italy e University of Ferrara, Ferrara, Italy f Space Research Center, Warsaw, Poland g University of Valencia, Burjassot, Valencia, Spain h Stockholm Observatory, Stockholm, Sweden i Copernicus Astronomical Center, Warsaw, Poland k Smithsonian Astrophysical Observatory, Cambridge, USA ABSTRACT The INTEGRAL X-ray monitor, JEM-X, (together with the two gamma ray instruments, SPI and IBIS) provides simultaneous imaging with arcminute angular resolution in the 3-35 keV band. The good angular resolution and low energy response of JEM-X plays an important role in the detection and identification of gamma ray sources as well as in the analysis and scientific interpretation of the combined X-ray and gamma ray data. JEM-X is a coded aperture X-ray telescope consisting of two identical detectors. Each detector has a sensitive area of 500 cm 2 , and views the sky through its own coded aperature mask. The coded masks are located 3.4 m above the detector windows. The detector field of view is constrained by X-ray collimators (6.6 ◦ FOV, FWHM). Keywords: JEM-X, INTEGRAL, X-ray astronomy, Micro strip detector 1. INTRODUCTION The primary instruments of the INTEGRAL payload are designed for detailed studies of celestial objects in the gamma ray region of the electromagnetic spectrum. The SPECTROMETER (SPI) covers the energy range 15 keV - 10 MeV and the IMAGER (IBIS) 20 keV - 10 MeV. To obtain a more complete picture of the physical conditions in the sources observed by the two main instru- ments, it is important to have simultaneous observations at both X-ray and optical wavelengths. The primary instruments are, therefore, augmented by an X-ray monitor, JEM-X, and an optical monitor, OMC. JEM-X provides spectral data in the 3-35 keV band and also provides arcminute imaging to separate the contributions from close lying sources. The photon detection system consists of two identical imaging Microstrip Gas Cham- bers (MSGC) that view the sky through a coded aperture mask. Specifications describing JEM-X are given in Table 1. The present paper will summarize the most important features of the JEM-X telescopes and discuss the performance of the instruments both before and after they were launched into space. The technical details of the JEM-X detector have been described by K¨am¨ ar¨ ainen et al. (1997), 1 and by Budtz-Jørgensen et al. (1997). 2 Those for the JEM-X mask are given in a paper of Ballesteros et al. (1997),. 3 Further author information: (Send correspondence to A.A.A.) A.A.A.: E-mail: [email protected], Telephone: 1 505 123 1234 B.B.A.: E-mail: [email protected], Telephone: +33 (0)1 98 76 54 32, Address: A Very Long Address, City, Country
Transcript of JEM-X: The X-RAY MONITOR ON INTEGRAL
JEM-X: The X-RAY MONITOR ON INTEGRAL
C. Budtz-Jørgensena,N. Lunda, N. J. Westergaarda, S. Brandta, A.Hornstrupa, I. LundgaardRasmussena, S. Laursena, R. Kristensena, P. B. Mogensena, K. Harbo Andersena, I.Rasmussena, J. Polnya, P. A. Jensena, C. A. Oxborrowa,J. Cheneveza K. Omøa, V.
Kamarinenb, T. Anderssonb, O. Vilhuc, J. Huovelinc, E. Costad, M. Ferocid, A. Rubinid, E.Morellid, A. Morbidinid, F. Fronterae, G. Zavattinie, V. Carassitie, M. Morawskif, G.
Juchnikowskif, V. Reglerog, J. Perisg, V. Colladog, J. M. Rodrigog, F. Perezg, J. L. Requenag,S. Larssonh, R. Svenssonh, A. Zdziarskij, H. W. Schnopperk
a Danish Space Research Institute, Copenhagen, Denmarkb Metorex, Espoo, Finland
c University of Helsinki, Helsinki, Finlandd Instituto de Astrofisica CNR, Rome, Italy
e University of Ferrara, Ferrara, Italyf Space Research Center, Warsaw, Poland
g University of Valencia, Burjassot, Valencia, Spainh Stockholm Observatory, Stockholm, Sweden
i Copernicus Astronomical Center, Warsaw, Polandk Smithsonian Astrophysical Observatory, Cambridge, USA
ABSTRACT
The INTEGRAL X-ray monitor, JEM-X, (together with the two gamma ray instruments, SPI and IBIS) providessimultaneous imaging with arcminute angular resolution in the 3-35 keV band. The good angular resolution andlow energy response of JEM-X plays an important role in the detection and identification of gamma ray sourcesas well as in the analysis and scientific interpretation of the combined X-ray and gamma ray data. JEM-X is acoded aperture X-ray telescope consisting of two identical detectors. Each detector has a sensitive area of 500cm2, and views the sky through its own coded aperature mask. The coded masks are located 3.4 m above thedetector windows. The detector field of view is constrained by X-ray collimators (6.6 FOV, FWHM).
Keywords: JEM-X, INTEGRAL, X-ray astronomy, Micro strip detector
1. INTRODUCTION
The primary instruments of the INTEGRAL payload are designed for detailed studies of celestial objects in thegamma ray region of the electromagnetic spectrum. The SPECTROMETER (SPI) covers the energy range 15keV - 10 MeV and the IMAGER (IBIS) 20 keV - 10 MeV.
To obtain a more complete picture of the physical conditions in the sources observed by the two main instru-ments, it is important to have simultaneous observations at both X-ray and optical wavelengths. The primaryinstruments are, therefore, augmented by an X-ray monitor, JEM-X, and an optical monitor, OMC. JEM-Xprovides spectral data in the 3-35 keV band and also provides arcminute imaging to separate the contributionsfrom close lying sources. The photon detection system consists of two identical imaging Microstrip Gas Cham-bers (MSGC) that view the sky through a coded aperture mask. Specifications describing JEM-X are given inTable 1. The present paper will summarize the most important features of the JEM-X telescopes and discussthe performance of the instruments both before and after they were launched into space. The technical details ofthe JEM-X detector have been described by Kamarainen et al. (1997),1 and by Budtz-Jørgensen et al. (1997).2
Those for the JEM-X mask are given in a paper of Ballesteros et al. (1997),.3
Further author information: (Send correspondence to A.A.A.)A.A.A.: E-mail: [email protected], Telephone: 1 505 123 1234B.B.A.: E-mail: [email protected], Telephone: +33 (0)1 98 76 54 32, Address: A Very Long Address, City, Country

Table 1. JEM–X specifications
Mask diameter 535 mmDetector diameter 250 mmMask–detector distance 3401 mmEnergy–range 3 – 35 keV Primary rangeEnergy resolution ∆E/E = 0.40(E[keV])−1/2
Angular resolution 3 arcminField of view (diameter) 4.8 Fully coded
7.5 Half response13.2 Zero response
Point source location 30 arcsec (for a 10σ source)Narrow line detection sensitivity 1.7 10−5 phot cm−2 s−2 @ 6 keVIsolated on–axis source 5.0 10−5 phot cm−2 s−2 @ 30 keVFor a 3σ detection in a 106 s observationContinuum sensitivity 1.4 10−5 phot cm−2 s−2 @ 6 keVIsolated on–axis source 8.0 10−6 phot cm−2 s−2 @ 30 keVFor a 3σ detection in a 106 s observationTime resolution 128 µs
2. CODED MASK
The code patterns on the two coded masks are identical but the masks are turned 180 with respect to eachother to minimize common side lobes in the imaging process. The code is a hexagonal uniformly redundant arraypattern based on the biquadratic residue set for the prime number 22501, in’t Zand et. al.(1994)4 and Baumert(1971).5 This code is cut in a 0.5 mm thick tungsten plate. This thickness achieves opacities of 99.9% at 35KeV and 95% at 60 KeV. The plates were manufactured using electro-discharge wire cutting which provides anaccuracy of 0.01mm. The diameter of the coded area is 535 mm and the size of each hexagon is 3.3 mm (centerto center distance). The mask/detector distance and mask element size defines the instrument angular resolutionof 3.35 arcmin.
The basic mask pattern is larger than the detector window, therefore we do not have noise free coding.However, this configuration will minimize the sidelobes in the sky images.
Only 25% of the mask elements are open. A small value for the open fraction was chosen in order toachieve better source separation in crowded fields and also in an effort to save telemetry, which is very scarce onINTEGRAL.
The tungsten code plate is suspended under tension from a peripheral titanium ring. In order to withstandthe accelerations during launch a titanium structure resembling a spider web is placed on both sides of the maskmembrane. The loss of transparency due to this structure is less than 3% for on-axis sources. The masks weremanufactured in Spain by SENER under the supervision of the University of Valencia. The total mass of eachmask is 5.8 Kg.
3. DETECTOR
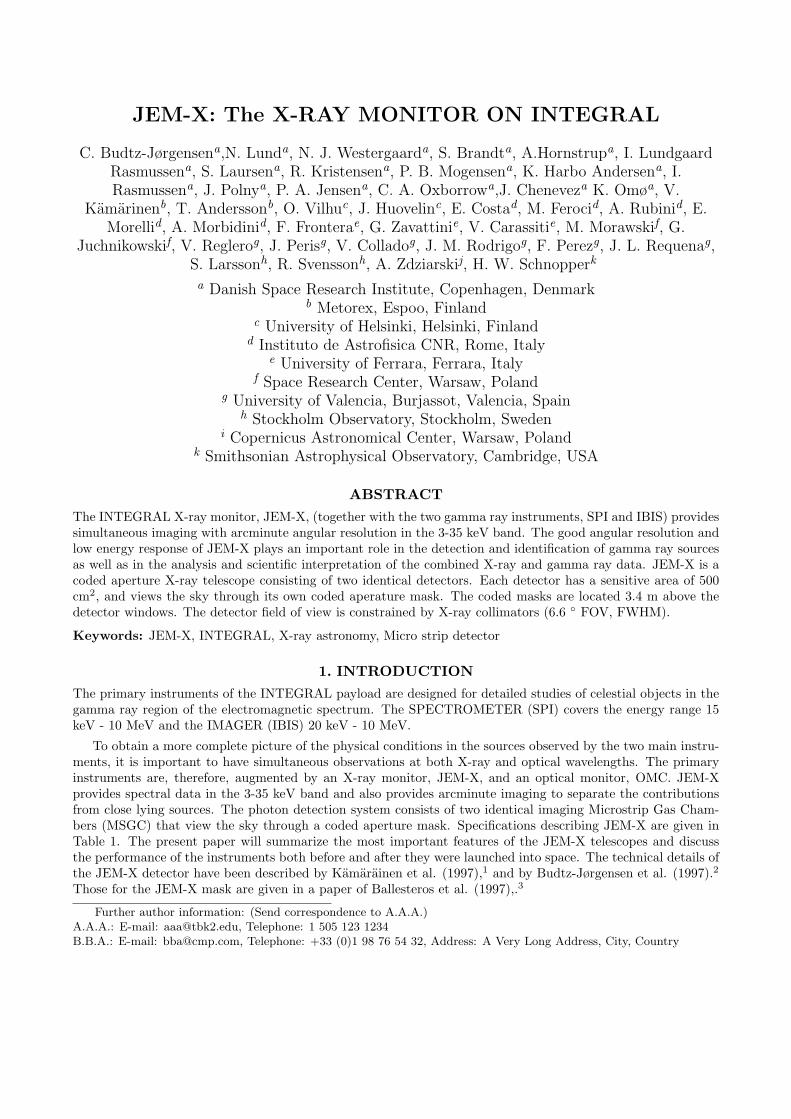
A photo of the JEM-X detector is shown in Fig. 2. It is a Micro strip Gas Chamber with a sensitive area ofnominally 500 cm2. The detector consists of the following modules: the detector vessel, the collimator, the X-raywindow and the Micro strip sensor package with the Detector Analog Electronics (DAE). The gas inside thedetector is a mixture of xenon (90%) and methane (10%) at 1.5 bar pressure.
In total three full detector systems were fabricated, two of those, JEM-X1, JEM-X2 are now flying onINTEGRAL. The third detector is now used as a reference detector on-ground.
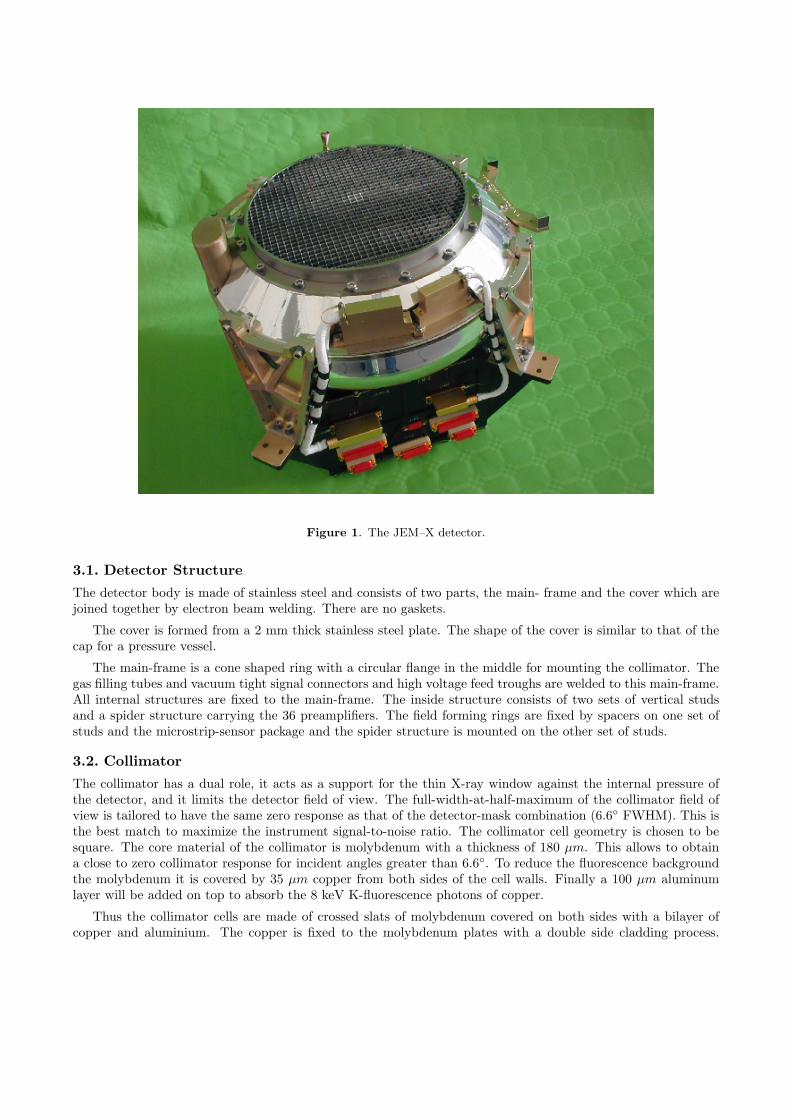
Figure 1. The JEM–X detector.
3.1. Detector Structure
The detector body is made of stainless steel and consists of two parts, the main- frame and the cover which arejoined together by electron beam welding. There are no gaskets.
The cover is formed from a 2 mm thick stainless steel plate. The shape of the cover is similar to that of thecap for a pressure vessel.
The main-frame is a cone shaped ring with a circular flange in the middle for mounting the collimator. Thegas filling tubes and vacuum tight signal connectors and high voltage feed troughs are welded to this main-frame.All internal structures are fixed to the main-frame. The inside structure consists of two sets of vertical studsand a spider structure carrying the 36 preamplifiers. The field forming rings are fixed by spacers on one set ofstuds and the microstrip-sensor package and the spider structure is mounted on the other set of studs.
3.2. Collimator
The collimator has a dual role, it acts as a support for the thin X-ray window against the internal pressure ofthe detector, and it limits the detector field of view. The full-width-at-half-maximum of the collimator field ofview is tailored to have the same zero response as that of the detector-mask combination (6.6 FWHM). This isthe best match to maximize the instrument signal-to-noise ratio. The collimator cell geometry is chosen to besquare. The core material of the collimator is molybdenum with a thickness of 180 µm. This allows to obtaina close to zero collimator response for incident angles greater than 6.6. To reduce the fluorescence backgroundthe molybdenum it is covered by 35 µm copper from both sides of the cell walls. Finally a 100 µm aluminumlayer will be added on top to absorb the 8 keV K-fluorescence photons of copper.
Thus the collimator cells are made of crossed slats of molybdenum covered on both sides with a bilayer ofcopper and aluminium. The copper is fixed to the molybdenum plates with a double side cladding process.
The aluminum layer is fixed on both sides by a diffusion bonding process. The single cells are stiffened with aeutectic Zn5Al brazing. The collimator was manufactured by Plansee, Austria under supervision of the Universityof Ferrara and Alenia.
The internal dimension of each cell is 6.6*6.6 mm and the height is 57.0 mm. The cell assembly is circularwith a diameter of 250 mm corresponding to the beryllium window diameter. The collimator mass is about4.7 Kg. Four calibration sources are integrated within the collimator.
3.3. WindowThe window is a 250 µm thick beryllium foil. The window is supported by the collimator structure againstthe internal pressure. The window is glued to a stainless steel mounting ring which is welded to the detectormain-frame. The window is electrically conductive and at the same electrical potential as the detector body.
3.4. Microstrip PlateThe Micro strip-sensor package consists of the following parts: The Micro strip plate, the support structure andpreamplifiers and high voltage distribution circuits. All electronics inside the detector is mounted on ceramiccircuit boards.
The capacitive read-out chains are mounted on ceramic plates which are glued on the Micro strip plate edges.The Micro strip electrodes are bonded to these chains. Signals from the capacitive chains are led through highvoltage blocking capacitors to the preamplifiers on the ceramic circuit boards underneath the Micro strip plate.
The Micro strip pattern is shown schematically in Fig. 2. The pattern is chosen to be shaped as a regularoctagon with a diameter of 292 mm. The Micro strip pattern with alternating anode strips of 10 µm and cathodestrips of 458 µm has a 1.062 mm pitch. The Micro strips are formed in a 0.2 µm thick chromium layer sputteredon the substrate, D 263 glass(Schott). The cathode strips are connected to the printed circuit of the capacitivereadout by wedge bonding to gold bonding pads on the chromium electrodes.The readout chains interconnecteach cathode strip to the neighboring cathode strips by 2.2 nF capacitors and 1 MΩ resistors.
The anode strips are connected into four groups, the signals from these anode segments are used for eventtriggering, energy determination and for pulse shape analysis. The cathode strips are read out to 11 amplifiersusing the capacitive charge division chains. The position of the avalanche in the direction perpendicular to themicro-strip pattern is determined from the centroid of the avalanche charge. The orthogonal coordinate for anevent is obtained from a set of pickup electrodes on the rear surface of the glass plate. These electrodes arearranged on a 2 mm pitch and read out by 20 amplifiers through capacitive chains.
The rear strips are surrounded by a veto-electrode which is used to suppress events caused by charged particlesentering through the sides of the detector.
The detector requires two voltages in order to operate. The first is the drift voltage applied between thedetector window (at ground potential) and the cathodes on the microstrip plate. The cathodes are biasedpositively with respect to the window, thus free electrons generated when an X-ray is absorbed in the xenon gaswill drift to the microstrip plate by the drift field. The second voltage required by the detector is the gas-gainvoltage. This voltage is applied between the anode and the cathode strips on the microstrip plate and controlsthe electron gas multiplication on the microtrip plate.
3.5. Calibration sourcesThe on board calibration system is composed of four collimated radioactive sources with a nominal strength of25 Ci (October 2002). The sources are placed within four cells of the JEM-X collimator. The 109Cd sourcesare collimated using Au and Mo absorbers and are screwed into Al housings which are glued in their respectivecollimator cells. Each 109Cd source emits 22,25 and 88 keV photons and in addition they produce Ni fluorescencephotons (7.5, 8.3 keV) from the source support Ni windows. The sources were provided by IAS, Rome. Two ofthe Cd sources for JEM-X1 were substituted by 55Fe sources emitting 5.9 keV photons.
The on-board calibration system is used to monitor the gas gain and thereby the energy calibration of thedetectors. This is important especially during the first few hours after the High Voltage has been switched onwhere the microstrip gain changes (decreases) by 25%. The gain is also affected by the detector temperaturewith a gain change of 1% per degree C.
Figure 2. The JEM–X Microstrip plate.
3.6. Electronics
The instrument electronics is divided into two units, one unit (the ”DFEE”) which is specific for JEM-X, andanother unit (the ”DPE”) which is very similar for all the instruments on INTEGRAL, and which is providedby ESA.
The DFEE incorporates a low voltage power supply, a dual high voltage unit (two voltages are needed forthe JEM-X detector), 4 boards with the 34 amplifiers processing the signals from the detector, a housekeepingboard, and a CPU board. All the electronics with the exception of the high voltage unit was build at DSRI. TheHV unit was build by CAEN in Italy under supervision of IAS, Rome.
The timing of the analog event processing is controlled by an FPGA which also sends an interrupt to theprocessor for every new event. The FPGA also monitors the trigger rate from the detector and switches off thehigh voltage unit in case of very high counting rates. This mechanism has already been activated a number oftimes during the first months of the mission in connection with radiation belt entry.

4. ON-GROUND TEST AND CALIBRATION
The JEM-X instruments underwent numerous test and calibration campaigns prior to the INTEGRAL launch.Only a summary and the most important results will be discussed here since the main focus will be on thein-flight experience.
4.1. Detector life time tests
It was a serious concern that the electronics mounted inside the active detector volume over time would contami-nate the counter gas and thus degrade the detector energy resolution. Xenon based counter gasses are susceptibleto contaminations down to 10 ppm of water vapor or Oxygen, see i.e. Ramsey et al.(1988).6 Therefore all partswere carefully cleaned with solvents and baked before they were mounted in the detector vessel. The detectorswere after the assembly evacuated and baked for 3 weeks at a temperature of 80 C. The electronic componentswhich were selected had previously been inserted in Xenon filled proportional wire chambers which were followedfor at least a year to detect any sign of degradation due to gas contaminants. The assembled JEM-X detectorsshowed no signs of gas degradation over 1 year prior to launch, except for one detector for which a small gasleak was detected. The latter detector was repaired and serves now as an on-ground reference detector.
The fine anode strips of the microstrip plate are fragile and may be damaged if an electrical discharge isproduced in the strong field around the anode strip. This effect limits gas gain for which the microstrip platecan be safely operated. The present microstrip design underwent a number of tests in order to establish safeoperation voltages and gas gains. These investigations included measurements with an alpha particle source241Am inserted in the active detector volume in order to simulate the heavy ion flux of the cosmic ray particlebackground. The huge primary charge (> 103 times more than from an X-ray event) which a heavy cosmicray particle crossing the detector might produce can generate an electrical breakdown in microstrip detectors,see Hott(1998)7 and Peskov et al.(1998).8 From our tests it was concluded that the detector filled with Xe+ 10%CH4 mixture at 1.5 bar can be safely operated at least up to a gas gain of 1500. This gain is achievedat a voltage setting of 900 V between the cathode and anode strips. The gas gain of 1500 was chosen as thenominal gain value for the detectors and all on-ground calibrations were performed at this gain. Unfortunately,it was later discovered when the detectors were activated in space that the microstrip electrodes eroded severelyat this gain and the gain had to be reduced by a factor 3 in order to assure sufficient life time (5 years) of thedetectors, see discussion in the following section. The detectors were on ground and are in orbit operated witha drift voltage of 1100 V, which creates a drift field of 200 V/cm in the absorption volume between the detectorentrance window and the microstrip plate.
4.2. Instrument Calibrations
The JEM-X detectors were calibrated at the X-ray facility at the University of Ferrara. This installation isdescribed in Frontera et. al9 and consists of an X-ray generator, a monochromator and a XY table on whichthe detector is mounted such that the whole detector area could be scanned by the X-ray beam. The energyrange of this equipment was from 15 keV to 50 keV. An additional 5.9 keV beam was provided by a collimated59Fe source. Including also the Xe K-escape peaks in the analysis it was possible to study the detector energyand position resolution down to 3 keV. The outcome of the calibration campaign is given in Westergaard et al.(2002)10 and will only be summarized here.
A typical energy spectrum for the FM1 detector recorded with a beam energy of 40.15 keV is shown in Fig. 3.Besides the main line both the Xe Kα and Kβ escape lines are clearly visible. The measured energy resolutionsobey a
√E dependence with:
∆Efwhm = 0.40√
E[keV ] (1)
where ∆Efwhm is the FWHM of the energy resolution. The detector gas gain varies smoothly over the microstripplate with deviations of ± 10%. These variations were mapped and corrections included on ground.
The measured detector position resolution (FWHM) was 2.0 mm at 3 keV had a minimum value of 0.5 mmbetween 10 to 20 keV and increased to 2 mm at 35 keV. The non linearities of detector position response wasdetermined making fine scans of the full active detector area with X-ray beams of 0.5 mm diameter. The scans
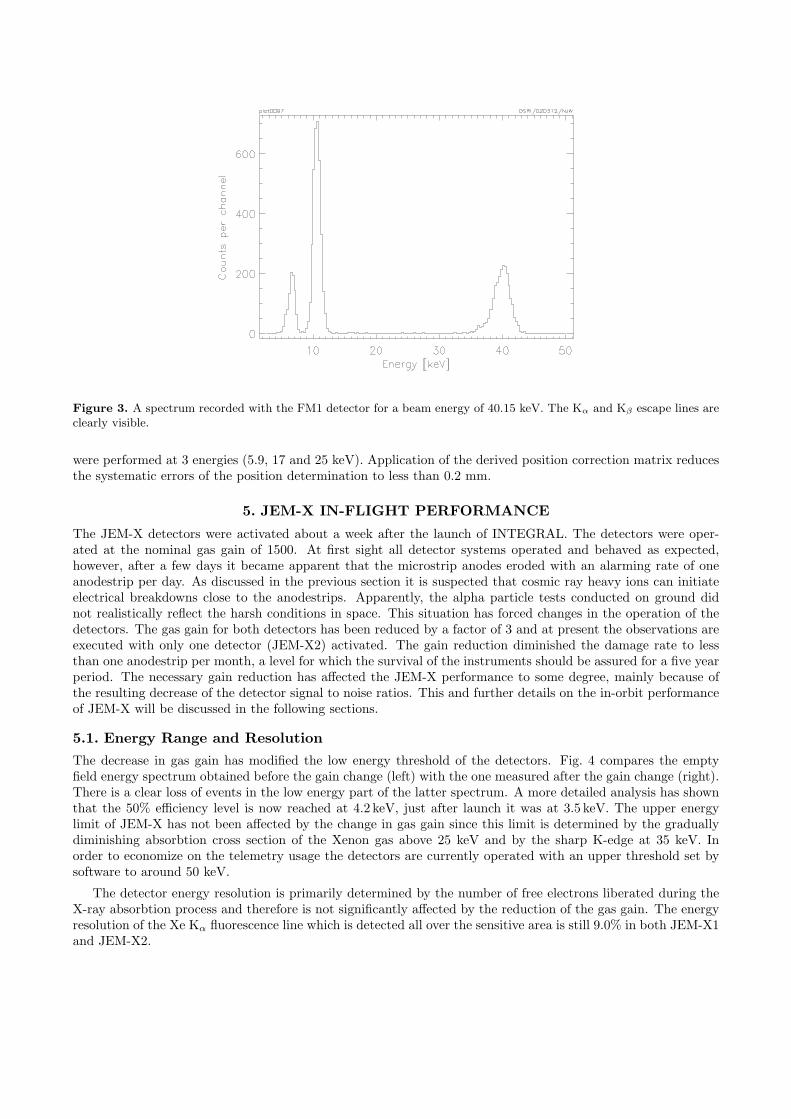
Figure 3. A spectrum recorded with the FM1 detector for a beam energy of 40.15 keV. The Kα and Kβ escape lines areclearly visible.
were performed at 3 energies (5.9, 17 and 25 keV). Application of the derived position correction matrix reducesthe systematic errors of the position determination to less than 0.2 mm.
5. JEM-X IN-FLIGHT PERFORMANCE
The JEM-X detectors were activated about a week after the launch of INTEGRAL. The detectors were oper-ated at the nominal gas gain of 1500. At first sight all detector systems operated and behaved as expected,however, after a few days it became apparent that the microstrip anodes eroded with an alarming rate of oneanodestrip per day. As discussed in the previous section it is suspected that cosmic ray heavy ions can initiateelectrical breakdowns close to the anodestrips. Apparently, the alpha particle tests conducted on ground didnot realistically reflect the harsh conditions in space. This situation has forced changes in the operation of thedetectors. The gas gain for both detectors has been reduced by a factor of 3 and at present the observations areexecuted with only one detector (JEM-X2) activated. The gain reduction diminished the damage rate to lessthan one anodestrip per month, a level for which the survival of the instruments should be assured for a five yearperiod. The necessary gain reduction has affected the JEM-X performance to some degree, mainly because ofthe resulting decrease of the detector signal to noise ratios. This and further details on the in-orbit performanceof JEM-X will be discussed in the following sections.
5.1. Energy Range and Resolution
The decrease in gas gain has modified the low energy threshold of the detectors. Fig. 4 compares the emptyfield energy spectrum obtained before the gain change (left) with the one measured after the gain change (right).There is a clear loss of events in the low energy part of the latter spectrum. A more detailed analysis has shownthat the 50% efficiency level is now reached at 4.2 keV, just after launch it was at 3.5 keV. The upper energylimit of JEM-X has not been affected by the change in gas gain since this limit is determined by the graduallydiminishing absorbtion cross section of the Xenon gas above 25 keV and by the sharp K-edge at 35 keV. Inorder to economize on the telemetry usage the detectors are currently operated with an upper threshold set bysoftware to around 50 keV.
The detector energy resolution is primarily determined by the number of free electrons liberated during theX-ray absorbtion process and therefore is not significantly affected by the reduction of the gas gain. The energyresolution of the Xe Kα fluorescence line which is detected all over the sensitive area is still 9.0% in both JEM-X1and JEM-X2.
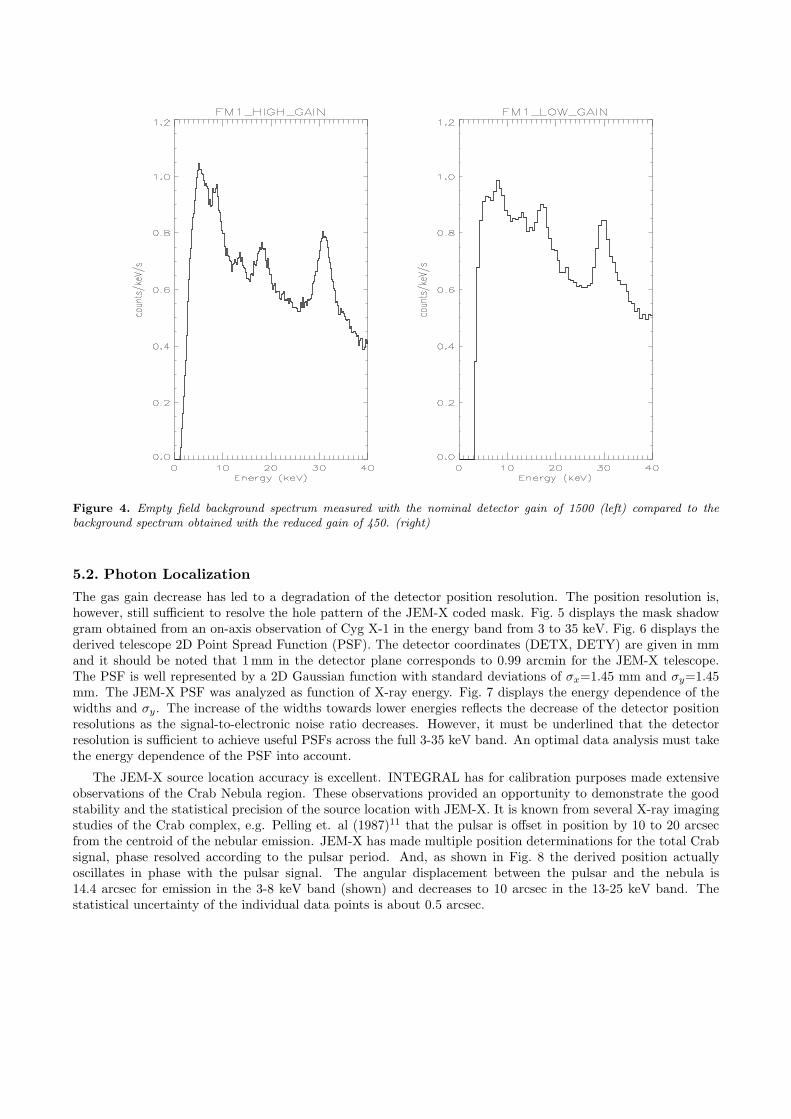
Figure 4. Empty field background spectrum measured with the nominal detector gain of 1500 (left) compared to thebackground spectrum obtained with the reduced gain of 450. (right)
5.2. Photon Localization
The gas gain decrease has led to a degradation of the detector position resolution. The position resolution is,however, still sufficient to resolve the hole pattern of the JEM-X coded mask. Fig. 5 displays the mask shadowgram obtained from an on-axis observation of Cyg X-1 in the energy band from 3 to 35 keV. Fig. 6 displays thederived telescope 2D Point Spread Function (PSF). The detector coordinates (DETX, DETY) are given in mmand it should be noted that 1mm in the detector plane corresponds to 0.99 arcmin for the JEM-X telescope.The PSF is well represented by a 2D Gaussian function with standard deviations of σx=1.45 mm and σy=1.45mm. The JEM-X PSF was analyzed as function of X-ray energy. Fig. 7 displays the energy dependence of thewidths and σy. The increase of the widths towards lower energies reflects the decrease of the detector positionresolutions as the signal-to-electronic noise ratio decreases. However, it must be underlined that the detectorresolution is sufficient to achieve useful PSFs across the full 3-35 keV band. An optimal data analysis must takethe energy dependence of the PSF into account.
The JEM-X source location accuracy is excellent. INTEGRAL has for calibration purposes made extensiveobservations of the Crab Nebula region. These observations provided an opportunity to demonstrate the goodstability and the statistical precision of the source location with JEM-X. It is known from several X-ray imagingstudies of the Crab complex, e.g. Pelling et. al (1987)11 that the pulsar is offset in position by 10 to 20 arcsecfrom the centroid of the nebular emission. JEM-X has made multiple position determinations for the total Crabsignal, phase resolved according to the pulsar period. And, as shown in Fig. 8 the derived position actuallyoscillates in phase with the pulsar signal. The angular displacement between the pulsar and the nebula is14.4 arcsec for emission in the 3-8 keV band (shown) and decreases to 10 arcsec in the 13-25 keV band. Thestatistical uncertainty of the individual data points is about 0.5 arcsec.
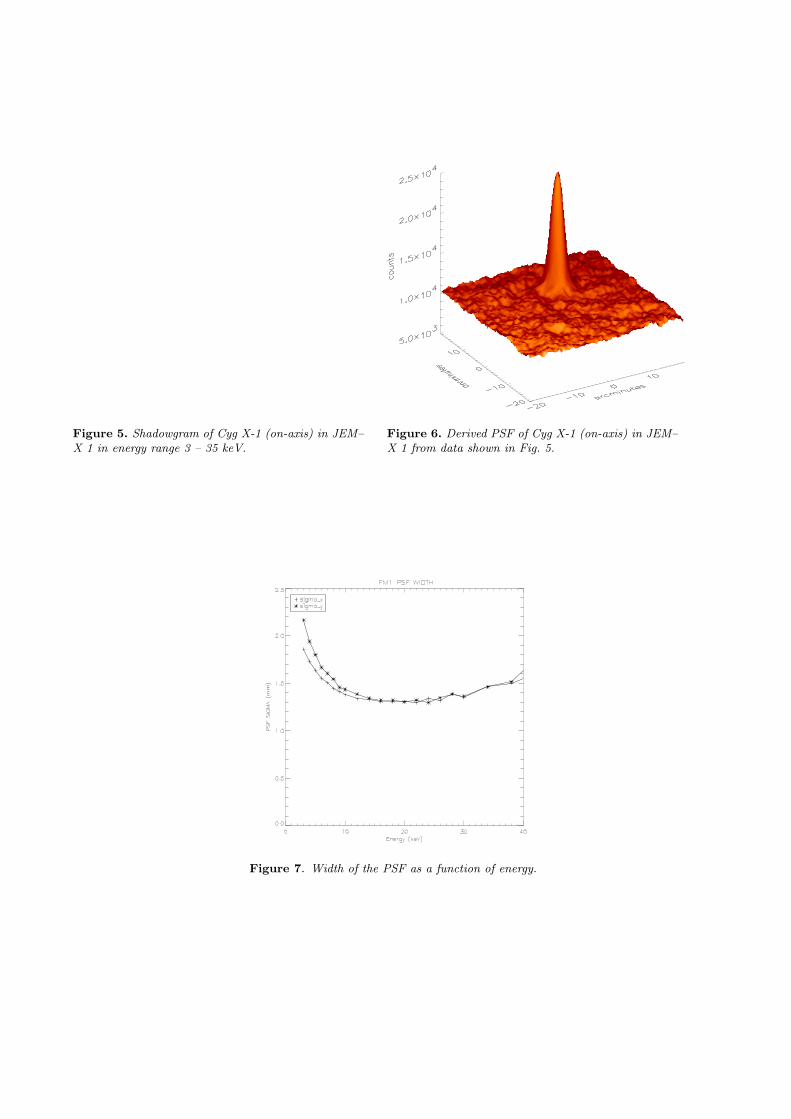
Figure 5. Shadowgram of Cyg X-1 (on-axis) in JEM–X 1 in energy range 3 – 35 keV.
Figure 6. Derived PSF of Cyg X-1 (on-axis) in JEM–X 1 from data shown in Fig. 5.
Figure 7. Width of the PSF as a function of energy.

Figure 8. Phase resolved determination of the centroid of the 3 to 8 keV emission from the Crab complex. The separationof the pulsar position from the centroid of the nebular emission results in a ”wiggling” of the position in phase with thepulsar signal. The full line is a fit to the data assuming an angular shift between pulsar and nebula of 14.4 arcsecond.
5.3. Background
The JEM-X background has been derived from from a number of empty field observations. The background rateis about 20 cts/s in the 4 to 35 keV range when INTEGRAL is outside the radiation belts. This is about a factorof two higher than predicted before launch.
Fig. 4 illustrates the background energy spectra measured under these conditions. The lines seen herewere also observed during the ground calibrations and stem from Cu, Mo and Xe fluorescence and a weak Ucontamination of the Be window.
The radial variation in the background across the detector has a noticeable increase towards the edge of thedetector.
Table 2 compares the pre-launch predictions, M. Feroci et al.(1999) ,12 for the background count rates withthe actual values observed in flight. The count rate data for the Crab (pulsar + nebula) are also shown forreference.
Table 2. JEM-X predicted and actual count rates
Interval Source DXB∗ CR† Total bkg(keV) (counts/s) (counts/s) (counts/s) (counts/s)
predict actual predict actual predict actual predict actual3(4) - 10 147 (83) 4.1 (3.0) 0.8 (3.1) 4.9 (6.1)10 - 20 37 27 2.4 1.8 1.1 5.1 3.5 6.920 - 35 7.4 5.4 0.6 .5 2.3 6.5 2.9 7.0Tot: 3(4) - 35 191 (115) 7.1 (5.3) 4.2 (14.7) 11.3 (20.0)∗ Diffuse X-ray background† Cosmic Ray (i.e. charged particles and gammas)
Presently, it is believed that the background of hard X- and gamma rays produced by cosmic rays in thesurrounding payload elements is significantly higher than expected. The increase of the background towards the

edge of the detector is rather natural if the background arises from photons generated in material around theJEM-X detectors; such an increase would be more difficult to understand if the background was caused by directtraversals of the detector volume by cosmic rays.
When the Sun is active and the satellite altitude is such that the Sun illuminates the JEM-X masks thebackground in JEM-X may temporarily increase substantially. These situations are, however, relatively rare andonly few observations are affected by this problem. It is believed that X-rays from the Sun are scattered intothe detector by the mask and its support structure.
So far there has been no indication of a significant long term increase in the background due to radiationactivation of the detectors or their surroundings. The monitoring of the background orbital and pointing depen-dencies will be continued.
6. JEM-X SENSITIVITY
The sensitivity of a coded mask instrument like JEM-X is critically dependent on the software used to analyzethe data - much more so than for simpler types of X-ray instruments. The sensitivity figures quoted here shouldnot be considered as the final ones - even after six months of intensive work we are still well aware of shortcomingsin our analysis software.
Figure 9. JEM-X observation of 3C273, courtesy T. J.-L. Courvoisier, 2003
During the INTEGRAL Galactic Plane Scan observations (2200 s each) sources down to 20 mCrab are reliablydetected when they are inside the central 10 of the JEM-X field of view. In the same observations many weakersources - down to 3 mCrab - are detected if they are within the central few degrees of the field of view. Thesenumbers refer to observations with a single JEM-X unit.
Extraction of spectral information from weak sources require more extended observations. Fig. 9 illustratesthe capabilities of JEM-X. The displayed spectrum of 3C273 - a 5 mCrab source for JEM-X - was obtained using22 ksec of on-axis staring . Also these data refer to one JEM-X unit only.
7. CONCLUSIONS
The commissioning and performance verification of the two JEM-X instruments on INTEGRAL has been carriedout. The operability has been verified and the spectral and spatial resolution has been found to be fully consistentwith the values given prior to launch. The source localization capabilities actually significantly exceed the valuesquoted previously.

The larger than expected sensitivity of the microstrip detectors to the space environment (presumably inducedby the heavy cosmic rays) has threatened to limit the lifetime of the instruments unacceptably. This has forcedus to reduce the operating voltage and therefore the gas gain of the microstrip detectors. Even at the reducedgas gain we still experience occasional anode destruction, and therefore it has been decided to operate with onlyone JEM-X unit until the long term damage rate is better understood.
At the reduced gas gain our energy range has been reduced slightly, the lower threshold (50% efficiency point)has moved up from 3 keV to 4 keV.
Taken together, the higher background and operation with only one JEM-X will, at least for the first part ofthe mission, lead to a reduction of the JEM-X sensitivity by about a factor two compared to the values predictedbefore launch.
REFERENCES1. V.Kamarainen et al., Proceedings 2nd INTEGRAL Workshop, SP-382, p. 655, 1997.2. C. Budtz-Jørgensen et al., Proceedings 2nd INTEGRAL Workshop, ESA SP-382, p. 615, 1997.3. F. Ballesteros et al., Proceedings 2nd INTEGRAL Workshop, SP-382, p. 659, 1997.4. J. J. M. in’t Zand, J. Heise, and R. Jager A & A 288, p. 665, 1994.5. L. D. Baumert, Lecture Notes in Mathematics No 1822: Cyclic Difference Sets, Springer, Berlin, 1971.6. B. D. Ramsey, R. F. Elsner, and M. C. Weisskopf Nucl. Instr. and Meth. A270, p. 178, 1988.7. T. Hott Nucl. Instr. and Meth A408, p. 258, 1998.8. V. Peskov, B. Ramsey, and P. Fonte IEEE Trans. Nucl. Sci. 45, p. 244, 1998.9. C. Pelliciari, M. de Paoli Vitali, F. Frontera, V. Carassiti, F. Evangelisti, C. Budtz-Jørgensen, and N. J.
Westergaard, “The ground calibration apparatus of the JEM-X instrument aboard INTEGRAL,” in Pro-ceedings of the Fourth INTEGRAL Workshop, ESA SP-459, pp. 657 – 660, 2001.
10. N. J. Westergaard, C. Budtz-Jørgensen, and N. Lund, “JEM-X Science Performance Report,” Tech. Rep.IN-PL-JEM-007, DSRI, www.dsri.dk, June 2002.
11. R. M. Pelling, W. S. Pacies, L. E. Petterson, K. Makishima, M. Oda, , Y. Ogawara, and L. E. Peterson Ap.J. 319, p. 416, 1987.
12. M. Feroci, M. Rapisarda, E. Costa, F. Lei, C. Ferguson, N. J. W. A. J. Dean, and C. Budtz-Jørgensen, “TheBackground Simulation for the INTEGRAL X-ray monitor JEM-X,” in Proceedings of the Third IntegralWorkshop, 39, p. 429, 1999. Special Issue of Astro. Lett. and Communications.