ใบความรู้ หลักการสำคัญและวิธีการเลือกบริโภค ป.4+463+dltvsocp4+54soc p04 f31-4page

Finance a úvěr-Czech Journal of Economics and Finance, 68, 2018, no. 5 491
JEL Classification: C15, F31, G15
Keywords: stock and exchange rate, emerging markets, wavelet coherence, phase difference
What Multiscale Approach Can Tell About the
Nexus Between Exchange Rate and Stocks in the
Major Emerging Markets?
Dejan ŽIVKOV - Novi Sad School of Business, University of Novi Sad, Serbia ([email protected]) corresponding author
Suzana BALABAN - PhD candidate at Faculty of Economics in Subotica, University of Novi Sad, Serbia ([email protected])
Jasmina DJURAŠKOVIĆ - The College of Tourism, University of Belgrade, Serbia ([email protected])
Abstract
This paper tries to answer which theory – the portfolio balance approach or the flow-
oriented model, better explains the nexus between the national stock and exchange rate
markets at different time-horizons in the major emerging markets of Europe and Asia. For
that task we employ wavelet coherence and phase difference. Wavelet coherence results
suggest that correlation between the two markets is not particularly strong throughout the
observed period and at different wavelet scales, except in the period of World financial
crisis (WFC). Phase difference in the Czech Republic, Turkey, Poland, Russia and South
Korea are in anti-phase position during WFC in short run, which is in accordance with the
portfolio-balance approach, whereby the stock market has the leading role. Also, phase
difference at longer time-horizon indicate that an anti-phase situation is relatively common
phenomenon in Poland, Russia, Turkey and South Korea. However, when we do
calculations on real values, the results suggest that the real stock returns and the real
exchange rate changes overwhelmingly behave in line with the flow-oriented model in all
emerging markets, except for Poland. As for the Czech and Indian cases, phase differences
indicate that the markets behave predominantly in accordance with the flow-oriented model
at long-term horizon, regardless of whether nominal or real values are used.
1. Introduction
The rise of capital markets and the adoption of more flexible exchange rate
regimes in emerging economies, sparked the interest about the interlinkage between
stock and exchange rate markets among academic researchers and practitioners in
recent years. The reason why research studies pay more and more attention to emerging
markets lies in the fact that these countries received huge amounts of capital inflows
in last two decades due to robust economic growth as well as structural reforms that
they undertook (see e.g. Hegerty, 2009; Cardarelli et al., 2010; Eng and Wong, 2016;
Botoc, 2017; Hwang et al., in press). In such circumstances, national exchange rate
and stock markets inevitable become intertwined, since growing participation of
international investors in stock end exchange markets affects demand and supply of
these assets. In particular, many institutional risk hedgers and portfolio managers try
to understand the level of dynamic correlation and the magnitude of the shock spillover
effect between the two major financial assets – foreign exchange and stocks, since

492 Finance a úvěr-Czech Journal of Economics and Finance, 68, 2018, no. 5
investment in national stock market involves exposure to exchange rate risk (see e.g.
Laidroo and Grigaliuniene, 2012; Liivamägi, 2016). On the other hand, in order to
calibrate the optimal exchange rate interventions, policy makers strive to gauge in what
extent capital inflows and outflows affect exchange rate stability.
Two theories in international finance offer an explanation for the nexus between
stocks and exchange rate – the traditional or the ‘flow-oriented’ model and the
portfolio-balance approach or the ‘stock-oriented model’. The flow-oriented approach
proposes the linkage via the international trading balance, explaining that when
exchange rate depreciates it affects positively (negatively) competitiveness of
domestic (foreign) goods, which consequently reflects on the balance of trade position.
The growth of the real output affects current and future cash flows of domestic
companies, especially those export-oriented, which pushes their stock prices up. This
indirect linkage accentuates positive correlation between these two assets. Conversely,
the portfolio-balance approach is based on the demand and supply of financial assets
that occurs via capital-financial balance. The increased demand for domestic stocks
could cause higher demand for domestic currency that could induce its appreciation,
and vice-versa. Hence, the portfolio-balance model suggests negative correlation
between the two variables. Aforementioned theories also differentiate regarding the
length of time-horizon, that is, whether the causality appears in short or long-run.
Common knowledge is that the portfolio-balance approach usually has precedence in
short-term, while flow the oriented theory has an upper hand in long-term.
Although there is a lot of effort in the international finance literature to
understand the dynamic nexus between stocks and exchange rate, majority of studies
focus only on the time domain, while frequency domain remains unexplored.
According to Tiwari et al. (2015), the link between stock returns and exchange returns
can vary across frequencies and may even change over time. However, there are
relatively limited number of studies in the extant literature that analyse interconnection
between financial time-series at higher scales (longer time-horizons). The reason lies
in the fact that long-term observations often imply the sample reduction problem,
whereby valuable information is lost (see Conlon and Cotter, 2012). Huang (2011)
asserted that this issue could be very important since the market interconnections vary
across time and scales, and the features in frequency dimension can help in better and
deeper apprehension of complex pattern of the cross-market correlations. In addition,
it should be said that various market participants have diverse expectations, risk
profiles, informational sets, etc., and thus they gravitate to heterogeneous goals, which
can be achieved at different time-horizons. For instance, policy makers and
institutional investors are part of low-frequency (long-term) traders, whereas
speculators and market makers belong to high-frequency (short-term) group.
Therefore, this paper endeavours to investigate dynamic nexus and lead(lag)
relationship between exchange rate and stocks in major emerging markets, observing
the interconnectedness via different levels of frequency scales. Our sample covers six
major emerging markets of East Europe and Asia – the Czech Republic, Poland,
Russia, Turkey, India and South Korea. These countries pursue managed float
exchange rate regime. In addition to the relative size of the selected stock markets and
their daily trading volumes, these countries also characterize relatively high amounts
of export and import, as well as capital flows (see Table 1). Table 1 suggests that five
out of six selected emerging markets are net-receivers of capital, while South Korea is

Finance a úvěr-Czech Journal of Economics and Finance, 68, 2018, no. 5 493
net-lender of capital. These characteristics provide us a reason to believe that some
kind of interdependence between the stock and exchange rate markets exists in these
countries. For the comparison purposes, we also analyse the U.S. case, which is the
best proxy of the developed countries. To the best of our knowledge, only Tiwari et al.
(2015) did a multiscale research, investigating the nexus between stocks and exchange
rate at various time-horizons, but they investigated only the Indian case.
Table 1 Some Characteristics of Selected Emerging Markets
Czech R. Poland Russia Turkey India S. Korea
SMC* 40,912 138,691 622,052 171,765 1,566,680 1,254,540 Avg. trading volumes 3 40 34,800 518 19 399 Export** 160 196 282 139 256 483 Import** 138 186 180 188 344 389 Financial account*** -5,767 -5,505 -10,225 -9,710 -39,408 17,857
Notes: SMC stands for stock market capitalization in 2016. Export and import are expressed in billions of USD in 2016, while financial account and SMC are portrayed in millions of USD in 2016. Daily average trading volumes in the stock markets are presented in millions in local currency. *source: www.indexmundi.com/facts/indicators/CM.MKT.LCAP.CD/rankings **source: https://atlas.media.mit.edu/en/profile/country/ ***source: OECD statistics
In order to explore the time-frequency relationship between the two major
financial markets, we utilize a wavelet coherence (WTC) method, which is capable of
unravelling the strength of the dynamic interactions between the observed variables at
different frequency scales and in different time-periods. In particular, this model-free
approach, does not rely on parameters’ assessment nor depends on the estimation
method, but, at the same time, it allows a higher level of comprehension and
circumvents the problem of sample size reduction. In other words, the computation is
done without wastage of valuable information. Many recent studies applied WTC
approach to analyse various economic phenomena at different time-horizons (see e.g.
Nikkinen et al., 2011; Barunik and Vacha, 2013; Dewandaru et al., 2014; Lee and Lee,
2016; Njegić et al., 2017; Tsai and Chang, (2018). In order to further determine the
nature of the mutual coherence (correlation), as well as the lead(lag) relationship
(spillover effect) between stocks and exchange rate, we consider the phase difference
approach of Aguiar-Conraria and Soares (2011a). Many researchers used this method
for various purposes (see e.g. Aguiar-Conraria and Soares, 2011b; Dewandaru et al.,
2016; Lin et al., 2016). This complementary methodology provides an information
about the direction of coherence as well as the leading(lagging) role of particular
variable, throughout the observed sample and at specific frequency band. In this way,
we can determine whether mutual interdependence between stocks and exchange rate
is shaped in accordance with the flow-oriented model or the portfolio-balance
approach. Also, this method can provide an answer which theory better explains the
nexus in the emerging market, and which one in the U.S., that is, whether there exists
congruence or divergence between these economies when it comes to the best
explaining theory. Besides, this approach can suggest from which market the spillover
shocks originated at some point in the past, and at which frequency scale. This is
important for various global investors, since it could have significant implications in
terms of risk management, trading and hedging strategies of international portfolios
(see Dajčman, 2013). Our final effort involves the introduction of inflation, in order to
see how the real stock returns and the real exchange rate changes behave. This paper
494 Finance a úvěr-Czech Journal of Economics and Finance, 68, 2018, no. 5
contributes to the literature because it offers a fresh insight into the causal link between
exchange rate and stocks in the emerging markets, whereby the accent is put on the
time-frequency domain, which has remained hidden thus far.
Beside introduction, this paper is structured as follows. Brief literature review is
given in second Section. Research methodology is explained in third Section. Section
four contains dataset. Fifth and sixth Sections reveal wavelet coherence and phase
difference results. Seventh Section contains multiscale results for the real stock returns
and the real exchange rate changes. Last Section concludes.
2. Brief Overview of Related Literature
The connection between the two major financial markets in emerging
economies has been theoretically and empirically examined extensively, but the
consensus has not been reached, regarding the direction of correlation as well as their
lead(lag) relationship (spillover effect). For instance, Živkov et al. (2016) investigated
dynamic correlation via DCC-FIAPARCH model between the two major financial
markets in for Eastern European countries. They asserted that the portfolio balance
theory has predominance in short run in all selected economies. In addition, the results
of rolling regression suggested that exchange rate’s conditional volatility has higher
influence on dynamic conditional correlation than stock’s conditional volatility. The
study of Liang et al. (2013) utilized the panel Granger causality and the panel DOLS
methodologies on ASEAN-5 countries and found support for the portfolio-balance
hypothesis. They claimed that exchange rates impact stock prices negatively via capital
mobility. On the other hand, some papers found evidence of the flow-oriented model,
which advocates positive correlation between stock and exchange rate markets,
emphasizing that the nexus occurs via balance of trade. For instance, Diamandis and
Drakos (2011) investigated short-run and long-run dynamics on monthly data between
stock prices and exchange rates as well as the channels through which exogenous
shocks influence these markets in Argentina, Brazil, Chile and Mexico. Their main
finding suggests that stock and foreign exchange markets in these economies are
positively related, and the U.S. stock market acts as a channel for these links.
As for the spillover effect, many researchers explored this topic and the results
came heterogeneous. Bahmani-Oskooee and Saha (2016) claimed that exchange rate
changes can affect firms differently depending on whether they are export oriented or
they heavily use imported inputs, concluding that the overall effects of exchange rate
changes on an aggregate stock price index could be in either direction. Yang et al.
(2014) studied the relationship between stock returns and exchange rates via the
Granger causality test in quantiles in India, Indonesia, Japan, Korea, Malaysia, the
Philippines, Singapore, Taiwan and Thailand. Their results indicated that during the
Asian financial crisis, all the countries except for Thailand reported the spillover effect
from exchange rates toward stock prices. The paper of Živkov, Njegić and Milenković
(2015) researched bidirectional second moment spillover effect between stock returns
and exchange rate changes on daily data in four Eastern European emerging markets.
They managed to identify bidirectional volatility spillover effect. The results indicated
that this effect has much higher impact from the currency market toward stock market,
than vice-versa. The study of Andreou et al. (2013) investigated bi-directional return
and volatility spillovers between the stock market and the foreign exchange market of

Finance a úvěr-Czech Journal of Economics and Finance, 68, 2018, no. 5 495
twelve emerging economies. Their results revealed that there is a strong evidence of
bidirectional causality in variance between the foreign exchange market and stock
market in all emerging economies, but Colombia. Also, they claimed that global and
regional stock markets contribute significantly to volatility spillovers. Sui and Sun
(2016) studied the dynamic relationships among local stock returns, foreign exchange
rates and interest differentials in BRICS. The results showed that the spillover shocks
from the foreign exchange markets affect stock returns in all BRICS in short-run. On
the other hand, the stock-market shocks only slightly impact the exchange rate market
in Brazil and Russia.
3. Methodology
Wavelets are mathematical functions, utilized to extract information from
empirical data in both space and scaling. Tabak and Feitosa (2009) and Jammazi
(2012) explained that the wavelet method is handy for detecting extreme movements
and removing noises in original data. Dewandaru et al. (2016b) asserted that the
wavelet coherence methodology is particularly useful when researchers deal with non-
stationary signals that contains numerous outliers. Since stock and exchange rate
returns frequently exhibits asymmetry, abrupt changes, chaotic behaviour, and
nonlinear dynamics, the wavelet methodology would be convenient for our research.
Rua and Nunes (2009) contended that function of the continuous wavelet transform,
𝑊𝑥(𝑢, 𝑠), is obtained by projecting a specific wavelet ψ(.) onto the examined time
series 𝑥(𝑡) ∈ 𝐿2(ℝ) by the following expression:
𝑊𝑥(𝑢, 𝑠) = ∫ 𝑥(𝑡)1
√𝑠��
∞
−∞(𝑡−𝑢
𝑠)
𝑑𝑡, (1)
where u represents the position of the wavelet in the time domain, while s denotes the
position in the frequency domain. Equation (1) suggests that information on time and
frequency can be simultaneously obtained by mapping the original time series into a
function of u and s in the wavelet transform.
In order to analyse the interaction between selected stock indices and exchange
rates, we need to introduce a bivariate framework called wavelet coherence. Vacha and
Barunik (2012) claimed that squared wavelet coherence measures the local linear
correlation between two stationary time series at each scale, and it is equivalent to the
squared correlation coefficient in linear regression. Torrence and Webster (1999)
contended that WTC can be presented as a squared absolute value of the smoothed
cross wavelet spectra normalized by the product of the smoothed individual wavelet
power spectra of each selected time series. The cross wavelet transform of two time-
series, x(t) and y(t), is defined as 𝑊𝑥𝑦(𝑢, 𝑠) = 𝑊𝑥(𝑢, 𝑠)𝑊𝑦∗(𝑢, 𝑠), wherein 𝑊𝑥 and 𝑊𝑦
are the wavelet transforms of x and y, respectively. Symbol u represents a position
index, s denotes the scale, while the symbol * indicates to a complex conjugate. The
squared wavelet coherence coefficient is given as follows:
𝑅2(𝑢, 𝑠) =|𝑆(𝑠−1𝑊𝑥𝑦(𝑢,𝑠))|
2
𝑆(𝑠−1|𝑊𝑥(𝑢,𝑠)|2)𝑆(𝑠−1|𝑊𝑦(𝑢,𝑠)|
2), (2)

496 Finance a úvěr-Czech Journal of Economics and Finance, 68, 2018, no. 5
where (.)S stands for a smoothing operator and s is a wavelet scale. The squared
wavelet coherence coefficient ranges 20 ( , ) 1R u s , whereby values near zero point to
weak correlation, while values near one indicate to strong correlation. Theoretical
distribution for the wavelet coherence is not known, thus we follow Grinsted et al.
(2004) and Torrence and Compo (1998), and test the statistical significance using
Monte Carlo methods.
WTC methodology is unable to determine whether dependence between two
time-series is positive or negative, because the wavelet coherence is squared, thus, we
consider wavelet coherence phase difference, which provides details on the delays in
the oscillation between scrutinized two time-series. According to Torrence and
Webster (1999), the wavelet coherence phase difference is defined as follows:
𝜙𝑥𝑦(𝑢, 𝑠) = 𝑡𝑎𝑛−1 (ℑ{𝑆(𝑠−1𝑊𝑥𝑦(𝑢,𝑠))}
ℜ{𝑆(𝑠−1𝑊𝑥𝑦(𝑢,𝑠))}), (3)
where ℑ and ℜ are the imaginary and real parts, respectively, of the smooth power
spectrum. Phase difference between two series (x, y) is presented by vector arrows on
the wavelet coherence plots. Vacha and Barunik (2012) indicated that right (left)
pointing arrows indicate that the time series are in-phase (anti-phase) or are positively
(negatively) correlated. If arrows point to the right and up, the second variable is
lagging and if they point to the right and down, the second variable is leading.
Reversely, if arrows point to the left and up, the second variable is leading and if arrows
point to the left and down, the second variable is lagging.
In addition, according to the paper of Aguiar-Conraria et al. (2008), if 𝜙𝑥𝑦 ∈
(0, π/2) then the series move in phase, with the time-series y leading x. On the contrary,
if 𝜙𝑥𝑦 ∈ (−π/2, 0) then it is x that is leading. An anti-phase situation (analogous to
negative covariance) happens if we have a phase difference of π (or −π), meaning 𝜙𝑥𝑦
∈ (−π/2, π] ∪ (−π, π/2]. If 𝜙𝑥𝑦 ∈ (π/2, π) then x is leading, and the time series y is
leading if 𝜙𝑥𝑦 ∈ (−π, −π/2). Phase difference of zero indicates that the time series move
together (analogous to positive covariance) at the specified frequency.
4. Dataset
Our research encompasses six emerging markets of East Europe and Asia – the
Czech Republic, Poland, Russia, Turkey, India and South Korea. We use daily closing
prices of selected stock indices and nominal exchange rates, and all currencies are
observed vis-a-vis euro. We consider following indices and corresponding currencies
– Czech PX and koruna, Polish WIG and zloty, Russian MICEX and rouble, Turkish
XU100 and lira, Indian SENSEX and rupee, and South Korean KOSPI and won. For
comparison purposes, we choose American S&P500 index and USD, which represents
developed country. All daily prices are transformed into log-returns according to
)/log(100 1,,, −= tititi PPr , where tir , is the market return and tiP, is the closing price of
particular currency or stock index at time (t). The sample covers the period from
January 1, 2001 to September 30, 2017 and all data were obtained from Datastream.
Due to the unavailability of some data because of national holidays and non-working
days in selected stock markets, the daily dates are synchronized between two markets

Finance a úvěr-Czech Journal of Economics and Finance, 68, 2018, no. 5 497
according to the existing observations. Using wavelet coherence method, we observe
interdependence between these assets at six different scale levels, which corresponds
to following time horizons – scale 1 (2-4 days), scale 2 (4-8 days), scale 3 (8-16 days),
scale 4 (16-32 days), scale 5 (32-64 days) and scale 6 (64-128 days). We treat first four
scales as short-term observations, whereas fifth and sixth scales correspond to long-
term. Utilizing wavelet coherence and phase difference methodologies, we are in a
position to investigate the dynamic nexus in different frequency levels, and the
obtained results could serve well for various economic agents who have different term
objectives. Figure 1 presents empirical movements of selected stock indices and
exchange rates.
Figure 1 Empirical Dynamics of Selected Stock Indices and Exchange Rates

498 Finance a úvěr-Czech Journal of Economics and Finance, 68, 2018, no. 5
Notes: Black (grey) line denotes stock index (currency) movement.
5. Wavelet Coherence Results
We apply wavelet coherence1 in the continuous form to decompose the
empirical series, and to determine the strength of the mutual nexus in the time-scale
domain. This section presents our findings. Figure 2 contains seven wavelet coherence
contour plots, which depict the level of correlation (coherence) between selected pairs
of national stock indices and currencies. This technique is able to simultaneously
observe two dimensions – time and frequency, whereby the horizontal axis denotes
time component, while the left vertical axis represents frequency component, which
goes up to sixth scale (128 days). The strength of the co-movement between analysed
group of countries is measured via black and white surfaces, were light-black shade
indicates low coherence, while dark-black shade points to higher coherence. The black
and white pallet is presented at right Y-axis and it ranges from 0 to 1. The cone of
influence designates the statistical significant area at 5% significance level.
Wavelet coherence plots show that strength of the coherence is heterogeneously
distributed throughout the observed time-sample and across the scales, which justifies
the usage of this methodology. It can be seen that majority of WTC surfaces is covered
with relatively bright shades on all WTC plots, and this applies particularly to high
frequency scales. It is obvious that bright shades dominate up to 16 days in all WTC
plots. These findings indicate that correlation between stock and exchange rate markets
is not particularly strong, and this pattern replicates itself at higher wavelet scales as
well. Our results concur with the findings of other studies. For example, Živkov,
Njegić and Milenković (2015) explored four East European economies – the Czech
Republic, Poland, Hungary and Russia via DCC-FIAPARCH model. The calculated
dynamic conditional correlations disclosed that the average daily dynamic correlations
between stock and currency markets varies between 0.2 and 0.3, which is not high, and
which coincides with our wavelet findings.
1 All WTC computations were done in ‘R’ software.

Finance a úvěr-Czech Journal of Economics and Finance, 68, 2018, no. 5 499
Figure 2 Wavelet Square Coherence Between National Stock Indices and Currencies
The only situation in which we find high correlations between stocks and
currencies is the period around World financial crisis (2008-2010) and subsequent
European sovereign debt crisis (ESDC) that lasted during 2011-2012. It can be seen
that dark-grey islands are present at relatively low frequencies (higher scales) in these
periods, that is, from 32 days onwards. This is characteristic for all emerging markets
as well as the U.S. economy. Regarding the emerging market plots, particularly
conspicuous are the Czech, Polish and Russian cases. Dark-grey surfaces during WFC
500 Finance a úvěr-Czech Journal of Economics and Finance, 68, 2018, no. 5
and ESDC periods undoubtedly indicate to increased market contagion and investors’
panic. Bekaert et al. (2005) explained that contagion is a correlation over and above
what one would expect from economic fundamentals. In other words, due to extreme
market uncertainty during WFC and somewhat ESDC, economic agents started
frantically to withdraw capital from the emerging markets and to sell domestic
currencies. That type of behaviour caused steep fall of stock indices and enhanced
exchange rate depreciation. Our findings concur with Syllignakis and Kouretas (2011),
who showed that herding behaviour actually happened in the Central and East
European (CEE) economies during the U.S. stock market crash (2008-2010), which
consequently forced the CEE financial markets to plunge in a relatively short amount
of time. Looking at the empirical movements of stock indices and currencies in Figure
1, we can witness that this scenario is apparent for the Czech Republic, Poland, Russia,
South Korea and somewhat India. In addition, our results are in line with some studies,
such as Lin (2012), who explored six Asian emerging countries and found that the co-
movement between exchange rates and stock prices becomes stronger during crisis
periods than during tranquil ones, in terms of long-run co-integration and short-run
causality. Also, Živkov, Njegić and Pavlović (2015) investigate dynamic correlation
between stock returns and exchange rate via DCC-EGARCH model in four Eastern
European emerging markets. They found increased negative dynamic correlation
during WFC, which coincides with our wavelet-based results.
However, in spite of huge market turbulence that was present during WFC and
somewhat ESDC, our WTC results suggest that high correlation between national
stocks and exchange rate happened in a delayed time, that is, at longer time-horizons.
According to Figure 2, increased correlation during WFC is detected between 32-128
days in Czech case, between 16-64 days in Polish, Russian and Indian cases, between
16-32 days in Turkish case and between 64-128 days in South Korean case.
In addition, it should be said that most of the phase arrows in dark-grey areas
point to left, which suggest negative coherence (anti-phase) situation, which means
that stock prices downfall was accompanied by the exchange rate depreciation. This
applies for the Czech Republic, Poland, Turkey and South Korea. In addition, we also
find phase arrows tilted to left-down in the Czech Republic, Poland and Turkey, which
indicates that stock markets have a leading role during WFC and ESDC. Only in case
of India, phase arrows are directed to straight right or to right-down, which indicates
that rupee lead SENSEX at 16-32 days’ time-horizon, while at longer time-horizon
they suggest an in-phase position. Similar to the Indian case, Russian phase arrows
point to right-down, which is a sign that second variable (rouble) is leading. Negative
coherence in majority of the emerging markets, indicates that the portfolio-balance
approach or capital outflow stands behind the nexus between the two major financial
markets during WFC and probably during ESDC in these economies.
As for the U.S. case, we also find strong coherence area during WFC at
relatively lower frequencies, between 32-64 days. It can be seen that U.S.’s phase
arrows point to right or right-down, indicating positive coherence or leading role of
USD. Unlike emerging markets’ currencies, USD actually appreciated during WFC
(see Figure 1), which suggests that global investors saw American currency as some
kind of safe haven during that stressful time. Contrary to USD, American index,
S&P500, had similar fate as all emerging markets’ indices, that is, it dramatically lost
its value during WFC. Due to these concurring events, we find straight-right phase
Finance a úvěr-Czech Journal of Economics and Finance, 68, 2018, no. 5 501
arrows in the American case, which is in line with the flow-oriented model that is
associated with the current account balance.
However, applying the phase arrows methodology within WTC framework, we
can get limited insight about the phase direction, that is, only at high coherence areas,
while in tranquil periods it is not possible. Thus, trying to determine which theory
better explains the stock-exchange rate nexus throughout the observed period solely
on this indicator, could be superficial and biased, because in extreme market periods
irrational and idiosyncratic factors are more dominant in comparison to fundamentals.
This applies for both developed and emerging markets. Therefore, in order to provide
more solid grounds for our conclusions, we present the results of phase difference
approach by Aguiar-Conraria and Soares (2011a) in sixth Section.
6. Phase Difference Results
6.1 Short-Term Phase Difference Results
This subsection presents the findings for phase difference at 2-32 days
frequency bands, that is, at shorter time-horizon. Researchers do not normally observe
phase difference at high frequencies, because of its pretty chaotic dynamics. However,
Leung et al. (2017) asserted that volatility between exchange rate and stock markets is
transmitted at high speed, so we calculate short-term phase difference plots alongside
with their long-term counterparts. Figures 3 and 4 contain these plots. In order to
properly determine the lead(lag) connection between assets, we need to know the order
of variables in the phase difference computation process. Thus, caption of the plots
helps out, in a sense that the stock indices are X, while the currencies are Y variable.
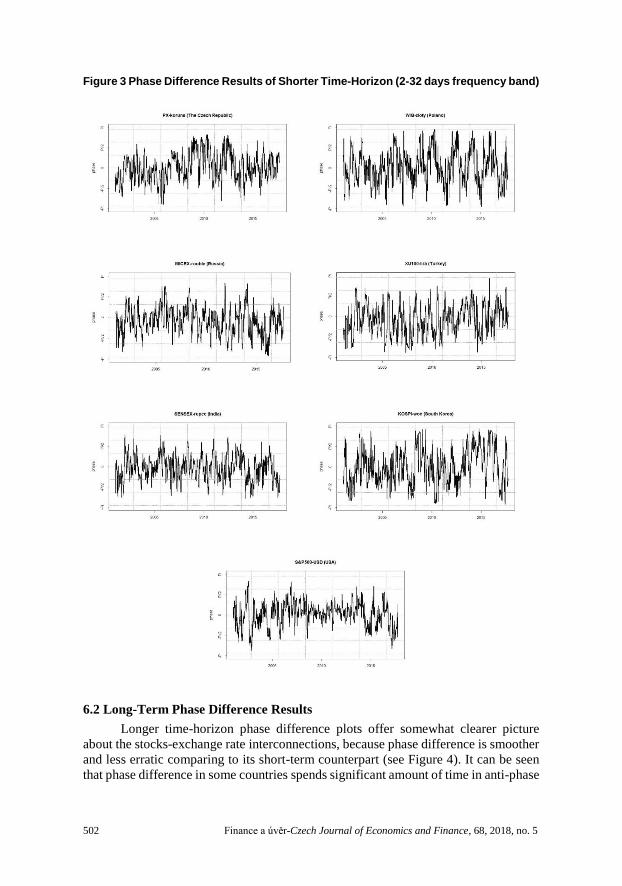
Observing short-term phase difference dynamics during WFC and ESDC, we
can assess whether irrational investors’ phenomena like financial panics, herd
behaviour and loss of confidence instigated motion of stocks and exchange rate in
accordance with the portfolio balance approach in the emerging markets. Figure 3
reveals that phase difference line is clearly in anti-phase domain (between /2 and )
during WFC and ESDC in cases such as the Czech Republic, Poland, Russia, South
Korea and somewhat Turkey. Rationale behind these findings is that most likely the
portfolio balance approach explains the nexus in these countries at that turbulent time
at short-term, whereby pure contagion and capital flight might be the main culprits for
such interdependence. In addition, since phase difference line find itself in the second
quadrant, it means that stock markets had leading role during WFC, that is, spillover
shocks were transmitted from stock markets toward currency markets. These findings
concur with the results of Lin (2012) who found that slowdown of an economy affected
emerging stock prices during WFC, subsequently prompting international investors to
withdraw their capital, thus putting downward pressure on the currency. On the other
hand, such scenario is not so obvious for Indian economy during WFC. As for the U.S.,
we find very little evidence that the two markets behave in line with portfolio balance
theory throughout whole sample, because phase difference predominantly takes in-
phase position, in the realm between /2 and -/2.
502 Finance a úvěr-Czech Journal of Economics and Finance, 68, 2018, no. 5
Figure 3 Phase Difference Results of Shorter Time-Horizon (2-32 days frequency band)
6.2 Long-Term Phase Difference Results
Longer time-horizon phase difference plots offer somewhat clearer picture
about the stocks-exchange rate interconnections, because phase difference is smoother
and less erratic comparing to its short-term counterpart (see Figure 4). It can be seen
that phase difference in some countries spends significant amount of time in anti-phase
Finance a úvěr-Czech Journal of Economics and Finance, 68, 2018, no. 5 503
domain even at longer-term, which particularly applies for Poland, Russia, Turkey and
South Korea. This is not unusual since some related studies also revealed the presence
of long-run relationship between exchange rates and stock prices. For instance, Yau
and Nieh (2009) investigated the Taiwanese case, while Wu et al. (2012) researched
the nexus in the Philippines. They both reported the existence of long-run relationship
in these economies.
As for our results, Polish phase difference is dominantly in anti-phase region
(between /2 and ), which also means that shocks are transferred from the stock
market to the exchange rate market at longer-horizon. These results coincide with the
previously calculated phase arrows. It is obvious for the WFC period, but also for
period between 2002-2004 that could be associated with crisis in Iraq. Another Polish
anti-phase situation is found around 2011 and 2012 (ESDC crisis), but this time
exchange rate has leading role. As can be seen in Figure 1, Polish zloty significantly
depreciated around 2011 and 2012, while WIG also lost its value. We find an anti-
phase situation with the leading role of WIG in the period around 2015 and 2016. At
that time, WIG lost its value, which transferred to zloty eventually.
Russian plot reports first obvious antiphase situation around 2012 and 2013
with the leading role of rouble. From the sample beginning till that years, phase
difference is constantly in in-phase position, whereas it takes an anti-phase position
quite often after these years. Probable reason for such long in-phase period in case of
Russia is the fact that Russian currency was under tight management regime until 2008,
and heavy exchange rate interventions afterwards. Another anti-phase situation is
found around 2014, whereby MICEX has leading role this time. Rouble leads again in
anti-phase situation around 2016, which can be linked with the time when rouble
depreciated substantially due to the steep oil price drop (see Figure 1).
In Turkish case, we found an anti-phase situation, according to the portfolio
balance approach, between 2003 and 2006 with the changing leading(lagging) rolls
between XU100 index and Turkish lira. At that time, XU100 had strong path of
growth, while lira showed appreciation tendencies (see Figure 1). From 2009 to the
end of observed sample, XU100 and lira are in-phase, in accordance with the flow-
oriented theory.
In South Korean case, first anti-phase pattern is reported around 2003 with
leading role of won. Korean currency depreciated and KOSPI lost its value during that
year. Second anti-phase situation was between 2004-2007 when reverse happened, that
is, KOSPI had leading position. Phase difference lies in anti-phase domain (between -
/2 and -) during WFC. Unlike short-term horizon, in the long-term perspective, won
actually affected KOSPI, that is, delayed depreciation effects subsequently dragged
stock prices downward. Anti-phase situation in Korea is also present around 2014 and
2016, whereby in former case KOSPI has leading role, while in the latter case won is
the one that leads.

504 Finance a úvěr-Czech Journal of Economics and Finance, 68, 2018, no. 5
Figure 4 Phase Difference Results in Long-Term Horizon (32-128 days frequency band)
As for the Czech and Indian cases, phase differences do not enter an anti-phase
domain frequently (beyond /2 and -/2 boundaries), and even when they do, it does
not last for long. These results indicate positive coherence, whereby Czech koruna and
Indian rupee have leading role for most of the time (domain between 0 and /2). This
suggests that interconnection between the major financial markets in the Czech
Republic and India behaves predominantly in accordance with the flow-oriented model
at 32-128 frequency band. In other words, capital inflows and outflows do not play a
big role when it comes to the determination of stock-exchange rate nexus at longer
time-horizon, but rather increase in trade balance binds the ties between stock and
foreign exchange markets for these economies. This is not unusual for emerging
markets, since Phylaktis and Ravazzolo (2005), who studied a group of emerging
Finance a úvěr-Czech Journal of Economics and Finance, 68, 2018, no. 5 505
Pacific-basin countries, also found an evidence of positive correlation between stock
and foreign exchange markets in long-run, which is in accordance with the flow-
oriented model.
Phase difference of the U.S. goes very rarely in an anti-phase region, and when
it happens it is short-lived. These results suggest that capital mobility is not a major
factor that determines stocks-exchange rate nexus in 32-128 frequency band in the U.S.
In other words, unlike investors in emerging markets, the U.S. investors neither
abandon USD when American stocks demonstrate tendency to fall, nor they invest
more in the U.S. stocks when USD has appreciating trends. Therefore, positive
coherence that we found in the U.S. can be explained more likely by the fact that
depreciating USD helps, while appreciating USD harms American exporters, and due
to that connection, American stocks rise or fall accordingly, which is in line with the
flow-oriented model.
7. Interrelationship Between Real Stock Returns and Real Exchange Rate
Changes
This section presents the results of wavelet coherence and phase difference
calculated on the real stock returns and the real exchange rate changes. Calculations
on real values are considered because some of the selected countries have experienced
much higher inflation than the euro area. Therefore, it is reasonable to check whether
the results remain the same if we also take into account the level of inflation in our
computation processes. Table 2 presents average annual inflation rates for the selected
emerging markets. It can be seen that Turkey, Russia and India have relatively higher
average annual inflation, than the other three countries of the sample. In order to
calculate real values of the assets, we observe monthly stock returns and exchange rate
changes. Real values are calculated via following equation: ℝ𝑖 = ℕ𝑖 × 𝐶𝑃𝐼∗/𝐶𝑃𝐼𝑖 , where ℝ and ℕ stand for real and nominal values, respectively, whereas CPI* and CPI
indicate consumer price index for euro area and for emerging markets, while (i)
denotes particular emerging market. Figures 5 and 6 present calculated plots of wavelet
coherence and phase difference, respectively.
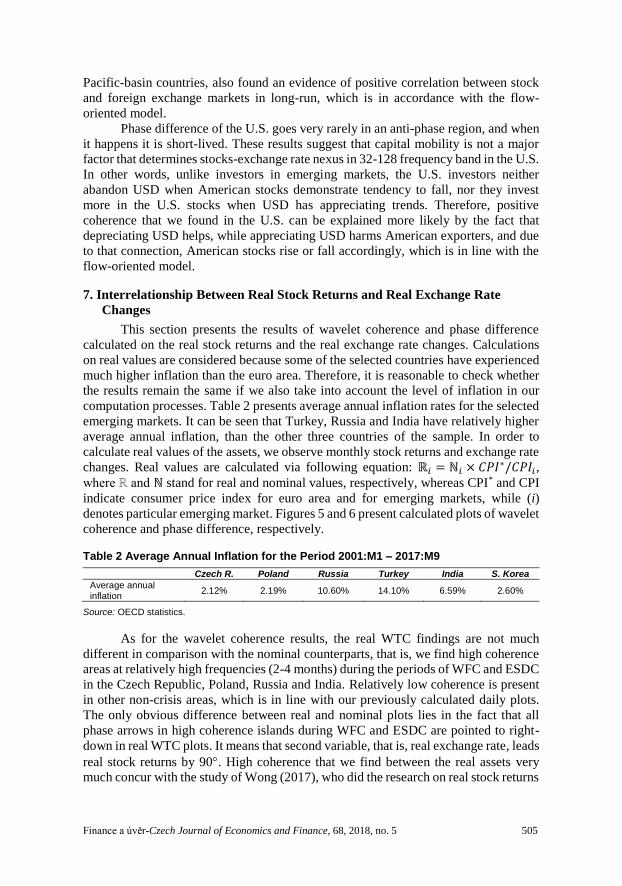
Table 2 Average Annual Inflation for the Period 2001:M1 – 2017:M9
Czech R. Poland Russia Turkey India S. Korea
Average annual inflation
2.12% 2.19% 10.60% 14.10% 6.59% 2.60%
Source: OECD statistics.
As for the wavelet coherence results, the real WTC findings are not much
different in comparison with the nominal counterparts, that is, we find high coherence
areas at relatively high frequencies (2-4 months) during the periods of WFC and ESDC
in the Czech Republic, Poland, Russia and India. Relatively low coherence is present
in other non-crisis areas, which is in line with our previously calculated daily plots.
The only obvious difference between real and nominal plots lies in the fact that all
phase arrows in high coherence islands during WFC and ESDC are pointed to right-
down in real WTC plots. It means that second variable, that is, real exchange rate, leads
real stock returns by 90. High coherence that we find between the real assets very
much concur with the study of Wong (2017), who did the research on real stock returns

506 Finance a úvěr-Czech Journal of Economics and Finance, 68, 2018, no. 5
and real exchange rate changes in five Asian and two European countries and found
that real values of these markets are significantly correlated in the period of the
financial crises.
Figure 5 Wavelet Square Coherence Between Real Stock Returns and Real Exchange Rate Changes
Finance a úvěr-Czech Journal of Economics and Finance, 68, 2018, no. 5 507
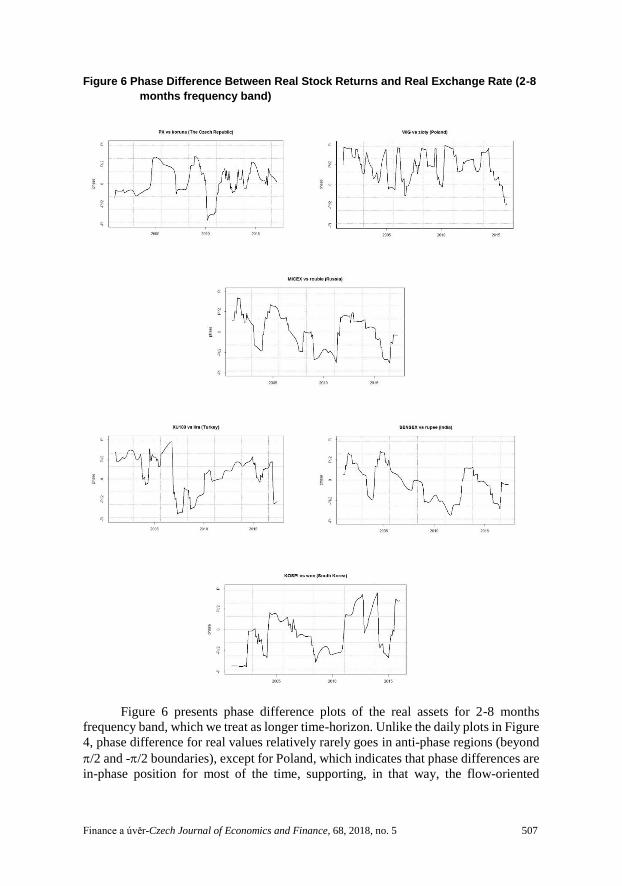
Figure 6 Phase Difference Between Real Stock Returns and Real Exchange Rate (2-8
months frequency band)
Figure 6 presents phase difference plots of the real assets for 2-8 months
frequency band, which we treat as longer time-horizon. Unlike the daily plots in Figure
4, phase difference for real values relatively rarely goes in anti-phase regions (beyond
/2 and -/2 boundaries), except for Poland, which indicates that phase differences are
in-phase position for most of the time, supporting, in that way, the flow-oriented

508 Finance a úvěr-Czech Journal of Economics and Finance, 68, 2018, no. 5
model. In other words, the real assets advocate stronger support to the flow-oriented
model in longer-run, than the daily nominal counterparts. Figure 6 suggests that the
inflation-corrected assets are positively correlated for most of the time in longer time-
horizon in all selected emerging markets, except Poland. Differently speaking, the
connection between the real assets is achieved most likely via current account, that is,
via higher export. In addition, it is important to noticed that lead-lag connection is more
persistent and long-lasting for some real assets. For instance, it can be seen that real
koruna and real lira have a leading role from 2012 and 2011, respectively, to the end
of the sample. MICEX leads from 2007 to 2011 and from 2015, while SENSEX leads
from 2007 to 2013, and from 2015 onwards. For Polish case, it is not clear which asset
has advantage, since phase difference constantly oscillates between in-phase and anti-
phase domains. In Korean cases, phase difference finds itself dominantly in-phase
realm, but without long-lasting leading role of particular asset.
8. Conclusion
This paper tries to determine whether the interdependence between the national
stock and exchange rate markets is in accordance with the portfolio balance approach
or the flow-oriented theory in the major emerging markets of Europe and Asia,
whereby we jointly observe time-frequency domain of the analysed nexus. As a
benchmark, we use the U.S. economy. For the research purposes, we apply relatively
novel methods of wavelet coherence and phase difference. The results from the
empirical analysis highlight a number of interesting issues.
Firstly, wavelet coherence reveals that strength of the nexus at lower scales as
well as at upper scales is not particularly strong throughout the whole sample, which
is in line with the existing literature. However, we find very high coherence at longer
time-horizons (between 32-64 days) during WFC and ESDC in all emerging markets
as well as in the U.S. economy. High coherence existed in that period due to extreme
market occurrences, such as contagion effect, widespread panic and rapid cross-market
fund rebalancing. Phase arrows in the Czech Republic, Poland, Turkey and South
Korea in high coherence areas point to left, which indicates to an anti-phase position,
whereas in India and the U.S, these indicators are directed to right, which is in line
with the in-phase situation. Results disclose that global investors abandoned most of
the analysed emerging markets’ currencies during WFC in fear of loses, whereas it did
not happen with Indian rupee. As for USD, it even became a wanted asset that
consequently appreciated significantly.
Secondly, in order to stipulate direction of the coherence in short and long
horizons, and over the entire sample, we utilize phase difference technique. Calculating
short-term phase difference, we learn that phase difference enters anti-phase domain
(between /2 and ) during WFC and ESDC in Czech Republic, Turkey, Poland,
Russia and South Korea. These results suggest that co-movement between exchange
rates and stock prices in these emerging markets is generally driven by the capital
account balance rather than that of trade during WFC, and that stock market has leading
role in short run. Phase difference at longer time-horizon indicate that an anti-phase
situation is relatively common occurrence in Poland and South Korea throughout the
entire sample. For Turkey, it applies till 2009, whereas for Russia, anti-phase situations
can be found from 2012. These results support the portfolio balance model. However,
Finance a úvěr-Czech Journal of Economics and Finance, 68, 2018, no. 5 509
when we apply the same type of calculation on real values, our results suggest that real
stock returns and real exchange rate changes overwhelmingly behave in accordance
with the flow-oriented model in all emerging markets, except Poland. As for the Czech
and Indian cases, real and nominal phase differences find itself dominantly in in-phase
realm, which means that interconnection between the major financial markets in the
Czech Republic and India behaves predominantly in accordance with the flow-oriented
model at long-term horizon. Phase difference of the U.S. goes very rarely in anti-phase
domains (beyond /2 and -/2 boundaries), which indicates that capital mobility is not
a major factor that determines stocks-exchange rate nexus in long-run in this country.
The overall results show that the stock-exchange rate nexus in the selected
emerging markets in longer-run in tranquil periods is determined by current account
rather than capital account, which is a frequent characteristic of developed markets as
well. Discrepancy between emerging and developed markets occurs only in crisis
periods when emerging markets’ currencies depreciate, while developed countries’
currencies tend to gain strength.
This study could serve well for global investors who are interested in these
countries and who take their investment positions at different time horizons. Also, the
results of this paper could help policy makers when they intend to intervene in
exchange rate market.
510 Finance a úvěr-Czech Journal of Economics and Finance, 68, 2018, no. 5
REFERENCES
Aguiar-Conraria L, Azevedo N, Soares MJ (2008): Using Wavelets to Decompose the Time-
Frequency Effects of Monetary Policy. Physica A: Statistical Mechanics and its Applications,
387(12):2863–2878.
Aguiar-Conraria L, Soares MJ (2011a): Business Cycle Synchronization and the Euro: A Wavelet
Analysis. Journal of Macroeconomics, 33(3):477–489.
Aguiar-Conraria L, Soares MJ (2011b): Oil and the Macroeconomy: Using Wavelets to Analyze Old
Issues. Empirical Economics, 40:645–655.
Andreou E, Matsi M, Savvides A (2013): Stock and Foreign Exchange Market Linkages in Emerging
Economies. Journal of International Financial Markets, Institutions and Money 27:248– 268.
Bahmani-Oskooee M, Saha S (2016): Do Exchange Rate Changes Have Symmetric or Asymmetric
Effects on Stock Prices? Global Finance Journal, 31:57–72.
Barunik J, Vacha L (2013): Contagion Among Central and Eastern European Stock Markets During
the Financial Crisis. Finance a úvěr-Czech Journal of Economics and Finance, 63(5):443-453.
Bekaert G, Harvey CR, Ng A (2005): Market Integration and Contagion. Journal of Business,
78(1):39–69.
Botoc C (2017) Univariate and Bivariate Volatility in Central European Stock Markets. Prague
Economic Papers, 26(2):127-141.
Cardarelli R, Elekdag S, Kose MA (2010): Capital inflows: Macroeconomic implications and policy
responses. Economic Systems 34(4): 333–356.
Conlon T, Cotter J (2012): An Empirical Analysis of Dynamic Multiscale Hedging Using Wavelet
Decomposition. Journal of Futures Markets, 32(3):272–299.
Dajčman S (2013): Interdependence Between Some Major European Stock Markets – A Wavelet
Led/Lag Analysis. Prague Economic Papers, 22(1):28-49.
Dewandaru G, Rizvi SAR, Masih R, Masih M, Alhabshi SO (2014): Stock market co-movements:
Islamic versus conventional equity indices with multi-timescales analysis. Economic Systems, 38(4),
553-571.
Dewandaru G, Masih R, Mansur MMA (2016): Contagion and Interdependence Across Asia-Pacific
Equity Markets: An Analysis Based on Multi-Horizon Discrete and Continuous Wavelet
Transformations. International Review of Economics and Finance, 43:363–377.
Diamandis P, Drakos A (2011): Financial Liberalization, Exchange Rates and Stock Prices:
Exogenous Shocks in Four Latin America Countries. Journal of Policy Modelling, 33(3):381–394.
Eng Y-K, Wong C-Y (2016) Asymmetric growth effect of capital flows: Evidence and quantitative
theory. Economic Systems 40(1): 64–81.
Grinsted A, Moore JC, Jevrejeva S (2004): Application of the Cross Wavelet Transform and Wavelet
Coherence to Geophysical Time Series. Nonlinear Processes in Geophysics, 11(5/6):561–566.
Hegerty SW (2009) Capital inflows, exchange market pressure, and credit growth in four transition
economies with fixed exchange rates. Economic Systems 33(2): 155–167.
Huang SC (2011): Wavelet-Based Multi-Resolution GARCH Model for Financial Spillover Effects.
Mathematics and computers in simulation, 81(11):2529–2539.
Hwang I, Park H, Park S (in press) Capital flow management policies in emerging market economies:
Are they successful in mitigating drastic changes of capital flows. International Journal of Finance
and Economics.
Jammazi R (2012): Cross Dynamics of Oil-Stock Interactions: A Redundant Wavelet Analysis.
Energy, 44(1):750–777.
Laidroo L, Grigaliuniene Z (2012): Testing for asymmetries in price reactions to quarterly earnings
announcements on Tallinn, Riga and Vilnius Stock Exchanges during 2000–2009. Baltic Journal of
Economics, 12(1): 61-86.

Finance a úvěr-Czech Journal of Economics and Finance, 68, 2018, no. 5 511
Lee CM, Lee HS (2016): Improving the predictive power of spreads for economic activity: A wavelet
method. Romanian Journal of Economic Forecasting, 19(4): 65-78.
Leung H, Schiereck D, Schroeder F (2017): Volatility Spillovers and Determinants of Contagion:
Exchange Rate and Equity Markets During Crises. Economic Modelling, 61:169–180.
Liang CC, Lin JB, Hsu HC (2013): Reexamining the Relationships Between Stock Prices and
Exchange Rates in ASEAN-5 Using Panel Granger Causality Approach. Economic modelling,
32:560–563.
Liivamägi K (2016): Investor education and trading activity on the stock market. Baltic Journal of
Economics, 16(2), 114-131.
Lin C-H (2012): The Comovement Between Exchange Rates and Stock Prices in the Asian Emerging
Markets. International Review of Economics and Finance, 22(1):161–172.
Lin F-L, Chen Y-F, Yang S-Y. (2016): Does the Value of US Dollar Matter with the Price of Oil and
Gold? A Dynamic Analysis from Time–Frequency Space. International Review of Economics and
Finance, 43:59–71.
Nikkinen J, Pynnönen S, Ranta M, Vähämaa S (2011) Cross-dynamics of exchange rate expectations:
a wavelet analysis. International Journal of Finance and Economics, 16(3), 205-217.
Njegić J, Živkov D, Damnjanović J (2017): Business Cycles Synchronization Between EU15 and the
Selected Eastern European Countries – The Wavelet Coherence Approach. Acta Oeconomica,
27(4):539-556.
Phylaktis K, Ravazzolo F (2005): Stock Prices and Exchange Rate Dynamics. Journal of International
Money and Finance, 24(7):1031–53.
Rua A, Nunes L C (2009): International Co-Movement of Stock Market Returns: A Wavelet Analysis.
Journal of Empirical Finance, 16(4):632–639.
Sui L, Sun L (2016): Spillover Effects Between Exchange Rates and Stock Prices: Evidence from
BRICS Around the Recent Global Financial Crisis. Research in International Business and Finance,
36:459–471.
Syllignakis NM, Kouretas PG (2011): Dynamic Correlation Analysis of Financial Contagion:
Evidence from the Central and Eastern European Markets. International Review of Economics and
Finance, 20(4):717–32.
Tabak BM, Feitosa MA (2009): An Analysis of the Yield Spread as a Predictor of Inflation in Brazil:
Evidence from a Wavelets Approach. Expert Systems with Applications, 36(3):7129–7134.
Tiwari AK, Bhanja N, Dar AB, Islam F (2015): Time–Frequency Relationship Between Share Prices
and Exchange Rates in India: Evidence from Continuous Wavelets. Empirical Economics, 48:699–
714.
Torrence C, Compo GP (1998): A Practical Guide to Wavelet Analysis. Bulletin of the American
Meteorological Society, 79(1):61–78.
Torrence C, Webster PJ (1999): Interdecadal Changes in the ENSO-Monsoon System. Journal of
Climate, 12(8):2679–2690.
Tsai S-L, Chang T (2018): The Comovement Between Money and Economic Growth in 15 Asia-
Pacific Countries: Wavelet Coherency Analysis in Time-Frequency Domain. Romanian Journal of
Economic Forecasting, 21(2): 63-79.
Vacha L, Barunik J (2012): Co-Movement of Energy Commodities Revisited: Evidence from Wavelet
Coherence Analysis. Energy Economics, 34(1):241–247.
Wong HT (2017): Real Exchange Rate Returns and Real Stock Price Returns. International Review
of Economics and Finance, 49:340–352.
Wu KJ, Lu CC, Jono H, Perez I (2012): Interrelationship Between Philippine Stock Exchange Index
and USD Exchange Rate. Procedia - Social and Behavioral Sciences, 40:768–782.
Yang Z, Tu AH, Zeng Y (2014): Dynamic Linkages Between Asian Stock Prices and Exchange Rates:
New Evidence from Causality in Quantiles. Applied Economics, 46(11):1184-1201.

512 Finance a úvěr-Czech Journal of Economics and Finance, 68, 2018, no. 5
Yau HY, Nieh CC (2009): Testing for Cointegration with Threshold Effect Between Stock Prices and
Exchange Rates in Japan and Taiwan. Japan and the World Economy, 21(3):292–300.
Živkov D, Njegić J, Milenković I (2015): Bidirectional Volatility Spillover Effect Between Exchange
Rate and Stocks in the Presence of Structural Breaks in the Selected East European Economies.
Finance a úvěr-Czech Journal of Economics and Finance, 65(6):477-498.
Živkov D, Njegić J, Pavlović J (2015) Dynamic Correlation Between Stock Returns and Exchange
Rate and Its Dependence on Conditional Volatilities – The Cases of Several Eastern European
Countries. Bulletin of Economic Research, 68(S1):28-41.
Živkov D, Njegić J, Mirović V (2016): Dynamic Nexus Between Exchange Rate and Stock Prices in
the Major East European Economies. Prague Economic Papers, 25(6):686-705.