
JEFFERSON MATH PROJECT REGENTS BY PERFORMANCE …
99
JEFFERSON MATH PROJECT REGENTS BY PERFORMANCE INDICATOR: TOPIC NY Integrated Algebra Regents Exam Questions from Fall 2007 to January 2012 Sorted by PI: Topic www.jmap.org Dear Sir I have to acknolege the reciept of your favor of May 14. in which you mention that you have finished the 6. first books of Euclid, plane trigonometry, surveying & algebra and ask whether I think a further pursuit of that branch of science would be useful to you. there are some propositions in the latter books of Euclid, & some of Archimedes, which are useful, & I have no doubt you have been made acquainted with them. trigonometry, so far as this, is most valuable to every man, there is scarcely a day in which he will not resort to it for some of the purposes of common life. the science of calculation also is indispensible as far as the extraction of the square & cube roots; Algebra as far as the quadratic equation & the use of logarithms are often of value in ordinary cases: but all beyond these is but a luxury; a delicious luxury indeed; but not to be indulged in by one who is to have a profession to follow for his subsistence. in this light I view the conic sections, curves of the higher orders, perhaps even spherical trigonometry, Algebraical operations beyond the 2d dimension, and fluxions. Letter from Thomas Jefferson to William G. Munford, Monticello, June 18, 1799.
Transcript of JEFFERSON MATH PROJECT REGENTS BY PERFORMANCE …
JEFFERSON MATH PROJECTREGENTS BY PERFORMANCE
INDICATOR: TOPICNY Integrated Algebra Regents Exam Questions
from Fall 2007 to January 2012 Sorted by PI: Topic
www.jmap.org
Dear Sir
I have to acknolege the reciept of your favor of May 14. in which you mention that you have finished the6. first books of Euclid, plane trigonometry, surveying & algebra and ask whether I think a furtherpursuit of that branch of science would be useful to you. there are some propositions in the latter books ofEuclid, & some of Archimedes, which are useful, & I have no doubt you have been made acquainted withthem. trigonometry, so far as this, is most valuable to every man, there is scarcely a day in which he will notresort to it for some of the purposes of common life. the science of calculation also is indispensible as far asthe extraction of the square & cube roots; Algebra as far as the quadratic equation & the use of logarithmsare often of value in ordinary cases: but all beyond these is but a luxury; a delicious luxury indeed; butnot to be indulged in by one who is to have a profession to follow for his subsistence. in this light I view theconic sections, curves of the higher orders, perhaps even spherical trigonometry, Algebraical operationsbeyond the 2d dimension, and fluxions.
Letter from Thomas Jefferson to William G. Munford, Monticello, June 18, 1799.
Steve
Typewritten Text
STUDY GUIDE
Steve
Typewritten Text

-i-
TABLE OF CONTENTS
TOPIC PI: SUBTOPIC QUESTION NUMBER
NUMBERS, OPERATIONS AND PROPERTIES
A.N.6: Evaluating Expressions . . . . . . . . . . . . . . . . . . . . . . . . . . . 1-4A.N.1: Identifying Properties . . . . . . . . . . . . . . . . . . . . . . . . . . . . . 5-7A.N.1: Properties of Reals . . . . . . . . . . . . . . . . . . . . . . . . . . . . . . 8-11A.A.29-31: Set Theory . . . . . . . . . . . . . . . . . . . . . . . . . . . . . . . . 12-33
GRAPHS AND STATISTICS
A.S.5, 9: Frequency Histograms, Bar Graphs and Tables . . . . . 34-39A.S.5, 6: Box-and-Whisker Plots . . . . . . . . . . . . . . . . . . . . . . . . 40-49A.S.11: Quartiles and Percentiles . . . . . . . . . . . . . . . . . . . . . . . . . . . 50A.S.7-8, 12, 17: Scatter Plots . . . . . . . . . . . . . . . . . . . . . . . . . . . 51-62A.S.4, 16: Central Tendency . . . . . . . . . . . . . . . . . . . . . . . . . . . 63-69A.S.16: Average Known with Missing Data . . . . . . . . . . . . . . . . . . 70A.S.1-3, 13-14: Analysis of Data . . . . . . . . . . . . . . . . . . . . . . . . 71-89A.M.3: Error . . . . . . . . . . . . . . . . . . . . . . . . . . . . . . . . . . . . . . . 90-102
PROBABILITY
A.S.19: Sample Space . . . . . . . . . . . . . . . . . . . . . . . . . . . . . . 103-107A.S.21: Experimental Probability . . . . . . . . . . . . . . . . . . . . . . 108-111A.S.20, 22, 23: Theoretical Probability . . . . . . . . . . . . . . . . . 112-121A.S.20, 22, 23: Geometric Probability . . . . . . . . . . . . . . . . . . 122-127A.S.18: Conditional Probability . . . . . . . . . . . . . . . . . . . . . . . . . . . 128A.N.7: Multiplication Counting Principle . . . . . . . . . . . . . . . 129-130A.N.8: Permutations . . . . . . . . . . . . . . . . . . . . . . . . . . . . . . . . 131-137
EXPRESSIONS ANDEQUATIONS
A.A.1-3: Expressions . . . . . . . . . . . . . . . . . . . . . . . . . . . . . . . 138-152A.A.22: Solving Equations . . . . . . . . . . . . . . . . . . . . . . . . . . . 153-156A.A.25: Solving Equations with Fractional Expressions . . . . 157-162A.A.4-6: Modeling Equations . . . . . . . . . . . . . . . . . . . . . . . . 163-168A.A.22: Transforming Formulas . . . . . . . . . . . . . . . . . . . . . . 169-176
RATE
A.M.1: Using Rate . . . . . . . . . . . . . . . . . . . . . . . . . . . . . . . . . 177-179A.M.1: Speed . . . . . . . . . . . . . . . . . . . . . . . . . . . . . . . . . . . . . 180-187A.M.2: Conversions . . . . . . . . . . . . . . . . . . . . . . . . . . . . . . . . 188-192A.N.5: Percents . . . . . . . . . . . . . . . . . . . . . . . . . . . . . . . . . . . 193-196A.N.5: Direct Variation . . . . . . . . . . . . . . . . . . . . . . . . . . . . . 197-198
LINEAR EQUATIONS
A.A.32-33, 37: Slope . . . . . . . . . . . . . . . . . . . . . . . . . . . . . . . 199-210A.G.4: Graphing Linear Functions . . . . . . . . . . . . . . . . . . . . . . . . . 211A.A.34-35: Writing Linear Equations . . . . . . . . . . . . . . . . . . 212-220A.A.39: Identifying Points on a Line . . . . . . . . . . . . . . . . . . . 221-224A.A.36, 38: Parallel and Perpendicular Lines . . . . . . . . . . . . 225-232
INEQUALITIES
A.A.24: Solving Inequalities . . . . . . . . . . . . . . . . . . . . . . . . . 233-235A.A.21: Interpreting Solutions . . . . . . . . . . . . . . . . . . . . . . . . 236-240A.A.4-6: Modeling Inequalities . . . . . . . . . . . . . . . . . . . . . . . 241-251A.G.6: Linear Inequalities . . . . . . . . . . . . . . . . . . . . . . . . . . . 252-256
ABSOLUTE VALUE A.G.4-5: Graphing Absolute Value Functions . . . . . . . . . . . . 257-262

-ii-
QUADRATICS
A.A.20: Factoring Polynomials . . . . . . . . . . . . . . . . . . . . . . . 263-265A.A.19: Factoring the Difference of Perfect Squares . . . . . . . 266-276A.A.27: Solving Quadratics by Factoring . . . . . . . . . . . . . . . . . . . 277A.A.28: Roots of Quadratics . . . . . . . . . . . . . . . . . . . . . . . . . 278-284A.G.5: Graphing Quadratic Functions . . . . . . . . . . . . . . . . . . 285-287A.G.8: Solving Quadratics by Graphing . . . . . . . . . . . . . . . . 288-291A.A.8: Writing Quadratics . . . . . . . . . . . . . . . . . . . . . . . . . . . 292-294A.A.8: Geometric Applications of Quadratics . . . . . . . . . . . . 295-297A.G.10: Identifying the Vertex of a Quadratic Given Graph . 298-304A.A.41: Identifying the Vertex of a Quadratic Given Equation 305-309
SYSTEMS
A.A.10, G.7: Solving Linear Systems . . . . . . . . . . . . . . . . . . 310-318A.A.7: Writing Linear Systems . . . . . . . . . . . . . . . . . . . . . . . 319-328A.A.40, G.7: Systems of Linear Inequalities . . . . . . . . . . . . . 329-336A.A.11, G.9: Quadratic-Linear Systems . . . . . . . . . . . . . . . . . 337-349
POWERS
A.A.13: Addition and Subtraction of Monomials . . . . . . . . . . . . . . 350A.A.13: Addition and Subtraction of Polynomials . . . . . . . . . 351-356A.A.13: Multiplication of Polynomials . . . . . . . . . . . . . . . . . . . . . 357A.A.14: Division of Polynomials . . . . . . . . . . . . . . . . . . . . . . 358-359A.A.12: Multiplication of Powers . . . . . . . . . . . . . . . . . . . . . 360-361A.A.12: Division of Powers . . . . . . . . . . . . . . . . . . . . . . . . . . 362-367A.A.12: Powers of Powers . . . . . . . . . . . . . . . . . . . . . . . . . . . 368-370A.N.4: Operations with Scientific Notation . . . . . . . . . . . . . . 371-375A.A.9: Exponential Functions . . . . . . . . . . . . . . . . . . . . . . . . 376-386A.G.4: Graphing Exponential Functions . . . . . . . . . . . . . . . . . . . . 387
RADICALS A.N.2: Simplifying Radicals . . . . . . . . . . . . . . . . . . . . . . . . . 388-395A.N.3: Operations with Radicals . . . . . . . . . . . . . . . . . . . . . . 396-400
RATIONALS
A.A.16: Rational Expressions . . . . . . . . . . . . . . . . . . . . . . . . 401-407A.A.15: Undefined Rationals . . . . . . . . . . . . . . . . . . . . . . . . . 408-415A.A.18: Multiplication and Division of Rationals . . . . . . . . . 416-421A.A.18: Addition and Subtraction of Rationals . . . . . . . . . . . 422-431A.A.26: Solving Rationals . . . . . . . . . . . . . . . . . . . . . . . . . . . 432-439
FUNCTIONSA.G.4: Families of Functions . . . . . . . . . . . . . . . . . . . . . . . . . 440-445A.G.4: Identifying the Equation of a Graph . . . . . . . . . . . . . . . . . . 446A.G.8: Defining Functions . . . . . . . . . . . . . . . . . . . . . . . . . . . 447-455
TRIANGLES A.A.45: Pythagorean Theorem . . . . . . . . . . . . . . . . . . . . . . . . 456-464
TRIGONOMETRYA.A.42: Trigonometric Ratios . . . . . . . . . . . . . . . . . . . . . . . . 465-472A.A.44: Using Trigonometry to Find a Side . . . . . . . . . . . . . 473-479A.A.44: Using Trigonometry to Find an Angle . . . . . . . . . . . 480-486
MEASURING IN THE PLANE AND SPACE
A.G.1: Compositions of Polygons and Circles . . . . . . . . . . . . 487-497A.G.2: Volume . . . . . . . . . . . . . . . . . . . . . . . . . . . . . . . . . . . . 498-502A.G.2: Surface Area . . . . . . . . . . . . . . . . . . . . . . . . . . . . . . . . 503-507

INTEGRATED ALGEBRA REGENTS EXAMINATION STUDY GUIDE www.jmap.org
1
This study guide for the New York State Integrated Algebra Regents Examination is intended for use with JMAP publications entitled:
• NY Integrated Algebra Regents Exam Questions from Fall 2007 to January 2012 Sorted by PI: Topic
• NY Integrated Algebra Regents Exam Questions from Fall 2007 to January 2012 Sorted by Topic (Answer Key)
Suggestions for Preparing for the Examination
• Start with a copy of the 507 questions that have been used in previous
administrations of the Integrated Algebra examination. o If you can solve the problems from the previous examinations, you should
be able to solve the problems on the next examination. • Read each problem and try to answer it in a notebook or on loose leaf paper.
o If you get stumped, go to the study guide and find the information that applies to the problem set you are working on. Read the information in the study guide and give the problem
another try. • If you are still unable to solve the problem, look up the
answer in the answer key. o Then, try to work backwards to see how the answer
was obtained. If you still can’t solve the problem based on
your own understanding, ask a friend for help.
• If your friend can’t help, ask your teacher.
• Work through all 507 questions. o If you are really certain that you know how to solve a group of problems,
move on to the next set of problems. Don’t give yourself credit that you don’t deserve.
• The person who suffers most when you don’t know how to solve a problem is you.
o Your score on the exam will be lower if you do not really understand the materials.
If you find any errors or have suggestions for materials to add or delete, let us know at www.jmap.org This book is copyrighted and intended only for free distribution to students and educators.

INTEGRATED ALGEBRA REGENTS EXAMINATION STUDY GUIDE www.jmap.org
2
Questions 1-4: A.N.6 Evaluate expressions involving factorial(s), absolute value(s), and exponential expression(s). An expression is a mathematical statement with no equal sign. An expression may have one or more terms. A term is a number, a variable, or the product of a number and a variable.
• To evaluate an expression, you must substitute a specified value for the variable(s) and simplify.
• Example: What is the value of the expression ( )23 0a b+ when 2a = − and 4b = ?
( )( ) ( )( )( ) ( )( )( )( )
23 0
23 0
23 0
2
2
2 4
8 1
7
49
a b+
+
− +
− +
−
FACTORIALS A factorial looks like a number followed by an exclamation point, n!. A factorial is defined as the number of permutations that can be created from n objects, and is read as n-factorial. Examples of factorials are shown below:
ABSOLUTE VALUE The absolute value of any number is defined as the number’s distance from zero on the number line. Since distance is always positive, absolute value is always positive.
Absolute value notation looks like a pair of straightened parentheses.
1! 1
2! 2 1 2
3! 3 2 1 6
4! 4 3 2 1 24
5! 5 4 3 2 1 120
6! 6 5 4 3 2 1 720
== × == × × == × × × == × × × × == × × × × × =

INTEGRATED ALGEBRA REGENTS EXAMINATION STUDY GUIDE www.jmap.org
3
Absolute value notation can be thought of as straight parentheses .
• When working with absolute value, treat the absolute value sign in the same way that you would treat parentheses. First, simplify the expression inside the absolute value sign. Second, make the resulting value positive and drop the absolute value
notation. o If there is a negative sign in front of the absolute value, the result will
be negative, as shown in the examples above. EXPONENTIAL EXPRESSIONS Integer Exponents: For any nonzero number a,
Negative and zero exponents: For any nonzero number a,
, and
Questions 5-11: A.N.1 Identify and apply the properties of real numbers (closure, commutative, associative, distributive, identity, inverse)
Commutative Properties of Addition and Multiplication For all real numbers a and b:
Associative Properties of Addition and Multiplication For all real numbers a, b, and c:
Distributive Properties of Addition and Multiplication
Identity Properties of Addition and Multiplication
Inverse Properties of Addition and Multiplication
Examples:
-7 7
7 7
7 7
7 7
=
=
− − = −
− = −
1 2 3 4; ; ; ; .a a a a a a a a a a a a a a etc= = × = × × = × × ×
a0 1= aa
nn
− =1
a b b a+ = + a b b a⋅ = ⋅
( ) ( )a b c a b c+ + = + + ( ) ( )a b c a b c⋅ ⋅ = ⋅ ⋅
a b c ab ac( )+ = + ( )a b c ab ac− = −( )b c a ba ca+ = + ( )b c a ba ca− = −
a a and a a+ = + =0 0 a a and a a⋅ = ⋅ =1 1
a a and a a+ − = − + =( ) ( )0 0 aa
anda
a⋅ = ⋅ =1
11
1

INTEGRATED ALGEBRA REGENTS EXAMINATION STUDY GUIDE www.jmap.org
4
Questions 12-33: A.A.29 Use set-builder notation and/or interval notation to illustrate the elements of a set, given the elements in roster form. A set is a well-defined collection of items. There are several different ways to describe sets. Listing the Elements. {a, b, c, d} This is a set of four small case letters, each of which is named. {1,2,3,4,5} This is a set of five positive integers, each of which is named. {….-3,-2,-1,0,1,2,3….} This is the set of all integers. Note that the four periods at each end of the list is used to show that the pattern keeps going to infinity. Set Builder Notation Elements of a set can also be described using set builder notation.
The set {1,2,3,4,5} can be written in set builder notation as: {x│0 < x < 6, where x is a whole number}
This is read as “the set of all values of x, where 0 is less than x and x is less than 6, and where x is a whole number.”
The set {1,2,3,4,5} can also be written in set builder notation as:
{ }1 5, x x where x is a whole number≤ ≤

INTEGRATED ALGEBRA REGENTS EXAMINATION STUDY GUIDE www.jmap.org
5
Equating Lists of Elements with Set Builder Notation Equating lists of elements with set builder notation requires carefully reading of the st builder notation. The following question appeared on a Regents examination. The set {1, 2, 3, 4} is equivalent to 1 {x|1 < x < 4, where x is a whole number} 2 {x|0 < x < 4, where x is a whole number} 3 {x|0 < x ≤ 4, where x is a whole number} 4 {x|1 < x ≤ 4, where x is a whole number} To answer this question, you need to first understand that the set {1, 2, 3, 4} includes four numbers, each of which is a whole number. Then, you need to see if all four numbers are included in the set builder notation choices. Choice 1 {x|1 < x < 4, where x is a whole number} can be eliminated as a correct answer
because this choice says that 1 x< , which is not true. Choice 4 {x|1 < x ≤ 4, where x is a whole number} can also be eliminated as a correct
answer because this choice also says that 1 x< , which is not true. This leaves us with two choices, only one of which can be correct. Choice 2 {x|0 < x < 4, where x is a whole number}can be eliminated as a correct answer
because this choice says that 4x < , which is not true. Choice 3 {x|0 < x ≤ 4, where x is a whole number} is the only option left. Zero is
indeed less that x and 4 is indeed equal to x. Choice 3 is the correct answer.
Using Number Lines to Define Sets The number line representation of the set of all numbers greater than 1 is as follows:
The number line representation of the set of all numbers greater to or equal to 1 is as follows:
Note: If the circle is empty, that value is not included in the set. If the circle is filled in, that value is included in the set.
Lesser Greater
0 1 2 3-1-2-3
Lesser Greater
0 1 2 3-1-2-3

INTEGRATED ALGEBRA REGENTS EXAMINATION STUDY GUIDE www.jmap.org
6
Interval Notation Interval notation uses curved and squared parenthesis to show where an interval of numbers (as on a number line) begins and ends. A curved parenthesis indicates that the number next to it is not included in the interval.
(2,6)
A squared parenthesis indicates that the number next to it is included in the interval.
[2,6]
Questions 21-33: A.A.30 Find the complement of a subset of a given set, within a given universe The complement of a subset is the subset of elements that must be added to the first subset to yield the original set. Example: The following problem appeared on a Regents examination: Given: U = {1, 2, 3, 4, 5, 6,7, 8} B = {2, 3, 5, 6} Set B is a subset of set U. What is the complement of set B? To solve this problem, take the original set U and cross out the members of subset
B. {1, 2, 3, 4, 5, 6,7, 8}
The complement of subset B is the set of numbers that is not crossed out. {1, 4, 7, 8}
NOTE: If you add the subset and the complement together, you get the original set.
A.A.31 Find the intersection of sets (no more than three sets) and/or union of sets (no more than three sets)
The intersection of two or more sets is the set of all elements that common to all of the given sets. Example: If set A = {1,2,3,6} and set B = {0,2,5,6,7}, then the intersection of sets A and B, denoted by is {2,6}.
A B∩
A B∩

INTEGRATED ALGEBRA REGENTS EXAMINATION STUDY GUIDE www.jmap.org
7
The union of two or more sets is the set of all elements contained in at least one of the sets. Example: If set A = {2,4,6,8,10} and set B = {1,2,3,4,5,6}, then the union of sets A and B, denoted by is {1,2,3,4,5,6,8,10}. Using Venn Diagrams to Describe Sets Venn Diagrams are often used to describe sets. Each circle represents a given set, and all element of the given set are inside the circle. The complement of the set is outside the circle. The union of sets in a Venn diagram would consist of all elements inside either circle in the union. The intersections of sets occurs where the circles overlap, as shown in the following diagram of A B C∪ ∪ .
Set B Set A
Set C
A B∩
B C∩ A C∩
A B C∩ ∩
A B∪
A B∪

INTEGRATED ALGEBRA REGENTS EXAMINATION STUDY GUIDE www.jmap.org
8
Questions 34-39: A.S.5 Construct a histogram, cumulative frequency histogram, and a box-and-whisker plot, given a set of data frequency table (A) (A2T) A table that shows how often each item, number, or range of numbers occurs in a set of data.
Example: The data {5 ,7, 6 , 8 , 9 , 5 , 13 , 2 , 1 , 6 , 5 , 14 , 10 , 5 , 9} can be displayed as a frequency distribution.
Interval Frequency
1-5 6 6-10 7 11-15 2
Source: NYSED Glossary
histogram (A) A frequency distribution for continuous quantitative data. The horizontal axis is a number line that displays the data in equal intervals. The frequency of each bar is shown on the vertical axis.
Example: This histogram shows the number of students in Simpson’s class that are in each interval. The students were asked how many hours they spent playing video games in one week.
Source: NYSED Glossary
INTEGRATED ALGEBRA REGENTS EXAMINATION STUDY GUIDE www.jmap.org
9
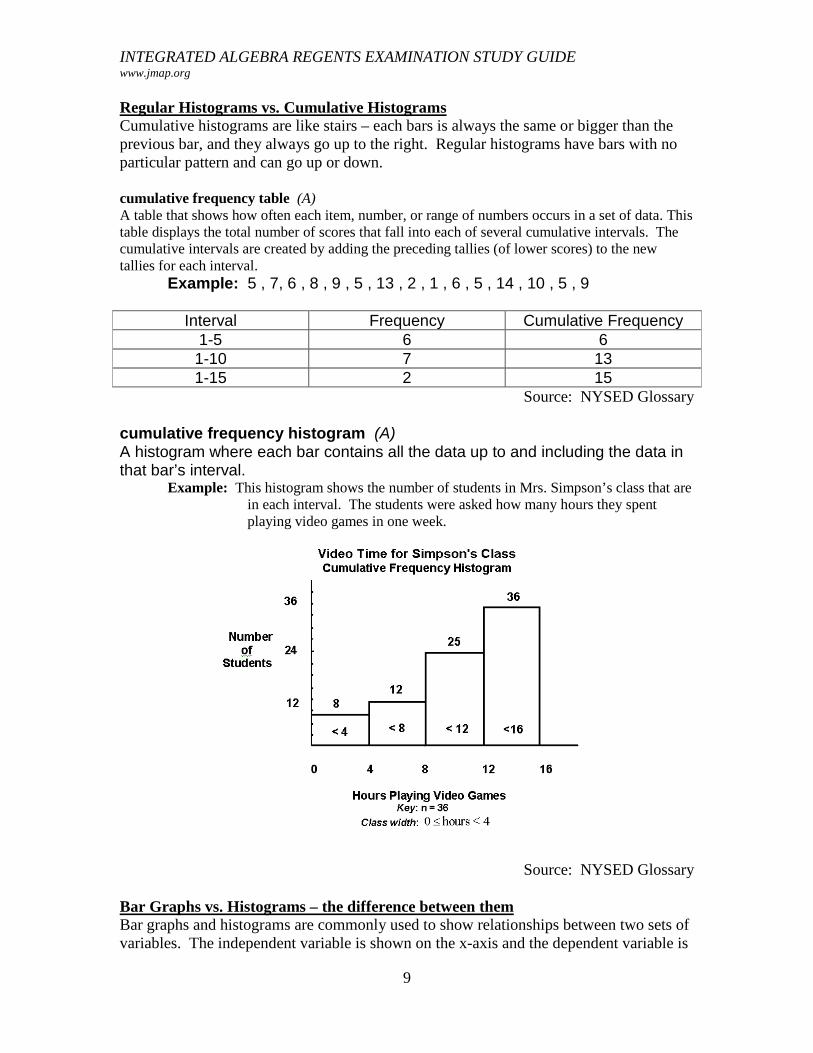
Regular Histograms vs. Cumulative Histograms Cumulative histograms are like stairs – each bars is always the same or bigger than the previous bar, and they always go up to the right. Regular histograms have bars with no particular pattern and can go up or down.
cumulative frequency table (A) A table that shows how often each item, number, or range of numbers occurs in a set of data. This table displays the total number of scores that fall into each of several cumulative intervals. The cumulative intervals are created by adding the preceding tallies (of lower scores) to the new tallies for each interval.
Example: 5 , 7, 6 , 8 , 9 , 5 , 13 , 2 , 1 , 6 , 5 , 14 , 10 , 5 , 9
Interval Frequency Cumulative Frequency 1-5 6 6 1-10 7 13 1-15 2 15
Source: NYSED Glossary
cumulative frequency histogram (A) A histogram where each bar contains all the data up to and including the data in that bar’s interval.
Example: This histogram shows the number of students in Mrs. Simpson’s class that are in each interval. The students were asked how many hours they spent playing video games in one week.
Source: NYSED Glossary
Bar Graphs vs. Histograms – the difference between them Bar graphs and histograms are commonly used to show relationships between two sets of variables. The independent variable is shown on the x-axis and the dependent variable is

INTEGRATED ALGEBRA REGENTS EXAMINATION STUDY GUIDE www.jmap.org
10
shown on the y-axis. Bar graphs should have spaces between the bars when discrete data is being graphed. For example, if you are graphing the number of people who prefer red, green, blue, or yellow, you would label the different colors on the x-axis and have spaces between each of the bars. This is because the data is discrete (discontinuous). Histograms, on the other hand, are used to graph continuous data. Histograms do not have spaces between the bars. The Regents Math A examinations tend to have problems involving histograms.
A.S. 9: Analyze and interpret a frequency distribution table or histogram, a cumulative frequency distribution table or histogram, or a box-and-whisker plot. This standard involves reverse engineering of the information contained in the section entitled graphs and statistics. Example: The following problem appeared in a Regents examination. The table below shows a cumulative frequency distribution of runners' ages.
According to the table, how many runners are in their forties? Solution: First, understand that this is a cumulative frequency table.
• The first age group consists of runners in their 20s. • The second age group consists of runners in their 20s and 30s. • The third age group consists of runners in their 30s and 40s.
If we want to know how many runners were in their forties, we need to subtract the total runners in the second age group from the total runners in the third age group.
25 18 7− =
Questions 40-49: A.S, 6: Understand how the five statistical summary (minimum, maximum, and the three quartiles) is used to construct a box-and-whisker plot box-and-whisker plot (A) A visual display of a set of data showing the five number summary: minimum, first quartile, median, third quartile, and maximum. This plot shows the range of scores within each quarter of the data. It is very useful for examining the variation in a set of data and comparing the variation of more than one set of data.
Source: NYSED Glossary

INTEGRATED ALGEBRA REGENTS EXAMINATION STUDY GUIDE www.jmap.org
11
The five vertical parts or a box and whisker plot are: 1. minimum (lowest score), 2. lower quartile ( ),
3. median ( ),
4. upper quartile ( ),
5. and maximum (highest score).
Question 50: A.S.11: Find the percentile rank of an item in a data set and identify the point values for first, second, and third quartiles. What are percentiles? A percentile shows what percent of an ordered distribution falls below a certain value. For example, the 65th percentile is the value (or score) below which 65 percent of the distribution may be found. If a score is in the 65th centile, it is higher than 64 percent of the other scores.
• The 25th percentile is also known as the first quartile (Q1). • The 50th percentile is also known as the median or second quartile (Q2). • The 75th percentile is also known as the third quartile (Q3).
How do I calculate a percentile?
• Put the data set in ascending order. • Count the items in the data set.
o Determine the ordinal position in the ordered data set of the value for which you wish to calculate a percentile.
o Use the formula:
BOX & WHISKERSMINIMUM
SCOREMAXIMUM
SCORE
1Q2Q 3Q
MEDIAN
25%
25% 25%
25%
SCALE
1Q
2Q
3Q
( )ordinal position of valuepercentile = 100
count of all items in ordered distribution

INTEGRATED ALGEBRA REGENTS EXAMINATION STUDY GUIDE www.jmap.org
12
Example: What is the percentile value for a score of 35 in the following set of test scores?
{7, 15, 27, 35, 38, 40, 55, 65, 72, 80, 94, 96, 98, 99, 100}
Answer: A score of 35 equates to the 27th percentile. 26% of all scores are assumed to be below a score of 35 on this test. What are quartiles and how do I find them?
• A quartile divides a data set into four equal parts.
• Start with Q2, which is also called the median. Q2 divides the data set into two
equal parts, or halves: the lower half starts at the minimum and goes up to the middle number, and the upper half starts at the middle number and goes up to the maximum.
o How do I find the middle number? Put the data set in ascending order. Count the items in the data set and determine if the count is even or
odd. • If odd, the median is the middle number. • If even, the median is halfway between the middle two
numbers. • Q1 is the point that divides the lower half of the data set into two equal parts, and
is calculated the same way that Q2 was calculated. o How do I find Q1?
Put the lower half of the data set in ascending order. Count the items in the lower half of the data set and determine if
the count is even or odd. • If odd, Q1 is the middle number. • If even, Q1 is halfway between the middle two numbers.
• Q3 is the point that divides the upper half of the data set into two equal parts, and is calculated the same way that Q1 and Q2 were calculated.
o How do I find Q3? Put the upper half of the data set in ascending order.
( ) ( )ordinal position of value 4percentile = 100 100 26.6 27
count of all items in ordered distribution 15= = =
BOX & WHISKERSMINIMUM
SCOREMAXIMUM
SCORE
1Q2Q 3Q
MEDIAN
25%
25% 25%
25%
SCALE

INTEGRATED ALGEBRA REGENTS EXAMINATION STUDY GUIDE www.jmap.org
13
Count the items in the upper half of the data set and determine if the count is even or odd.
• If odd, Q3 is the middle number. • If even, Q3 is halfway between the middle two numbers.
Questions 51-62: A.S. 7 Create a scatter plot of bivariate data scatter plot (A), (A2T) A graphical display of statistical data plotted as points on a coordinate plane to show the correlation between two quantities. Example: Below is a table of paired quantitative data and its scatter plot.
Household Number of dogs
Dollars spent each month on dog food
Perez 3 75 Jones 2 40
Balcovich 5 110 Parson 1 15
Montego 1 25 Schwartz 7 130 Barton 2 50 Walker 4 40
Source: NYSED Glossary Note that each pair of numbers in the table is plotted as a single point in the scatter plot. There are eight pairs of numbers in the table and eight points in the scatter plot.
A.S. 8 Construct manually a reasonable line of best fit for a scatter plot and determine the equation of that line
line of best fit (A) A line used to approximate and generalize the linear relationship between the independent and dependent variables for a set of data. It may not be equivalent to a least squares regression model.
The individual data points in a scatterplot form data clouds with shapes that suggest relationships between dependent and independent variables. When the suggested relationship is in the shape of a curved or straight line, we can imagine a line of best fit.
Dog Food Expenses in 8 households
$0
$20
$40
$60
$80
$100
$120
$140
0 2 4 6 8
Number of Dogs In Household
Dol
lars
spe
nt e
ach
mon
th o
n do
g fo
od

INTEGRATED ALGEBRA REGENTS EXAMINATION STUDY GUIDE www.jmap.org
14
A line of best fit divides the data cloud into two equal parts with about the same number of data points on each side of the line. Example: Given three data points: (1,4), (2,3), and (3,7).
Important Points:
1. The line of best fit will always go through , which is the average value of x
for all data points and the average value of y for all data points. Thus, the line of
best fit for the above three data points will go the point .
2. Regents problems often ask for the equation of the line of best fit. Use the y- intercept, the slope of the line, and to write the equation of the line of best fit.
A.S. 12 Identify the relationship between the independent and dependent variables from a scatter plot (positive, negative, or none). A scatter plot shows the relationship between one variable on the x-axis and another variable on the y-axis. Ordered pairs of data are plotted (without connecting lines) and the resulting data cloud can be used to visually identify the existence of positive correlations, negative correlations, no correlations, lines of best fit (trend lines) and correlation coefficients (strength of correlations).
Positive Correlation
In general, both sets of data increase together.
Negative Correlation. In general, one set of data decreases as the other set increases.
No Correlation. Sometimes data sets are not related and there is no general trend.
( ),x y
142,
3
y mx b= +

INTEGRATED ALGEBRA REGENTS EXAMINATION STUDY GUIDE www.jmap.org
15
A.S. 17 Use a reasonable line of best fit to make a prediction involving interpolation or extrapolation. A reasonable line of best fit may be used to make predictions about data that are:
• within the sample range and domain (interpolation), or • outsde the sample range and domain (extrapolation).
o Graphically, the line of best fit can be extended and used to estimate the relationship between the two variables at any point on the line.
o Algebraically, an equation for the line of best fit may be identified in format and any value of x or y input into the equation.
o A table of values may also be used.
Questions 63-69: A.S.4 Compare and contrast the appropriateness of different measures of central tendency for a given data set To solve these questions, you must compute the mean, median, and mode. How do I find the mean?
1. Find Sum of Items in Data Set 2. Count Items in Data Set 3. Divide Sum by Count
How do I find the median? 1. Put the data set in ascending order. 2. Count the items in the data set and determine if the count is even or odd.
a. If odd, median is middle number. b. If even, median is halfway between middle 2 numbers.
What are quartiles and how do I find them? A quartile divides a data set into four equal parts. Think of the median as dividing the data set into two parts: one that starts at the minimum and goes up to the median, and one that starts at the median and goes up to the maximum. The first quartile (often shown as Q1) divides the first part into two parts, and is calculated in the same way that the median is calculated. The second quartile (often shown as Q2) is the same as the median. The third quartile (often shown as Q3) divides the second part into two parts, and is calculated in the same way that the median is calculated.
How do I find the mode? 1. Put the data set in ascending order. 2. Find the number that occurs most frequently. Note: Data sets can have no mode, one mode, or many modes.
Computing the Mean, Median and Mode from Tables
y mx b= +
INTEGRATED ALGEBRA REGENTS EXAMINATION STUDY GUIDE www.jmap.org
16
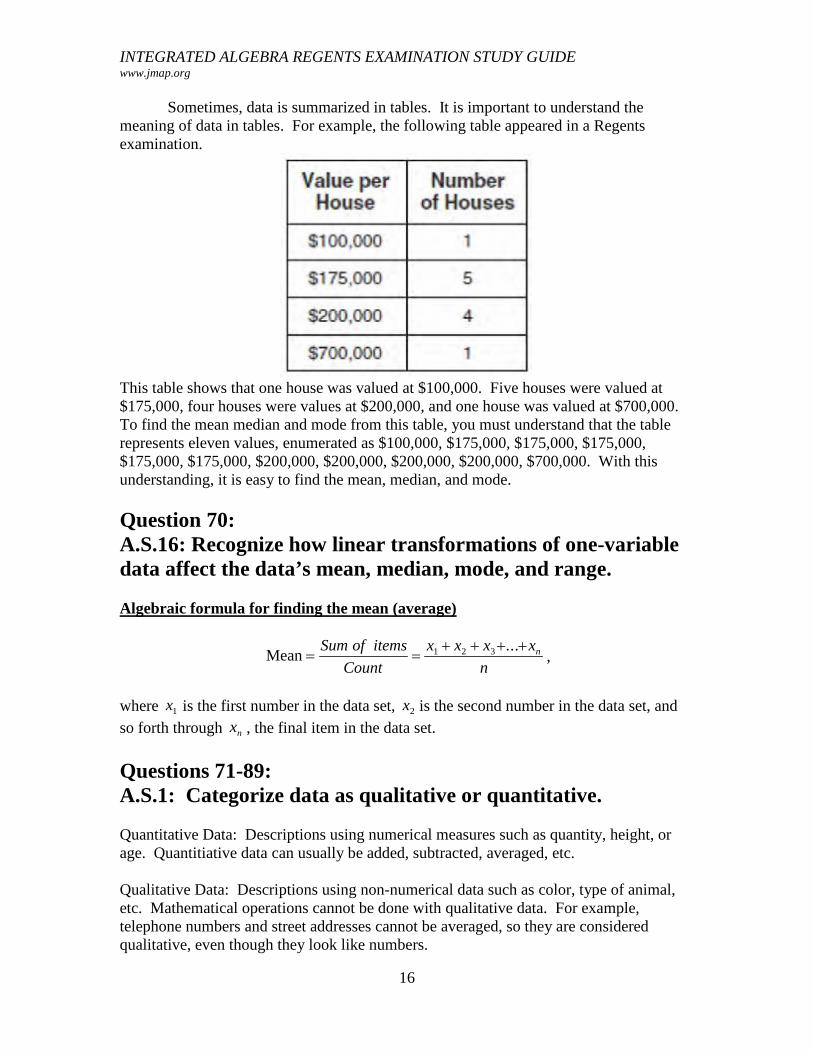
Sometimes, data is summarized in tables. It is important to understand the meaning of data in tables. For example, the following table appeared in a Regents examination.
This table shows that one house was valued at $100,000. Five houses were valued at $175,000, four houses were values at $200,000, and one house was valued at $700,000. To find the mean median and mode from this table, you must understand that the table represents eleven values, enumerated as $100,000, $175,000, $175,000, $175,000, $175,000, $175,000, $200,000, $200,000, $200,000, $200,000, $700,000. With this understanding, it is easy to find the mean, median, and mode. Question 70: A.S.16: Recognize how linear transformations of one-variable data affect the data’s mean, median, mode, and range. Algebraic formula for finding the mean (average)
,
where is the first number in the data set, is the second number in the data set, and so forth through , the final item in the data set.
Questions 71-89: A.S.1: Categorize data as qualitative or quantitative. Quantitative Data: Descriptions using numerical measures such as quantity, height, or age. Quantitiative data can usually be added, subtracted, averaged, etc. Qualitative Data: Descriptions using non-numerical data such as color, type of animal, etc. Mathematical operations cannot be done with qualitative data. For example, telephone numbers and street addresses cannot be averaged, so they are considered qualitative, even though they look like numbers.
Mean = =+ + + +Sum of items
Countx x x x
nn1 2 3 ...
x1 x2
xn

INTEGRATED ALGEBRA REGENTS EXAMINATION STUDY GUIDE www.jmap.org
17
Questions 71-89: A.S.2: Determine whether the data to be analyzed is univariate or bivariate. univariate (A), (A2T) A set of data involving one variable. bivariate data (A), (A2T) Data involving two variables
Questions 71-89: A.S.3: Determine when collected data or display of data may be biased.
biased sample (A2T) A sample having a distribution that is determined not only by the population from which it is drawn, but also by some property that influences the distribution of the sample.
• Example: If you want to know what the general population thinks about soccer, you would not go to a soccer game and take a poll. The soccer fans are biased in favor of soccer.
• A poll to determine whether a stop sign is needed at a school crossing might be biased if the sample polled consisted only of parents who dropped their children off at school.
Questions 71-89: A.S.13: Understand the difference between correlation and causation. Correlation: Event A is related to, but does not necessarily cause event B. A statistical measure that quantifies how pairs of variables are related; a linear relationship between two variables. Causation: Event A causes event B.
A.S.14: Identify variables that might have a correlation but not a causal relationship. Fallacy of Composition: The erroneous conclusion that because event B follows event A, that event A caused event B.
Example: Event A is that the village shaman does the rain dance in the spring. Event B is the coming of the spring rains. Events A and B are correlated, but event A does not cause event B. The spring rains are caused by natural weather

INTEGRATED ALGEBRA REGENTS EXAMINATION STUDY GUIDE www.jmap.org
18
patterns, not the shaman’s dancing. It would be a fallacy of composition to say that the shaman’s dance caused the rains.
Questions 90-102: A.M.3: Calculate the relative error in measuring square and cubic units, when there is an error in the linear measure.
Relative error is the the ratio of the absolute error in a measurement to the actual (true) size of the measurement. The absolute error in a measurement is the difference between what is measured and what is actual (true). Relative error is often called the percent of error and expressed as a percent.
( )
measured-actualRelative Error =
measuredmeasured-actual
Percent Error = 100 %measured

INTEGRATED ALGEBRA REGENTS EXAMINATION STUDY GUIDE www.jmap.org
19
Questions 103-107: A.S.19: Determine the number of elements in a sample space and the number of favorable events. A sample space is a simple listing of the possible outcomes of a probability problem.
Tree Diagrams and Sample Spaces
A tree diagram shows different possible outcomes from two or more events involving probability. The tree diagram shows the possible outcomes of tossing a coin followed by tossing a number cube. There are 12 possible outcomes, shown by the branches of this tree diagram.
HeadsHeads
11
22
33
44
55
66
TailsTails
11
22
33
44
55
66
Event 1Coin Toss
Event 2# Cube
Possible Outcomes
TREE DIAGRAM
SAMPLE SPACE
H1
H2
H3
H4
H5
H6
T1
T2
T3
T4
T5
T6
A sample space simply lists each of the possible outcomes from two or more events involving probability. The sample space shows the possible outcomes of tossing a coin followed by tossing a number cube. There are 12 possible outcomes, shown by a simple listing.
If you want to know the number of favorable outcomes from two events, you can use a tree diagram or sample space. For example, the above tree diagram or sample space can be used to determine the probability of getting a tail on a coin toss followed by and even number. Simply count the number of outcomes with tails and even numbers (3), then count the total possible outcomes (12). Tails followed by an even number should occur 3 out of 12 times, or 1/4th of the time.
Questions 108-111: A.S.21: Determine empirical probabilities based on specific sample data. Experimental Probability: When using empirical data, the probability of an event happening is determined by dividing the number of times the event happens by the number of times the experiment is done. In this context, and experiment is like an observation.
( )number of time the event happens
number of times the experiment is doneeventP =
Example: The following problem appeared on a Regents examination. After receiving complaints, a retailer checked 100 flashlights at random. Eighty worked. What is the probability that a flashlight works?

INTEGRATED ALGEBRA REGENTS EXAMINATION STUDY GUIDE www.jmap.org
20
( )
( )
number of time the event happens
number of times the experiment is done
80
100: This answer could also be expressed as 80% or an equivalent fraction.
event
flashlight works
P
P
NOTE
=
=
Questions 112-116: A.S.20: Calculate the probability of an event and its complement
Theoretical Probability
( )event
number of favorable outcomesP
number of possible outcomes=
An “event” is the particular outcome being measured, and in the above equation refers to the “favorable outcome” in the numerator, even though some events, like rain during the school picnic, are not really very favorable. Probability can be expressed as a fraction, a decimal, or a percent. Complementary events are mutually exclusive. Mutually exclusive events prevent other events from occurring. For examples: If a spinner lands on blue, it cannot land on “not” blue. If it rains, it cannot “not” rain. If a teacher calls on a girl, she cannot call on a boy. If the door is open, it is not closed. If a student is a freshmen, the student is not a sophomore.
The sum of all probabilities for mutually exclusive events is always 1.
A.S.22: Determine, based on calculated probability of a set of events, if:
• some or all are equally likely to occur • one is more likely to occur than another • whether or not an event is certain to happen or not to
happen The probability of an event happening is always greater than or equal to zero and less than or equal to one.

INTEGRATED ALGEBRA REGENTS EXAMINATION STUDY GUIDE www.jmap.org
21
( )0 1eventP≤ ≤
If an event cannot happen, the probability is 0. If an event is certain to happen, the probability is 1.
When comparing the probabilities of two or more events, the event with probability closest to 1 is most likely to happen and the event with probability closest to 0 is least likely to happen.
Questions 117-121: A.S.23: Calculate the probability of: a series of independent events; a series of dependent events; two mutually exclusive events; two events that are not mutually exclusive. Probability of Multiple Events with “or” Wording. The probability of mutually exclusive events A or B occurring is equal to the probability of the first event plus the probability of the second event.
( ) ( ) ( )either or event A event Bevent A event BP P P= +
This principle of adding probabilities of mutually exclusive events can be extended to three or more independent events. Probability of Multiple Events with “and” Wording. The probability of independent events A and B both occurring is equal to the probability of the first event times the probability of the second event.
( ) ( ) ( )and event A event Bevent A event BP P P= ×
This principle of multiplying probabilities of independent events can be extended to three or more independent events. Independent or Unrelated Events are events in which the outcome of one event has no influence on the outcome of the other event. For example, if a coin is tossed twice, the outcome of the first toss is unrelated to the outcome of the second toss. Each coin toss is an unrelated event. If a coin is tossed and number cube rolled, the coin toss is independent of the cube roll, etc. Always Remember: “A coin has no memory.” With Replacement and Without Replacement Problems. Many Regents problems involve selecting balls, marbles, or somethings from a bag, box, or whatever. These are probability of multiple events problems, and it is important to know whether the outcome of the first event influences the second event. For example, if the first ball, marble, or whatever is selected and then replaced, or put back, the outcome of the first event would not influence the second event. If the second event occurs without replacement, then the outcome of the first event will most definitely

INTEGRATED ALGEBRA REGENTS EXAMINATION STUDY GUIDE www.jmap.org
22
influence the denominator of the probability equation and possibly the numerator of the equation.
Questions 122-127: Geometric Probability
Geometric probability adapts uses theoretical probability formulas to solve problems involving areas and volumes of geometric figures.
Theoretical Probability
( )event
area (or volume) of favorable outcomesP
area (or volume) of possible outcomes=
Areas of circles or squares and rectangles are typically used in geometric probability problems. EXAMPLE: A problem like the one below appeared in a Regents examination. Keisha is playing a game using a wheel divided into eight equal sectors, as shown in the diagram at right. Each time the spinner lands on orange, she will win a prize. If Keisha spins this wheel twice, what is the probability she will win a prize on both spins? The geometric probability of landing on orange:
( )1 favorable outcome 1
P8 possible outcomes 8orange = =
The probability of landing on orange two times:
( ) ( )1 1 1
P8 8 64orange orange+
= =
Question 128: A.S.18: Know the definition of conditional probability and use it to solve for probabilities in finite sample spaces.
Conditional probability is computed based on the assumption that some event(s) has already occurred.
Questions 129-130: A.N.7: Determine the number of possible events, using counting techniques or the Fundamental Principle of Counting.

INTEGRATED ALGEBRA REGENTS EXAMINATION STUDY GUIDE www.jmap.org
23
The multiplication counting principle states that, • if event A has a possible outcomes, event B has b possible outcomes, and event C
has c possible outcomes, • then the number of possible outcomes for event A followed by event B followed
by event C is determined by multiplying a b c× × . o This rule applies for two or more events.
A counting box is a visual representation of the number of possible outcomes for a particular event. Counting boxes are useful for determining the number of possible outcomes of a series of events. Counting boxes can also be used for solving permutation and combination problems. The Relationship Between Tree Diagrams and Counting Boxes The number in a counting box is related to the number of branches in a tree diagram, which is determined by the number of possible outcomes (choices) for a given event. The following tree diagram represents the possible outcomes of a coin toss followed by a throw of a number cube.
HeadsHeads
11
22
33
44
55
66
TailsTails
11
22
33
44
55
66
22 66
Possible outcomes from coin
toss.
Possible outcomes
from # cube toss.
= 1212
Total possible outcomes from
both events.
Example: The following problem appeared on a Regents examination. A certain car comes in three body styles with a choice of two engines, a choice of two transmissions, and a choice of six colors. What is the minimum number of cars a dealer must stock to have one car of every possible combination?
3 622
BodyStyles Engines Trans-
missions Colors
x xx = 72
Questions 131-137:

INTEGRATED ALGEBRA REGENTS EXAMINATION STUDY GUIDE www.jmap.org
24
A.N.8: Determine the number of possible arrangements (permutations) of a list of items. A permutation of objects is an ordering of them. The order of the objects matters with permutations. (Order does not matter with combinations). The number of permutations that can be created from n objects is n!, which reads as n-factorial. Examples of factorials are shown below:
1! 1
2! 2 1 2
3! 3 2 1 6
4! 4 3 2 1 24
5! 5 4 3 2 1 120
6! 6 5 4 3 2 1 720
== × == × × == × × × == × × × × == × × × × × =
n rP can be translated as permutations of n things taken r at a time. For example, if
we have twenty people running a race, and we want to know how many different ways
we can award first, second, and third place trophies, we would use n rP , where 20n =
and 3r = . We would write the problem as 20 3P , which can be translated as
“permutations of 20 things taken 3 at a time.”
Understanding n rP using Counting Boxes. To count the permutations of n things
taken r at a time: create a series of counting boxes with a total of r boxes, then fill in the boxes using the values of !n .
n n-3n-2n-1x xx =
The total number of counting boxesis equal to r
n rP =The values of n! go inside the boxes.

INTEGRATED ALGEBRA REGENTS EXAMINATION STUDY GUIDE www.jmap.org
25
Example #1: If you have 20 runners in a race, how many ways can first, second, and third place trophies can be awarded?
20 1819x x =
The total number of counting boxesis equal to r
The values of n! go inside the boxes.
20 3P = 6,840
Example #2 Suppose a teacher is making seating assignments for 10 students and there are 5 seats across the front of the room. How many different seating assignments could the teacher make with 10 students and 5 seats?
10 789x xx =
The total number of counting boxesis equal to r
The values of n! go inside the boxes.
10 5P = 6x 30,240
Testing Tip. The words “how many” on a Regents Math A examination almost always mean you are dealing with a permutations or a combinations problem. Other Notations and Formulas for Permutations.
The most common permutations formula/notation is n
! =
( )!rnP
n r− .
An alternate notation system is ( ), P n r

INTEGRATED ALGEBRA REGENTS EXAMINATION STUDY GUIDE www.jmap.org
26
Questions 138-152: A.A.1: Translate a quantitative verbal phrase into an algebraic expression.
The process of translating words into algebraic expressions is an important skill in mathematics. There are four steps in the process:
1. Underline key words and operations. 2. Develop an understanding of the problem. 3. Convert the understanding (and the underlined words and operations) into
mathematical terms and symbols. 4. Write the final expression.
Example: The following problem appeared on a Regents examination. Mr. Turner bought x boxes of pencils. Each box holds 25 pencils. He left 3 boxes of pencils at home and took the rest to school. Which expression represents the total number of pencils he took to school? 1 22x 2 25x − 3 3 25 − 3x 4 25x − 75 Step 1: Underline key terms and operations Mr. Turner bought x boxes of pencils. Each box holds 25 pencils. He left 3 boxes of pencils at home and took the rest to school. Which expression represents the total number of pencils he took to school? Step 2: Develop an understanding of the problem.
# Pencils Purchased# Pencils Left at
Home
minus# pencils Mr. Turner took to school equals:
Step 3: Convert the understanding (and the underlined words and operations) into mathematical terms and symbols.
x boxes times 25 pencils each
25x
x boxes times 25 pencils each
25x
3 boxes times 25 pencils each
3(25)75
3 boxes times 25 pencils each
3(25)75
# Pencils Purchased# Pencils Left at
Home
minus# pencils Mr. Turner took to school equals:
Step 4.: Write the final expression:
# pencils Mr. Turner took to school equals 25 75x −

INTEGRATED ALGEBRA REGENTS EXAMINATION STUDY GUIDE www.jmap.org
27
A.A.2: Write a verbal expression that matches a given mathematical expression. The ability to verbalize mathematical expressions is like reading. It gets stronger with practice. It sometimes helps to read the expression out loud, but this strategy is not recommended during testing situations. Examples:
Mathematical Expression
Operation/Property Verbal Expression(s)
5x multiplication “five times x” 5x +
addition
“x plus five” “five more than x”
“the sum of x and 5” 6y −
subtraction
“y minus six” “six less than y”
“the difference of y and 6”
7
x division “x divided by seven” “one-seventh of x”
( )2 5x − distributive property “two times the quantity of x minus five” “two times the difference of x and five”
( ) 8a b+ + parentheses “8 more than the quantity a plus b”
2 3
7
x +
division
“one-seventh of the quantity two times x plus three”
“the quantity two times x plus three, divided by seven”
A.A.3: Distinguish the difference between an algebraic expression and an algebraic equation. Expression: An expression is a mathematical phrase made up of terms, variables, and/or the product of terms and variables.
Examples:
( )( )2 1 7
2
34
x xx
yx
+ −
+
+ −
. Note: None of these expressions have equal signs in them.
Equation: An equation consists of two expressions with an equal sign between them.
Examples:
( ) ( )2 1 7
2
34
x xx
yx
+ = −
=
+ =
. Note: Each of these expressions has an equal sign.
INTEGRATED ALGEBRA REGENTS EXAMINATION STUDY GUIDE www.jmap.org
28
Questions 153-156: A.A.22: Solve all types of linear equations in one variable.
Big Idea: An equation is two expressions that have an equal (=) sign between them. An expression is a mathematical statement consisting of one or more terms. A term is a number {1,2,3,…}, a variable {x,y,z,a,b,c…}, or the product of a number and a variable {2x, 3y, ½ a, etc.). Terms are separated by + or – signs in an expression, and the + or – signs are part of each term. (Everything inside parenthesis is treated as one term until the parentheses are removed.) A variable is a letter that represents an unknown value(s). When we are asked to solve an equation, it usually means that we must isolate the variable and find its value. A coefficient is a number that comes in front of a variable. A coefficient can be an integer, a decimal, or a fraction. A coefficient multiplies the variable. Every variable has a coefficient. If a variable appears to have no coefficient, it’s coefficient is an “invisible 1”
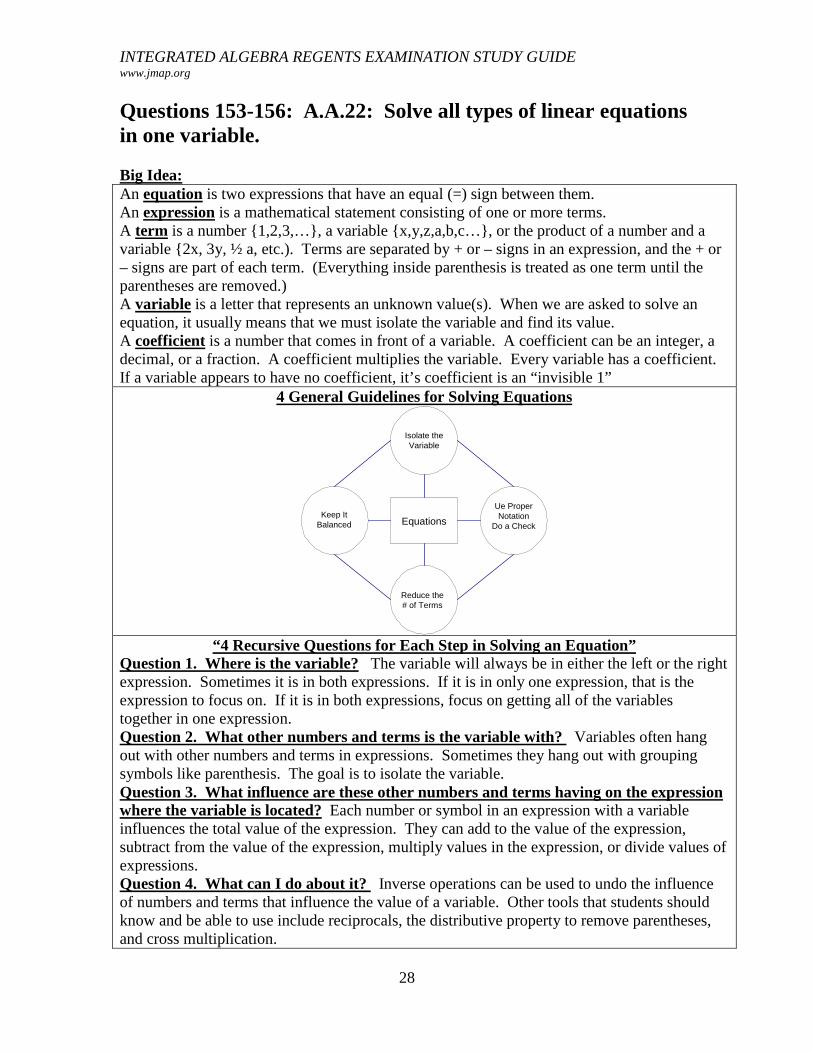
4 General Guidelines for Solving Equations
Isolate theVariable
Reduce the# of Terms
Keep ItBalanced
Ue ProperNotation
Do a CheckEquations
“4 Recursive Questions for Each Step in Solving an Equation”
Question 1. Where is the variable? The variable will always be in either the left or the right expression. Sometimes it is in both expressions. If it is in only one expression, that is the expression to focus on. If it is in both expressions, focus on getting all of the variables together in one expression. Question 2. What other numbers and terms is the variable with? Variables often hang out with other numbers and terms in expressions. Sometimes they hang out with grouping symbols like parenthesis. The goal is to isolate the variable. Question 3. What influence are these other numbers and terms having on the expression where the variable is located? Each number or symbol in an expression with a variable influences the total value of the expression. They can add to the value of the expression, subtract from the value of the expression, multiply values in the expression, or divide values of expressions. Question 4. What can I do about it? Inverse operations can be used to undo the influence of numbers and terms that influence the value of a variable. Other tools that students should know and be able to use include reciprocals, the distributive property to remove parentheses, and cross multiplication.

INTEGRATED ALGEBRA REGENTS EXAMINATION STUDY GUIDE www.jmap.org
29
The 4 Column Method for Organizing and Documenting Equation Solving
Notes Left Hand Expression Equal Sign
Right Hand Expression
The first column is for notes about what you are doing, such as add, subtract, multiply, or divide.
The second column is for simplifying the left hand expression of the equation.
This skinny third column is for the equal sign.
The fourth column is for simplifying the right side of the equation.
Big Idea:
The PEMDAS Pyramid for Remembering the Order of Operations
E
M
A
D
S
(LEFT TO RIGHT)
P
When evaluating expressions, follow the order of operations as shown in the PEMDAS Pyramid. Start at the top of the triangle and:
• Level 1: Perform any operations inside grouping symbols such as parentheses, brackets, and absolute value signs. When a fraction bar is involved, add parentheses around the numerator and around the denominator.
• Level 2: Simplify any terms with exponents. • Level 3: Perform any operations involving multiplication and division. • Level 4: Perform any operations involving addition and subtraction. • In levels 3 and 4, if there are two or more operations on the same level of the
pyramid, start with the operation that is furthest left and proceed to the right. • Remember PEMDAS(LR) with the mnemonic, “Please excuse my dear aunt
Sally’s Labrador Retriever.”

INTEGRATED ALGEBRA REGENTS EXAMINATION STUDY GUIDE www.jmap.org
30
Questions 157-162: A.A.25: Solve equations involving fractional expressions.
Solving rational equations requires skills with fractions. • The most important skill is knowing how to get rid of a fraction in an equation.
o One method that works every time is to multiply both sides of the equation by the denominator of the fraction that you want to eliminate. Example: To get rid of the fraction in the equation below, multiply both sides of the equation by 3, which is the denominator of the fraction.
( )
( ) ( )
24 8
32
3 4 3 83
23 3 4 3 8
3
2 12 24
2 12
6
x
x
x
xxx
+ =
+ =
+ =
+ ===
• Other techniques for dealing with fractions are shown below: Addition of Fractions (X-bar method)
a cb d+ Start with two fractions that you want to add together.
Note: The direction of the arrow tips indicates the placement of the cross products in the numerator. This algorithm only works with two fractions at a time.
( ) ( )ad bcbd+
Simplification may be necessary.
Subtraction of Fractions (X-bar method) a cb d− Start with two fractions that you want to subtract.
Note: The direction of the arrow tips indicates the placement of the cross products in the numerator. This algorithm only works with two fractions at a time.
( ) ( )ad bcbd−
Simplification may be necessary.

INTEGRATED ALGEBRA REGENTS EXAMINATION STUDY GUIDE www.jmap.org
31
Multiplication of Fractions ( Dog method) a cb d⊗ Start with two fractions that you want to multiply.
Top Times Top
Bottom Times Bottom
Note: Drawing “hot dog buns” around the numerator and the denominator can help you to visualize and remember the process of multiplying numerator times numerator and denominator times denominator. This algorithm can be extended to multiple fractions.
acbd
Simplification may be necessary.
Division of Fractions (KCF method)
a cb d÷
Start with two fractions in horizontal notation that you want to divide.
K C F a db c⊗
Note: Remember the acronym KCF, which stands for keep, change, flip. You keep the first fraction, change the operations sign from division to multiplication, and flip the second fraction.
Top Times Top
Bottom Times Bottom
After KCF, use the Hot Dog method to finish solving the problem.
adbc
Simplification may be necessary.
Division of Fractions (Outer over Inner Method)
abcd
Start with two fractions in vertical notation that you want to divide.
abcd
Outers Inners
Multiply the Outers (top times bottom) Multiply the Inners (middle times middle)
adbc
Record the answer as Outer over Inner Simplification may be necessary.

INTEGRATED ALGEBRA REGENTS EXAMINATION STUDY GUIDE www.jmap.org
32
Questions 163-176: A.A.4: Translate verbal sentences into mathematical equations or inequalities. The ability to convert words into mathematical expressions and equations is like learning a new language. It takes practice and improves with effort. Vocabulary is important. There are many ways to say the same thing in English. Mathematics is usually more exact.
Key Words Usually Associated with Specific Algebraic Operations and Symbols Addition +
and gain
increase of increased by
more – more than plus raise sum total
Subtraction - decreased by
difference fewer
less – less than loss
minus remainder take away
Multiplication × double
fraction of multiplied by
multiply percent of product of
times triple twice
Division ÷ divide
divided by divide equally
over per
quotient
Equal Sign = equals
is exceeds by
Inequality Signs < ≤ ≠ > ≥ is greater than/equal to
is less than/equal to is not equal to
Parentheses ( ) quantity
Examples:
Verbal Expression(s) Operation/Property Mathematical Expression
“five times x” multiplication 5x “x plus five”
“five more than x” “the sum of x and 5”
addition
5x +
“y minus six” “six less than y”
subtraction
6y −

INTEGRATED ALGEBRA REGENTS EXAMINATION STUDY GUIDE www.jmap.org
33
“the difference of y and 6” “x divided by seven” “one-seventh of x”
division 7
x
“two times the quantity of x minus five” “two times the difference of x and five”
distributive property
( )2 5x −
“8 more than the quantity a plus b” parentheses ( ) 8a b+ +
“one-seventh of the quantity two times x plus three”
“the quantity two times x plus three, divided by seven”
division
2 3
7
x +
Example: The following problem appeared on a Regents examination. If h represents a number, which equation is a correct translation of "Sixty more than 9 times a number is 375"? 1 9h = 375 2 9h + 60 = 375 3 9h − 60 = 375 4 60h + 9 = 375 Solution:
60 9 375
9 375
60 9 375
9 60 375
hSixty more than times a number is
hh
+ × =
+ + =+ =
A.A.5: Write algebraic equations or inequalities that represent a situation. Example: The following problem appeared on a Regents examination. Rhonda has $1.35 in nickels and dimes in her pocket. If she has six more dimes than nickels, which equation can be used to determine x, the number of nickels she has? 1 0.05(x + 6) + 0.10x = 1.35 2 0.05x + 0.10(x + 6) = 1.35 3 0.05 + 0.10(6x) = 1.35 4 0.15(x + 6) = 1.35 Solution: Let n represent the number of nickels Rhonda has. Let d represent the number of dimes Rhonda has.
.05 .1
$1.35 .
6
.05 .10( 6) 1.35 ( )
.05 .10( 6) 1.35
0 1.3
( )
5
Rhonda has in nickels and dimes in her pocket
she has six more dimes than nickelsd n
n n by substitutionx x by substituti n
n d
o
= ++ +
+ =
+ =
=+

INTEGRATED ALGEBRA REGENTS EXAMINATION STUDY GUIDE www.jmap.org
34
A.A.6: Analyze and solve verbal problems whose solution requires solving a linear equation in one variable or linear inequality in one variable. Example: The following problem appeared on a Regents examination. The ages of three brothers are consecutive even integers. Three times the age of the youngest brother exceeds the oldest brother's age by 48 years. What is the age of the youngest brother? 1 14 2 18 3 22 4 26 Solution: Let x represent the age of the youngest brother. Let x+2 represent the age of the next youngest brother. Let x+4 represent the age of the oldest brother.
3 4 48 the the by .
Three times age of the youngest brother exceeds oldest brother's age 48 years
3x>x+4+48
3x>x+52
2x>52
x>26
Check: If the youngest brother is 26 years old, then the oldest brother is
x x× = + +
30 years old.
Three times 26 is 78, which is 48 more than 30.
Transforming Formulas Formulas and literal equations can be transformed using the same rules for solving equations that are used with regular equations. Example: The following problem appeared on a Regents examination. The equation P = 2L + 2W is equivalent to
(1) L= 2
2
P W− (2) L= 2
2
P W+ (3) 2L =2
PW
(4) L = P – W
Strategy: Isolate the L variable using the same procedures for isolating any variable in an equation.
( )
( )
2W
2
Given: P = 2L + 2W
Subtract -2W -2W
P - 2W = 2L
P - 2W 2LDivide =
2 2
P - 2W = L
2

INTEGRATED ALGEBRA REGENTS EXAMINATION STUDY GUIDE www.jmap.org
35
Questions 177-187: A.M.1: Calculate rates using appropriate units (e.g., rate of a space ship versus the rate of a snail). A ratio is a comparison of two numbers by division.
• A rate is a special kind of ratio that compares two different units of measurement by division.
o A unit rate is when the denominator of a rate is expressed as a single unit of measure. The following are examples of common unit rates:
• Automobiles
o miles per gallon, miles
1 gallon
x
o kilometers per hour, kilometers
1 hour
x
• Cooking
o minutes per pound, minutes
1 pound
x
• Typing
o words per minute, x words
1 minute
o Unit rates are useful for comparison purposes. A proportion consists of two ratios with an equal sign between them.
Example:
6060 miles=
1 hour
miles
60 minutes
60 miles 1 mile=
1 hour minute
Speed is a rate. The measurement units of speed are distance
time .
A formula can be written dSt
= .
By transforming this formula, we can get dtS
= and d S t= ×

INTEGRATED ALGEBRA REGENTS EXAMINATION STUDY GUIDE www.jmap.org
36
Big Ideas: There are two general strategies for solving rate problems.
• Use proportions to change the value in the numerator or denominator of a ratio. • Create unit rates to compare one rate with another.
The following problem appeared in a Regents examination. Joseph typed a 1,200-word essay in 25 minutes. At this rate, determine how many words he can type in 45 minutes.
create a ratio from the word problem: rate = 1200 words
25 minutes ,
use a proportion to change the value in the numerator or denominator of a ratio.
( )
1200 words words
25 minutes 45 minutes1200 45 25
1200(45)
252160
1200 words 2160 words
25 minutes 45 minutes
x
x
x
x
=
=
=
=
=
The following problem appeared in a Regents examination. The chart below compares two runners.
Based on the information in this chart, state which runner has the faster rate. Justify your answer. Solution:
Use the speed formula dSt
= to create unit rates for comparison.
Greg:
15 miles11 miles 2
2 hours 1 hour
dSt
= =
Dave: 1
5 miles16 miles 33 hours 1 hour
dSt
= =
Greg runs 1
6 mile per hour faster than Dave.

INTEGRATED ALGEBRA REGENTS EXAMINATION STUDY GUIDE www.jmap.org
37
Questions 188-192: A.M.2: Solve problems involving conversions within measurement systems, given the relationship between the units.
Big Idea: Conversion problems are typically solved using conversion formulas or proportions.
• If a conversion formula is given, simply substitute appropriate values into the formula and solve. Example: The following problem appeared on a Regents examination. On a certain day in Toronto, Canada, the temperature was 15° Celsius (C). Using the
formula 9
325
F C= + , Peter converts this temperature to degrees Fahrenheit (F). What
temperature represents 15°C in degrees Fahrenheit? Solution: Substitute 15° for C in the formula and solve.
( )
( )
932
59
3259
15 325135
325
27 32
59
F C
F
F
F
FF
= +
= +
= +
= +
= +=
• Conversion problems solved by proportions typically require specific knowledge of the measurement systems involved.
• Example: The following problem appeared on a Regents examination. If the speed of sound is 344 meters per second, what is the approximate speed of sound, in meters per hour?
Solution: Convert 1 hour into seconds, then build and solve a proportion.
( )
one hour = 60 minutes 60 seconds per minute
one hour = 3600 seconds
344meters meters=
1 second 3600 seconds344 3600 1
1,238,400
x
xx
×
=
=

INTEGRATED ALGEBRA REGENTS EXAMINATION STUDY GUIDE www.jmap.org
38
Questions 193-196: A.N.5: Solve algebraic problems arising from situations that involve fractions, decimals, percents (decrease/increase and discount), and proportionality/direct variation.
Big Idea:
11% .01
1002
2% .02100
33% .03
100
= =
= =
= =
• • •
Converting Fractions Decimals⇒
A fraction can be converted to a decimal by dividing the numerator by the denominator.
Example: 7
.53846113
=
Converting Decimals Fractions⇒ A terminating decimal can be converted to a fraction by making it a fraction with a denominator of 1 and then moving the decimal point the required number of spaces to the right in both the numerator and denominator.
Example: .123456789 123456789
.1234567891 1,000,000,000
= =
Note: When a repeating decimal is truncated, information is lost forever and it will no longer be possible to convert it back to a fraction.
Converting Decimals Percents⇒ A decimal can be converted to a percent by moving the decimal point two places to the right, which is the same as multiplying by 100.
Examples: .43 43%
.431 43.1%
==
Converting Percents Decimals⇒ A percent can be converted to a decimal by moving the decimal point two places to the left, which is the same as dividing by 100.
Examples: 57% .57
57.8% .578
==

INTEGRATED ALGEBRA REGENTS EXAMINATION STUDY GUIDE www.jmap.org
39
Converting Percents Fractions⇒ A percent can be converted to a fraction by placing it over a denominator of 100 and dropping the percent sign.
Example:
3434%
10047.2 472
47.2%100 1,000
=
= =
Converting Fractions Percents⇒ Option 1. Make a proportion using the
fraction and100
x , where x equals the
percent. Example:
3
4 1003 100 4
300 4
75
375%
4
x
xx
x
=
× ===
=
Option 2. Convert the fraction to a decimal and then convert the decimal to a percent.
Percent of Change Formula
percent of change amount of changeoriginal amount
=
Operations with Percents. Always convert percents to decimals or fractions before multiplying or dividing them. Percent “of” Something Wording. When a Regents problems uses “percent of” wording, it generally means multiplication, as in the following examples: “…what percent of 22…” means x% times 22 “Ninety percent of the ninth grade students…”
means .90 times (number of ninth grade students)
“…25% of the original price…”
means .25 times (original price)

INTEGRATED ALGEBRA REGENTS EXAMINATION STUDY GUIDE www.jmap.org
40
Direct Variation occurs when any of the following three conditions are met: • The graph of the line passes through the origin (0,0), • The table of values for a linear equation contains the ordered pair (0,0), or • 0b = or b is missing in the slope-intercept form of the equation of the line, as in
0y mx= + or y mx= NOTE: If one of the above conditions occurs, they will all occur. Direct variation can be thought of as the set of all lines passing through the origin. The constant of variation is equal to the slope of a line of direct variation. The slope of direct variation has some special characteristics: The slope can be expressed using the coordinates of any point on the line in the
form of yx
. This is easily seen by applying the slope formula 2 1
2 1
y yslope mx x−
= =−
with the origin (0,0) as the first point, as follows: 2 2
2 2
0
0
y yslope mx x−
= = =−
.
Since every ordered pair expressed in the form of yx
is equal to same value (the
slope), every ordered pair expressed in the form of yx
is equal to every other
ordered pair expressed in the form of yx
. Thus, we get
3 5 61 2 4
1 2 3 4 5 6
n
n
y y y yy y yx x x x x x x= = = = = =
This leads to the idea that proportions can be used with direct variation. Test Taking Tip: If you see the words “varies directly,” it can probably be solved using proportions.
INTEGRATED ALGEBRA REGENTS EXAMINATION STUDY GUIDE www.jmap.org
41
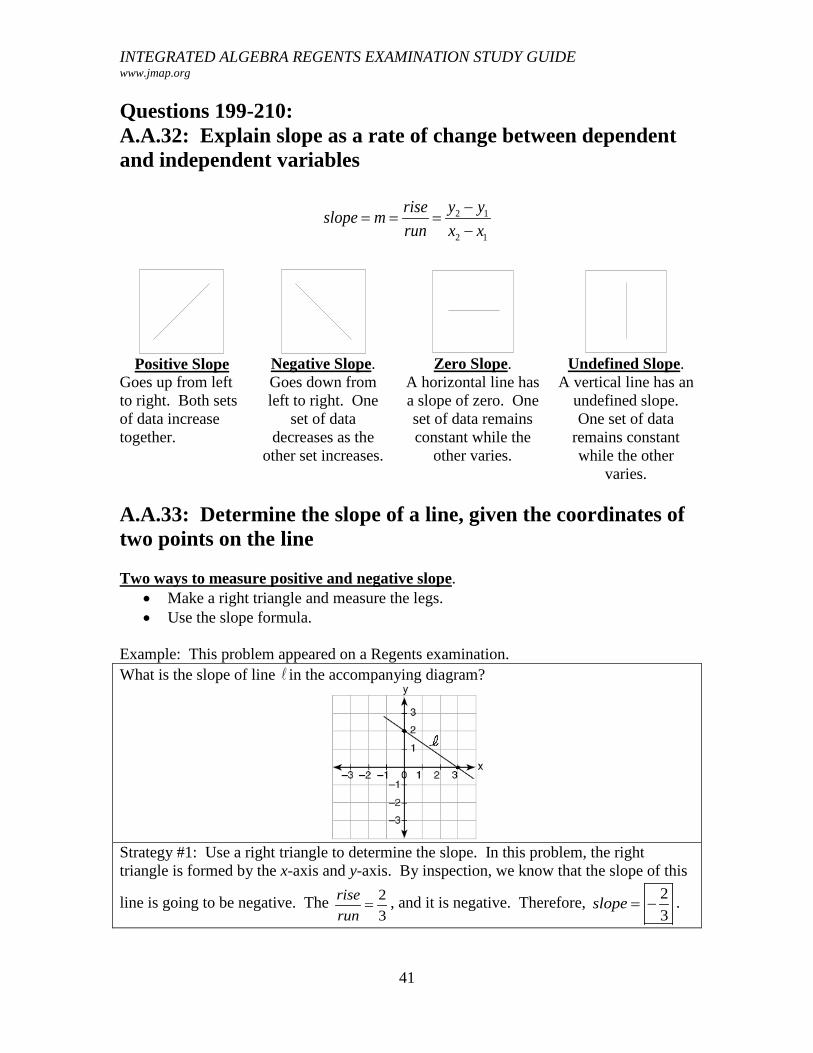
Questions 199-210: A.A.32: Explain slope as a rate of change between dependent and independent variables
2 1
2 1
y yriseslope mrun x x
−= = =
−
Positive Slope
Goes up from left to right. Both sets of data increase together.
Negative Slope. Goes down from left to right. One
set of data decreases as the
other set increases.
Zero Slope.
A horizontal line has a slope of zero. One set of data remains constant while the
other varies.
Undefined Slope.
A vertical line has an undefined slope. One set of data
remains constant while the other
varies.
A.A.33: Determine the slope of a line, given the coordinates of two points on the line
Two ways to measure positive and negative slope. • Make a right triangle and measure the legs. • Use the slope formula.
Example: This problem appeared on a Regents examination. What is the slope of line in the accompanying diagram?
Strategy #1: Use a right triangle to determine the slope. In this problem, the right triangle is formed by the x-axis and y-axis. By inspection, we know that the slope of this
line is going to be negative. The 2
3
riserun
= , and it is negative. Therefore, 2
3slope = − .

INTEGRATED ALGEBRA REGENTS EXAMINATION STUDY GUIDE www.jmap.org
42
Strategy #2: Pick two points and use the slope formula. ( ) ( ) ( ) ( )1 1 2 2
2 1
2 1
0, 2 3,0
0 2 2
3 0 3
x y and x y
y yslopex x
= =
− −= = = −
− −
A.A.37: Determine the slope of a line, given its equation in any form. The easiest way to find slope from an equation is usually to transform the equation to
slope intercept form ( )y mx b= + and look for the number in front of x.
The slope intercept formula for a line is y mx b= + , where y is a dependent variable that can have many values x is an independent variable that can have many values m is the slope and can have only one value, and b is the y-axis intercept and can have only one value.
Note: An equation is in slope intercept form only when the y variable has a coefficient of +1. Slopes of Equations of Lines in the Standard Form: Ax By C+ =
To find the slope of a line in Ax By C+ = form, use either of the following methods: 1. Transform the equation in standard form to slope intercept form y mx b= + by
isolating the y-variable).
2. Use AmB
= − .
Question 211 : See Notes for Questions 257-262 A.G.4: Identify and graph linear, quadratic (parabolic), absolute value, and exponential functions.

INTEGRATED ALGEBRA REGENTS EXAMINATION STUDY GUIDE www.jmap.org
43
Questions 212-220: A.A.34: Write the equation of a line, given its slope and the coordinates of a point on the line A.A.35: Write the equation of a line, given the coordinates of two points on the line Overview of Method: Start by writing y mx b= + vertically in the first column and horizontally in the second and third columns. y= m= x= b=
Y=mx+b
Y=mx+b
NOTE: Regents problems always provide three of the four variables in linear equations. Column 1 is a space for you to write what you know from the word problem. Column 2 is a space for you to solve for the fourth, or unknown, variable. Column 3 reminds you that you are not finished until you have written the final
equation by substituting m and b into the slope-intercept form.
Questions 221-224: A.A.39: Determine whether a given point is on a line, given the equation of the line. Substitute the x and y values of the given point into the equation of the line. If the left expression equals the right expression after the substitution, the point is on the line. If the equation is not balanced, the point is not on the line,
Questions 225-232: A.A.36: Write the equation of a line parallel to the x- or y-axis The equation of the x-axis in slope intercept form is 0 0y x= + , or simply, 0y = .
• The equations of all lines parallel to the x-axis are of the form 0y x b= + , where b is the y-intercept.
The equation of the y-axis is 0x = . • The equations of all lines parallel to the y-axis are of the form x n= , where n is
the x-intercept.
A.A.38: Determine if two lines are parallel, given their equations in any form
INTEGRATED ALGEBRA REGENTS EXAMINATION STUDY GUIDE www.jmap.org
44
Two lines are parallel if and only if they have the same slope and different y-intercepts. All vertical lines are parallel to each other. All horizontal lines are parallel to each other.
Example: y x y x= + = +2
34
2
35 is parallel to
To determine if two lines are parallel, find the slope of both equations. It the slopes are identical, the lines are parallel.
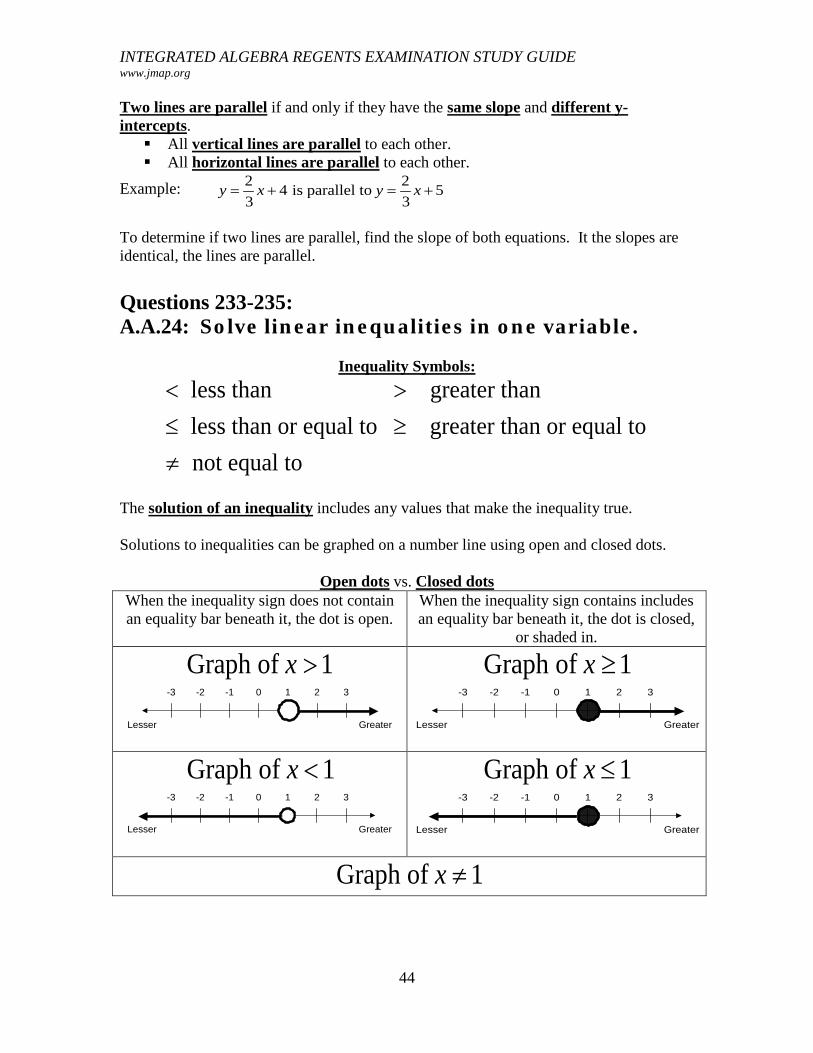
Questions 233-235: A.A.24: Solve linear inequalities in one variable.
Inequality Symbols: < >≤ ≥≠
less than greater than
less than or equal to greater than or equal to
not equal to
The solution of an inequality includes any values that make the inequality true. Solutions to inequalities can be graphed on a number line using open and closed dots.
Open dots vs. Closed dots When the inequality sign does not contain an equality bar beneath it, the dot is open.
When the inequality sign contains includes an equality bar beneath it, the dot is closed,
or shaded in.
Graph of 1x >
Lesser Greater
0 1 2 3-1-2-3
Graph of 1x ≥
Lesser Greater
0 1 2 3-1-2-3
Graph of 1x <
Lesser Greater
0 1 2 3-1-2-3
Graph of 1x ≤
Lesser Greater
0 1 2 3-1-2-3
Graph of 1x ≠

INTEGRATED ALGEBRA REGENTS EXAMINATION STUDY GUIDE www.jmap.org
45
Lesser Greater
0 1 2 3-1-2-3
The Big Rule for Solving Inequalities: All the rules for solving equations apply to inequalties – plus one:
• When an inequality is multiplied or divided by any negative number, the direction of the inequality sign changes.
Questions 236-240: A.A.21: Determine whether a given value is a solution to a given linear equation in one variable or linear inequality in one variable. There are two general approaches to determining if a given value is within the solution set of an equation or inequality.
• Substitute the value in the equation or inequality. o If the equation remains balanced, or the inequality remains true, the point
is within the solution set. o If the equation is not balanced, or the inequality not true, the point is not
within the solution set. • Graph the inequality on a number line.
o Visually inspect the graph to determine if a value is within the solution set.
Example: If an inequality is created to represent the number of students absent from class of 34 students on any given day, it might be written and graphed as follows:
0 34≤ ≤# of absent students
Lesser Greater
340
Any whole number between 0 and 34, inclusive, would be within the solution set.
Questions 241-251: See Notes for Questions 163-176 Questions 252-256: A.G.6: Graph linear inequalities. A linear inequality describes a region of the coordinate plane that has a boundary line.
• Every point within the region is a solution of the inequality.

INTEGRATED ALGEBRA REGENTS EXAMINATION STUDY GUIDE www.jmap.org

INTEGRATED ALGEBRA REGENTS EXAMINATION STUDY GUIDE www.jmap.org
47
( )
2 3
0 2(0) 3
0 3 is true, so the solution of the inequality is the region that contains the point 0,0 .
Therefore, we shade the side of the boundary line that contains the point (0,0).
y x< +< +
<
Note: The TI-83+ graphing calculator does not have the ability to distinguish between solid and dashed lines on a graph of an inequality. The less than and greater than symbols are input using the far-left column of symbols that can be accessed through the
Y= feature. Graphing a System of Linear Inequalities. Systems of linear inequalities are graphed in the same manner as systems of equations are graphed. The solution of the system of inequalities is the region of the coordinate plane that is shaded by both inequalities.

INTEGRATED ALGEBRA REGENTS EXAMINATION STUDY GUIDE www.jmap.org
48
Questions 257-262: A.G.4: Identify and graph linear, quadratic (parabolic), absolute value, and exponential functions. Four Views of a Function
Equation Graph
Verbal Description
Table of Values
FOUR VIEWS OF
A FUNCTION
General Guidelines for Inputting Functions in the TI83/84 Graphing Calculator. A TI83/84 graphing calculator is recommended for problems involving the identification and graphing of linear, quadratic, absolute value, and exponential functions. STEP 1.
Manually transform the function so that the dependent variable (y) is isolated in the left expression. • The left expression must be either y or 0 before it can be input in the
calculator. STEP 2.
Access the equation view of the function via the y-editor Y= .
• Input only the right expression of the function(s). • For inequalities, change the icon at the far left of the input line.
• For absolute value functions, first locate (abs in the CATALOG , then input the right expression.
STEP 3.
Access the table of values view of the input equation using the TABLE button.
• Use the TBLSET button to manipulate the characteristics of the table of values.
STEP 4.
Access the graph view of the input equation using the GRAPH button.
• Use the WINDOW button to manipulate the characteristics of the graph.

INTEGRATED ALGEBRA REGENTS EXAMINATION STUDY GUIDE www.jmap.org
49
NOTE: When using the graphing calculator on open response Regents problems, it is often useful to copy the equation, table of values, and graph views onto your answer sheet.
Graphing Calculator Views of Linear, Quadratic, Absolute Value, and Exponential Functions
Linear Functions STEPS 1&2: Transform the Equation for Input (if necessary) and Access the Equation View
: 2 3
2 3
Given y xy x
− == +
STEP 3: Access the Table of Values
STEP 4: Access the Graph
Quadratic Functions STEPS 1&2: Transform the Equation for Input (if necessary) and Access the Equation View Given instructions to graph
( 2)( 3)x x− +
Input in Y =
STEP 3: Access the Table of Values
STEP 4: Access the Graph
Absolute Value Functions STEPS 1&2: Transform the Equation for Input (if necessary) and Access the Equation View
1 3 6
1 9 0
0 1 9
x
x
or x
+ − >
+ − >
< + −
STEP 3: Access the Table of Values
STEP 4: Access the Graph

INTEGRATED ALGEBRA REGENTS EXAMINATION STUDY GUIDE www.jmap.org
50
Exponential Functions
STEPS 1&2: Transform the Equation for Input (if necessary) and Access the Equation View
STEP 3: Access the Table of Values
STEP 4: Access the Graph
Given: 2xy =
A.G.5: Investigate and generalize how changing the coefficients of a function affects its graph. An easy way to investigate and generalize how changing the coefficients of a function affects its graph is to use a TI83/84 graphing calculator.
• First, input the original function as 1Y in the y-editor. • Second, input the same function with new coefficients as
2Y in the y-editor. o Be careful that you do not confuse the two functions
that appear at the same time in the graph. The icons on the far left of the 1Y and 2Y inputs
can be toggled to make the lines for the different functions appear thicker or thinner.
Questions 263-265: A.A.20: Factor algebraic expressions completely, including trinomials with a lead coefficient of one (after factoring a GCF).

INTEGRATED ALGEBRA REGENTS EXAMINATION STUDY GUIDE www.jmap.org
51
There are two general approaches to solving factoring problems. • The first approach is to use a factoring algorithm, like the one on the next page. • The second approach, which works only with multiple choice problems, is to
work backwards from the answer choices to find which choice yields the original problem.
EXEMPLAR 1. Start with a factorable trinomial:
28 22 15+ +x x
( )( )2 2
2
2
4 22 4 8 15
4 4
4 2
− = −
− =
− =
b ac
b ac
b ac
7. Replace the middle term of the trinomial with two new terms.
28 8 15 15+ + +x x x
8. Group the new polynomial into two binomials using parentheses..
( ) ( )28 8 15 15+ + +x x x
2. Identify the values of a, b, and c a=8 b=22 c=15
9. Factor each binomial. (Note that the factors in parenthesis will always be identical.)
( ) ( )( ) ( )
28 8 15 15
8 1 15 1
+ + +
+ + +
x x x
x x x
3. Multiply a times c.
ac=120 120=ac
4. Find the factors of ac 10.Extract the common factor and add the remaining terms as a second factor.
( )( )( )
1
1 8 15
+
+ +
x
x x
1 120
2 60
3 40
4 30
5 24
6 20
8 15
10 12
12 10
5. Box the set of factors in step 4 whose
sum or difference equals b
6. Assign a positive or negative value to each factor. Write the signed factors below.
+ 8 + 15 = 22 b
11. Check. Use the distributive property of multiplication to make sure that your binomials in Step 10 return you to the trinomial that you started with in Step 1. If so, put a check mark here.

INTEGRATED ALGEBRA REGENTS EXAMINATION STUDY GUIDE www.jmap.org
52
( )( )2
2
1 8 15
8 15 8 15
8 22 15
+ +
+ + +
+ +
x x
x x xx x
Questions 266-276: A.A.19: Identify and factor the difference of two perfect squares. Special Case: Factoring the Difference of Perfect Squares.
General Rule
( ) ( )( )2 2a b a b a b− = + −
Examples
( )( )( )( )

INTEGRATED ALGEBRA REGENTS EXAMINATION STUDY GUIDE www.jmap.org
53
Step 2. Set the value of the dependent variable to zero.
( ) ( )( )0 3 2 4f x x= + −
Step 3. Set each factor equal to zero and solve for the independent variable.
( )3 0
3
xx
+ =
= −
( )2 4 0
2 4
2
xx
x
− =
==

INTEGRATED ALGEBRA REGENTS EXAMINATION STUDY GUIDE www.jmap.org
54
Questions 278-284: A.A.28: Understand the difference and connection between roots of a quadratic equation and factors of a quadratic expression. The general form of a quadratic equation is
2y ax bx c= + + Using function notation, the general form of a quadratic can also be expressed as
2( )f x ax bx c= + + The graph of a quadratic equation is called a parabola.
axis of symmetry
vertex (turning point)
rootroot
• The coordinates of the point where the parabola crosses the x-axis on a coordinate plane are known as the x-intercepts..
o The x-intercept occurs when
( )0 or 0y f x= =
• A quadratic equation can have one, two, or zero x-intercepts.
• The equation of the axis of symmetry is
2
bxa−
=
• The vertex is found by finding f(x) at the axis of symmetry1
• The value of the independent variable (x) at the x-intercept of a quadratic equation is also known as the root and/or the solution of the equation.
o Roots and solutions have same meanings when working with quadratics.
o Roots and factors have different meanings when working with quadratics.
o Assume that a root of the above parabola is 1
2x = − .
o The corresponding factor for this root is the left expression of the
following equation 1
02
x + =
1 The vertex of the parabola may also be found by finding the value of the independent variable when the first derivative of the function equals zero. Then, use this value to find the f(x) coordinate. Express the
vertex as an ordered pair ,2 2
b bfa a
− −
.
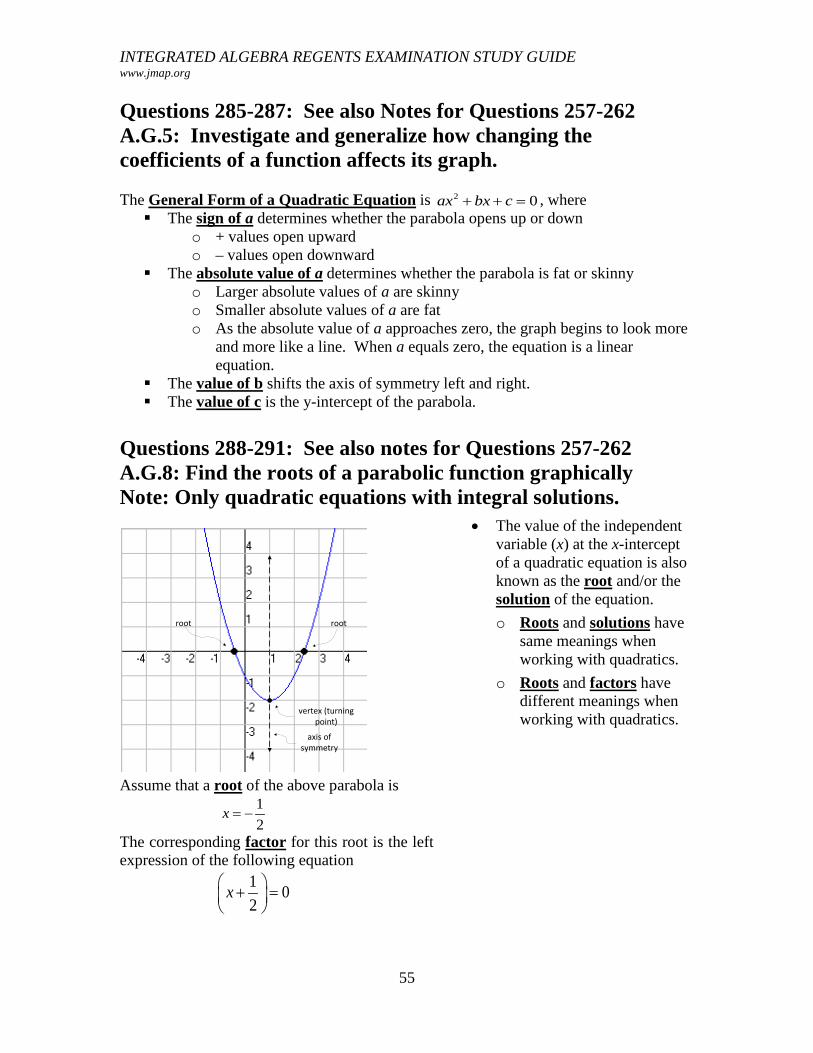
INTEGRATED ALGEBRA REGENTS EXAMINATION STUDY GUIDE www.jmap.org
55
Questions 285-287: See also Notes for Questions 257-262 A.G.5: Investigate and generalize how changing the coefficients of a function affects its graph. The General Form of a Quadratic Equation is 2 0ax bx c+ + = , where The sign of a determines whether the parabola opens up or down
o + values open upward o – values open downward
The absolute value of a determines whether the parabola is fat or skinny o Larger absolute values of a are skinny o Smaller absolute values of a are fat o As the absolute value of a approaches zero, the graph begins to look more
and more like a line. When a equals zero, the equation is a linear equation.
The value of b shifts the axis of symmetry left and right. The value of c is the y-intercept of the parabola.
Questions 288-291: See also notes for Questions 257-262 A.G.8: Find the roots of a parabolic function graphically Note: Only quadratic equations with integral solutions.
axis of symmetry
vertex (turning point)
rootroot
• The value of the independent variable (x) at the x-intercept of a quadratic equation is also known as the root and/or the solution of the equation.
o Roots and solutions have same meanings when working with quadratics.
o Roots and factors have different meanings when working with quadratics.
Assume that a root of the above parabola is
1
2x = −
The corresponding factor for this root is the left expression of the following equation
10
2x + =

INTEGRATED ALGEBRA REGENTS EXAMINATION STUDY GUIDE www.jmap.org
56
A factor is: 1) a whole number that is a divisor of another number’ or 2) an
algebraic expression that is a divisor of another algebraic expression. Examples:
o 3 is a factor of 12 (so are 1, 2, 4, 6, and 12). o The factors of 2 6x x− − are ( ) ( )3 and 2x x− + .
A root of an equation is a solution of the equation in the form f(x) = 0. Examples:
o A root of the equation y = 2x – 6 is 3 because when 3 is substituted in for x, the value of y = 0.
o The roots of 2 2 24 0x x+ − = are 6x = − and 4x = . The equation is true if we substitute either 6x = − and 4x = into the equation.
The roots of a quadratic equation can also be understood as the x-axis intercepts of the graph of the equation. This is because the coordinates of the x-axis intercepts, by definition, have y-values equal to zero. The roots of
2 2 24 0x x+ − = are 6x = − and 4x = .
These are the x coordinate values of the x-axis intercepts.
Testing Tip: You can estimate the roots of a quadratic equation by looking at the graph of the equation, and then work backwards to find the factors.
Starting with Factors and Finding Roots Recall that the standard form of a quadratic equation is 2 0ax bx c+ + = and only the left side of the equation is factored. Thus, the left side of the equation equals zero. For all numbers 0 0
and if 0 0 (NOTE: substitute any two factors)
Therefore 0
aa b ba
⋅ =⋅ = ≠=
One the left side of the equation is factored, each factor can individually be equated with zero. For example
( )( )
2 2 - 24 0
6 - 4 0
6 0 - 4 0
-6 4
x xx x
Thereforex and x
x and x
+ =
+ =
+ = == =
Note that the factors are in parentheses and the numerical terms have opposite signs when they become roots. Starting with Roots and Finding Factors If you know the roots of an equation, you can work backwards to find the factors and/or

INTEGRATED ALGEBRA REGENTS EXAMINATION STUDY GUIDE www.jmap.org
57
the equation. For example, if you inspect the graph of a quadratic equation and find that it has x-intercepts at 3 and 6, you can write:
( )( )2
2
3 6
-3 0 - 6 0
-3 - 6 0
- 6 -3 18 0
-9 18 0
x and xx xx x
x x xx x
= == =
=
+ =
+ =
Questions 292-297: A.A.8: Analyze and solve verbal problems that involve quadratic equations. Example: The following problem appeared on a Regents examination. When 36 is subtracted from the square of a number, the result is five times the number. What is the positive solution?
236 5 , .36
x xWhen from the theis subtracted square of a number the result is five times number
− = ×
2
2
36 5
5 36 0
x xx x− =
− − =
The table of values and the graph both show that the parabola has a positive root (solution) when 9x = .

INTEGRATED ALGEBRA REGENTS EXAMINATION STUDY GUIDE www.jmap.org
58
Questions 298-304: A.G.10: Determine the vertex and axis of symmetry of a parabola, given its graph Note: The vertex will have an ordered pair of integers and the axis of symmetry will have an integral value.
axis of symmetry
vertex (turning point)
rootroot
• The vertex (turning point) of a parabola is the highest or lowest point on the parabola and is expressed as an ordered pair of coordinates. In this example, the vertex is at (1,-2).
• The axis of symmetry is the vertical line that passes through the vertex. It’s equation in this example is x = 1.
Questions 305-309: A.A.41: Determine the vertex and axis of symmetry of a parabola, given its equation. The General Form of a Quadratic Equation is 2 0ax bx c+ + = , where
The formula for the axis-of-symmetry is 2
bxa−
= .
The turning point, or vertex, of a parabola, is the minimum or maximum point. It is found algebraically by a two step process: STEP 1: Determine the axis of symmetry STEP 2: Find the value of y for the axis of symmetry.
The turning point is always expressed as an ordered pair, ie. (x,y).

INTEGRATED ALGEBRA REGENTS EXAMINATION STUDY GUIDE www.jmap.org
59
Questions 310-318: A.A.10: Solve systems of two linear equations in two variables algebraically.
• There are four algebraic approaches to solving system of equations problems algebraically. Note: Pick one approach and practice it.
Isolate the Same Variable in Both Equations to Solve a System Example: Solve the system of equations 3 4 12.50
3 2 8.50
C MC M+ =+ =
STEP #1. Isolate the same variable in both equations.
.#1
3 4 12.50
3 12.50 4
12.50 4
3.#2
3 2 8.50
3 8.50 2
8.50 2
3
EqC M
C MMC
EqC M
C MMC
+ == −
−=
+ == −
−=
STEP #2. Write a new equation using equivalent expressions. In this example, the two equivalent expressions are both equal to C.
.#3
12.50 4 8.50 2
3 3
EqM M− −
=
STEP #3. Solve the new equation for the first variable, which in this case is M.
( ) ( )
.#3
12.50 4 8.50 2
3 33 12.50 4 3 8.50 2
12.50 4 8.50 2
12.50 8.50 2 4
4.00 2
2.00
EqM M
M MM M
M MM
M
− −=
− = −
− = −− = − +
=
=
STEP #4. Substitute the value of the variable you found in the first equation and solve for the second variable.
.#1
3 4
Eq
C M+ ( )2.00 12.50
3 8 12.50
3 4.50
4.501.50
3
CC
C
=
+ ==
= =
STEP #5.
Substitute both variables into the original equations to see if each equation remains true.
1
3
Equation
C( )1.5 4 M+ ( )
( )
2 12.50
4.5 8 12.5
12.5 12.5 .#1Eq balances
=
+ =
=
2
3
Equation
C( )1.5 2 M+ ( )
( )
2 8.50
4.5 4 8.50
8.50 8.50 .#2Eq balances
=
+ =
=

INTEGRATED ALGEBRA REGENTS EXAMINATION STUDY GUIDE www.jmap.org
60
• The solution to a system of linear equations is the set of values that makes each equation in the system true (balanced).
Isolate One Variable in One Equation and Substitute to Solve a System
Example: Solve the system of equations 3 4 12.50
3 2 8.50
C MC M+ =+ =
STEP #1. Isolate one variable in one equation. Normally, you should pick the equation and the variable that seems easiest to isolate.
.#1
3 4 12.50
3 12.50 4
12.50 4
3
EqC M
C MMC
+ == −
−=
STEP #2. Substitute the equivalent expression for the variable in the other equation.
.#2
3
Eq
C 12.50 42 8.50
3
M M− + =
Note that , after the substitution, equation #2 has only one variable.
STEP #3. Solve the other equation with one variable, which in this case is M.
.#2
3
Eq
12.50 4
3
M−2 8.50
12.50 41 2 8.50
1
12.50 4 2 8.50
12.50 8.50 4 2
4.00 2
4.002.00
2
M
M M
M MM MM
M
+ =
− + =
− + =
− = −=
= =
STEP #4. Substitute the value of the variable you found in the first equation and solve for the second variable.
.#1
3 4
Eq
C M+ ( )2.00 12.50
3 8 12.50
3 4.50
4.501.50
3
CC
C
=
+ ==
= =
STEP #5. Substitute both variables into the original equations to see if each equation remains true.
1
3
Equation
C( )1.5 4 M+ ( )
( )
2 12.50
4.5 8 12.5
12.5 12.5 .#1Eq balances
=
+ =
=
2
3
Equation
C( )1.5 2 M+ ( )
( )
2 8.50
4.5 4 8.50
8.50 8.50 .#2Eq balances
=
+ =
=
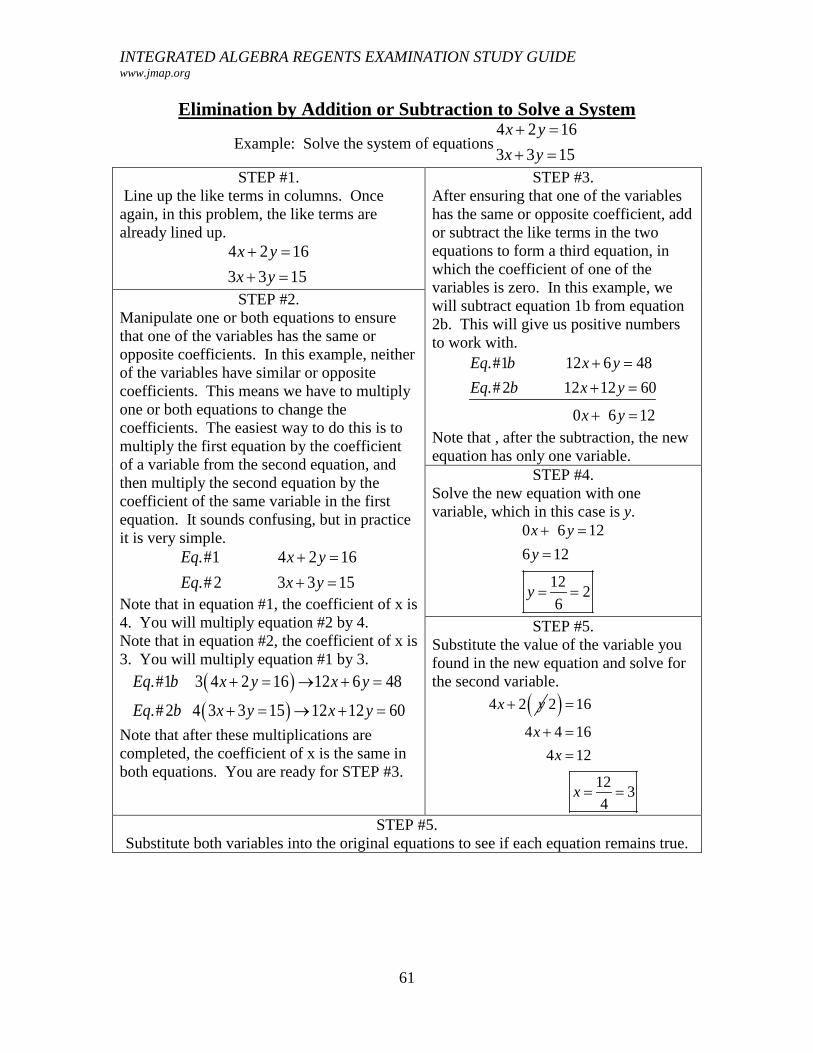
INTEGRATED ALGEBRA REGENTS EXAMINATION STUDY GUIDE www.jmap.org
61
Elimination by Addition or Subtraction to Solve a System
Example: Solve the system of equations4 2 16
3 3 15
x yx y+ =+ =
STEP #1. Line up the like terms in columns. Once again, in this problem, the like terms are already lined up.
4 2 16
3 3 15
x yx y+ =+ =
STEP #3. After ensuring that one of the variables has the same or opposite coefficient, add or subtract the like terms in the two equations to form a third equation, in which the coefficient of one of the variables is zero. In this example, we will subtract equation 1b from equation 2b. This will give us positive numbers to work with.
.#1 12 6 48
.#2 12 12 60
0 6 12
Eq b x yEq b x y
x y
+ =+ =
+ =
Note that , after the subtraction, the new equation has only one variable.
STEP #2. Manipulate one or both equations to ensure that one of the variables has the same or opposite coefficients. In this example, neither of the variables have similar or opposite coefficients. This means we have to multiply one or both equations to change the coefficients. The easiest way to do this is to multiply the first equation by the coefficient of a variable from the second equation, and then multiply the second equation by the coefficient of the same variable in the first equation. It sounds confusing, but in practice it is very simple.
.#1 4 2 16
.#2 3 3 15
Eq x yEq x y
+ =+ =
Note that in equation #1, the coefficient of x is 4. You will multiply equation #2 by 4. Note that in equation #2, the coefficient of x is 3. You will multiply equation #1 by 3.
( )( )
.#1 3 4 2 16 12 6 48
.#2 4 3 3 15 12 12 60
Eq b x y x y
Eq b x y x y
+ = → + =
+ = → + =
Note that after these multiplications are completed, the coefficient of x is the same in both equations. You are ready for STEP #3.
STEP #4. Solve the new equation with one variable, which in this case is y.
0 6 12
6 12
122
6
x yy
y
+ ==
= =
STEP #5. Substitute the value of the variable you found in the new equation and solve for the second variable.
4 2x y+ ( )2 16
4 4 16
4 12
123
4
xx
x
=
+ ==
= =
STEP #5. Substitute both variables into the original equations to see if each equation remains true.

INTEGRATED ALGEBRA REGENTS EXAMINATION STUDY GUIDE www.jmap.org
62
1
4
Equation
x( )3 2 y+ ( )2 16
12 4 16
16 16 .1Eq balances
=
+ ==
2
3
Equation
x( )3 3 y+ ( )2 15
9 6 15
15 15 . 2Eq balances
=
+ ==
Using Matrices in a TI 83/84 Graphing Calculator to Solve a System Example: Solve the system of equations 3 4 12.50
3 2 8.50
C MC M+ =+ =
STEP 1. Set up two matrices on paper.
3 4 12.50
3 2 8.50
C MC M+ =+ =
Then, extract the coefficients and the numbers from the system of equation to build
matrices [ ]A and [ ]B , as shown below:
[ ] [ ]
3 4 12.50
3 2 8.50
A B
Note that matrix [ ]A comes from the coefficients of the left expression and matrix [ ]B
comes from the numbers in the right expression. There is no equal sign. STEP 2.
Enter matrix [ ]A into your calculator.
Input
Press STEP 3. Define the size of Matrix [A]. In
this example, matrix [ ]A is two rows tall
and two columns wide. Input
. Next input the values for each cell in the matrix, being careful to include negative signs for cells with negative values and being careful to put each value in its
Write the system of equations as if you were going to solve it using the elimination method.
2nd MATRIX Edit 1[A]
ENTER
2 ENTER 2 ENTER

INTEGRATED ALGEBRA REGENTS EXAMINATION STUDY GUIDE www.jmap.org
63
proper position in the matrix.

INTEGRATED ALGEBRA REGENTS EXAMINATION STUDY GUIDE www.jmap.org
64
STEP 4. Enter matrix [ ]B into your
calculator. Input
STEP 4. Define the size of Matrix [ ]B . In
this example, matrix [ ]B is two rows tall
and one column wide. Input
Next, enter the values for each cell in the matrix, again being careful to include negative signs for negative values and ensuring that all values are in their proper cells within the matrix. Input
to return to the main screen.
STEP 5. Multiply the inverse of matrix
[ ]A by matrix [ ]B
Input
Note: You always multiply the reciprocal of Matrix [A] times Matrix [B].
STEP 6. Interpret the data output matrix. The top number is the solution to variable of the first column of Matrix [A].
1.5C = The bottom number is the solution to the variable of the second column of Matrix [A].
2M = NOTE: More complex systems of equations involving 3 or more variables can be solved
by increasing the size of Matrix [ ]A , which must always be a square matrix and by
2nd MATRIX Edit 2[B]
2 ENTER 1 ENTER
QUIT CLEAR
-12nd MATRIX [A] ENTER X
× 2nd MATRIX [B] ENTER
ENTER

INTEGRATED ALGEBRA REGENTS EXAMINATION STUDY GUIDE www.jmap.org
65
increasing the number of rows in Matrix [ ]B . The number of rows must always be
identical in both matrices. IMPORTANT: Exemplar of how to show work with matrices on a Regents examination.
[ ] [ ] [ ]1
3 4 12.50
3 2 8.50
3 4 12.50 1.5
3 2 8.50 2
A B C
1.5 2
C MC M
C M
−
+ =+ =
=
= =
.#1
3
CheckEq
C( )1.5 4 M+ ( )
( )
2 12.50
4.5 8 12.5
12.5 12.5 .#1
.#2
3
Eq balancesEq
C
=
+ =
=
( )1.5 2 M+ ( )
( )
2 8.50
4.5 4 8.50
8.50 8.50 .#2Eq balances
=
+ =
=

INTEGRATED ALGEBRA REGENTS EXAMINATION STUDY GUIDE www.jmap.org
66
A.G.7: Graph and solve systems of linear equations and inequalities with rational coefficients in two variables.
Using Graphs in a TI 83/84 Graphing Calculator to Solve a System Example: Solve the system of equations 3 4 12.50
3 2 8.50
C MC M+ =+ =
STEP #1. Manually transform both equations into slope-intercept form ( y mx b= + ) and input both into the y-editor of the calculator.
1
3 4 12.50
3 12.50 4
12.50 4
34 12.50
3 32
3 2 8.50
3 8.50 2
8.50 2
32 8.50
3 3
EquationC MC M
MC
C M
EquationC MC M
MC
C M
+ == −
−=
−= +
+ == −
−=
−= +
STEP #3.
Use the calculate intersect function of the graphing calculator to find the exact intersection of the two lines.
STEP #4 Check your answers.
.#1
3
CheckEq
C( )1.5 4 M+ ( )
( )
2 12.50
4.5 8 12.5
12.5 12.5 .#1
.#2
3
Eq balancesEq
C
=
+ =
=
( )1.5 2 M+ ( )
( )
2 8.50
4.5 4 8.50
8.50 8.50 .#2Eq balances
=
+ =
=
STEP #2. View the graph to visually estimate the intersection where the graphs of the equations meet. This is the solution to the system of equations.
STEP #5. If you are answering an open response question on a Regents examination, copy the input screen, a table of values, the graph, and your solution check into your examination booklet.

INTEGRATED ALGEBRA REGENTS EXAMINATION STUDY GUIDE www.jmap.org
67
Questions 319-328: A.A.7: Analyze and solve verbal problems whose solution requires solving systems of linear equations in two variables. Systems of equations are often hidden in ordinary words.
• You must first define the variables involved in the problem. • Then, find the two, and sometimes three equations that are hidden in the words.
o See also notes for Questions 163-176: • After you have translated the words into mathematic equations, you must solve
the system of equations using any method that is presented in this workbook. • Finally, you should check your work.
Example: The following problem appeared in a Regents examination. Equations Check
Jack bought 3 slices of cheese pizza and 4 slices of mushroom pizza for a total cost of $12.50. Grace bought 3 slices of cheese pizza and 2 slices of mushroom pizza for a total cost of $8.50. What is the cost of one slice of mushroom pizza?
Equation #1. 3 4 12.50C M+ = Equation #2. 3 2 8.50C M+ =
3 C( )1.50 4 M+ ( )2.00 12.50
4.50 8.00 12.50
12.50 12.50
3 C
=
+ ==
( )1.50 2 M+ ( )2.00 8.50
4.50 4.00 8.50
8.50 8.50
=
+ ==
Variables: Let C represent the cost of one slice of cheeses pizza. Let M represent the cost of one slice of mushroom pizza. Solution:
Elimination Method
3 4 12.50
3 2 8.50
2 4.00
2.00
C MC M
MM
+ =+ =
==
The cost of one slice of mushroom pizza is $2.00.

INTEGRATED ALGEBRA REGENTS EXAMINATION STUDY GUIDE www.jmap.org
68
Questions 329-336: A.A.40: Determine whether a given point is in the solution set of a system of linear inequalities. There are two general approaches for determining whether a given point is in the solution set of a system of linear inequalities/
• One approach is to plug coordinate values of the given point into the system and see if all of the inequalities remain true.
• Another approach is to graph the system of inequalities and determine if the given point falls within the shaded regions of both inequalities.
o See the notes in the next section for additional information on graphing inequalities.

INTEGRATED ALGEBRA REGENTS EXAMINATION STUDY GUIDE www.jmap.org
69
A.G.7: Graph and solve systems of linear equations and inequalities with rational coefficients in two variables. Graphing a System of Linear Inequalities.
• Systems of linear inequalities are graphed in the same manner as systems of equations are graphed.
• The solution of the system of inequalities is the region of the coordinate plane that is shaded by both inequalities.
Example: Determine by graphing if the point (-4,-3)
is in the solution set of the system of inequalities: 4 6
3 6 6
y xx y≥
− + ≤ −
STEP #1. Manually transform both inequalities into slope-intercept form ( y mx b= + ) and input both into the y-editor of the calculator.
STEP #3. Verify that a point does or does not fall in the double shaded section of the graph by checking the point in each of the original inequalities. For example, the point
( )4, 3− − appears to lie within the double
shaded region of the graph. This needs to be verified:
#1
4
Inequality
y( )3 6 x− ≥ ( )( )
4
12 24
#2
3
trueInequality
x
−
− ≥ −
− ( )4 6 y− + ( )
( )
3 6
12 18 6
6 6 true
− ≤ −
− ≤ −
− ≤ −
#1
4 6
6
4
Inequalityy x
y x
≥
≥
# 2
3 6 6
6 3 6
3 6
61
12
Inequalityx y
y xxy
y x
− + ≤ −≤ −
−≤
≤ −
Note the greater than and less than icons at the far left of each inequality.
STEP #4 If you are answering an open response question on a Regents examination, copy the input screen, a table of values, the graph, and your solution check into your examination booklet.
STEP #2. Visually inspect the graph to estimate whether a given point falls in the area of the graph shaded by both inequalities.

INTEGRATED ALGEBRA REGENTS EXAMINATION STUDY GUIDE www.jmap.org
70
Questions 337-349: A.A.11: Solve a system of one linear and one quadratic equation in two variables, where only factoring is required. Note: The quadratic equation should represent a parabola and the solution(s) should be integers. If given two equations and a point, plug the coordinate values of the given point(s) into both equations and see if both of the equations remain true.
• If both equations remain true, the given point is a solution to the system of equations.
A.G.9: Solve systems of linear and quadratic equations graphically Note: Only use systems of linear and quadratic equations that lead to solutions whose coordinates are integers. A solution to a system of linear and quadratic equations is any point where the graphs of the linear and quadratic equations intersect. A solution set for a system of linear and quadratic equations can contain zero, one, or two points.
• Solutions can often be identified by inspecting the graphs of the equations. • If the graph of the equations are not provided, a graphing calculator can be used to
create the graphs.
Example: The following problem appeared on a Regents examination. On the set of axes, solve the following system of equations graphically and state the coordinates of all points in the solution set.
2 4 5
1
y x xy x= + −= −

INTEGRATED ALGEBRA REGENTS EXAMINATION STUDY GUIDE www.jmap.org
71
STEP #1. Input both equations into the y-editor of the calculator.
2 4 5
1
y x xy x= + −= −
STEP #3.
Use the calculate intersect function of the graphing calculator to find the exact intersection(s) of the two lines.
The two solutions are ( )4, 5− − and ( )1,0 .
STEP #2. Visually inspect the graph to estimate whether a given point falls in the area of the graph shaded by both inequalities.
STEP #4. Check your solution by substituting both solutions into both equations. If both equations remain balanced, the solutions are good.
STEP #5 If you are answering an open response question on a Regents examination, copy the input screen, a table of values, the graph, and your solution check into your examination booklet.

INTEGRATED ALGEBRA REGENTS EXAMINATION STUDY GUIDE www.jmap.org
72
Questions 350-357 A.A.13: Add, subtract, and multiply monomials and polynomials. Like terms must have exactly the same base and exactly the same exponent.
Examples: 2y and 7y =9y
1x2 and 3x2 = 4x2 5x3 and 8x3 = 13x3
Adding and Subtracting Like Terms: To add or subtract like terms:
• Step 1: Arrange the polynomial so like terms are together. • Step 2: Add or subtract the coefficients of the like terms.
Example:
Combine like terms in the expression: 31 2 4 5 7x y x x y+ + + −
Step 1: ( ) ( )31 4 5 2 7x x x y y+ + + −
Step 2: 35 5 5x x y+ −
Adding and Subtracting Polynomial Expressions To add or subtract polynomial expressions:
• Step 1: Arrange the polynomials one above the other so that like terms are in columns. • If one expression does not have one or more like terms, leave a space in that
column • Step 2: Add or subtract the coefficients of the like terms in columns, as in
simple addition or subtraction. Example of Addition of Polynomials: This problem appeared in a Regents examination.
The sum of 3 2 3 24 6 2 3 3 3 5 5x x x and x x x+ + − + − − is:
Solution:
Step 1
3 2
3 2
4 6 2 3
3 3 5 5
x x xx x x+ + −
+ − − Step 2
3 2
3 2
3 2
4 6 2 3
3 3 5 5
7 9 3 8
x x xx x x
x x x
+ + −
+ − −
+ − −
The answer is: 3 27 9 3 8x x x+ − − Example of Subtraction of Polynomials: This problem appeared in a Regents exam.
What is the result when 22 3 6x xy+ − is subtracted from
2 7 2x xy− + ?
Step 1
2
2
2 3 6
( 7 2)
x xyx xy
+ −
− − + Step 2
2
2
2
2 3 6
( 7 2)
10 8
x xyx xy
x x
+ −
− − +
+ −

INTEGRATED ALGEBRA REGENTS EXAMINATION STUDY GUIDE www.jmap.org
73
The answer is: 2 10 8x x+ −
Multiplication of Polynomial Expressions Multiplication of polynomial expressions combines the distributive property with the rules for multiplying exponential powers of the same base.
• Distributive Property Multiplication
• Exponent Rule: For any nonzero number a and any rational numbers m and n, a a am n m n⋅ = +
Example: This problem did not appear in a Regents examination.
What is the product of 2 36x y and
23 4xy xy+ Step 1. Set the problem up like a distributive property problem, as follows: ( )2 3 26 3 4x y xy xy+
Step 2. Multiply the outside term by the first inside term. Multiply coefficient times coefficient
6 3 18× = Multiply the first base
2 3x x x= Note: This is the same as ( ) 3x x x x=
Multiply the next base 3 2 5y y y=
Note: This is the same as ( )( ) 5y y y y y y=
Put all the results of this step together in one term 3 518x y
Step 3. Multiply the outside term by the second inside term. Multiply coefficient times coefficient
6 4 24× = Multiply the first base
2 3x x x= Note: This is the same as ( ) 3x x x x=
Multiply the next base 3 4y y y=
Note: This is the same as ( )( ) 4y y y y y=
Put all the results of this step together in one term 3 424x y
Step 4. Combine the results of Step 2 and Step 3 in one expression. 3 5 3 418 24x y x y+ This is the final answer.
a b c ab ac( )+ = + ( )a b c ab ac− = −( )b c a ba ca+ = + ( )b c a ba ca− = −

INTEGRATED ALGEBRA REGENTS EXAMINATION STUDY GUIDE www.jmap.org
74
Questions 358-359: A.A.14: Divide a polynomial by a monomial or binomial, where the quotient has no remainder. To divide a polynomial by a monomial,
Step 1. Factor the denominator out of the numerator. Step 2. Then, cancel the factor in both the numerator and denominator.
Example: The problem has not appeared on a Regents examination.
Express 3 212 9 6
3
x x xx
− + in simplest form.
Step 1. ( )23 4 3 2
3
x x xx− +
Step 2. 3x ( )24 3 2
3
x xx− +
Solution: 24 3 2x x− +
Questions 360-370: A.A.12: Multiply and divide monomial expressions with a common base, using the properties of exponents Note: Use integral exponents only. Overview of Rules for Exponents:
Rule: For any nonzero number a, a0 1= , and aa
nn
− =1
Rule: For any nonzero number a and any rational numbers m and n, a a am n m n⋅ = +
Rule: For any nonzero number a and any rational numbers m and n, ( )a am n mn=
Rule: For any nonzero numbers a and b and any rational number n ( )ab a bn n n=
Rule: For any nonzero number a and any rational numbers m and n, aa
am
nm n= −
Rule: A number is in scientific notation if it is written in the form a n×10 , where
n is an integer and 1 10≤ <a
Rule: For any nonzero number a, a0 1=
Rule: For any nonzero number a, aa
nn
− =1

INTEGRATED ALGEBRA REGENTS EXAMINATION STUDY GUIDE www.jmap.org
75

INTEGRATED ALGEBRA REGENTS EXAMINATION STUDY GUIDE www.jmap.org
76
Questions 371-375: A.N.4: Understand and use scientific notation to compute products and quotients of numbers. Rules for scientific notation: A number is in scientific notation if it is written in the form a n×10 , where n is an integer
and 1 10≤ <a
Scientific notation uses 10base with exponents to express very large and very small
numbers. o All rules of exponents apply to scientific notation.
Moving the decimal one place to the left increases the exponent by one (left is a plus)
Moving the decimal one place to the right decreases the exponent by one (right is negative)
Example: The following problem appeared in a Regents examination. Two objects are 2 4 1020. × centimeters apart. A message from one object travels to the other at a rate of 12 105. × centimeters per second. How many seconds does it take the message to travel from one object to the other? Solution:
( )( )20
20 5 155
2.4 10 2.410 2 10
1.2 10 1.2−×
= × = ××
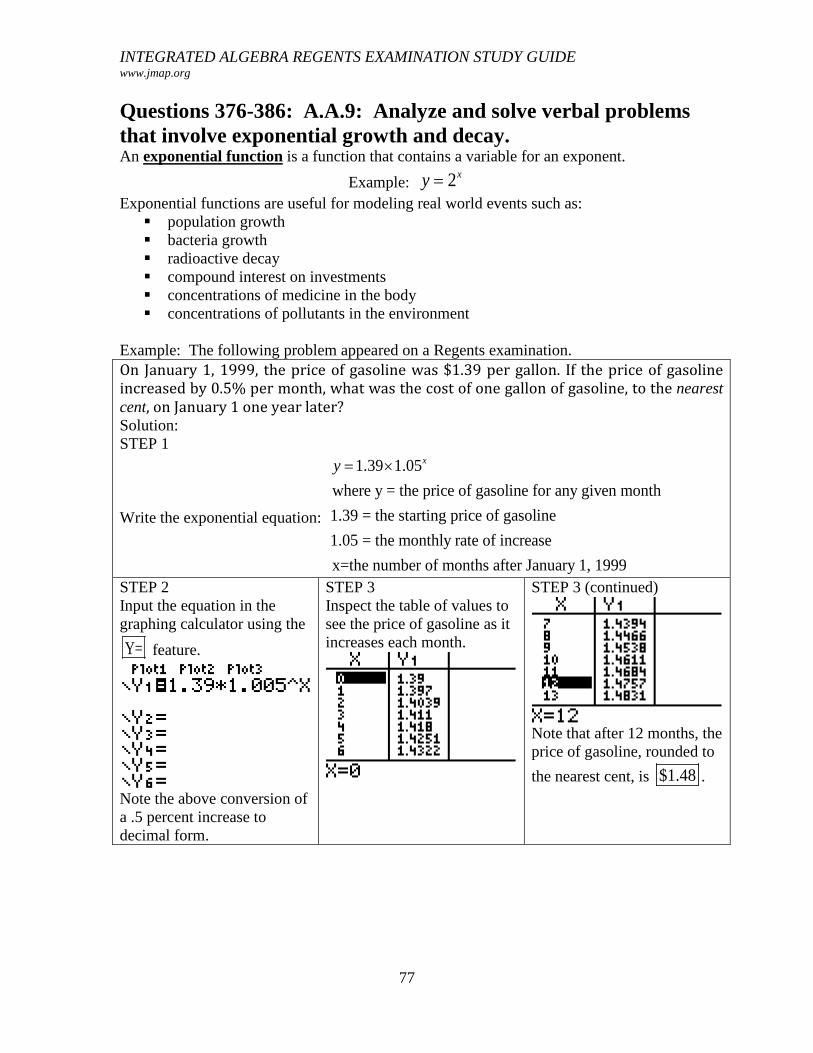
INTEGRATED ALGEBRA REGENTS EXAMINATION STUDY GUIDE www.jmap.org
77
Questions 376-386: A.A.9: Analyze and solve verbal problems that involve exponential growth and decay. An exponential function is a function that contains a variable for an exponent.
Example: 2xy = Exponential functions are useful for modeling real world events such as: population growth bacteria growth radioactive decay compound interest on investments concentrations of medicine in the body concentrations of pollutants in the environment
Example: The following problem appeared on a Regents examination. On January 1, 1999, the price of gasoline was $1.39 per gallon. If the price of gasoline increased by 0.5% per month, what was the cost of one gallon of gasoline, to the nearest cent, on January 1 one year later? Solution: STEP 1
Write the exponential equation:
1.39 1.05
where y = the price of gasoline for any given month
1.39 = the starting price of gasoline
1.05 = the monthly rate of increase
x=the number of months after January 1, 1999
xy = ×
STEP 2 Input the equation in the graphing calculator using the
Y= feature.
Note the above conversion of a .5 percent increase to decimal form.
STEP 3 Inspect the table of values to see the price of gasoline as it increases each month.
STEP 3 (continued)
Note that after 12 months, the price of gasoline, rounded to
the nearest cent, is $1.48 .

INTEGRATED ALGEBRA REGENTS EXAMINATION STUDY GUIDE www.jmap.org
78
Question 387: A.G.4: Identify and graph linear, quadratic (parabolic), absolute value, and exponential functions.
Exponential Functions STEPS 1&2: Transform the Equation for Input (if necessary) and Access the Equation View
STEP 3: Access the Table of Values
STEP 4: Access the Graph
Given: 2xy =
Questions 388-395: A.N.2: Simplify radical terms (no variable in the radicand). A radical expression is in simplest form when the following 3 conditions are met: It has no perfect square factors other than 1.
o Perfect squares are squares of whole numbers, such as 1, 4, 9, 16, 25, 36, 49, 64, 81, 100, etc.
These are equivalent forms of 2 2 2 2 21 , 2 , 3 , 4 , 5 ,....∞
It contains no fractions in the numerator or denominator, and It contains no radical sign in the denominator when expressed as a fraction.
The fundamental theorem of arithmetic states every whole number is either: a prime number itself, or
o Examples: 1, 2, 3, 5, 7, 11, 13, 17, 19, 23, 29, 31, 37, 43, ….∞ a unique combination of prime numbers as factors.
o Examples: 4 2 2= × , 6 2 3= × , 8 2 2 2= × × , 9 3 3= × , 10 2 5= × This theorem can be used to simplify radicals that are expressed as whole
numbers. How to simplify a radical:
Step 1. Use the fundamental theorem of arithmetic to show the prime factorization of the radical.
Step 2. Convert all perfect squares to whole numbers. Step 3. Simplify and cancel whole numbers whenever possible.

INTEGRATED ALGEBRA REGENTS EXAMINATION STUDY GUIDE www.jmap.org
79
Example: The following example appeared in a Regents examination.
What is 32 expressed in simplest radical form?
1 32
2 16
2 2 8
2 2 2 4
2 2 2 2 2
Step
( )( )( )( )
2 2 2 2 2 2
2 2 2
3 4 2
Step
Step
Step 4. Check your work using a graphing
calculator.
You can also use a graphing calculator to work backwards with multiple choice
problems.
Questions 396-400: A.N.3: Perform the four arithmetic operations using like and unlike radical terms and express the result in simplest form. Big Idea: Radicals can be added, subtracted, multiplied, and divided.
o A radicand is the number or value inside the radical sign. o Like radicals have identical radicands and can be combined through
addition and subtraction. o Unlike radicals have different radicands and cannot be combined
through addition and subtraction. Addition of Radicals: To add radicals with identical radicands, think of them as like terms and combine their coefficients. Examples:
( )3 2 5 2 3 5 2 8 2+ = + =
3 2 5 3+ have different radicands and cannot be combined. Subtraction of Radicals: To subtract radicals with identical radicands, think of them as like terms and combine their coefficients. Example:
( )3 2 5 2 3 5 2 2 2− = − = −
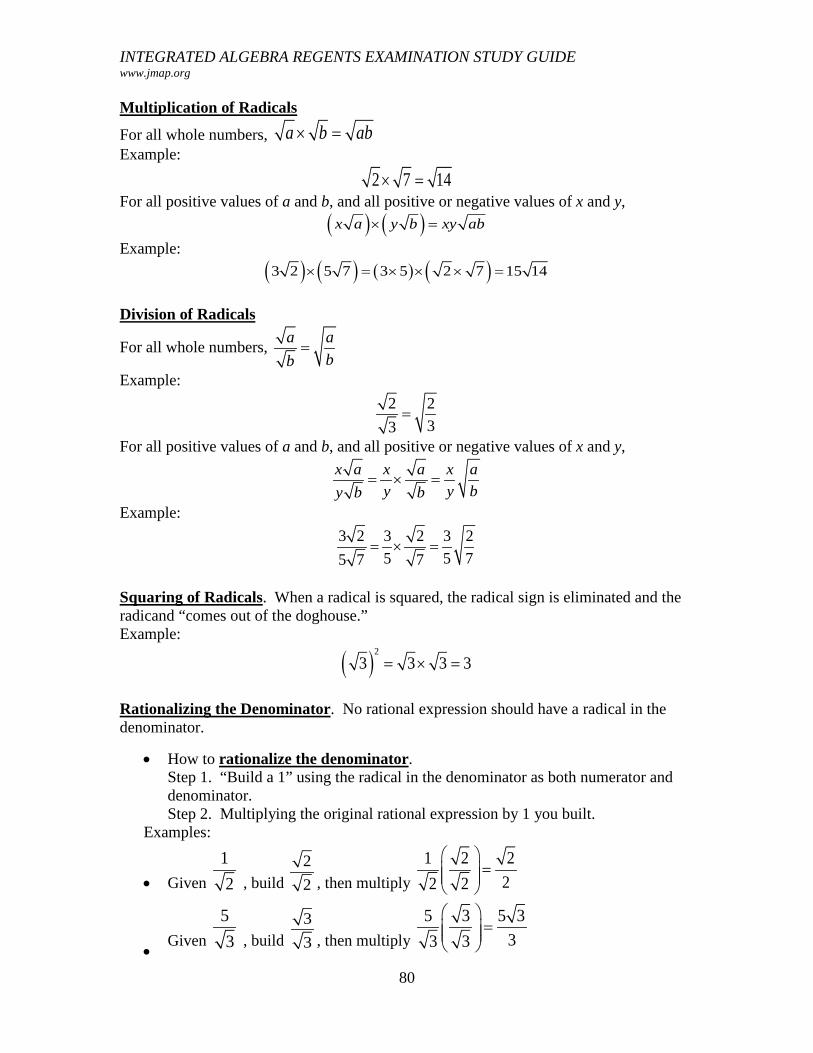
INTEGRATED ALGEBRA REGENTS EXAMINATION STUDY GUIDE www.jmap.org
80
Multiplication of Radicals
For all whole numbers, a b ab× = Example:
2 7 14× = For all positive values of a and b, and all positive or negative values of x and y,
( ) ( )x a y b xy ab× =
Example:
( ) ( ) ( ) ( )3 2 5 7 3 5 2 7 15 14× = × × × =
Division of Radicals
For all whole numbers, a a
bb=
Example:
2 2
33=
For all positive values of a and b, and all positive or negative values of x and y,
x a x a x ay y by b b
= × =
Example:
3 2 3 2 3 2
5 5 75 7 7= × =
Squaring of Radicals. When a radical is squared, the radical sign is eliminated and the radicand “comes out of the doghouse.” Example:
( )2
3 3 3 3= × =
Rationalizing the Denominator. No rational expression should have a radical in the denominator.
• How to rationalize the denominator. Step 1. “Build a 1” using the radical in the denominator as both numerator and denominator. Step 2. Multiplying the original rational expression by 1 you built.
Examples:
• Given
1
2 , build 2
2 , then multiply
1 2 2
22 2
=
• Given
5
3 , build 3
3 , then multiply
5 3 5 3
33 3
=
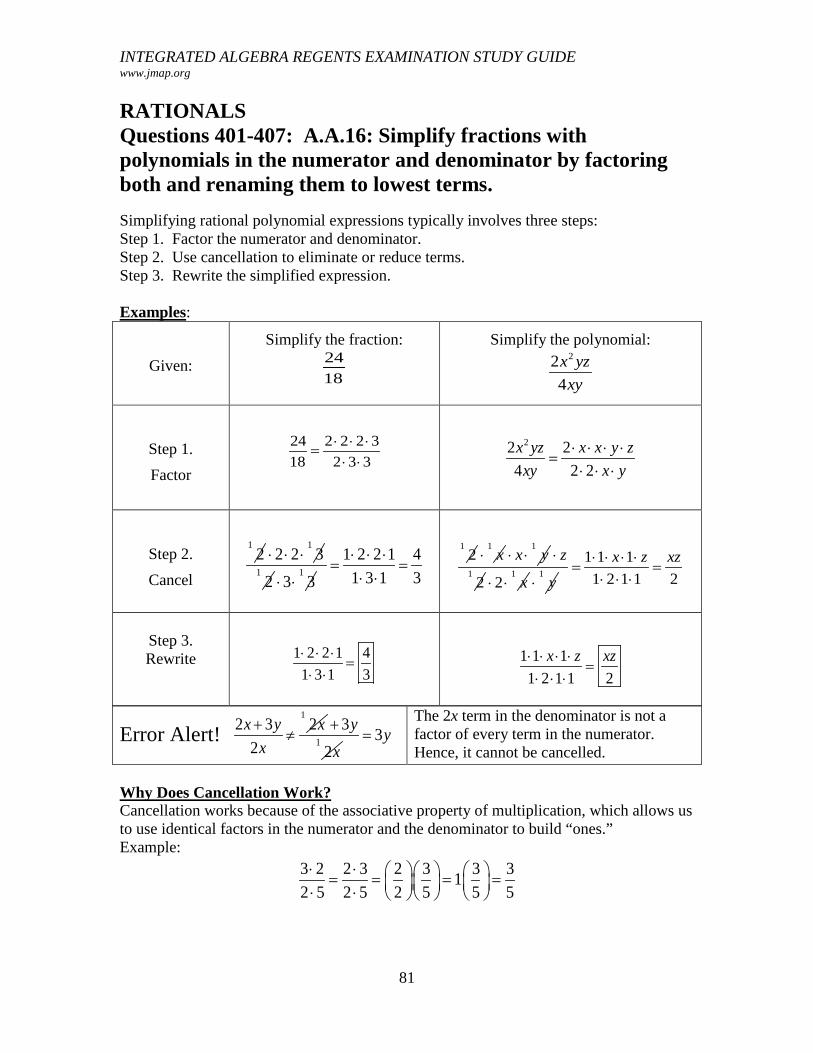
INTEGRATED ALGEBRA REGENTS EXAMINATION STUDY GUIDE www.jmap.org
81
RATIONALS Questions 401-407: A.A.16: Simplify fractions with polynomials in the numerator and denominator by factoring both and renaming them to lowest terms. Simplifying rational polynomial expressions typically involves three steps: Step 1. Factor the numerator and denominator. Step 2. Use cancellation to eliminate or reduce terms. Step 3. Rewrite the simplified expression. Examples:
Given:
Simplify the fraction: 24
18
Simplify the polynomial: 22
4
x yzxy
Step 1.
Factor
24 2 2 2 3
18 2 3 3
⋅ ⋅ ⋅=
⋅ ⋅
22 2
4 2 2
x yz x x y zxy x y
⋅ ⋅ ⋅ ⋅=
⋅ ⋅ ⋅
Step 2.
Cancel
1
21
2 2 3⋅ ⋅ ⋅1
21
3 3⋅ ⋅
1 2 2 1 4
1 3 1 3
⋅ ⋅ ⋅= =
⋅ ⋅
1
21
x⋅1
x y⋅ ⋅1
2
z⋅1
2 x⋅ ⋅1
y⋅
1 1 1
1 2 1 1 2
x z xz⋅ ⋅ ⋅ ⋅= =
⋅ ⋅ ⋅
Step 3. Rewrite
1 2 2 1 4
1 3 1 3
⋅ ⋅ ⋅=
⋅ ⋅
1 1 1
1 2 1 1 2
x z xz⋅ ⋅ ⋅ ⋅=
⋅ ⋅ ⋅
Error Alert! 1
2 3 2
2
x y xx+
≠ 1
3
2
yx+
3y= The 2x term in the denominator is not a factor of every term in the numerator. Hence, it cannot be cancelled.
Why Does Cancellation Work? Cancellation works because of the associative property of multiplication, which allows us to use identical factors in the numerator and the denominator to build “ones.” Example:
3 2 2 3 2 3 3 31
2 5 2 5 2 5 5 5
⋅ ⋅ = = = = ⋅ ⋅

INTEGRATED ALGEBRA REGENTS EXAMINATION STUDY GUIDE www.jmap.org
82
Questions 408-415: A.A.15: Find values of a variable for which an algebraic fraction is undefined. Big Idea: An algebraic fraction is undefined when the denominator equals zero.
• Division by zero is not allowed. How to find the value of a variable that makes an algebraic expression undefined. Step 1. Write an equation where the expression in the denominator equals zero. Step 2. Solve the equation for the variable. Example:
Given:
Which value of x makes the expression
3
5
xx+−
undefined?
Step 1.
Use the denominator to write 5 0x − =
Step 2.
Solve for x.
5x =
Interpreting of Solution
When the value of x is 5, the denominator
of the expression 3
5
xx+−
is equal to zero.
Since division by zero is undefined, the entire expression is said to be undefined.
Questions 416-421: A.A.18: Multiply and divide algebraic fractions and express the product or quotient in simplest form.
Multiplication of Algebraic Fractions a c acb d bd⊗ =
Most Regents problems in this category of problems involve differences of perfect squares, which can be factored and cancelled , thereby simplifying the multiplication process.
( )( )2 2a b a b a b− = + −
Note: The word product is associated with multiplication.

INTEGRATED ALGEBRA REGENTS EXAMINATION STUDY GUIDE www.jmap.org
83
Example:
Given What is the product of 2 25
6 3
xx−+
and 8 4
5
xx++
?
Step 1.
Write as a Multiplication Problem
and Factor ( )( )( )( )
( )( )
2 25 8 4
6 3 5
5 5 4 1
4 1 5
x xx x
x x xx x
− +×
+ +
+ − ++ +
Step 2.
Cancel
( )5x + ( ) ( )5 4x − ( )1x +
4 ( )1x + ( )5x +
Rewrite
5x −
Division of Algebraic Fractions
Note: The word quotient is associated with division. How to divide algebraic expressions.
Step 1. Start with two fractions that you want to
divide.
aa c bor its equivalent form cb d
d
÷
Step 2. Rewrite the problem as a multiplication problem.
• Keep the first (or top) fraction. • Change the operations sign from
division to multiplication. • Flip the second fraction.
a c a db d b c÷ = ×
Step 3 Solve the multiplication problem.
Why does the Keep, Flip, Change algorithm work? Division and multiplication are related operations. For example, dividing a term by 5
will produce the same answer as multiplying the same term by 1
5 .
1
5 1 5
x x =
The Keep, Flip, Change algorithm takes advantage of the fact that dividing by a term gives the same result as multiplying by the reciprocal (the Flip) of the term.

INTEGRATED ALGEBRA REGENTS EXAMINATION STUDY GUIDE www.jmap.org
84
Example Given. Express in simplest form:
2
2 2
9 14 3 6
49 56
x x xx x x+ + +
÷− + −
Step 1. Rewrite the problem as a multiplication problem using the Keep, Change, Flip
algorithm.
2 2
2
9 14 56
49 3 6
x x x xx x+ + + −
×− +
Step 2. Solve as a multiplication problem using
factoring and cancellation.
( )7x + ( )2x +
( )7x + ( )7x −
( ) ( )8 7x x+ −×
( )3 2x +
Step 3. Simplify
8
3
x +
Questions 422-431: A.A.17: Add or subtract fractional expressions with monomial or like binomial denominators.
Addition of Algebraic Fractions Notes:
• The word sum is associated with addition. • This algorithm for addition of algebraic fractions is identical to the algorithm for
subtraction of algebraic fractions, except a plus sign is used instead of a minus sign.
How to add two algebraic fractions.
Given. Start with two fractions that you want to
add together.
a cb d+
Step 1. Use the X-Bar method, which is
graphically summarized at right by crossed arrows over a bar. The arrow points and bar show where the products of different multiplication operations are recorded.
( ) ( )ad bca cb d bd
++ =
Step 2. Factor, cancel, and simplify as necessary.

INTEGRATED ALGEBRA REGENTS EXAMINATION STUDY GUIDE www.jmap.org
85
Subtraction of Algebraic Fractions Notes:
• The word difference is associated with subtraction. • This algorithm for subtraction of algebraic fractions is identical to the algorithm
for addition of algebraic fractions, except a minus sign is used instead of a plus sign.
How to subtract one algebraic fraction from another algebraic fraction Given.
Start with two fractions that you want to add together.
a cb d−
Step 1. Use the X-Bar method, which is
graphically summarized at right by crossed arrows over a bar. The arrow points and bar show where the products of different multiplication operations are recorded.
( ) ( )ad bca cb d bd
−− =
Step 2. Factor, cancel, and simplify as necessary.
Examples Addition
of Algebraic Fractions Subtraction
of Algebraic Fractions Given What is the sum of 6
4a and
2
3a expressed in simplest
form?
What is the difference of 6
4a and 2
3a expressed in
simplest form?
Step 1
Use the X-Bar method.
( )( ) ( )( )( )( )
6 2
4 36 3 2 4
4 3
a aa aa a
+
+ ( )( ) ( )( )( )( )
6 2
4 36 3 2 4
4 3
a aa aa a
+
−
Step 2. Factor, cancel, and simplify
as necessary.
( )( ) ( )( )( )( )
( )( )
( )( )( )
6 3 2 4
4 3
18 8
4 3
26
4 3
2
a aa aa aa a
aa a
+
+
( ) ( )13 a
( )2 ( )( )( ) ( )2 3a a
13
6a
( )( ) ( )( )( )( )
( )( )
( )( )( )
6 3 2 4
4 3
18 8
4 3
10
4 3
2
a aa aa aa a
aa a
−
−
( ) ( )5 a
( )2 ( )( )( ) ( )2 3a a
5
6a

INTEGRATED ALGEBRA REGENTS EXAMINATION STUDY GUIDE www.jmap.org
86
Questions 432-439: A.A.26: Solve algebraic proportions in one variable which result in linear or quadratic equations. Big Ideas: A proportion can be thought of as two fractions with an equal sign between them.
a cb d=
Proportions can be solved using cross multiplication.
,a cIfb d
Then ad bc
=
=
Example
Given Solve for x:
1 7
12
xx x+ −
=−
Step 1
Cross Multiply
( )( ) ( )( )1 12 7x x x+ − = −
Step 2
Solve
( )( )
2
2
2
12 12 7
11 12 7
4 12 0
6 2 0
6 2
x x x xx x xx x
x x
x and x
− + − = −
− − = −
− − =
− + =
= = −

INTEGRATED ALGEBRA REGENTS EXAMINATION STUDY GUIDE www.jmap.org
87
Questions 440-455: A.G.4: Identify and graph linear, quadratic (parabolic), absolute value, and exponential functions . How to identify the graphs of linear, quadratic, absolute value and exponential functions.
Linear Functions …look like straight
lines that are not vertical.
Quadratic Functions …look like
parabolas that open up or down.
Absolute Value
Functions …look like v-
shapes.
Exponential Functions
…look like one-sided curves.
How to identify graphs that are not functions.
Circles and Ellipses …are not functions.
Parabola-like graphs that open to the side …are not functions.
S-Curves
…are not functions.
Vertical lines
…are not functions.
Definition of a function: a function takes the input value of an independent variable and pairs it with one and only one output value of a dependent variable.
• This means that for every value of x, there is one and only one value of y. o Example:
The set of points ( )( )( )( ){ }1,6 1,3 2,5 1,7− cannot be a function because:
when x has a value of 1, there are two different values of y, which are 3 and 7.
o Vertical Line Test. If you move a vertical line from left to right across the graph of a
function, the vertical line will never intersect more than one point of the graph.
If you move a vertical line from left to right across the graph of a non-function, at certain values of x, the vertical line will intersect the graph at two or more points.

INTEGRATED ALGEBRA REGENTS EXAMINATION STUDY GUIDE www.jmap.org
88
Questions 456-464: A.A.45: Determine the measure of a third side of a right triangle using the Pythagorean theorem, given the lengths of any two sides. The hypotenuse of a right triangle is
• the side opposite the right angle, and • always the longest side of a right triangle.
b
A
BC
c
a
Pythagorean Theorem: In a right triangle, the sum of the squares of the lengths of the legs of the triangle equals the square of the length of the hypotenuse. Algebraically, this can be written as:
2 2 2a b c+ = • By transforming the formula, you can use the length of the hypotenuse and one
side of a right triangle to find the missing side, as follows: 2 2 2
2 2 2
a c bb c a
= −
= −
Example: The following problem appeared in a Regents exam. Nancy’s rectangular garden is represented in the diagram below.
If a diagonal walkway crosses her garden, what is its length, in feet?
Solution: 2 2 2
2 2 2
2
2
2
8 15
64 225
289
289
17
a b cccc
c
c
+ =
+ =
+ =
=
=
=

INTEGRATED ALGEBRA REGENTS EXAMINATION STUDY GUIDE www.jmap.org
89
Questions 465-472: A.A.42: Find the sine, cosine, and tangent ratios of an angle of a right triangle, given the lengths of the sides. Big Idea: Every right triangle has six parts:
• Three angles. o Angles are usually labeled with capital letters.
• Three sides. o Sides are usually labeled with small case letters.
b
A
BC
c
a
In the triangle shown above: • Side c (the longest side) is the hypotenuse. • Side a is:
o opposite Angle A. o adjacent (next to) Angle B.
• Side b is: o opposite Angle B. o adjacent (next to) Angle A.
Basic trigonometry uses “trig ratios” to describe the relationships that exist between the two acute angles and the sides of a right triangle.
• SOH-CAH-TOA is useful for remembering the trig ratios.
in of angle =
cos of angle =
tan of angle
so oppSOH sh hypa adjCAH ch hypo oppTOA ta adj
=
=
= =
How to find a basic trig ratio:
• Step 1. Using a sketch or diagram of the right triangle, identify the angle associated with the trig ratio.
• Step 2. Write the formula for the trig ratio (using SOH-CAH-TOA as a memory aid, if necessary).
• Step 3. Identify the measures of the two sides that will be used in the trig ratio. • Step 4. Substitute the measures into the formula.

INTEGRATED ALGEBRA REGENTS EXAMINATION STUDY GUIDE www.jmap.org
90
Example: The following problem is from a Regents examination. Given Right triangle ABC has legs of 8 and 15 and a
hypotenuse of 17, as shown in the diagram below.
The value of the tangent of is:
Step 1. Using a sketch or diagram of the right triangle, identify the angle
associated with the trig ratio.
Step 2. Write the formula for the trig ratio
(using SOH-CAH-TOA as a memory aid, if necessary).
Step 3. Identify the measures of the two sides that will be used in the trig
ratio.
Step 4.
Substitute the measures into the formula.

INTEGRATED ALGEBRA REGENTS EXAMINATION STUDY GUIDE www.jmap.org
91
Questions 473-479: A.A.44: Find the measure of a side of a right triangle, given an acute angle and the length of another side. How to find the measure of a side of a right triangle:
• Step 1. Sketch a right triangle to represent the problem and determine: o the two parts that are known, and o the third part that needs to be found. NOTE: Every Regents problem provides two parts of a right triangle and asks you to find a third part.
• Step 2. Select the correct trig ratio • Step 3. Substitute the values from the problem into the formula. • Step 4. Use a scientific or graphing calculator to convert between trig ratios and
angle measurements. NOTE: Be sure to set graphing calculators to “degree” mode.
Example: The following problem is from a Regents exam.
Given
An 8-foot rope is tied from the top of a pole to a stake in the ground, as shown in the diagram below.
If the rope forms a 57° angle with the ground, what is the height of the pole, to the nearest tenth of a foot?
Step 1. Understand the problem.
We know an angle and the hypotenuse. We want to find the opposite side.
Step 2.
Select the correct trig ratio. sin
SOH CAH TOAopposite
hypotenuse
− −
=
Step 3.
Substitute values from the problem into the trig ration and solve on paper.
( )
sin
sin 578
8 sin 57
oppositehypotenuseopposite
opposite
=
° =
° =
Step 4.
Use a scientific or graphing calculator to
find the final answer.
The length of the pole, to the nearest tenth of a foot, is 6.7 feet.

INTEGRATED ALGEBRA REGENTS EXAMINATION STUDY GUIDE www.jmap.org
92
Questions 480-486: A.A.43: Determine the measure of an angle of a right triangle, given the length of any two sides of the triangle . How to find the measure of an angle in a right triangle:
• Step 1. Sketch a right triangle to represent the problem and determine: o the two parts that are known, and o the third part that needs to be found. NOTE: Every Regents problem provides two parts of a right triangle and asks you to find a third part.
• Step 2. Select the correct trig ratio • Step 3. Substitute the values from the problem into the formula. • Step 4. Use inverse trig function in a scientific or graphing calculator to convert
between trig ratios and angle measurements. NOTE: Be sure to set graphing calculators to “degree” mode.
• Example: The following problem is from a Regents exam.
Given
In right triangle ABC shown below, 18.3AB = and 11.2BC =
What is the measure of A∠ , to the nearest tenth of a degree?
Step 1. Understand the problem.
We know opposite and adjacent sides. We want to find the measure of A∠ .
Step 2.
Select the correct trig ratio. tan
SOH CAH TOAoppositeadjacent
− −
=
Step 3.
Substitute values from the problem into the trig ration and solve on paper.
tan
11.2tan
18.311.2
arctan18.3
oppositeadjacent
A
m A
=
∠ =
= ∠
Step 4.
Use a scientific or graphing calculator to
find the final answer.
The measure of A∠ , to the nearest tenth of a degree, is 31.5 degrees.
INTEGRATED ALGEBRA REGENTS EXAMINATION STUDY GUIDE www.jmap.org
93
Questions 487-497: A.G.1: Find the area and/or perimeter of figures composed of polygons and circles or sectors of a circle. Note: Figures may include triangles, rectangles, squares, parallelograms, rhombuses, trapezoids, circles, semi-circles, quarter-circles, and regular polygons (perimeter only). Big Ideas: The perimeter is the distance around an enclosed geometric figure.
o The perimeter of a polygon is found by adding together the lengths of all of its sides.
o The perimeter of a circle is called the circumference. Circumference Formulas for Circles
• C d= ⋅π .
• 2C rπ= . The area of a geometric figure is the number of square units enclosed within the
geometric figure. There are numerous formulas for finding area: o Area Formulas
Triangles: 1
2A bh= , where A is the area, b is the base, and h is the
height measured perpendicular to the base. Squares and Rectangles: A bh= , where A is the area, b is the base,
and h is the height measured perpendicular to the base. Parallelograms: A bh= , where A is the area, b is the base, and h is
the height measured perpendicular to the base. Trapezoids: ( )1 2
1
2A b b h= + , where A is the area, b is the base, and
h is the height measured perpendicular to the base. Kites, Rhombuses, and Squares:
1 2
1
2A d d= , where A is the area and
1d and 2d are the lengths of the diagonals. Circles 2A rπ= , where A is the area and r is the radius of the circle.
How to find the area or perimeter of a composition of polygons and circles: Step 1. Divide the composition into its component parts. Step 2. Solve each component part separately Step 3. Add or subtract information from the component parts to solve the problem.

INTEGRATED ALGEBRA REGENTS EXAMINATION STUDY GUIDE www.jmap.org
94
Example: The following problem appeared in a Regents exam.
Given
Luis is going to paint a basketball court on his driveway, as shown in the diagram below. This basketball court consists of a rectangle and a semicircle.
What is the area of this basketball court, in square feet?
Step 1
Divide the problem into two parts: 1. What is the area of the rectangle? 2. What is the area of the half circle?
Step 2
Solve for area of the rectangle:
( )( )10 8
80
A bhA
A
=
=
=
Solve for area of the half circle:
( )
2
24
16
One half of the area of the circle is 8
A r
AA
π
ππ
π
=
=
=
Step 3
Add the area of the circle and the half circle together to get the total area of the composition.
80 8π+

INTEGRATED ALGEBRA REGENTS EXAMINATION STUDY GUIDE www.jmap.org
95
Questions 498-507: A.G.2: Use formulas to calculate volume and surface area of rectangular solids and cylinders. Length is one dimensional and is measured in units. Area is two dimensional and is measured in square units. Volume is three dimensional and is measured in cubic units. Transforming Areas Formulas into Volume Formulas
• An area formula can be transformed into a volume formula by adding a third dimension (length) as a multiple of the area formula. Area Formulas – Two Dimensional Volume Formulas – Three Dimensional
Triangles 1
2A bh=
Triangular Prisms 1
2A bh length =
Squares and Rectangles: A bh=
Cubes and Rectangular Prisms ( )A bh length=
Trapezoids:
( )1 2
1
2A b b h= +
Trapezoidal Prisms
( )1 2
1
2A b b h length = +
Circles 2A rπ=
Cylinders ( )2A r lengthπ=
Example: The following problem appeared in a Regents exam.
Given A cylinder has a diameter of 10 inches and a height of 2.3 inches. What is the volume of this cylinder, to the nearest tenth of an inch?
Step One
Computer the area of the end of the cylinder using the area formula for circles.
( )
2
25
25
A r
AA
π
π
π
=
=
=
Step Two
Multiply the area by the height (length). 25 2.3 ?π × =
The volume is 180.6 cubic inches.

INTEGRATED ALGEBRA REGENTS EXAMINATION STUDY GUIDE www.jmap.org
96
Surface Area Formulas
Rectangular Prism Surface Area
2 2 2SA lw hw lh= + +
Cylinder Surface Area
2 2 2SA r rhπ π= +
NOTE: Both of these formulas appear on the formula page in every Integrated Algebra Regents Exam.
FORMULAS PROVIDED ON THE EXAMINATION REFERENCE SHEET
Trigonometric Ratios
in A =
cos A =
tan A =
sopposite
hypotenuseadjacent
hypotenuseoppositeadjacent
Area
1 2
1trapezoid A= ( )
2h b b+
Volume
2cylinder V= r hπ
Surface Area
rectangular prism 2 2 2SA lw hw lh= + +
2cylinder 2 2SA r rhπ π= +
Coordinate Geometry
2 1
2 1
y yymx x x
−= =
−


![JEFFERSON MATH PROJECT REGENTS BY TOPICmail.jmap.org/JMAPArchives/JMAP1457/JMAPA_845_REGENTS...RATIONAL NUMBERS 2. The number 0.14114111411114 . . . is [A] integral [B] whole [C] rational](https://static.fdocuments.net/doc/165x107/611b9fc7a29e337326206cfe/jefferson-math-project-regents-by-rational-numbers-2-the-number-014114111411114.jpg)


![JEFFERSON MATH PROJECT REGENTS BY TOPIC - … MATH PROJECT REGENTS BY TOPIC ... Triangle Inequalities ..... 519 Basic Trigonometric Ratios ... -i-1 [D] i61 9.](https://static.fdocuments.net/doc/165x107/5abdd7117f8b9a8e3f8c47dc/jefferson-math-project-regents-by-topic-math-project-regents-by-topic-.jpg)
