Jeff Gundlach Fixed Income Playbook
83
Live Webcast hosted by: Jeffrey Gundlach Chief Executive Officer September 9, 2014 “Fixed Income Playbook”
description
Jeff Gundlach's presentation on Fixed Income Playbook.
Transcript of Jeff Gundlach Fixed Income Playbook
Live Webcast hosted by:
Jeffrey Gundlach
Chief Executive Officer
September 9, 2014
“Fixed Income Playbook”

1
Fund Offerings
Retail and Institutional ClassNo Load Mutual Fund
Retail Inst.N-share I-share
Ticker DLTNX DBLTXMin Investment $2,000 $100,000Min IRA Investment $500 $5,000Gross Expense Ratio 0.72% 0.47%
Retail and Institutional ClassNo Load Mutual Fund
Retail Inst.N-share I-share
Ticker DLFNX DBLFXMin Investment $2,000 $100,000Min IRA Investment $500 $5,000Gross Expense Ratio 0.77% 0.52%
Total Return Bond Fund Core Fixed Income Fund
The Funds’ investment objectives, risks, charges and expenses must be considered carefully before investing. The statutory prospectus and summary prospectus (if available) contains this and other important information about the Funds, and it may be obtained by calling 1 (877) 354-6311/ 1 (877) DLINE11, or visiting www.doublelinefunds.com. Read it carefully before investing.Investments in debt securities typically decrease in value when interest rates rise. This risk is usually greater for longer-term debt securities. Investments in lower-rated and non-rated securities present a greater risk of loss to principal and interest than higher-rated securities. Investments in Asset-Backed and Mortgage-Backed Securities include additional risks that investors should be aware of such as credit risk, prepayment risk, possible illiquidity and default, as well as increased susceptibility to adverse economic developments. The Funds may use certain types of investment derivatives. Derivatives involve risks different from, and in certain cases, greater than the risks presented by more traditional investments. Derivatives may involve certain costs and risk such as liquidity, interest rate, market, credit, management and the risk that a position could not be closed when most advantageous. Investing in derivatives could lose more than the amount invested. The Funds may also invest in securities related to real estate, which may decline in value as a result of factors affecting the real estate industry The Core Fixed Income Fund invests in foreign securities which involve greater volatility and political, economic and currency risks and differences in accounting methods. These risks are greater for investments in emerging markets.The Total Return Bond Fund intends to invest more than 50% of its net assets in mortgage-backed securities of any maturity or type.Opinions expressed are subject to change at any time, are not forecasts and should not be considered investment advice.DoubleLine Funds are distributed by Quasar Distributors, LLC.While the Funds are no-load, management fees and other expenses still apply. Please refer to the prospectus for further details.Fund holdings and sector allocations are subject to change and are not recommendations to buy or sell any security.

2
PerformanceDoubleLine Total Return Bond Fund – Quarter Ending June 30, 2014
Performance data quoted represents past performance; past performance does not guarantee future results. The investment return and principal value of an investment will fluctuate so that an investor's shares, when redeemed, may be worth more or less than the original cost. Current performance of the fund may be lower or higher than the performance quoted. Performance data current to the most recent month-end may be obtained by calling 213-633-8200 or by visiting www.doublelinefunds.com. Barclays US Aggregate Index represents securities that are SEC-registered, taxable, and dollar denominated. The index covers the US investment grade fixed rate bond market, with index components for government and corporate securities, mortgage pass-through securities, and asset-backed securities. These major sectors are subdivided into more specific indices that are calculated and reported on a regular basis. It is not possible to invest in an index.Past Performance does not guarantee future results. Index performance is not illustrative of fund performance.
*If a Fund invested in an affiliate Fund sponsored by the Adviser during the period covered by this report the Adviser agreed to not charge a management fee to the Fund in an amount equal to the investment advisory fees paid by the affiliated Fund in respect of the Fund’s investment in the affiliated fund to avoid duplicate charge of the investment advisory fees to the investors.
Quarter EndJune 30, 2014
2Q 2014
1-Year 3-YearAnnualized
Since InceptionAnnualized
(4-6-10 to 6-30-14)
I-share 2.05% 4.87% 6.05% 9.29%
N-share 2.08% 4.71% 5.80% 9.03%
Barclays U.S. Aggregate Index
2.04% 4.37% 3.66% 4.49%
As of June 30, 2014 I-Share N-Share
Gross SEC 30-Day Yield 4.41% 4.16%
Net SEC 30-Day Yield* 4.41% 4.16%
As of June 30, 2014 I-Share N-Share
Gross Expense Ratio 0.47% 0.72%

3
PerformanceDoubleLine Core Fixed Income Fund – Quarter Ending June 30, 2014
Performance data quoted represents past performance; past performance does not guarantee future results. The investment return and principal value of an investment will fluctuate so that an investor's shares, when redeemed, may be worth more or less than the original cost. Current performance of the fund may be lower or higher than the performance quoted. Performance data current to the most recent month-end may be obtained by calling 213-633-8200 or by visiting www.doublelinefunds.com. Past Performance does not guarantee future results. Index performance is not illustrative of fund performance.
*If a Fund invested in an affiliate Fund sponsored by the Adviser during the period covered by this report the Adviser agreed to not charge a management fee to the Fund in an amount equal to the investment advisory fees paid by the affiliated Fund in respect of the Fund’s investment in the affiliated fund to avoid duplicate charge of the investment advisory fees to the investors.
Quarter EndJune 30, 2014
2Q 2014
1-Year 3-YearAnnualized
Since InceptionAnnualized
(6-1-10 to 6-30-14)
I-share 2.36% 5.91% 6.07% 7.56%
N-share 0.05% 5.73% 5.82% 7.31%
Barclays U.S. Aggregate Index
2.04% 4.37% 3.66% 4.04%
As of June 30, 2014 I-Share N-Share
Gross Expense Ratio 0.52% 0.77%
As of June 30, 2014 I-Share N-Share
Gross SEC 30-Day Yield 3.94% 3.69%
Net SEC 30-Day Yield* 3.97% 3.72%

4
Upcoming Webcast Announcements
Morris Chen – September 11, 2014CMBSGo to www.doubleline.com, Home page under “Events”1:15 pm PDT/4:15 pm EDT
Jeffrey Gundlach – September 16, 2014Closed-End FundsGo to www.doublelinefunds.com, Home page under “Events” 2014 Webcast Schedule to register1:15 pm PDT/4:15 pm EDT
Robert Cohen & Bonnie Baha – October 7, 2014Floating RateGo to www.doublelinefunds.com, Home page under “Events”2014 Webcast Schedule to register1:15 pm PDT/4:15 pm EDT
To Receive Presentation Slides:You can email [email protected]

5
TAB IFixed Income Playbook

6
BofA/Merrill Fixed Income Index Returns
Data Source: BofA/Merrill Lynch Indices through year-end December 31, 2013 and September 4, 2014 for the respective years indicated.Please see the Appendix for index definitions. An investment cannot be made directly in an index.
3.67%
4.22%
4.50%
6.66%
10.24%
5.49%
10.98%
-3.21%
-1.40%
0.01%
-1.46%
-5.79%
7.38%
26.60%
Government (G0A0)
Mortgages (MOAO)
International-Developed (NOGO)
Corporate (COAO)
International-Emerging (IGOV)
High Yield (JOAO)
Convertibles (VOSO)
Grey = Year 2013Blue = Year-To-Date 2014

7
BofA/Merrill Fixed Income Index Returns
6.39%
5.79%
7.88%
4.86%
6.31%
4.61%
-4.27%
-1.82%
-0.95%
7.44%
5.19%
13.28%
AAA-Rated Credit (COA1)
A-Rated Credit (COA3)
BBB-Rated Credit (COA4)
B-Rated High Yield (JOA2)
BB-Rated High Yield Credit (JOA1)
CCC-Rated High Yield (JOA3)
Investment Grade = Indices rated AAA to BBB- (shown above) are considered to be investment grade. A bond is considered investment grade if its credit rating is BBB- or higher by Standard & Poor’s or Baa3 by Moody’s. The higher the rating, the more likely the bond is to pay back at par/$100 cents on the dollar. AAA is considered the highest quality and the lowest degree of risk. They are considered to be stable and dependable.Below Investment Grade = Also known as “junk bond” (shown above) is a security rated below investment grade having a rating of BBB- or below. These bonds are seen as having higher default risk or other adverse credit events, but typically pay higher yields than better quality bonds in order to make them attractive. They are less likely to pay back at par/$100 cents on the dollar.Credit distribution from the highest available credit rating from any Nationally Recognizes Statistical Rating Organization (S&P, Moodys, and Fitch).Source: BofA/Merrill Lynch Indices as of December 31, 2013 and September 4, 2014 and for their respective years indicated.Please see appendix for Index definitionsAn investment cannot be made directly in an index.
Grey = Year 2013Blue = Year-To-Date 2014

8
Source: Bianco Research
30 Year U.S. Treasury Total Returns
9
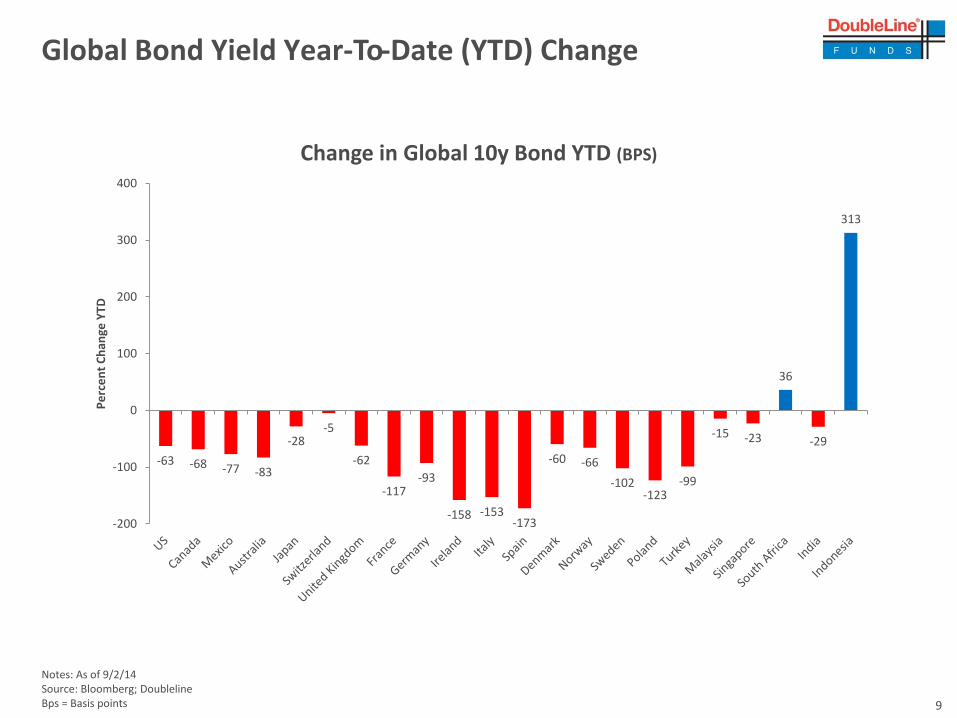
Global Bond Yield Year-To-Date (YTD) Change
-63 -68 -77 -83
-28-5
-62
-117-93
-158 -153-173
-60 -66
-102-123
-99
-15 -23
36
-29
313
-200
-100
0
100
200
300
400
Pe
rce
nt
Ch
ange
YTD
Change in Global 10y Bond YTD (BPS)
Notes: As of 9/2/14 Source: Bloomberg; DoublelineBps = Basis points

10
German Bunds vs. U.S. Treasuries
Source: BloombergUSGG10Y Index = Generic 10-year U.S. Treasury. GDBR10 Index = German Bund 10-year generic 10-yr treasury rates.

11
10yr Peripheral Bond Yield Spreads
0
2
4
6
8
10
12
14
16
10
yr S
pre
ad t
o G
erm
an B
un
ds
(%)
10-year rates: peripheral spreads vs. Germany (%)
Italy Spain Ireland Portugal
Euro Crisisheightens
Draghi's "whatever it takes" speech
Notes: As of 8/31/14 . Italy, Spain, Ireland and Portugal 10 year Treasury rates vs. German 10 year yields.Source: Bloomberg; Doubleline
12
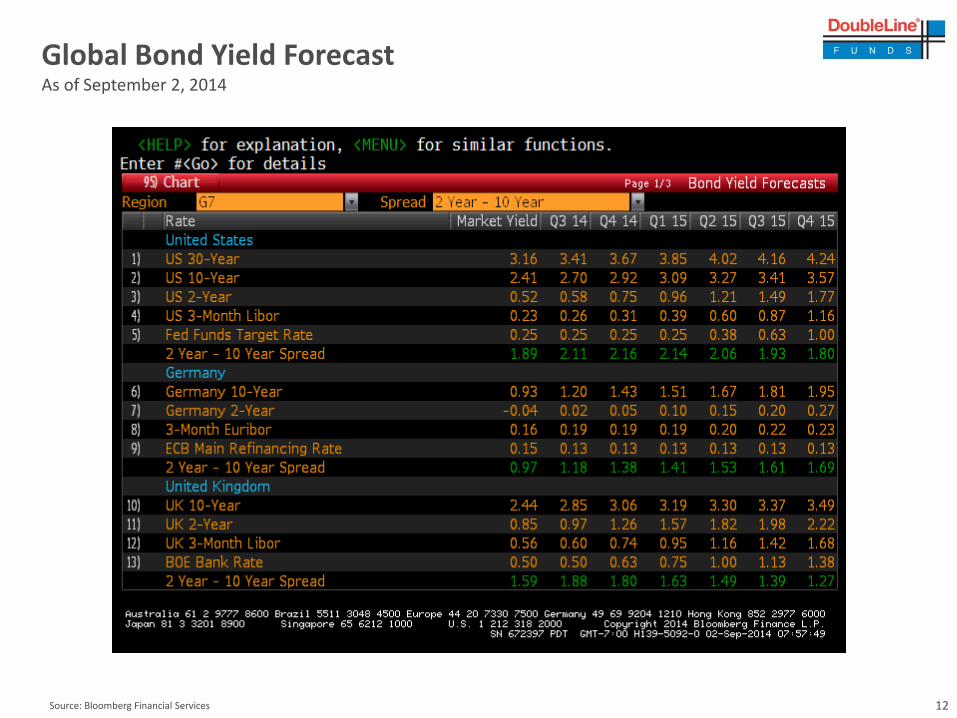
Global Bond Yield ForecastAs of September 2, 2014
Source: Bloomberg Financial Services
13
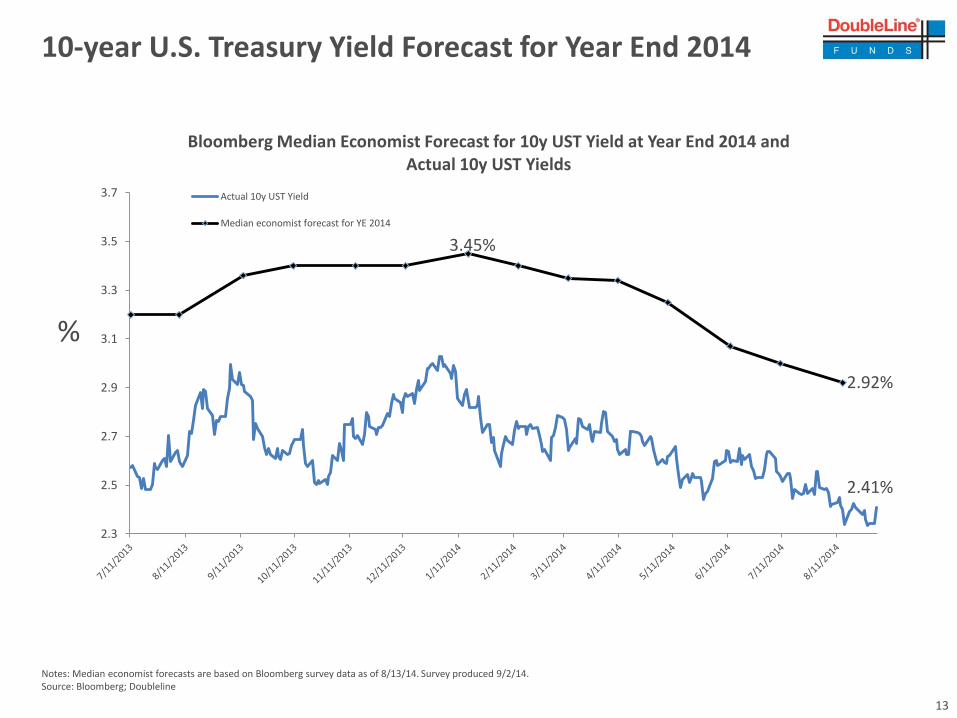
10-year U.S. Treasury Yield Forecast for Year End 2014
2.3
2.5
2.7
2.9
3.1
3.3
3.5
3.7
Bloomberg Median Economist Forecast for 10y UST Yield at Year End 2014 and Actual 10y UST Yields
Actual 10y UST Yield
Median economist forecast for YE 2014
3.45%
Notes: Median economist forecasts are based on Bloomberg survey data as of 8/13/14. Survey produced 9/2/14. Source: Bloomberg; Doubleline
2.92%
2.41%
%

14
Increased Short Positions in U.S. Treasuries Over Last Three Months
Source: Citi ResearchGrey cells indicate the previous results 3 months ago.UST = U.S. Treasury.
The market has got shorter UST. Over the last 3 months. Clear imbalance of shorts points to the rally running further.
15
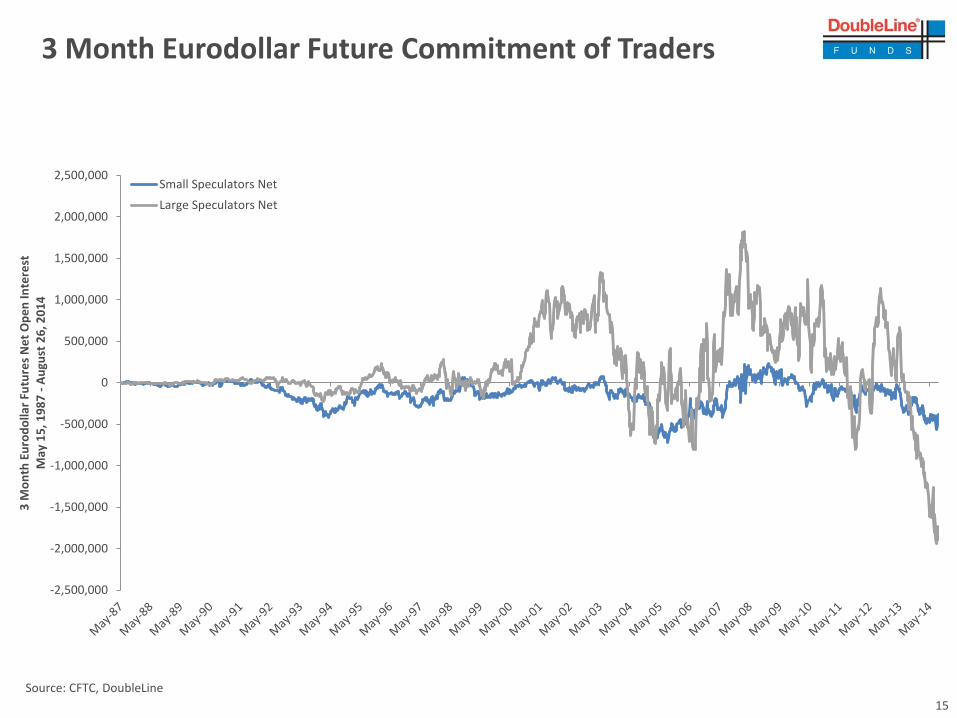
3 Month Eurodollar Future Commitment of Traders
Source: CFTC, DoubleLine
-2,500,000
-2,000,000
-1,500,000
-1,000,000
-500,000
0
500,000
1,000,000
1,500,000
2,000,000
2,500,000
3 M
on
th E
uro
do
llar
Futu
res
Ne
t O
pe
n In
tere
st
May
15
, 19
87
-A
ugu
st 2
6, 2
01
4
Small Speculators Net
Large Speculators Net

16
Percentage of U.S. Treasuries Held January 1, 2000 through July 31, 2014
Source: Morningstar Direct, http://news.morningstar.com/articlenet/article.aspx?id=661929Intermediate-Term Bond Category: A fund that focuses on corporate, government, foreign or other issues with an average duration of greater than or equal to 3.5 years but less than or equal to six years, or an average effective maturity of more than four years but less than 10 years.

17
Global Government – 10- Year YieldsAs of August 28, 2014
Source: Bloomberg; Doubleline

18
Federal Reserve is the Largest Holder of US Debt
http://www.ritholtz.com/blog/2013/10/all-holders-of-u-s-treasury-debt/Source: Barry Ritholtz, The Big Picture, “All Holders of US Debt”, October 11, 2013
19
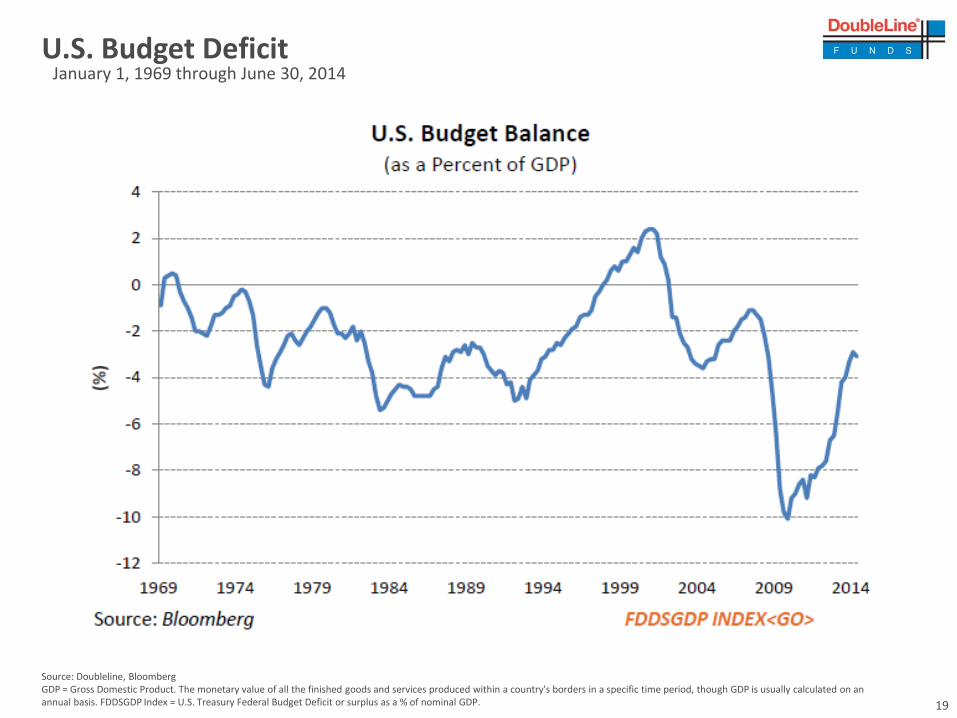
U.S. Budget Deficit January 1, 1969 through June 30, 2014
Source: Doubleline, BloombergGDP = Gross Domestic Product. The monetary value of all the finished goods and services produced within a country's borders in a specific time period, though GDP is usually calculated on an annual basis. FDDSGDP Index = U.S. Treasury Federal Budget Deficit or surplus as a % of nominal GDP.
20
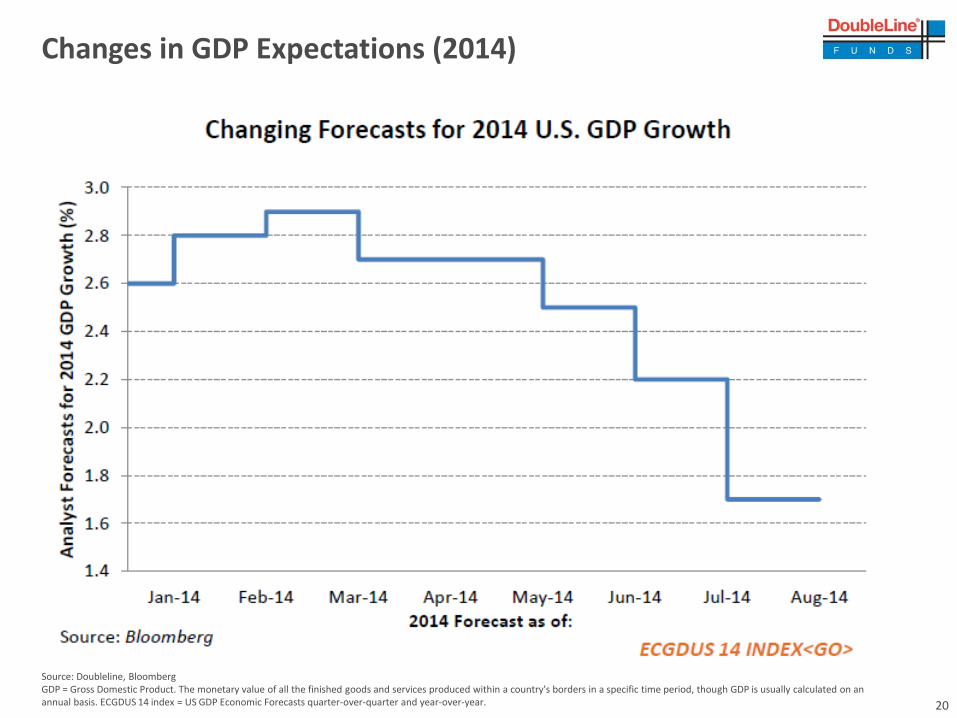
Changes in GDP Expectations (2014)
Source: Doubleline, BloombergGDP = Gross Domestic Product. The monetary value of all the finished goods and services produced within a country's borders in a specific time period, though GDP is usually calculated on an annual basis. ECGDUS 14 index = US GDP Economic Forecasts quarter-over-quarter and year-over-year.

21
U.S. Real GDP Forecasts for 2014 Have Been
Revised Higher Since Q2 Release (*currently 2.0% according to Bloomberg estimates)
1.5
1.7
1.9
2.1
2.3
2.5
2.7
2.9
3.1
3.3
3.5
-520 -480 -440 -400 -360 -320 -280 -240 -200 -160 -120 -80 -40 0
Me
dia
n E
con
om
ist
Fore
cast
fo
r R
eal
GD
P a
t Y
ear
En
d
Median Economist Forecast of US Real GDP at Year End(by year )
2011
2012
2013
2014
Days Leading Up to Forecast (Trading Days)
Source: Doubleline, Bloomberg. As of July 31, 2014.GDP = Gross Domestic Product. The monetary value of all the finished goods and services produced within a country's borders in a specific time period, though GDP is usually calculated on an annual basis.

22
GDP Forecasts January 1, 2004 through 2016 Estimates
Source: Doubleline, BloombergGDP = Gross Domestic Product. The monetary value of all the finished goods and services produced within a country's borders in a specific time period, though GDP is usually calculated on an annual basis. GDP CYOY = GDP Year-Over-Year. EHGDUSY Index =US Real GDP. ECFC = Economic Forecasts

23
Downward Revisions to China Growth Expectations in 2014 January 1, 2010 through March 31, 2014
7
7.5
8
8.5
9
9.5
10
10.5
-520 -480 -440 -400 -360 -320 -280 -240 -200 -160 -120 -80 -40 0
Me
dia
n R
eal
GD
P F
ore
cast
Median Forecast of China Real GDP (by year )
2010
2011
2012
2013
2014
Days Leading Up to Forecast (Trading Days)
The last 3 years have been a story of downward revisions to growth in China.
Source: BloombergGDP = The gross domestic product is The monetary value of all the finished goods and services produced within a country's borders in a specific time period, though GDP is usually calculated on an annual basis.

24
Shanghai Index December 31, 2009 through September 5, 2014
Source: Bloomberg Financial Services, DoubleLine Capital LPNote: The Shanghai Stock Exchange Composite is a capitalization-weighted index tracking daily price performance of all A and B-shares listed on the Shanghai Stock Exchange. This index was developed December 19, 1990 with a base value of 100.An investment cannot be made directly in an index.

25
U.S. Commodities Last 5 Years
Source: BloombergCRY Index = CRB excess return index is an arithmetic average of commodity futures prices with monthly rebalancing. You cannot invest directly in an index.

26
U.S. Dollar Index Spot
Source: Bloomberg Financial Services, DoubleLine Capital LPDXY = DXY is the US Dollar Index (USDX) indicates the general value of the US dollar. Average exchange rates between the US dollar and six major world currencies.An investment cannot be made directly in an index.

27
Inflations vs. 10-Year U.S. Treasury Yield
USGG10Yr = U.S. Generic 10 Year treasury yield, PCE Deflator = Personal consumption expenditure price deflator. PCE DEFY Index = Personal Consumption index measure of price changes in consumer goods and service. YoY = year-over-year.

28
Wages and Salary / GDP
Source: Federal Reserve Bank of St. Louis, DoubleLineGDP = Gross Domestic Product. The monetary value of all the finished goods and services produced within a country's borders in a specific time period, though GDP is usually calculated on an annual basis
51.7%Q1 1970
42.1%Q4 2011
43%Q2 2014
40%
45%
50%
55%
Wag
es &
Sal
ary
Acc
rual
/ G
ross
Do
me
stic
Pro
du
ct
1st
Qu
arte
r 1
94
7 t
hro
ugh
2n
d Q
uar
ter
20
14
29
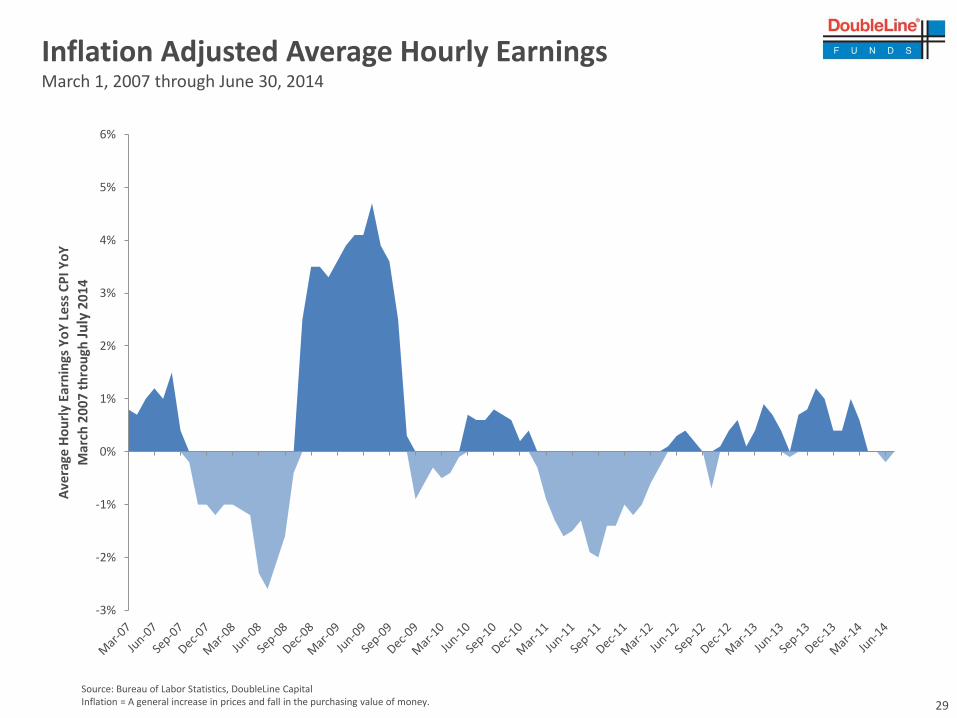
Source: Bureau of Labor Statistics, DoubleLine CapitalInflation = A general increase in prices and fall in the purchasing value of money.
Inflation Adjusted Average Hourly EarningsMarch 1, 2007 through June 30, 2014
-3%
-2%
-1%
0%
1%
2%
3%
4%
5%
6%
Ave
rage
Ho
url
y Ea
rnin
gs Y
oY
Less
CP
I Yo
Y
Mar
ch 2
00
7 t
hro
ugh
Ju
ly2
01
4

30
Inflation Adjusted Average Hourly EarningsJanuary 1, 2007 through June 30, 2014
Source: Economic Policy Institute, Wall Street Journal, Bianco ResearchInflation = A general increase in prices and fall in the purchasing value of money.

31
Minimum Wage Has Declined in Real Terms
32
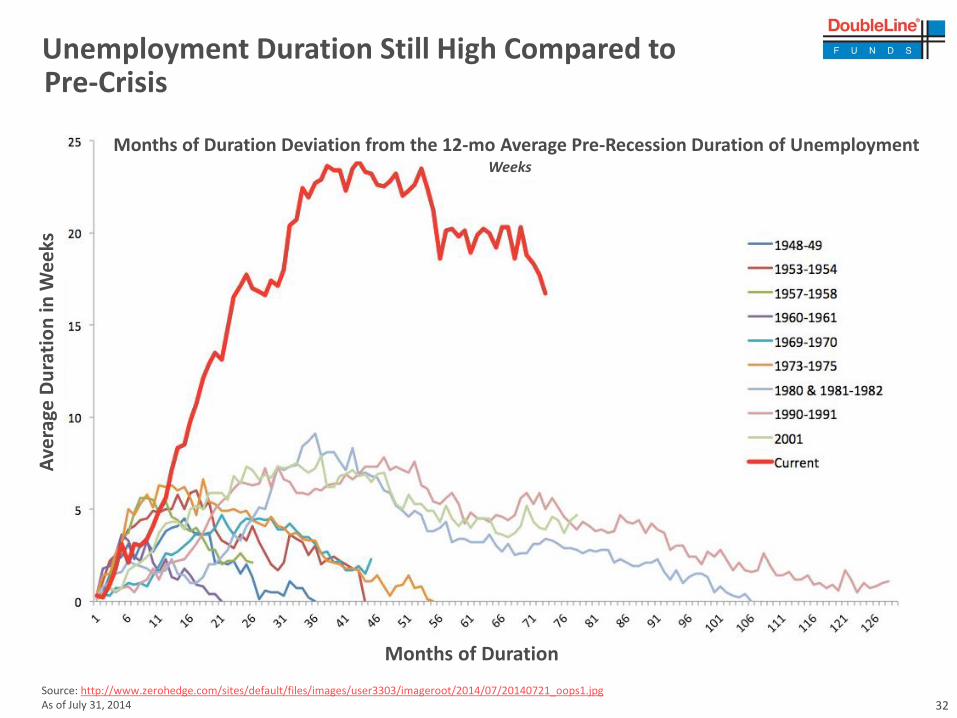
Unemployment Duration Still High Compared to Pre-Crisis
Source: http://www.zerohedge.com/sites/default/files/images/user3303/imageroot/2014/07/20140721_oops1.jpgAs of July 31, 2014
Months of Duration
Ave
rage
Du
rati
on
in W
ee
ks
Months of Duration Deviation from the 12-mo Average Pre-Recession Duration of UnemploymentWeeks
33
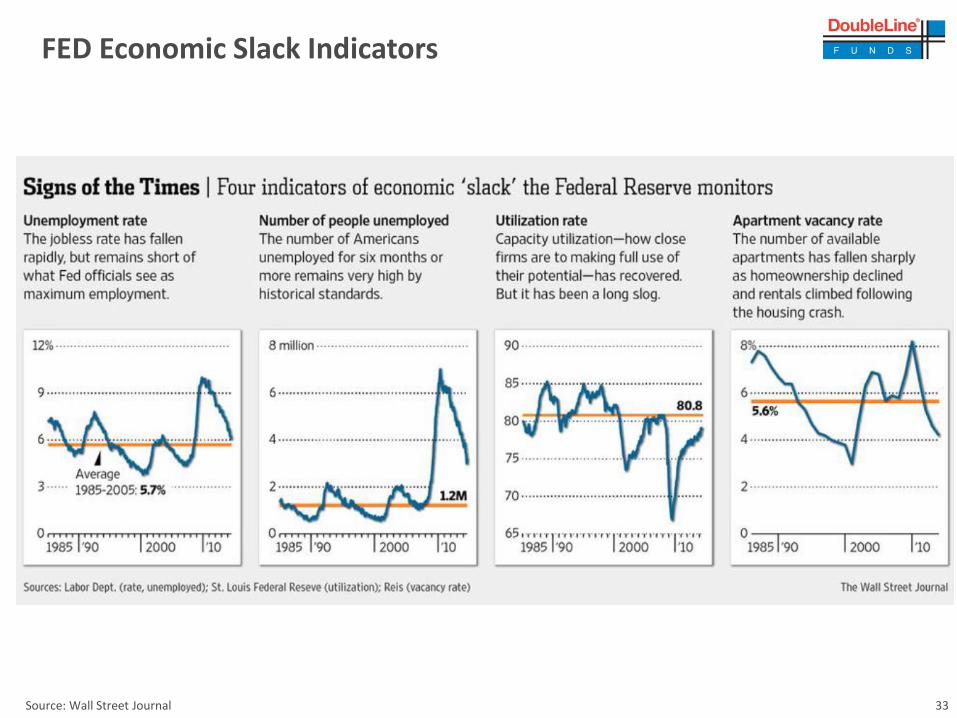
FED Economic Slack Indicators
Source: Wall Street Journal

34
Goldman Sachs MAP Economic Surprise Index vs.
Citigroup Surprise Index: U.S.
Source: BloombergCESIUSD = Citigroup Surprise Index which measures data surprises relative to market expectations. A positive reading means that data released have been stronger than expected. GSERMUS = Goldman Sachs Surprise Index summarizes the importance and strength of economic indicators. You cannot invest directly in an index.

35
Inflation Expectations
Source: Bloomberg, DoubleLine
-1.5
-1
-0.5
0
0.5
1
1.5
2
2.5
3
3.5
4
Pe
rce
nt
(%)
4/2
6/2
007
-8
/25
/201
4
Federal Reserve 5 Year Inflation Expectation
Five Year Five Years Forward
5 Year Breakevens
10 Year Breakevens

36
U.S. Inflation Driven by Shelter Costs
0%
10%
20%
30%
40%
50%
60%
70%
80%
90%
100%
(%)
Contribution to Headline CPI YoYas of July 2014
Source: BLS; DoublelineCPI YoY = Year-over-year measure A measure that examines the weighted average of prices of a basket of consumer goods and services, such as transportation, food and medical care.

37
What Happened to 10-year U.S. Treasury Rates During the 2004-2006 Rate Hike Cycle? August 1, 2003 through September 30, 2007
Source: Bloomberg; DoublelineUSGG10YR Index = Generic 10 year US Treasury yields. Federal Funds Target Rates = federal funds rate is "the interest rate"[1] at which depository institutions actively trade balances held at the Federal Reserve, called federal funds, with each other, usually overnight, on an uncollateralized basis. You cannot invest directly in an index.

38
U.S. Interest Rates:U.S. Treasury 2-year vs. 10-year SpreadSeptember 30, 2004 through September 3, 2014
Source: Bloomberg; DoublelineUSGG10YR Index = Generic 10 year US Treasury yields. You cannot invest directly in an index.

39
What Happened to 10-year U.S. Treasury Rates During the 2004-2006 hiking cycle?
-1.5
-1
-0.5
0
0.5
1
-39
1
-37
3
-35
5
-33
7
-31
9
-30
1
-28
3
-265
-24
7
-22
9
-21
1
-19
3
-17
5
-15
7
-13
9
-12
1
-10
3
-85
-67
-49
-31
-13 5
23 41 59 77 95
113
131
149
167
185
203
221
239
257
275
293
311
329
347
365
383
10
y U
ST Y
ield
(N
orm
aliz
ed
to
20
3 t
rad
ing
day
s b
efo
re in
itia
l Fed
hik
e)
10y UST Yield 2004
10y UST Yield 2014
Trading days leading up to initial Fed Hike*assumes Fed begins hiking in June 17th 2015
Fed begins 2004-2006 hiking cycle on June 30th 2004
We are currently here (assuming a hike at June 17th 2015 FOMC meeting)
Source: Bloomberg; Doubleline. January 1, 2004 through December 31, 2006. Year-to-Date 2014 through September 3, 2014.FOMC = Federal Open Market Committee, UST = U.S. TreasuryUSGG10YR Index = Generic 10 year US Treasury yields. Federal Funds Target Rates = federal funds rate is "the interest rate"[1] at which depository institutions actively trade balances held at the Federal Reserve, called federal funds, with each other, usually overnight, on an uncollateralized basis. You cannot invest directly in an index.
40
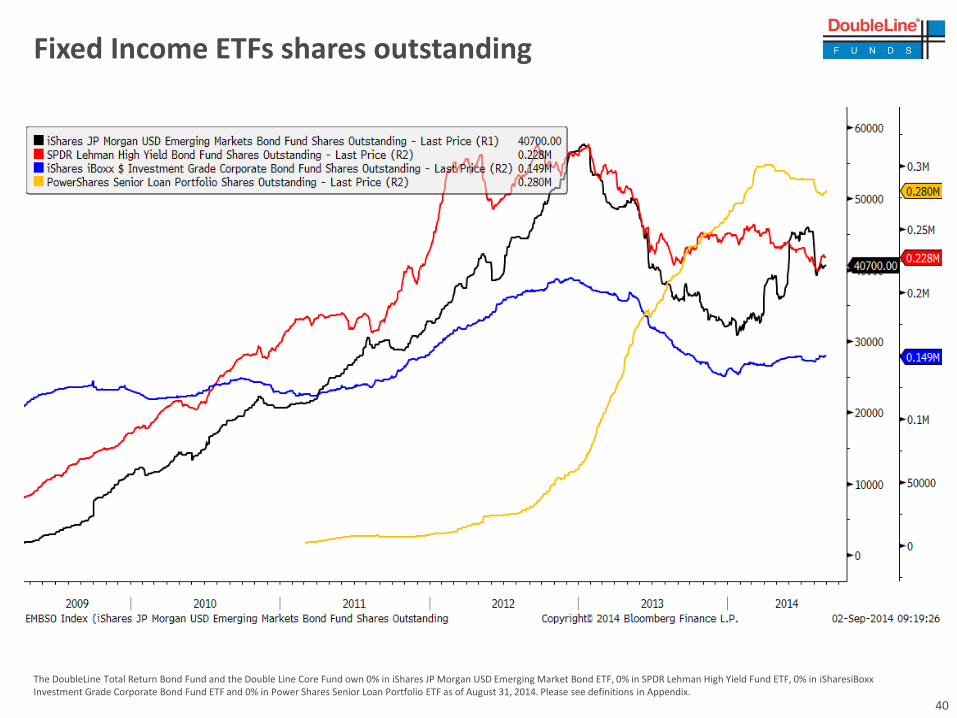
Fixed Income ETFs shares outstanding
The DoubleLine Total Return Bond Fund and the Double Line Core Fund own 0% in iShares JP Morgan USD Emerging Market Bond ETF, 0% in SPDR Lehman High Yield Fund ETF, 0% in iSharesiBoxxInvestment Grade Corporate Bond Fund ETF and 0% in Power Shares Senior Loan Portfolio ETF as of August 31, 2014. Please see definitions in Appendix.

41
Bond and Equity Mutual Fund FlowsAs of August 27, 2014
Source: Bloomberg; Doubleline
-300,000
-200,000
-100,000
0
100,000
200,000
300,000
400,000
500,000
600,000
700,000
2007 2008 2009 2010 2011 2012 2013 2014
Cu
mu
lati
ve n
et
infl
ow
s b
y ye
ar (
$ m
illio
ns)
Bond and Equity Mutual Fund Flows Reversed in 2013
Equity mutual funds
Bond mutual funds

42
Ratio of S&P 500 Total Return vs. Barclays U.S. Aggregate Index
0.5
0.7
0.9
1.1
1.3
1.5
1.7
1.9
2.1
2.3
2.5
Re
lati
ve P
erf
orm
ance
of
S&P
50
0 v
s. B
arcl
ays
Agg
.
S&P 500 vs. Barclays US Aggregate Bond TR Index*based on 10y statistics S&P 500 vs. Barclays Agg.
Simple 10y Mov. Avg.
"+/- 1 StDev"
"+/- 2 StDev"
Source: DoubleLine. StDev = Standard Deviation; Mov. Avg. = Moving AverageStocks = S&P 500 Index. Bonds = Barclays U.S. Aggregate Bond Index. Please see definition for these and standard deviation in the Appendix. You cannot invest directly in an index.
43
0
5
10
15
20
25
HY YTW
SPX EY
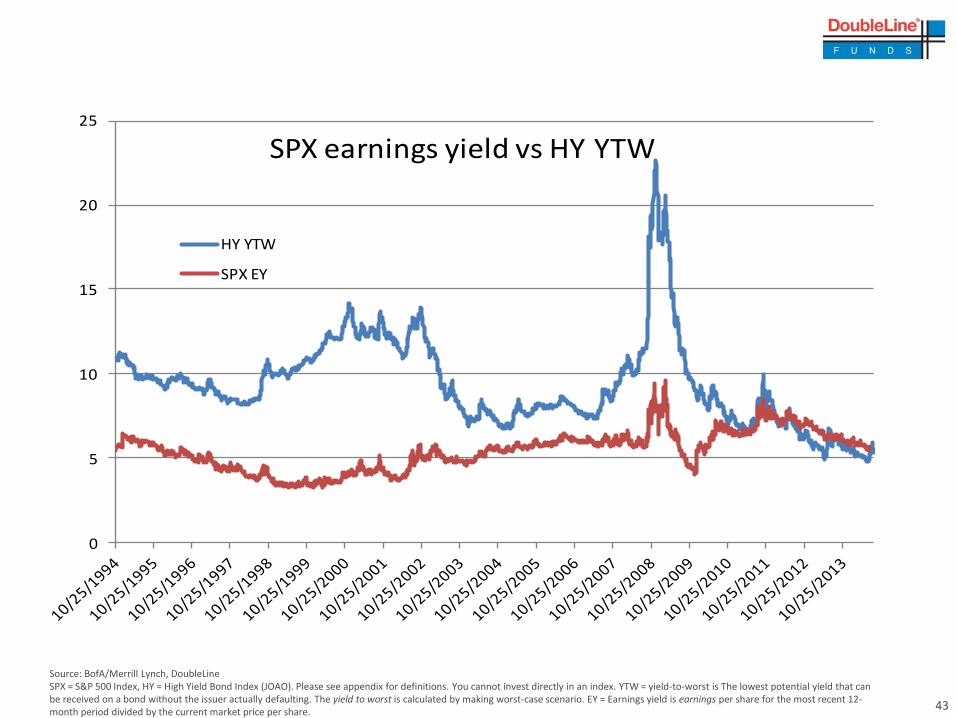
SPX earnings yield vs HY YTW
Source: BofA/Merrill Lynch, DoubleLineSPX = S&P 500 Index, HY = High Yield Bond Index (JOAO). Please see appendix for definitions. You cannot invest directly in an index. YTW = yield-to-worst is The lowest potential yield that can be received on a bond without the issuer actually defaulting. The yield to worst is calculated by making worst-case scenario. EY = Earnings yield is earnings per share for the most recent 12-month period divided by the current market price per share.

44
M&A Activity 2nd Highest Since 2000 (in nominal terms) Year-to-Date 2014
Source: Doubleline; BloombergM& A = Mergers and Acquisitions. Wilshire 5000 Index is a price appreciation index where dividends are not reinvested. It measures the performance of all U.S. head-quartered equity securities with available price data. You cannot invest directly in an index.
1,159
580
369290
678786
1,069
1,667
936
399531
791
548628
1,271
$0
$200
$400
$600
$800
$1,000
$1,200
$1,400
$1,600
$1,800
2000 2001 2002 2003 2004 2005 2006 2007 2008 2009 2010 2011 2012 2013 2014
Tran
sact
ion
Val
ue
In B
illio
ns
M&A Activity in U.S. Jan-Aug
8.1%
5.5%
4.2%
3.0%
6.3% 6.5%
8.2%
11.3%
7.0%
3.8%4.8%
6.4%
3.7% 3.6%
6.0%
0.0%
2.0%
4.0%
6.0%
8.0%
10.0%
12.0%
2000 2001 2002 2003 2004 2005 2006 2007 2008 2009 2010 2011 2012 2013 2014
% o
f To
tal M
arke
t C
ap
(as
me
asu
red
by
Wils
hir
e 5
00
0)
M&A Activity in U.S. Jan-Aug

45
Corporate Bond Issuance
$0.4 $0.3
$0.5 $0.5
$0.5 $0.5 $0.5
$0.7
$0.8
$0.7
$0.9
$0.7
$0.9 $0.9 $1.0 $1.0
$0.0
$0.2
$0.4
$0.6
$0.8
$1.0
$1.2
Jan - Sept 3rd Corporate Bond Issuance (Transaction Value Trillions $)
$38.7
$50.0 $54.4
$44.4 $38.6
$65.7 $74.1
$85.6
$98.0
$32.8
$78.9
$105.5
$58.4
$99.8
$69.8
$57.5
$0
$20
$40
$60
$80
$100
$120
August Corporate Bond Issuance (Transaction Value Billions $)
Source: Doubleline; Bloomberg
January 1, 1999 through August 31, 2014 January 1, 1999 through September 3, 2014

46
0.80
0.90
1.00
1.10
1.20
1.30
1.40
Re
lati
ve G
row
th R
ate
(D
ece
mb
er
31
, 19
85
-A
ugu
st 2
8, 2
01
4)
Trend 1 Sigma Relative to Trend 2 Sigmas Relative to Trend Corporate/Treasury
Relative Growth of Merrill Corporate Index to
Merrill Treasury Index
Data Source: Merrill Lynch (C0A0; G0Q0) Please see definitions in the Appendix. Monthly data with most recent observation appended. You cannot invest directly in an index.Standard deviation = A measure of the dispersion of a set of data from its mean. The more spread apart the data, the higher the deviation. Sigma = Mathematical sum.

47
Relative Growth of Merrill High Yield Cash Pay Index to
0.50
0.60
0.70
0.80
0.90
1.00
1.10
1.20
1.30
Re
lati
ve G
row
th R
ate
(D
ece
mb
er
31
, 19
85
-A
ugu
st 2
8, 2
01
4)
Trend 1 Sigma Relative to Trend 2 Sigmas Relative to Trend High Yield/15+yr Treasury
Data Source: Merrill Lynch (J0A0; G802) Please see definitions in the Appendix. Monthly data with most recent observation appended. You cannot invest directly in an index.Standard deviation = A measure of the dispersion of a set of data from its mean. The more spread apart the data, the higher the deviation. Sigma = Mathematical sum.

48
0.90
0.95
1.00
1.05
1.10
1.15
Re
lati
ve G
row
th R
ate
(D
ece
mb
er
31
, 19
85
-A
ugu
st 2
8, 2
01
4)
Trend 1 Sigma Relative to Trend 2 Sigmas Relative to Trend Mortgage/Treasury
Relative Growth of Merrill Mortgage Index to
Data Source: Merrill Lynch (M0A0; GOQO) Please see definitions in the Appendix. Monthly data with most recent observation appended. You cannot invest directly in an index.Standard deviation = A measure of the dispersion of a set of data from its mean. The more spread apart the data, the higher the deviation. Sigma = Mathematical sum.

49
0.00
0.50
1.00
1.50
2.00
2.50
3.00
3.50
4.00
Re
lati
ve G
row
th R
ate
(D
ece
mb
er
31
, 19
91
-A
ugu
st 2
8, 2
01
4)
Trend 1 Sigma Relative to Trend 2 Sigmas Relative to Trend Emerging Market/Treasury
Relative Growth of Merrill Emerging Market Index to
Data Source: Merrill Lynch (IGOV; GOQO) Please see definitions in the Appendix. Monthly data with most recent observation appended. You cannot invest directly in an index.Standard deviation = A measure of the dispersion of a set of data from its mean. The more spread apart the data, the higher the deviation. Sigma = Mathematical sum.

50
Housing and Mortgage-Backed Security Market Trends
TAB II

51
New Home Sales – Last Ten Years
Source: Bloomberg Financial ServicesNHSLTOT Index = U.S. New One family houses sold annually. The index tracks sales of newly constructed homes during the reference period.An investment cannot be made in an index directly.

52
Home Prices Have Risen While Home Ownership Has DeclinedJune 1, 1992 through June 30, 2014

53
Home Ownership Rate Back to Long-Term Average

54
Institutions Are Buying Distressed and Low-End Properties vs. High End Cash SalesAs of August 19, 2014
Source: http://www.realtytrac.com/content/foreclosure-market-report/q2-2014-us-institutional-investor-and-cash-sales-report-8126

55
Source: Bloomberg Financial Services MBAVREFI = Mortgage Refinancing Index as measured by the Mortgage Bankers Association reflects the number of applications for refinance. Not all applications are accepted.An investment cannot be made directly in an index.
Mortgage Refinancing Index

56
Non-Agency Residential Mortgage-Backed Securities(RMBS) 60++ Delinquency RateJanuary 1, 2005 through July 31, 2014
Serious Delinquencies is defined by mortgages that are 60++ delinquency rates defined as loans 60 or 90 days late in mortgage payments, or already in foreclosure or REO status.Prime defined as FICO > 725 and LTV < 75Alt-A defined as FICO 675-725; or FICO > 725 and LTV >= 75Subprime defined as FICO < 675Source: Loan Performance, Vichara, DoubleLine Capital
8.7%
18.9%
33.4%
0%
10%
20%
30%
40%
50%
60%
60
++ S
erio
us
Del
inq
uen
cies
Jan
uar
y 1
, 20
05
th
rou
gh J
uly
31
, 20
14
Prime
Alt-A
Subprime

57
Non-Agency RMBS Conditional Default Rate
RMBS = Residential Mortgage-Backed SecuritiesSerious Delinquencies is defined by mortgages that are 60++ delinquency rates defined as loans 60 or 90 days late in mortgage payments, or already in foreclosure or REO status.Prime defined as FICO > 725 and LTV < 75Alt-A defined as FICO 675-725; or FICO > 725 and LTV >= 75Subprime defined as FICO < 675Source: Loan Performance, Vichara, DoubleLine Capital
2.3%
4.5%
6.3%
0%
2%
4%
6%
8%
10%
12%
14%
16%
18%
CD
RJa
nu
ary
1, 2
00
5 t
hro
ugh
Ju
ly 3
1, 2
10
4
Prime
Alt-A
Subprime

58
Non-Agency RMBS Loss Severity
RMBS = Residential Mortgage-Backed SecuritiesSerious Delinquencies is defined by mortgages that are 60++ delinquency rates defined as loans 60 or 90 days late in mortgage payments, or already in foreclosure or REO status.Prime defined as FICO > 725 and LTV < 75Alt-A defined as FICO 675-725; or FICO > 725 and LTV >= 75Subprime defined as FICO < 675Source: Loan Performance, Vichara, DoubleLine Capital
42.2%
55.6%
67.3%
0%
10%
20%
30%
40%
50%
60%
70%
80%
90%
Loss
Se
veri
tyJa
nu
ary
1, 2
00
5 t
hro
ugh
Ju
ly 3
1, 2
01
4
Prime
Alt-A
Subprime

59
Non-Agency RMBS Conditional Repayment RateJanuary 31, 2005 through July 31, 2014
RMBS – Residential Mortgage-Backed Securities . CRR = Conditional Repayment Rate.Serious Delinquencies is defined by mortgages that are 60++ delinquency rates defined as loans 60 or 90 days late in mortgage payments, or already in foreclosure or REO status.Prime defined as FICO > 725 and LTV < 75Alt-A defined as FICO 675-725; or FICO > 725 and LTV >= 75Subprime defined as FICO < 675Source: Loan Performance, Vichara, DoubleLine Capital
13.0%
8.5%
4.1%
0%
5%
10%
15%
20%
25%
30%
35%
40%
45%
CR
RJa
nu
ary
1, 2
00
5 t
hro
ugh
Ju
ly 3
1, 2
01
4
Prime
Alt-A
Subprime

60
DoubleLine Funds Overview
TAB III

61
DBLTX Duration vs. 10 Year U.S. Treasury Yield
Source: DoubleLine, Bloomberg
0.0
0.5
1.0
1.5
2.0
2.5
3.0
3.5
4.0
4.5
0.0
0.5
1.0
1.5
2.0
2.5
3.0
3.5
4.04/
1/20
10
6/1/
2010
8/1/
2010
10/1
/201
0
12/1
/201
0
2/1/
2011
4/1/
2011
6/1/
201
1
8/1/
2011
10/1
/201
1
12/1
/201
1
2/1/
2012
4/1/
2012
6/1/
2012
8/1/
2012
10/1
/201
2
12/1
/201
2
2/1/
2013
4/1/
2013
6/1/
2013
8/1/
2013
10/1
/201
3
12/1
/201
3
2/1/
2014
4/1/
2014
6/1/
2014
Fun
d D
uratio
nTre
asu
ry Y
ield
10-yr Treasury Yield (%) DBLTX duration (years)

62
Duration: DBLTX vs. Barclays U.S. Aggregate Index
Source: DoubleLine, Barclays
0.0
1.0
2.0
3.0
4.0
5.0
6.0
Du
rati
on
DBLTX duration (years) Barclays Agg duration (years)

63
DBLFX Duration vs. 10 Year U.S. Treasury Yield
Source: DoubleLine, Bloomberg
0.0
1.0
2.0
3.0
4.0
5.0
6.0
0.0
0.5
1.0
1.5
2.0
2.5
3.0
3.5
4.0
4/1/
2010
6/1/
2010
8/1/
2010
10/1
/201
0
12/1
/201
0
2/1/
2011
4/1/
2011
6/1/
2011
8/1/
2011
10/1
/201
1
12/1
/201
1
2/1/
2012
4/1/
2012
6/1/
2012
8/1/
2012
10/1
/201
2
12/1
/201
2
2/1/
2013
4/1/
2013
6/1/
2013
8/1/
2013
10/1
/201
3
12/1
/201
3
2/1/
2014
4/1/
2014
6/1/
201
4
Fun
d D
uratio
nTre
asu
ry Y
ield
10-yr Treasury Yield (%) DBLFX duration (years)

64
Duration: DBLFX vs. Barclays U.S. Aggregate Index
Source: DoubleLine
0.0
1.0
2.0
3.0
4.0
5.0
6.0
4/1
/20
10
6/1
/20
10
8/1
/20
10
10
/1/2
01
0
12
/1/2
01
0
2/1
/20
11
4/1
/20
11
6/1
/20
11
8/1
/20
11
10
/1/2
01
1
12
/1/2
01
1
2/1
/20
12
4/1
/20
12
6/1
/20
12
8/1
/20
12
10
/1/2
01
2
12
/1/2
01
2
2/1
/20
13
4/1
/20
13
6/1
/20
13
8/1
/20
13
10
/1/2
01
3
12
/1/2
01
3
2/1
/20
14
4/1
/20
14
6/1
/20
14
DBLFX duration (years) Barclays Agg duration (years)

65
Portfolio statistics as of August 31, 2014 based on market weighted averages. Subject to change without notice.
Average price = A measure of the weighted average price paid for the securities calculated by taking the prices and dividing by the number of securities and does not include cash. Average price should not be confused with net asset value.Average Duration = Duration is used as a risk measure. It measures the price volatility of a security given a change in interest rate movements.Average Life = The average number of years that each dollar of unpaid principal due on the mortgage remains outstanding. Average life is computed as the weighted average time to the receipt of all future cash flows, using as the weights the dollar amounts of the principal paydowns.
Source: DoubleLine Capital LP
Total Return Bond Fund Portfolio Statistics
Total Return Bond Fund
Barclays Capital U.S. Aggregate Index
Average Price $97.41 $104.95
Duration 3.41 5.62
Average Life 5.19 7.74

66
Portfolio composition as of August 31, 2014. Subject to change without notice.Source: DoubleLine Capital LP. Sector allocations are subject to change and should not be considered a recommendation to buy or sell any security.
Cash = The value of assets that can be converted into cash immediately. Can include marketable securities, such as government bonds, banker's acceptances, cash equivalents on balance sheets that may include securities that mature within 90 days.Government – U.S. treasury securities.Agency = Mortgage securities whose principal and interest guaranteed by the U.S. Government agency including Fannie Mae (FNMA) or Freddie Mac (FHLMC).Non-Agency = Residential Mortgages Bond Securities are a type of bond backed by residential mortgages. Non-Agency means they were issued by a private issuer.CMBS = Commercial Mortgage-Backed Securities. Securitized loans made on commercial rather than residential property.CLO = Collateralized Mortgage Obligations
Total Return Bond Fund Portfolio Composition –
Cash11.3%
Government5.7%
Agency46.5%
Non Agency 26.8%
CMBS6.2%
CLO3.1%
Other0.4%

67
Portfolio composition as of August 31, 2014. Subject to change without notice.Source: DoubleLine Capital LP. Sector allocations are subject to change and should not be considered a recommendation to buy or sell any security.
Cash = The value of assets that can be converted into cash immediately. Can include marketable securities, such as government bonds, banker's acceptances, cash equivalents on balance sheets that may include securities that mature within 90 days.Pass-Through = Mortgage pass-through securities whose principal and interest guaranteed by the U.S. Government agency including Fannie Mae (FNMA) or Freddie Mac (FHLMC) or non-agency private issue with no government guarantee.CMO Current = Collateralized Mortgage Obligation (CMO) is a financial debt vehicle/special purpose entity called a “pool”. Investors buy bonds issued by the entity and receive payments according to a defined set of rules. The mortgages themselves are the collateral, the bonds are the tranches (also called classes), and the set of rules that dictates how money is received from the collateral will be distributed is called the structure. The legal entity, collateral and structure are collectively referred to as the deal.IO = Interest Only mortgage pools in which the borrower’s monthly payment is only toward the interest on the loan. A non-amortized loan.Inverse Floater = A mortgage pool that has a yield that is inversely related to interest rates.IO Current pay = Loans that are currently receiving principal payments.Locked Out/ CMO Locked Out = Loans that for a set period of time will not receive principal payments.
Total Return Bond Fund Portfolio Composition –By Agency Collateralize Mortgage Obligation (CMO) Security Type
Cash11.3%
Inverse Floater1.3%
Pass-Through27.0%
CMO Current8.4%
CMO Locked8.9%
IO Current0.9%
Agency CMO Composition
Cash 11.3%
Inverse Floater 1.3%
Pass-Through 27.0%
CMO Current 8.4%
CMO Locked 8.9%
IO Current 0.9%
IO Locked 0.0%
Subtotal 57.8%

68
Portfolio composition and credit ratings as of security origination. Portfolio composition is subject to change without notice. There are some non-rated securities in the Fund as shown in the graph above. Credit distribution is determined from the highest available credit rating from any Nationally Recognized Statistical Rating Organization (S&P, Moody’s, and Fitch).
Investment Grade = Securities rated AAA to BBB- are considered to be investment grade. A bond is considered investment grade if its credit rating is BBB- or higher by Standard & Poor’s or Baa3 by Moody’s. Ratings based on corporate bond model. The higher the rating, the more likely the bond is to pay back at par/$100 cents on the dollar. AAA is considered the highest quality and the lowest degree of risk. They are considered to be extremely stable and dependable.Below Investment Grade = Also known as “junk bond” is a security rated below investment grade having a rating of BBB- or below. These bonds are seen as having higher default risk or other adverse credit events, but typically pay higher yields than better quality bonds in order to make them attractive. They are less likely to pay back at par/$100 cents on the dollar.NR = Not Rated . Securities that are not rated by the three rating agencies.Credit quality may be assessed by different agencies for different bonds for reasons beyond the control of the Fund. Source: DoubleLine Capital LP as of August 31, 2014.
Total Return Bond Fund Portfolio –Non-Agency Residential Mortgage-Backed Securities (RMBS) Breakdown By Original Rating
AAA22.83%
AA0.12%
A0.09%
BBB0.54%
NR3.24%
69
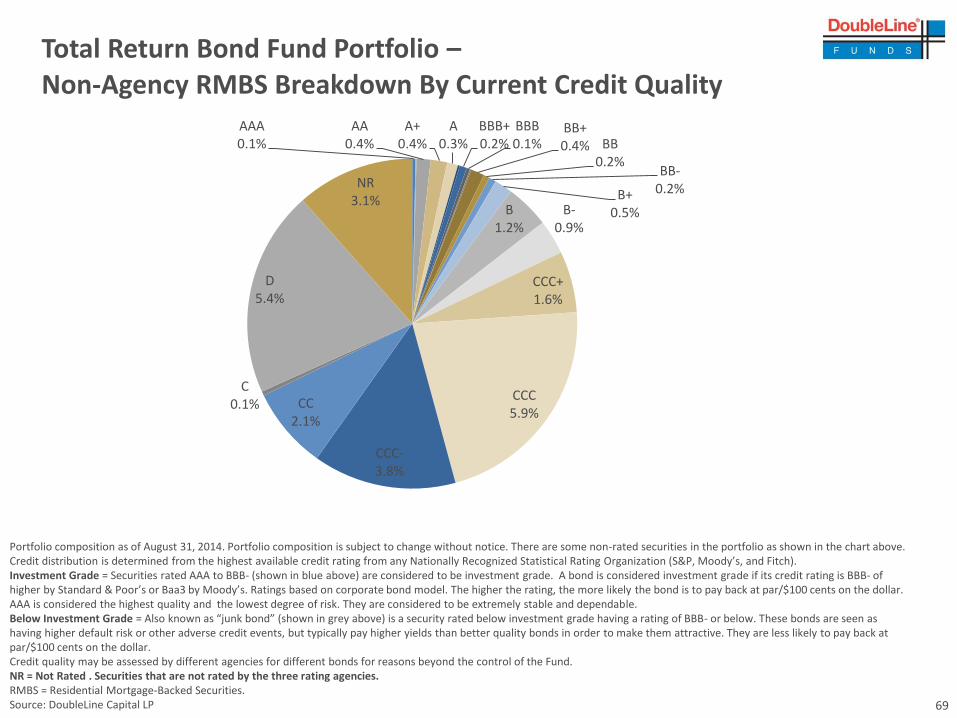
Total Return Bond Fund Portfolio –Non-Agency RMBS Breakdown By Current Credit Quality
Portfolio composition as of August 31, 2014. Portfolio composition is subject to change without notice. There are some non-rated securities in the portfolio as shown in the chart above. Credit distribution is determined from the highest available credit rating from any Nationally Recognized Statistical Rating Organization (S&P, Moody’s, and Fitch).Investment Grade = Securities rated AAA to BBB- (shown in blue above) are considered to be investment grade. A bond is considered investment grade if its credit rating is BBB- of higher by Standard & Poor’s or Baa3 by Moody’s. Ratings based on corporate bond model. The higher the rating, the more likely the bond is to pay back at par/$100 cents on the dollar. AAA is considered the highest quality and the lowest degree of risk. They are considered to be extremely stable and dependable.Below Investment Grade = Also known as “junk bond” (shown in grey above) is a security rated below investment grade having a rating of BBB- or below. These bonds are seen as having higher default risk or other adverse credit events, but typically pay higher yields than better quality bonds in order to make them attractive. They are less likely to pay back at par/$100 cents on the dollar.Credit quality may be assessed by different agencies for different bonds for reasons beyond the control of the Fund. NR = Not Rated . Securities that are not rated by the three rating agencies.RMBS = Residential Mortgage-Backed Securities.Source: DoubleLine Capital LP
AAA0.1%
AA0.4%
A+0.4%
A0.3%
BBB+0.2%
BBB0.1%
BB+0.4% BB
0.2%BB-
0.2%B+0.5%B
1.2%B-
0.9%
CCC+1.6%
CCC5.9%
CCC-3.8%
CC2.1%
C0.1%
D5.4%
NR3.1%

70
Total Return Bond Fund Portfolio –
Non-Agency RMBS Breakdown By Price
Portfolio price composition as of August 31, 2014. Subject to change without notice. Source: DoubleLine Capital LP. Sector allocations are subject to change and should not be considered a recommendation to buy or sell any security.
Dollar Price
0.0%
1.0%
2.0%
3.0%
4.0%
5.0%
6.0%
7.0%
% o
f Fu
nd

71
Core Fixed Income Fund Portfolio Statistics
Portfolio statistics as of August 31, 2014 based on market weighted averages. Subject to change without notice.
Average price = A measure of the weighted average price paid for the securities calculated by taking the prices and dividing by the number of securities and does not include cash. Average price should not be confused with net asset value.Average Duration = Duration is used as a risk measure. It measures the price volatility of a security given a change in interest rate movements. Average Life = The average number of years that each dollar of unpaid principal due on the mortgage remains outstanding. Average life is computed as the weighted average time to the receipt of all future cash flows, using as the weights the dollar amounts of the principal paydowns.
Source: DoubleLine Capital LP
Core Fixed Income Fund
Barclays Capital U.S Aggregate Index
Average Price $101.69 $104.95
Duration 4.43 5.62
Average Life 6.63 7.74

72
Portfolio composition as of August 31, 2014. Subject to change without notice.Bank Loans = A debt financing obligation issued by a bank or similar financial institution to a company.Commercial Mortgage-Backed Securities (CMBS) = Commercial Mortgage-Backed Securities. Securitized loans made on commercial rather than residential property. Collateralized Loan Obligations (CLOs) = A form of securitization where payments from multiple middle sized and large business loans are pooled together and passed on to different classed of owners in various tranches Cash = Cash holding include the value of assets that can be converted into cash immediately. Can include marketable securities, such as government bonds, banker's acceptances, cash equivalents on balance sheets that may include securities that mature within 90 days.Government = Government debt (also known as public debt or national debt) is money (or credit) owed by any level of government; either central government, federal government, municipal government or local government. Mortgage-Backed Securities (MBS)= A mortgage-backed security (MBS) is an asset-backed security or debt obligation that represents a claim on the cash flows from mortgage loans, most commonly on residential propertyEmerging Markets Fixed Income = Emerging market debt (EMD) is a term used to encompass bonds issued by less developed countries.Investment Grade (IG) and High Yield Corporates (HY) = Investment grade and non-investment grade corporate credit. Bonds issued by corporations to raise money in order to expand itsbusiness. Credit distribution is determined from the highest available credit rating from any Nationally Recognized Statistical Rating Organization (S&P, Moody’s, and Fitch). A bond rated BBB or higher would be considered Investment Grade. Any bond rated BBB or below would be High Yield.Source: DoubleLine Capital LP. Sector allocations are subject to change and should not be considered a recommendation to buy or sell any security.
Cash5%
Govt17%
MBS30%
EM15%
IG Corporate11%
CMBS7%
Bank Loans5%
HY Corporate5%
CLO5%

73
Portfolio composition and credit ratings as of August 31, 2014. Portfolio composition is subject to change without notice. Credit distribution is determined from the highest available credit rating from any Nationally Recognized Statistical Rating Organization (S&P, Moody’s, and Fitch).
Cash = The value of assets that can be converted into cash immediately. Can include marketable securities, such as government bonds, banker's acceptances, cash equivalents on balance sheets that may include securities that mature within 90 days.Government = Government debt (also known as public debt or national debt) is money (or credit) owed by any level of government; either central government, federal government, municipal government or local government. Agency = Mortgage securities whose principal and interest are effectively guaranteed by the U.S. Government agency including Fannie Mae (FNMA) or Freddie-Mac (FHLMC).Investment Grade = A bond is considered investment grade if its credit rating is BBB- of higher by Standard & Poor’s or Baa3 by Moody’s. Ratings based on corporate bond model. The higher the rating, the more likely the bond is to pay back at par/$100 cents on the dollar.Below Investment Grade (Below IG)= Also known as “junk bond” is a security rated below investment grade. These bonds are seen as having higher default risk or other adverse credit events, but typically pay higher yields than better quality bonds in order to make them attractive. They are less likely to pay back at par/$100 cents on the dollar.Credit quality may be assessed by different agencies for different bonds for reasons beyond the control of the Fund. NR = Not Rated . Securities that are not rated by the three rating agencies.Source: DoubleLine Capital LP.
Core Fixed Income Fund Portfolio Credit Quality Breakdown
Cash5%
Govt17%
Agency17%
Investment Grade28%
Below IG31%
Unrated2%

Live Webcast hosted by:
Jeffrey Gundlach
Chief Executive Officer
September 9, 2014
“Fixed Income Playbook”

75
Index DescriptionsBarclays Capital US Aggregate Index - The Barclays Capital US Aggregate Index represents securities that are SEC-registered, taxable, and dollar denominated. The index covers the US investment grade fixed rate bond market, with index components for government and corporate securities, mortgage pass-through securities, and asset-backed securities. These major sectors are subdivided into more specific indices that are calculated and reported on a regular basis.Barclays Capital US Treasury Index - This index is the US Treasury component of the US Government index. Public obligations of the US Treasury with a remaining maturity of one year or more.Barclays Capital US Treasury 10 Year Index - This index is the 10 year component of the US Government index.Barclays Capital Capital US Treasury 30 Year Index - This index is the 30 year component of the US Government index.Barclays Capital US High Yield Index - The Barclays Capital US High Yield Index covers the universe of fixed rate, non-investment grade debt. Eurobonds and debt issuer from countries designated as emerging markets (e.g. Argentina, Brazil, Venezuela, etc.) are excluded, but Canadian and global bonds (SEC registered) of issuers in non-EMG countries are included. Original issue zereos, step-up coupon structures, 144-As and pay-in-kind (PIK, as of October 1, 2009) are also included. BofA Merrill Lynch US Government Index (GOAO) - The Merrill Lynch US Government Index tracks the performance of US government (i.e. securities in the Treasury and Agency indices.)BofA Merrill Lynch US 15+ Year Treasury Index “Long Treasuries” (G802)- This index is a subset of the BofA Merrill Lynch US Treasury Index including all securities with a remaining term of final maturity greater than 15 years..BofA Merrill Lynch US Corporate Index (COAO) “Investment Grade”- The Merrill Lynch Corporate Index tracks the performance of US dollar denominated investment grade corporate debt publicly issued in the US domestic market. Qualifying securities must have an investment grade rating (based on an average of Moody’s, S&P and Fitch) and an investment grade rated country of risk (based on an average of Moody’s, S&P and Fitch foreign currency long term sovereign debt ratings). Securities must have at least one year remaining term to final maturity, a fixed coupon schedule and a minimum amount outstanding of $250MM.BofA Merrill Lynch US All Convertibles Index (VOSO) - The Merrill Lynch All Convertible Index is a rule driven index. which includes all bonds and preferred stocks of U.S.-registered companies, which have $50 million or more in aggregate market value and are convertibles in U.S. dollar-denominated common stocks, ADRs or cash equivalents. Please note an investor cannot invest directly in an index.CRB Commodity Index (CRY)- An unweighted geometric average of some important commodities. It averages prices across 17 commodities and across time. The index tracks energy, grains, industrials, livestock, precious metals, and agriculturals.S&P 500 (SPX)- S&P 500 is a free-float capitalization-weighted index published since 1957 of the prices of 500 large-cap common stocks actively traded in the United States.Standard Deviation – Sigma = standard deviation. It shows how much variation there is from the “average” (mean, or expected/budgeted value). A low standard deviation indicated that the data point tend to be very close to the mean, whereas high standard deviation indicated that the date is spread out over a large range of values.Dow Jones – UBS DJ Commodity Index - The Dow Jones UBS – Commodity index is composed of commodities traded on U.S. exchanges, with the exception of aluminum, nickel and zinc, which trade on the London Metal Exchange (LME).“Copper”= Copper Spot Price (HGI) Copper is the world’s third most used metal behind iron and aluminum primarily used in highly cyclical industries including construction and industrial machinery manufacturing. Spot price quoted in USD/lb.“Gold”= Gold Spot Price (Golds) The Gold Spot price is quoted as US Dollar per Troy Ounce.Crude Oil= Crude oil varies greatly in appearance depending on its composition. West Texas intermediate (WTI )= Texas light sweet crude is used as a benchmark in oil pricing. It’s “light” because of the low density and sweet because of low sulfur. Brent crude = Is a major trading classification of sweet light crude. Brent is the oil maker also known as Brent Blend.Volatility Index (VIX) -The VIX shows the market's expectation of 30-day volatility. It is constructed using the implied volatilities of a wide range of S&P 500 index options. This volatility is meant to be forward looking and is calculated from both calls and puts. The VIX is a widely used measure of market risk and is often referred to as the "investor fear gauge".
getIndexA1U.S. AggrIWS?requBack to In

76
Index DescriptionsBofA Merrill Lynch US Dollar Emerging Markets Sovereign Plus Index (IGOV)This index tracks the performance of US dollar denominated emerging market and cross-over sovereign debt publicly issued in the eurobond or US domestic market. Qualifying countries must have a BB1 or lower foreign currency long-term sovereign debt rating (based on an average of Moody’s, S&P, and Fitch).BofA Merrill Lynch U.S. High Yield Cash Pay Index (J0A0) “Below Investment Grade”-The Merrill Lynch High Yield Index tracks the performance of US dollar denominated below investment grade corporate debt, currently in a coupon paying period, that is publicly issued in the US domestic market. Qualifying securities must have a below investment grade rating (based on an average of Moody’s, S&P and Firth foreign currency long term sovereign debt ratings). Must have one year remaining to final maturity and a minimum outstanding amount of $100MM.BofA Merrill Lynch International Government Index (NOGO)The Merrill Lynch International Index tracks the performance of Australia, Canadian, French, German, Japan, Dutch, Swiss and UK investment grade sovereign debt publicly issued and denominated in the issuer’s own domestic market and currency. Qualifying securities must have at least one year remaining term to final maturity, a fixed coupon schedule and a minimum amount outstanding.BofA Merrill Lynch Mortgage-Backed Securities Index (MOA0)This index tracks the performance of US dollar denominated fixed rate and hybrid residential mortgage pass-through securities publicly issued by US agencies in the US domestic market. 30-year, 20-year, 15-year and interest only fixed rate mortgage pools are included in the Index provided they have at least one year remaining term to final maturity and a minimum amount outstanding of at least $5 billion per generic coupon and $250MM per production year within each generic coupon.BofA Merrill Lynch U.S. Municipal Securities Index (UOA0)This index tracks the performance of US dollar denominated investment grade tax-exempt debt publicly issued by US states and territories, and their political subdivisions, in the US domestic market. Qualifying securities must have at least one year remaining term to final maturity, a fixed coupon schedule and an investment grade rating (based on Moody’s, S&P and Fitch). Minimum size vary based on the initial term to final maturity at time of issuance.Barclays Capital Global Emerging Markets Index - The Barclays Capital Global Emerging Markets Index represents the union of the USD-denominated US Emerging Markets index and the predominately EUR-denominated Pan Euro Emerging Markets Index, covering emerging markets in the following regions: Americas, Europe, Middle East, Africa, and Asia. As with other fixed income benchmarks provided by Barclays Capital, the index is rules-based, which allows for an unbiased view of the marketplace and easy replicability.JP Morgan Investment Grade Corporate Index - JP Morgan Investment Grade Corporate Index includes performance of US dollar denominated investment grade corporate debt publicly issued in the US domestic market. Qualifying securities must have an investment grade rating (based on an average of Moody’s, S&P and Fitch) and an investment grade rated country of risk (based on an average of Moody’s, S&P and Fitch foreign currency long term sovereign debt ratings). Securities must have at least one year remaining term to final maturity, a fixed coupon schedule and a minimum amount outstanding of $250MM.Draw Down - The peak-to-trough decline during a specific record period of an investment, fund or commodity. A drawdown is usually quoted as the percentage between the peak and the trough. NAV – A mutual fund's price per share or exchange-traded fund's (ETF) per-share value. In both cases, the per-share dollar amount of the fund is calculated by dividing the total value of all the securities in its portfolio, less any liabilities, by the number of fund shares outstanding. CMO – A type of mortgage-backed security that creates separate pools of pass-through rates for different classes of bondholders with varying maturities, called tranches. The repayments from the pool of pass-through securities are used to retire the bonds in the order specified by the bonds' prospectusTIPS– Treasury Inflation Protection. A treasury security that is indexed to inflation in order to protect investors from the negative effects of inflation. TIPS are considered an extremely low-risk investment since they are backed by the U.S. government and since their par value rises with inflation, as measured by the Consumer Price Index, while their interest rate remains fixed.CPI– Consumer Price Index. A measure that examines the weighted average of prices of a basket of consumer goods and services, such as transportation, food and medical care.Cash Flow – Cash flow measures the cash generating capability of a company by adding non-cash charges (e.g. depreciation) and interest expense to pretax income.
77
Index DescriptionsBofA/Merrill Lynch High Yield Cash Pay CCC –rated Index (JOA3) – .A component of the BofA/Merrill Lynch High Yield Cash Pay Index concentrating on CCC rated High Yield credit only. BofA/Merrill Lynch High Yield Cash Pay BB–rated Index (JOA1) – .A component of the BofA/Merrill Lynch High Yield Cash Pay Index concentrating on BB rated High Yield credit only.BofA/Merrill Lynch High Yield Cash Pay B–rated Index (JOA2) – .A component of the BofA/Merrill Lynch High Yield Cash Pay Index concentrating on B rated High Yield credit only.BofA/Merrill Lynch Credit Index BBB-rated Index (COA4) – .A component of the BofA/Merrill Lynch Credit Index concentrating on the lower rated BBB investment grade credits.BofA/Merrill Lynch Credit Index A–rated Index (COA3) – . A component of the BofA/Merrill Lynch Credit Index concentrating on the A rated investment grade credits.BofA/Merrill Lynch Credit Index AAA –rated Index (COA1) – . A component of the BofA/Merrill Lynch Credit Index concentrating on the highest rated AAA investment grade credits.BofA Merrill Lynch US Treasury Index (G0Q0) -The Merrill Lynch US Treasury Index tracks the performance of US dollar denominated sovereign debt publicly issued by the US government in its domestic market. Qualifying securities must have at least one year remaining term to final maturity, a fixed coupon schedule and a minimum amount outstanding of $1 billion.BofA Merrill Lynch US 10-15 Year Treasury Index “Long Treasury”-The Merrill Lynch US 10-15 Treasury Index tracks the performance of US dollar denominated 10-15 year sovereign debt publicly issued by the US government in its domestic market. It is a subset of the BofA Merrill Lynch U.S. Treasury Index (GOQO).BofA Merrill Lynch Municipal Index-The Merrill Lynch Municipal BofA Merrill Lynch Current 10 year UST Index –- This index is the 10 year component of the US Government index.BofA Merrill Lynch Current 30 year UST Index –- This index is the 30 year component of the US Government index.JPMorgan Corporate EMBI Broad Diversified Index (JBCDCOMP) – This index tracks the performance of investment grade corporate debt publically issued across a range of emerging market countries.Shanghai Index - The Shanghai Stock Exchange Composite is a capitalization-weighted index tracking daily price performance of all A and B-shares listed on the Shanghai Stock Exchange. This index was developed December 19, 1990 with a base value of 100.S&P/Case-Shiller Composite Home Price Index - The Case-Shiller Home Price Indices, one comprised of price changes within all 20 metropolitan markets, and another comprised of price changes within the following subset of 10 metropolitan markets: Boston, Chicago, Denver, Las Vegas, Los Angeles, Miami, New York, San Diego, San Francisco and Washington DC. In addition to those 10 markets, the 20-Home Price index reflects price changes for Atlanta, Charlotte, Dallas, Detroit, Minneapolis, Phoenix, Portland, Seattle and Tampa.NASDAQ- A computerized system that facilitates trading and provides price quotations on more than 5,000 of the more actively traded over the counter stocks. Created in 1971, the Nasdaq was the world's first electronic stock market.Transports- The Industrials Sector includes companies whose businesses are dominated by one of the following activities: The manufacture and distribution of capital goods, including aerospace & defense, construction, engineering & building products, electrical equipment and industrial machineryUtilities- A public utility is a business that furnishes an everyday necessity to the public at large. Public utilities provide water, electricity, natural gas, telephone service, and other essentials. Utilities may be publicly or privately owned, but most are operated as private businesses.Basis Point- A basis point is a unit that is equal to 1/100th of 1%, and is used to denote the change in a financial instrument.REIT- Real Estate Trust. A security that sells like a stock on the major exchanges and invests in real estate directly, either through properties or mortgagesDuration – Duration is a commonly used measure of the potential volatility of the price of a debt security, or the aggregate market value of a portfolio of debt securities, prior to maturity. Securities with a longer duration generally have more volatile prices than securities of comparable quality with a shorter duration.
getIndexA1U.S. AggrIWS?requBack to In

78
Index DescriptionsBofA/Merrill Lynch Inflation Linked Index (G0Q1) – The BofA Merrill Lynch US Inflation-Linked Treasury Index tracks the performance of US dollar denominated inflation linked sovereign debt publicly issued by the US government in its domestic market. Citigroup TIPS (SBUSILSI)– . It measures the returns of the inflation-linked bonds with fixed-rate coupon payments that are linked to an inflation index. The price of each issue in the USLSI is adjusted by using an index ratio. The index ratio is determined by dividing the current inflation index level by the inflation index level at the time of issue of the security. The inflation index is published on a monthly basis, and the intra-month index ratio is calculated using linear interpolation.Barclays Capital CMBS Index – tracks the performance of US dollar-denominated securitized commercial mortgage-backed securities.Russell 2000 – measures the performance of the small-cap segment of the US equity universe. Russell 2000 is a subset of the Russell 3000 index representing approximately 10% of the total market capitalization of that index.S&P GSCI – is a composite index of commodity sector return representing an unleveraged, long-only investment in commodity futures that is broadly diversified across the spectrum of commodities. S&P GSCI Agriculture – is a composite index of agriculture commodity futures unleveraged, long-only investment.Barclays Capital US 30 Year TIPS Index - . Barclays Capital 30-year TIPS on-the-run index quoted in US Dollars traded intradayCitigroup Economic Surprise Index - . The Citigroup Economic Surprise Indices are objective and quantitative measures of economic news. They are defined as weighted historical standard deviations of data surprises (actual releases vs Bloomberg survey median). A positive reading of the Economic Surprise Index suggests that economic releases have on balance beating consensus. The indices are calculated daily in a rolling three-month window. The weights of economic indicators are derived from relative high-frequency spot FX impacts of 1 standard deviation data surprises. The indices also employ a time decay function to replicate the limited memory of markets.DAX - This index is the German Stock Index is a total return index of 30 selected German blue chip stocks traded on the Frankfurt Stock Exchange.CAC 40 – This index the most widely-used indicator of the Paris market, reflects the performance of the 40 largest equities listed in France, measured by free-float market capitalization and liquidity.FTSE 100 – Is a capitalization-weighted index of the 100 most highly capitalized companies traded on the London Stock Exchange.Mexico IPC – The Mexican IPC index is a capitalization weighted index of the leading stocks traded on the Mexican Stock Exchange.Hang Seng – The Hang Seng China Enterprises Index is a freefloat capitalization-weighted index comprised of H-shares listed on the Hong Kong Stock Exchange and included in the Hang Seng Mainland Composite Index.KOSPI - This index is a capitalized-weighted index of all common shares on the Korean Stock Exchanges.Nikkei 225 – The Nikkei-225 Stock average is a price-weighted average of 225 top-rated Japanese companies listed in the First Section of the Tokyo Stock Exchange.Australia AORD – S&P/ASX All Ordinaries represents 500 largest companies in the Australian equities market. Index constitutes are drawn from eligible companies listed on the Australian Stock Exchange.Brazil Bovespa Index (IBOV) -The Bovespa Index is a gross return index weighted by traded volume and is comprised of the most liquid stocks traded on the SaoPaulo Stock Exchange. The Bovespa Index has been divided 10 times by a factor of 10 since January 1, 1985.Shanghai Index (SHCOMP) -The Shanghai Stock Exchange Composite Index is a capitalization-weighted index. The index tracks the daily performance of all A-shares and B-shares listed on the Shanghai Stock Exchange. The index was developed on December 19,1990 with a base value of 100.BSE India Sensitive Index (Sensex) -The Sensex is a cap-weighted index. The selection of the index members has been made on the basis of liquidity, depth and floating-stock-adjustment depth and industry representation.S&P LSTA Lev Loan Index (Bank Loans)- Created by the Leveraged Commentary & Data (LCD) team at S&P Capital IQ, the review provides an overview and outlook of the leveraged loan market as well as an expansive review of the S&P Leveraged Loan Index and sub-indexes. The review consists of index general characteristics, results, risk-return profile, default/distress statistics, and repayment analysis. It is not possible to invest directly in an index.Citigroup 3 Month T-Bill (SBMMTB3) – 3 Month US T-Bill in US dollars.

79
Index Descriptions
iShares JPM USD Emerging Markets Bnd ETF – JP Morgan USD Emerging Markets Bond ETF in an exchange traded fund incorporated in the USA. It seeks investment results that correspond to the price and yield of the JP Morgan Emerging Markets Bond Index.SPDR Lehman High Yield Bond Fund ETF (JNK) – Is an exchange-traded fund incorporated in the USA seeking to investment results that correspond to the price and yield of the Barlcays High Yield Very Liquid Bond Index.iSharesiBoxx Investment Grade Corporate Bond Fund ETF (LQD)– is an exchange traded fund incorporated in the USA. It seeks investment results that tracks the investment results of an index composed of U.S. dollar-denominated, investment-grade corporate bonds.PowerShares Senior Loan Portfolio ETF (BKLN)– is an exchange traded fund traded in the USA. It seeks investment results that correspond generally to the price and yield of the S&P/LSTA US Leveraged Loan 100 Index..

80
Disclaimer
Important Information Regarding This ReportThis report was prepared as a private communication and was not intended for public circulation. Clients or prospects may authorize distribution to their consultants or other agents.
Issue selection processes and tools illustrated throughout this presentation are samples and may be modified periodically. Such charts are not the only tools used by the investment teams, are extremely sophisticated, may not always produce the intended results and are not intended for use by non-professionals.
DoubleLine has no obligation to provide revised assessments in the event of changed circumstances. While we have gathered this information from sources believed to be reliable, DoubleLine cannot guarantee the accuracy of the information provided. Securities discussed are not recommendations and are presented as examples of issue selection or portfolio management processes. They have been picked for comparison or illustration purposes only. No security presented within is either offered for sale or purchase. DoubleLine reserves the right to change its investment perspective and outlook without notice as market conditions dictate or as additional information becomes available. This material may include statements that constitute “forward-looking statements” under the U.S. securities laws. Forward-looking statements include, among other things, projections, estimates, and information about possible or future results related to a client’s account, or market or regulatory developments.
Important Information Regarding Risk FactorsInvestment strategies may not achieve the desired results due to implementation lag, other timing factors, portfolio management decision-making, economic or market conditions or other unanticipated factors. The views and forecasts expressed in this material are as of the date indicated, are subject to change without notice, may not come to pass and do not represent a recommendation or offer of any particular security, strategy, or investment. All investments involve risks. Please request a copy of DoubleLine’s Form ADV Part 2A to review the material risks involved in DoubleLine’s strategies. Past performance is no guarantee of future results.
Important Information Regarding DoubleLineIn preparing the client reports (and in managing the portfolios), DoubleLine and its vendors price separate account portfolio securities using various sources, including independent pricing services and fair value processes such as benchmarking.
To receive a complimentary copy of DoubleLine Capital’s current Form ADV (which contains important additional disclosure information, including risk disclosures), a copy of the DoubleLine’s proxy voting policies and procedures, or to obtain additional information on DoubleLine’s proxy voting decisions, please contact DoubleLine’s Client Services.

81
Important Information Regarding DoubleLine’s Investment StyleDoubleLine seeks to maximize investment results consistent with our interpretation of client guidelines and investment mandate. While DoubleLine seeks to maximize returns for our clients consistent with guidelines, DoubleLine cannot guarantee that DoubleLine will outperform a client's specified benchmark or the market or that DoubleLine’s risk management techniques will successfully mitigate losses. Additionally, the nature of portfolio diversification implies that certain holdings and sectors in a client's portfolio may be rising in price while others are falling; or, that some issues and sectors are outperforming while others are underperforming. Such out or underperformance can be the result of many factors, such as but not limited to duration/interest rate exposure, yield curve exposure, bond sector exposure, or news or rumors specific to a single name.DoubleLine is an active manager and will adjust the composition of client’s portfolios consistent with our investment team’s judgment concerning market conditions and any particular sector or security. The construction of DoubleLine portfolios may differ substantially from the construction of any of a variety of bond market indices. As such, a DoubleLine portfolio has the potential to underperform or outperform a bond market index. Since markets can remain inefficiently priced for long periods, DoubleLine’s performance is properly assessed over a full multi-year market cycle.
Important Information Regarding Client ResponsibilitiesClients are requested to carefully review all portfolio holdings and strategies, including by comparing the custodial statement to any statements received from DoubleLine. Clients should promptly inform DoubleLine of any potential or perceived policy or guideline inconsistencies. In particular, DoubleLine understands that guideline enabling language is subject to interpretation and DoubleLine strongly encourages clients to express any contrasting interpretation as soon as practical. Clients are also requested to notify DoubleLine of any updates to Client’s organization, such as (but not limited to) adding affiliates (including broker dealer affiliates), issuing additional securities, name changes, mergers or other alterations to Client’s legal structure.
DoubleLine® is a registered trademark of DoubleLine Capital LP.
© 2014 DoubleLine Capital LP
Disclaimer

82
Upcoming Webcast Announcements
Morris Chen – September 11, 2014CMBSGo to www.doubleline.com, Home page under “Events”1:15 pm PDT/4:15 pm EDT
Jeffrey Gundlach – September 16, 2014Closed-End FundsGo to www.doublelinefunds.com, Home page under “Events” 2014 Webcast Schedule to register1:15 pm PDT/4:15 pm EDT
Robert Cohen & Bonnie Baha – October 7, 2014Floating RateGo to www.doublelinefunds.com, Home page under “Events”2014 Webcast Schedule to register1:15 pm PDT/4:15 pm EDT
To Receive Presentation Slides:You can email [email protected]


![HARMONIZING STATES’ ENERGY UTILITY REGULATION ...Gundlach][211...Justin Gundlach and Elizabeth B. Stein* Synopsis: Several states have recently passed legislation mandating ambi-tious](https://static.fdocuments.net/doc/165x107/60c70e6de36be75a9e0ae24b/harmonizing-statesa-energy-utility-regulation-gundlach211-justin-gundlach.jpg)