
J.E. Bonelli; H.E. Taylor; R.K. Skogerboe -- A Direct Differential Pulse Anodic Stripping...
14
Analylica Chimica Acta. 118 (1980) 243-256 0 Elsevier Scientific Publishing Company, Amsterdam - Printed in The Netherlands A DIRECT DIFFERENTIAL PIJLSE ANODIC STRIPPING VOLTAIM- METRIC METHOD FOR TIIE DETERMINATION OF THALLIUM IN NATURAL WATERS J. E. BONEI.I.I*, H. E. TAYI.OR and R. K. SKOGERBOE** U.S. Geological Survey, Mail Stop 407. Iknrw Federal Ceukr, Denver. CO 50225 (U.S._d.) (Received 11 th February 1980) SUMMARY A dual direct method for the ultratrace determination of thallium in natural waters by differential pulse anodic stripping voltammetry (d.p.a.s.v.) is presented. D.p.a.s.v. at the hanging mercury drop electrode and at the mercury film electrode is used in the concentration ranges 0.5--100 rg Tl l-‘, anti O.Ol--1OrgTI I-‘,respectively. Quantification is uided by the technique of stirndard additions. The response of the method is optimized for typical natural surface water matrices. An intercomparison of ttralium determinations performed hy the two anodic stripping methods and electrothermal-atomization atomic absorption spectrometry on normal and thalliumspiked surface water samples demon- strates equivalent accuracy within the range where atomic absorption is applicable. The method appears free from serious interferences. The lack of a direct, convenient and rapid analytical method for thallium with adequate sensitivity for water resource monitoring has limited extensive determination of naturally occurring concentration levels of thallium in sur- face waters. Recause of the recent inclusion of thallium on the U.S. Environ- mental Protection Agency’s list of priority pollutants [l] and steadily increasing emissions of this clement to the environment, particularly from fossil fuel combustion [2], the authors sought to develop an analytical method for thallium that met the above criteria. Existing analytical techniques applicable to thallium determinations in waters include neutron activation [3, 41, spark-source mass spectrometry [ 5, 61, electrothermal-atomization atomic absorption spectrometry [ 7-91, optical emission spectroscopy [6, lo], spectrophotometry [ 111, and anodic stripping voltammetry [ 12-16]_ A no&c stripping voltammetry is a natural choice as a technique for determination of thallium in natural waters; thal- lium is reduced reversibly on mercury in most supporting electrolytes and concentrated amalgams may be obtained [17] _ The inherent sensitivity of the technique is realized with the USC of the differential pulse stripping mode [ 181 and the rotating mercury film electrode (m-f-e.) [ 191 . In a similar appli- cation, anodic stripping volta_mmetry has been widely used for determinations **Department of Chemistry, Colorado State University, Fort Collins, CO 80523, U.S.A.
-
Upload
magdalena-ardelean -
Category
Documents
-
view
32 -
download
4
description
A Direct Differential Pulse Anodic Stripping Voltammetric Method for the Determination of Thalium in Natural Waters
Transcript of J.E. Bonelli; H.E. Taylor; R.K. Skogerboe -- A Direct Differential Pulse Anodic Stripping...
Analylica Chimica Acta. 118 (1980) 243-256 0 Elsevier Scientific Publishing Company, Amsterdam - Printed in The Netherlands
A DIRECT DIFFERENTIAL PIJLSE ANODIC STRIPPING VOLTAIM- METRIC METHOD FOR TIIE DETERMINATION OF THALLIUM IN NATURAL WATERS
J. E. BONEI.I.I*, H. E. TAYI.OR and R. K. SKOGERBOE**
U.S. Geological Survey, Mail Stop 407. Iknrw Federal Ceukr, Denver. CO 50225 (U.S._d.)
(Received 11 th February 1980)
SUMMARY
A dual direct method for the ultratrace determination of thallium in natural waters by differential pulse anodic stripping voltammetry (d.p.a.s.v.) is presented. D.p.a.s.v. at the hanging mercury drop electrode and at the mercury film electrode is used in the concentration ranges 0.5--100 rg Tl l-‘, anti O.Ol--1OrgTI I-‘,respectively. Quantification is uided by the technique of stirndard additions. The response of the method is optimized for typical natural surface water matrices. An intercomparison of ttralium determinations performed hy the two anodic stripping methods and electrothermal-atomization atomic absorption spectrometry on normal and thalliumspiked surface water samples demon- strates equivalent accuracy within the range where atomic absorption is applicable. The method appears free from serious interferences.
The lack of a direct, convenient and rapid analytical method for thallium with adequate sensitivity for water resource monitoring has limited extensive determination of naturally occurring concentration levels of thallium in sur- face waters. Recause of the recent inclusion of thallium on the U.S. Environ- mental Protection Agency’s list of priority pollutants [l] and steadily increasing emissions of this clement to the environment, particularly from fossil fuel combustion [2], the authors sought to develop an analytical method for thallium that met the above criteria.
Existing analytical techniques applicable to thallium determinations in waters include neutron activation [3, 41, spark-source mass spectrometry [ 5, 61, electrothermal-atomization atomic absorption spectrometry [ 7-91, optical emission spectroscopy [6, lo], spectrophotometry [ 111, and anodic stripping voltammetry [ 12-16]_ A no&c stripping voltammetry is a natural choice as a technique for determination of thallium in natural waters; thal- lium is reduced reversibly on mercury in most supporting electrolytes and concentrated amalgams may be obtained [17] _ The inherent sensitivity of the technique is realized with the USC of the differential pulse stripping mode [ 181 and the rotating mercury film electrode (m-f-e.) [ 191 . In a similar appli- cation, anodic stripping volta_mmetry has been widely used for determinations
**Department of Chemistry, Colorado State University, Fort Collins, CO 80523, U.S.A.
of thallium in urine and b!ood serum [ 20-22 and references therein]. \\‘ith the exception of anodic stripping voltammetry, each of the tech-
niques mentioned above exhibits one or more undesirable features, such as (a) requirements for laborious preconcentration steps, (b) matris separations to eliminate interferences, and (c) access to espensive and sophisticated analytical facilities. Of the available anodic stripping voltammetric methods for thallium in waters, one involves preconccntration of thallium on a chelating resin 1 121, another involves preconcentration of thallium by coprecipitation [ 131, followed by d.p.a.s.v. at the hanging mercury drop electrode (h.m.d.e.), or direct. current. (d-c.) anodic stripping voltammetry at the mercury-graphite electrode, respectively. The first. method requires a S-day preconcentration procedure and a 4-l sample vo!ume to obtain a limit of detection of 0.6 ng Tl I-‘. ‘The second method is more rapid (3 h), requires a lOO-ml sample, and obtains a determination limit of 10 ng ‘I’1 I-‘. The method reported here requires no preconcen tration, or at. most. one hour, a sample volume of 25 ml and obtains a detection limit of 10 ng ‘II I-‘. This limit may be estended by appropriate alteration of experimental parameters, or by USC of precon- centration steps.
ESPERIhlENThI.
Instrrtmentation D.p.s.a.v. determinations were carricsd out \vith a~ IX&G Princeton ~Ipplic!d
Research Corp. (P_-\R) 3lotlcl l’i:l_-\ Polnrographic .-\nalyzcr and Ilodcl 31.5 IClectroanalysis Controller. TIN voltammctric cell was a borosilicatc glass polarographic cell (I’_-\I{ K60) with a molded plastic cell top (P:\R K66). Ci~~ent~l~otential curves were recorded on a 1 louston Instruments \lodcl 2000 X-Y recorder. Optimized instrumental operating l~aranwters arc* sum- marized in Table 1.
Elcctr-odes ‘1’1~ working electrodes used \vew the l’,\R 9323 li.ni.d.0. (\lcwolim I<-
410) and a I’okai 1’13-6 (type CC,\) G-mm glassy carbon rot1 c~ncapsulatctl in cposy resin. :\ Pine Instruments electrode rotator hlodcl -I’IIC \\‘iti ~w~ploy~~~l with the glassy carbon substrate on which the thin mercu~ film was t~lcctro- cicpo.sitcd. The reference electrode was _-\g!/.-IgCl (sat.. KCI) isolated from the sample solution by a Iwrous Vycor Silici1 bridge, to which all lmtcmti;~ls \v(?rc
rctfc.rred. The aiisiliary eleclrotle \vas a 20-gauge ~~liltitllltll \Virc.
Reagcn ts ;\I1 chemicals used were reagent-grsdeor better. \Vater was obtainecl from a
commercial wakr purification system and used without. further purification: local tapwa.ter \V’;LF analyzed and found to contain no detectable thallium. Only ultrapure nitric acid was used for reagent preparation; reagent grack nitric acid (as a 20% water solution) was used for cleaning glass\varc.
TABLE 1
Summary of optimized operating parameters -_ --- --
Parameter Optimum setting Panmrtcr Optimum scttinl: or condition or condition
-- --__--__-- ---.----..--.--
IortNmrntal Chcm icot
Mode IIiffcn*ntial pulse Supportinr clcclrolvtcl 0.06 31 IiC,ll ,O: Conditioning: pomntial O.OV (h.m.d.e.): buffer (~11 -l.5-4.6)
+.lV (m.f.c.) 0.05 hl KC,II,O, Ib_poricion pokntial --O.&IV 0.001 31 EDI’A i’otcn~ial scan raw. I’ B mv s-1 m.f.c. plating solution 0.06 >l iICII1,O, Pulse fresucncy 2 117. Pulse modulation amplitude 50 mV
0.05 31 KC,H,O, 0.0008 Al !lL-’
Final pokmial O.OV (h.m.d.c.): -*.lV (m.f.e.)
-.----~-._ _ _.- ._- . -_. -
The supporting electrolyte/buffer (1.53 Xl acetic acid, 1.42 RI potassium acetate) solution was prepared by reacting 17.3 g of anhydrous potassium carbonate with 35.4 g (33-S ml) of glacial acetic acid adding water very slowly. \Vhen the reaction was complete, sufficient water was added to bring the total volume up to 200 ml.
The EDT,\ stock solution was prepared by dissolving 4.16.g of tetrasodium- I<I)T:\ in enough water to yield 100 ml of solution. A mercury stoclcsolution (used for preparation of the n1.f.c.) was made by dissolving 0.201 g of mercury in 1.0 ml of nitric acid and diluting with water to 100 ml.
The thallium stock standard solution (1000 mg 1 ‘) was prepared by dis- solving 130.3 mg of oven-dried (llO”C!) thallium(I) nitrate in 10.0 ml of nitric acid and adding sufficient water to yictld 100 ml of solution. \\‘orking thallium standard solutions wcrc prepared fresh daily from this stock standard solu- tion by appropriak serial dilutions in 0.02 1\1 nitric acid.
C’ylindcr nitrogen used for purging solutions was passed through a vanadium- (II) chloride solution to remove traces of osygen , as described by Xlckitcs (231.
Proced 11 r-es ;\I1 glass\vare wxs soaked in 20% (1 i- 4) nitric acid for at least one 110111
prior to MC. It is recommended that water samples be collectccl and prescrvcd with nitric acid in accordance with acccpkcl procedures [ 2.41 .
Electrode prcparatiotz. The tn.f.c. is prepared on the esposcd Ci-mm end of the glassy carbon rod encapsulated in a cylindrical sheath of clwmic.ally rcsistrlnt c’posy resin. ‘Ike electrode surface is faced off flat. 011 ;I lathe, and then wet-ground by hand on ;1 glms plate with a succession of ;llwasivcs starting with 400-, followed by 600-grit silicon carbide and finally y-alumina, to produce a mirror-like finish. The electrode is then mounted in the rotator and immersed in a plating solution made from 22.0 ml of water, 1.0 ml of supporting electrolyte/buffer, and 2.0 ml of the mercury stock solution. After purging the solution with nitrogen for 5 min with electrode rotation at. 3600 revolutions per min (rpm), a d-c. potential of -0.25 V is applied for
246
5 more minutes, with nitrogen bubbling as the only means of stirring. Subsequently, the electrode is rotated at 3600 rpm for 10 min at -0.25 V [ 191.
During a typical film-plating operation, about 0.2 coulomb of charge will be passed; assuming 100% current efficiency and homogeneous coverage, the resulting mercury film will be about 500 nm thick, well within the thin-film range [ 19. 251. Klectrodcs prepared in this way have been successfully used for one complete day‘s work. Since the analytical performance of the m.f.e. degrades with time. it is recommended that a new m.f.e. be prepared daily.
Anak~sk of waters. The following procedure is suitabk for the analysis of waters with concentrations of 0.5 to 100 pg Tl I-’ \vith the l1.tn.d.e. ‘1’0 a 23.0 ml sample in a polarographic cell. add 1.0 ml acetate supporting ctIectrolytc/buffer. 0.25 ml EDT=\ solution and a small mag,l;etic stirring bar. Purge the solution with prepurified nitrogen gas for 5 min. ktrudc a fresh mercury drop from the electrode -.- a 3-division (0.02 cm ‘) drop has been found satisfactory. Condition the electrode for 1.5 min with stirring at -0.1 V. deposit 60 s with stirring at. -0.S V and equilibrate: 15 s at --0.S V Lvithout stirring. Initiate the stripping scan with instrument parameters show1 in Table 1 and record the current/potential curve. .\ well-formed peak at about -0.42 V corresponds to thallium oxidation. the height of which is proportional to thallium concentration. .\n appropriate small-volume spike of the working thallium standard solution is added, and the above proceduw repeated. Three additions arc required to provide a linear standard additions plot from which the original thallium concentration can be calculated directly 126. 2i) _ Higher precision can be obtained by using the same electrode drop for a succession of four scans on each sample. However, caution must be cscrcised when surface-active organic materials or large amounts of copper arc present; in these cases it may be prudent to IEP a fresh electrode drop for each scan.
Analysis of waters wit11 concentrations of 0.01-10 pg Tl 1”’ is carried out at the n1.f.e. esactly as in the preceding paragraph with the csccptions that (a) no mabmctic stirring bar is used: electrode rotation at 3600 rpm is used to effect solution stirring: (b) the electrode is conditioned and the stripping scan is terminated at -0.1 V; (c) the deposit time is 600 s: and (d) the thallium osidation peak appears at about ---O-56 V.
The choice of a 25ml sample is merely for convenience. There is no reason that significantly smaller sample volumes cannot be used, provided that the usual limitations on a.s.v. are not csceedcd (for a detailed discussion, see [I7 9 =I )-
RESULTS AND DISCUSSION
Response optimization ‘To provide for the widest possible concentration working range, the
method was optimized for thallium determinations in natural water matrices. Pretious reports, though few in number, have clearly indicated that concen-
trations of thallium in natural waters do not esceed 50 ng Tt 1-l [ 12, 131. Our intent was to obtain the greatest. sensitivity of determination, consistent with sound analytical practice and reasonable espenditure of time and effort,, per sample analysis. It is anticipated that most, if not all, unpolluted water samples wilt have thallium concentrations that fall within the working range of the m.f.e. (0.01-10 1-16 ‘I’1 1“). Response optimization esperimentation wass, therefore, concentrated on the m.f.e. portion of the method.
The response optimization experiments can be broadly divided into two categories, instrumental parameters and chemical parameters.
Instrumental parmmters. The differential pulse stripping mode \vas em- ployed because of its inherent sensitivity and operational simplicity with modern instrumentation [ 18, 19, 291.
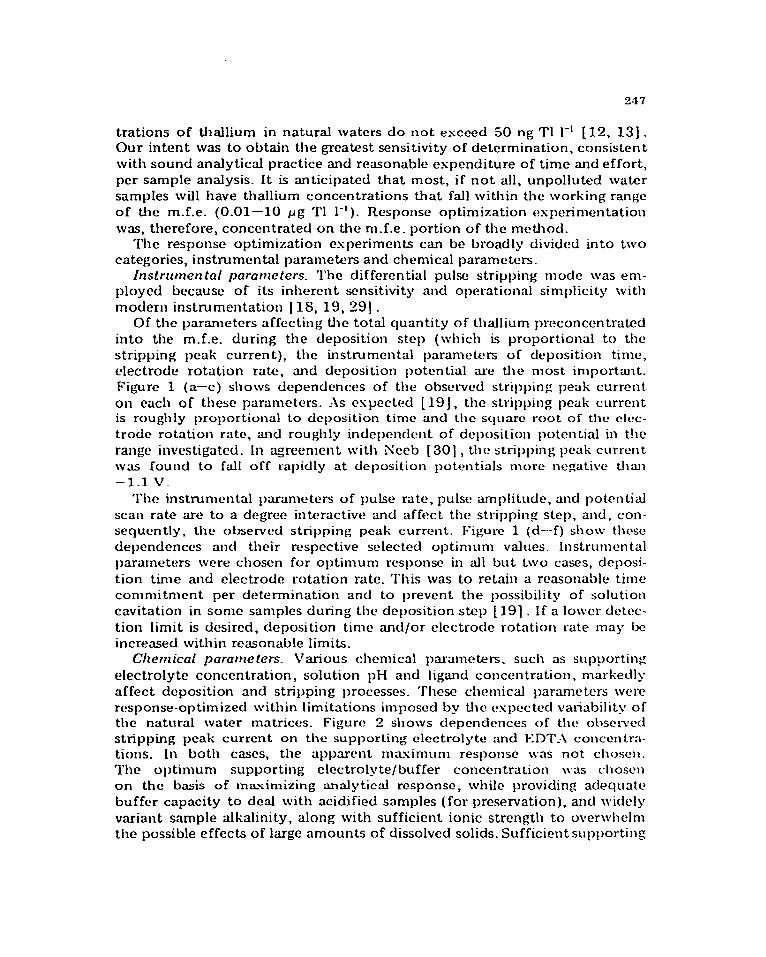
Of the parameters affecting the total quantity of thallium prwoncentrakd into the m.f.e. during the deposition step (which is proportional to the stripping peak current,), the instrumental paramctcrs of deposition time, electrode rotation rate, and deposition potential are the most important. Fibare 1 (a-c) shows dependenct?s of the observed stripping peak current. on each of these parameters. As cspected [ 19 1, the stripping peak current is roughly proportional to deposition time and tire square root of the elw- trodc rotation rate, and roughly independent of deposition potential in the range investigated. In agreement with Kceb [ 301 , ttlc stritlping peak current was found to fat1 off rapidly at deposition potentials more nejiativc than -1.1 v.
The instrumental t)arzameters of pulse rate, pulse amplitude, and potcntiat scan rate are to a degree intxractive and affect the stripping step, and, con- sequently, the observed stripping peak current. k’igurc 1 (d-.-f) sho\v these dependcnces and their respective selected optimum values. Instrumental parameters were chosen for optimum response in all but two cases, dcposi- tion time and electrode rotation rate. This was to retain a reasona!)le time commitment per determination and to prevent the possibility of solution cavitation in some samples durin g the deposition step [ 191 _ If a tower dctcc- tion limit is desired, deposition time and/or electrode rotation rate may be increased within reasonable limits.
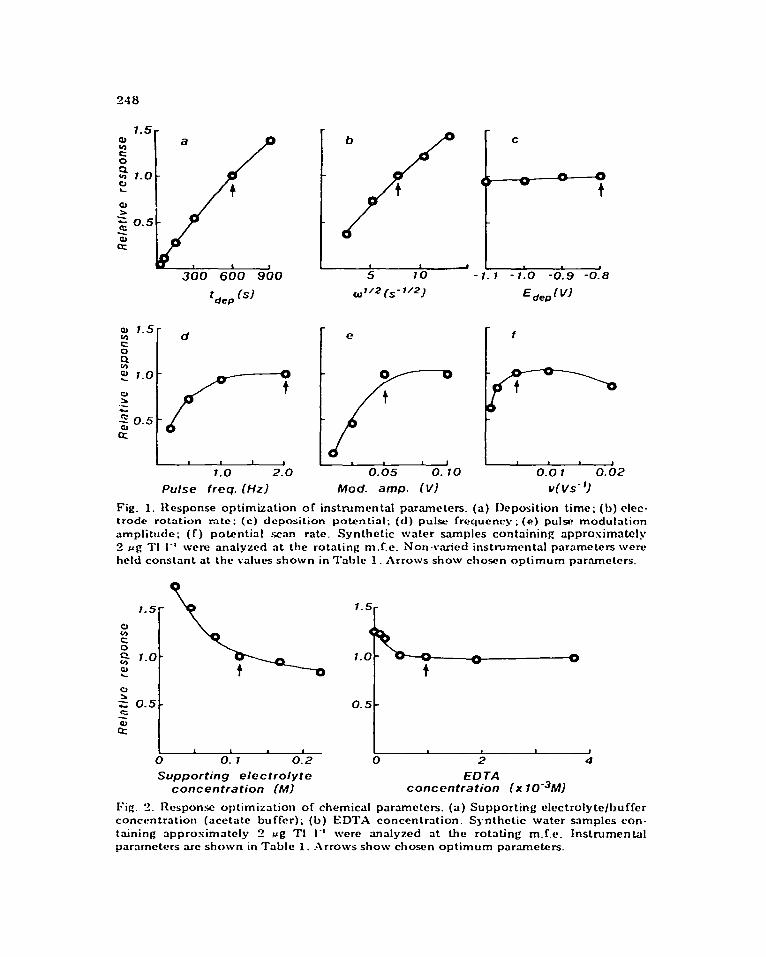
Chemical parameters. Various chemical paramcte&. such as supporting electrolyte concentration, solution pH and ligand concentration, markedly affect deposition and stripping processes. ‘l7icse chemical parame tcrs were response-optimized within limitations imposed by the espcctcd variability of the natural water matrices. Figure 2 sl~ows depcndctnces of the ohsc;~4 stripping peak current on the supportin g electrolyte and E:D?‘;\ conccntr:~- tions. In both cases, the apparent masimum response was not chosen. The optimum supporting electrolyte/buffer concentration \vas c:l~oscn on the basis of masirnizing analytical response, while providing adequate buffer capacity to deal with acidified samples (for preservation), and widely variant sample alkalinity, along with sufficient ionic strength to overwhelm the possible effects of large amounts of dissolved solids. Sufficientsupporting
1.5 : a
z P u) 7.0 cl L r t Q
5 0.5
2 Ld 300 600 900
t dep (‘I
d
I I I I
1.0 2.0
Pulse freq. (Hrl
e
0 sl: t
0.05 0. 10
Mod. amp. (VI
8 0.0 1 0.02
vws-‘1
Fig. 1. Response optimization . of instrumental parameters. (a) Deposition time; (b) clec- trade rotation mtc; (c) deposition potential; (d) pul.sc frequency; (e) pulw modulrrtion ampIitudc; (f) potential scan rate. Synthetic water samples containing approsimatcly 2 ~6 ‘I’! 1-l were analyzed nt the rotating m.f.e. Non-v.aried instrumental parameters were held constant at the values shown in Talalc 1. Arrows show chosen optimum parnmeters.
C t ’ ’ k 5 10 - 1. 1 - 1.0 -0.9 -0.8
a112 (s- l/2)
1.5
CJ
2 2 l-slL Ln * * 1.0 1.0
z! t t
z 2 0.5. 0.5- C z CC
I I t , 0 0. 1 0.2 0 2 4
Supporting electrolyte ED TA concentration (MI concentration (x 10m3M)
Fig. I?. Responr optimization of chemical parameters. (a) Supporting electrolyte/l,uffer concentration (acetate buffer); (b) EDTX concentration. Synthetic water samples con- taining approsimately t? ,ug TI I-’ were analyzed at the rotating m.f.c. Instrumental parameters arc shown in Table 1. Arrows show chosfn optimum par.ametcrs.
249
electrolyte concentration is also necessary to avoid the cffccts of large un- compensated solution resistance on the measurcmcflt 1311. Optimum EDTX concentration was chosen to provide an adequate margin of safety from interference by cadmium, lead, and copper.
The effect of mercury film thickness may also be loosely rcgardcd as a chemical parameter. Although it has been shown theoretically [ 231 and verified esperimcntally [19] that the stripping peak current is not, within limits, a function of mercury film thickness, Batley and Florence [ZS] have claimed superior analytical performance for mercury film electrodes formed in situ (i.e., simultaneous film and analyte deposition). \\‘c have chosen in this application a n1.f.e. thin enough to adlwrc to thin-film lwhavior, but thick (voluminous) enough to minimize the effects of co-deposited metals (especially copper), which may saturate or otherwise alter the c?lcctrodc. Stulikova [ 321 suggested that more homogeneous electrode coverage with mercury is obtained at applied film plating potentials less tJlan --.0.8 1’. \\‘c have found no performance advantage in doing so.
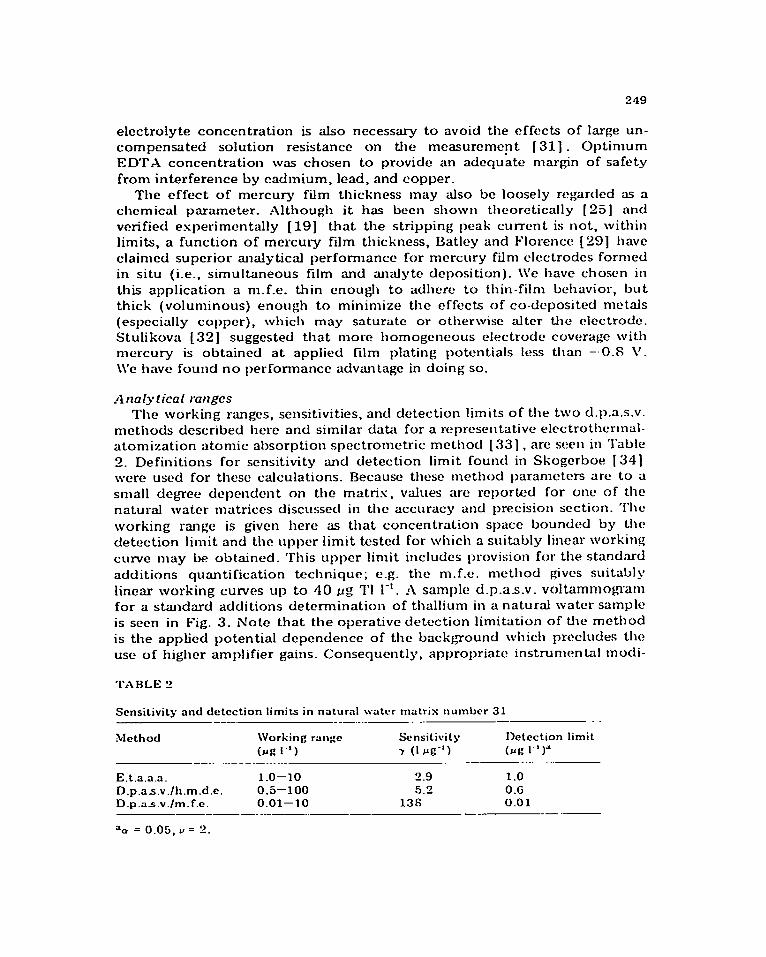
The working ranges, sensitivities, and detection limits of the two d.p.a.s.v. methods described here and similar data for a rctprcse~~tativc elcctrothcrmal- atomization atomic absorption spectromctric method 1331 , are swll in ‘l’abk 2. Definitions for sensitivity and detection limit found in Skogcrboe 1341 were used for these calculations. Decause these method paramctcrs arc to a small degree dependent on the matris, values arc reported for one of the natural water matrices discussed in the accuracy and precision section. ‘1%~ working range is given here as that concentration space bounded by the detection limit and the upper limit tested for which a suitably linear working cuwe may be obtained. This upper limit includes provision for the standard additions quantification tcchniquc; e.g. the m.f.c. nictllod gives suitably linear working cunws up to 40 ~g Tl 1-I . A sample d.p.as.v. voltammo~Wm for a standard additions determination of thallium in a natural water sample is seen in Fig. 3. Note that the operative detection limitation of the method is the applied potential dependence of the background which precludes the? use of higher amplifier gains. Consequently, appropriate instrumental modi-
Sensitivity and detection limits in naLurn1 water matris number 31 -___. __- ._._ ~. . . -
Method Working range Sensitivity Detection limit
(rF! I”) 7 (I a-‘) (rg I”), ____ .._---.- . . .._ ---.... ..~
l3.t.a.a.a. 1 .o-10 2.9 1.0 D.p.as.v.lt1.m.d.e. 0.5-100 5.2 0.6 D.p.ns.v./m.f.c. 0.01-10 13S 0.01
---- _-._ --.. -- -_ _- .-
30 = 0.05, ” = 2.
t 8 I I
-0.8 -0.6 -0.4 -0.2 0.0 -, 0.8 -0.6 -0.4 -0.2 0.0
E applied (VI E applied tVl
Fig. 3. Skmdnrd additions determination of thallium at the m.f.e. (a) Natural wrrtcr sample containing approximately 0.02 rg TI I-‘; (b) water + 0.0~9 rg 1’1 I-‘; (c) water + 0.09s pg ?‘I I-‘; (d) water .+. 0.117 rg TI I-‘. Analytical conditions are specified in the
procedure section.
a
b
Fig. 4. D.p.a.s.v. of Cd. Ph. and TI at the h.m.d.e. (a) Without adtlccl ED’I’A; (b) with add4 EDT.-\. All 3 constituents present at approximakly 5 rg I”. Analytical conditions
are specified in the procedure section.
fications or USC of other instrumentation coukl potentially dccrcasc the
detection limit of the method.
Interferences Because of simikrity of oxidation potentials of the Cd(I Ig) and Pb( IIg)
amalgams to the 1’1(Ilg) amalgam [ 171 , cadmium and lead were expected to be major intcrfercnts. ED?‘_4 has been used to mask cadmium and lead in polarographic determinations of thallium [23, 351, and its use has been documented for a.s.v. thallium determinations as well [ 121 . Although thal- lium is sufficiently resolved from cadmium and lead at the m.f.e. to permit quantification in acetate medium at comparable concentrations 1361 , it is necessary to add ED’I’A in this circumstance because cadmium and lead are invariably present at. much higher concentrations than thallium in natural waters. In addition, thallium is less well resolved from cadmium and lead at the h.ni.d.e. (see Fig. 4). \Vithin the working ranges specified in the previous section, cadmium and lead were found not to interfere up to 100 ~g I”‘, provided that the pH of the analysis solution is not below 3.5 (which could bc due, for csamplc, to cscessive acidification of samples for trace metal pwservation prior to analysis), and that the total hardness (calcium plus magnesium) does not exceed 500 mg I-‘. Both of these circumstances lead to incomplete masking of the cadmium and lead by the added ED’I‘A, because of competitive reactions with FI,O* and Caz+ and Mg2+.

251
Although EDT-4 complexes of cadmium and lead are reduced at applied potentials more negative than the thallium deposition potential (-0.S V), the copper-EDTA complex is reduced (albeit slowly) at -0.8 V. The ill- formed and unreproducible copper stripping peak in this medium occurs at about -0.2 V. The presence of co-reduced copper in the electrode amalgam does not interfere in the thallium determination, provided that the solubility of copper in mercury is not exceeded [ 37]_ This is only likely in the case of the m.f.e., since the electrode volume is si&mificantly smaller than an h.m.d.e.
Several experiments were performed with synthetic and natural water samples to determine the effects of co-deposited copper with thallium at the m.f.e. In general, it was found that while up to 5 mg Cu 1-l could apparently be tolerated when 1 pg ‘I’1 1-l was determined, visible alteration of the m.f.c. could be seen at copper concentrations between 0.5 and 1.0 mg 1-l. The m.f.e. was transformed from a normal dull grey appearance to a highly reflective metallic appearance under these circumstances. This was found to be due to saturation of the mercury film with copper, resulting in a change in the surface tension of the amalgam. Since the effective surface area and composition of the electrode ate important analytical parameters, it is sug- gested that thallium determinations in the presence of more than 0.5 mg Cu 1-l arc suspect. It was verified that successful thallium determinations at the m.f.c. may be carried out with no interference from copper, if the copper concentration is less than 0.5 mg I-‘. This copper interference is not a significant limitation, since copper concentrations in natural waters ratcly cscced 0.2 mg 1-l [ 381.
Peak current suppression interferences arc likely in solutions that contain large amounts of organic material, soaps, detergents, surfactants, or other surface-active materials. It was shown that wet-ashing the sample just to dryness (not baking) in the presence of nitric acid effectively eliminates this interference and gives 100% recovery of a thallium spike in an unpreserved atmospheric precipitation sample, in which algal growth was evident, at the 50 ng ‘I’1 1-l level. It is unfortunately not possible to make a general statc- mcnt concerning the vulnerability of this method to interference by surfacc- active constituents. Such effects are invariably compound-specific and matris-dependent.
A positive interference has very occasionally been observed that was attri- buted to a strongly potential-dependent simultaneous electrode reaction, in which both the reactant and product remained in solution. This tyl)e of interference may be effectively dealt with by algebraic subtraction of zero deposition time-peak currents from those observed under normal operating conditions [39] _ Two previously reported interfering elements of this latkr type [39, 401 , iron and manganese, were found not to intcrfete with thallium determinations up to 0.5 and 5.0 mg 1-l. respectively. No cvidcnce of intcr- metallic compound formation between thallium and other metals in the clcc- trodc amalgam has been observed.
The proposed d.p.a.s.v. method appears free from serious interference from
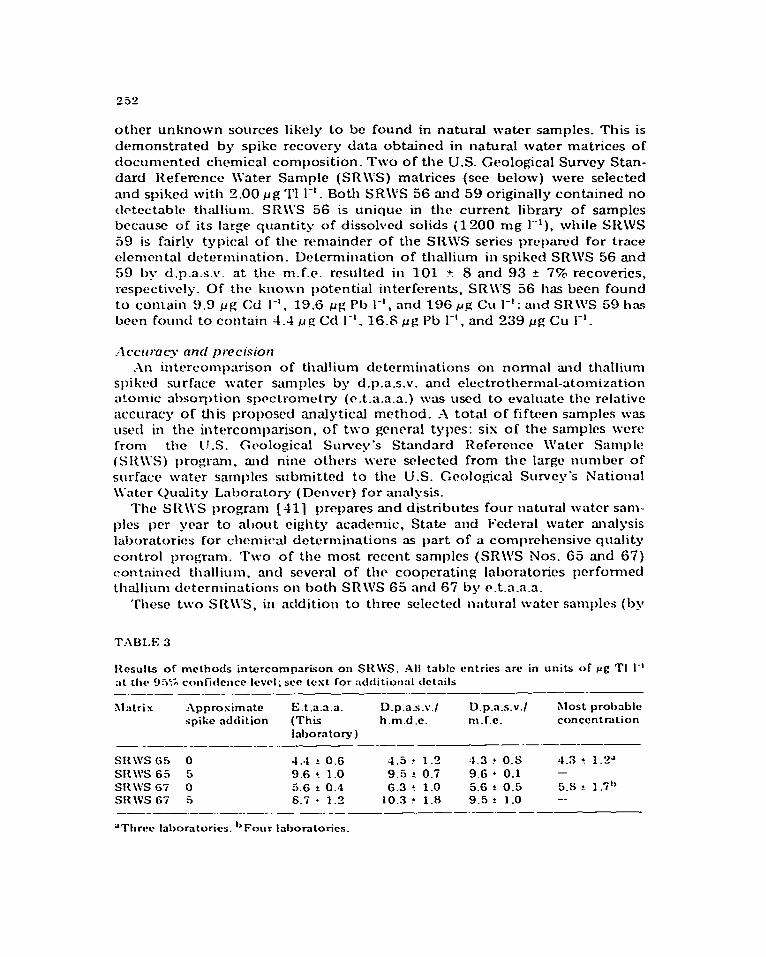
other unknown sources likely to be found in natural water samples. This is demonstrated by spike recovery data obtained in natural water matrices of clocut~~ented chemical composition. Two of the U.S. Geological Survey Stan- dard Reference \i’ater Sample (SR\\:S) matrices (see below) were selected and spiked with 2.00 r_lg ‘1’1 1-l _ Both SR\\‘S 56 and 59 originally contained no clctcctablc! thallium. SR\\‘S 56 is unique in the current. library of samples bccausc of its large quantity of dissolved solids (1200 mg 1”‘). while SRWS 59 is fairly typical of the remainder of the SR\VS series prcpamd for trace c?lcmcntal determination. Determination of thallium in spiked SR\W 56 and 59 by d.p.a.s.v. at the m.f.e. rcsultc?d in 101 + S and 93 f T% recoveries, respectively. Of the kno~~n 1)otential interferents, SR\\‘S 56 has been found to coniain 9.9 fig Cd 1-I. 19.6 ~g Pb I-‘, and 196 rg Cu 1-l; and SR\\‘S 59 has been found to contain 1.4 1_1g Cd 1-l. 16.8 ~g l’b I-‘, and 239 ~g Cu 1-l.
Art intercomparison of thallium detcrmit~ations on normal and tl~alliun~ spiked surface water samples by d.p.a.s.v. and clcctrothcrn~al-atomization atotnic absorption spcctrotnctry (c.t.a.n.a.) was used to evaluate the relative wcuracy of this proposed analytical method. _-I total of fifteen samples was used in the intercomparison, of two general types: sis of the samples were from the 1J.S. Gcaological Survey’s Standard Rcfcrcnce \\‘ater Sample (SR\\‘S) program, and nine others were selected from the large number of surface water satnl~les submitted to the U.S. Ccological Survey’s National \\‘atcr (Juality Laboratory (Dcnvcr) for analysis.
The SR\\‘S program [41] prepares and disttibutcs four natural water sam- ples per year to atloii~ eighty academic, State and Federal water analysis laboratories for chc!mical determinations as part of a comprehensive quality control program. ‘I’wo of the most recent samples (SR\\‘S Nos. 65 and 67) contnincd thallium. and several of the cooperating laboratories performed thallium dctcrminations on both SR\\‘S 65 and 67 by c?.t.a.a.a.
These two SR\VS, itt addition to three selected natural water samples (I)>
Results of methods intercomparison on SRWS. All table entries arc in units of rg TI 1.’ ;ct rltc~ L)J% confidence Icwl; see test for addition:d tlctnila -.--- -.-_ .- _-.-.. ---..-- __-___-
Xlatrix hpprosimnte r2.t.a.a.a. D.p.X%v./ D.p.a.s.v./ Most probrrblc spike addition (This h.m.d.e. m.l.e. conccntmtion
Id>ornto~) _ __-_ _--_-.-- -_--- _ ._._-_-
SI{\\‘S 65 0 4.4 ? 0.6 4.5 t 1.2 4.3 ? 0.s 4.3 ! 1.2” SR\\‘S 65 5 9.6 ! 1.0 9.5 ?. 0.7 9.6 ’ 0.1 - SR\VS 67 0 5.6 f O.? 6.3 ? 1.0 5.6 1. 0.5 5.S? 1.1 -1,
SR\VS Gi 5 S.5 l 1.3 10.3 ? 1.8 9.5 ?. 1.0 -- --_- .--..-_.-_.- -.-_- -- ___-._-.-
‘Threw lalxaratorics. “Four Irrboratorics.
253
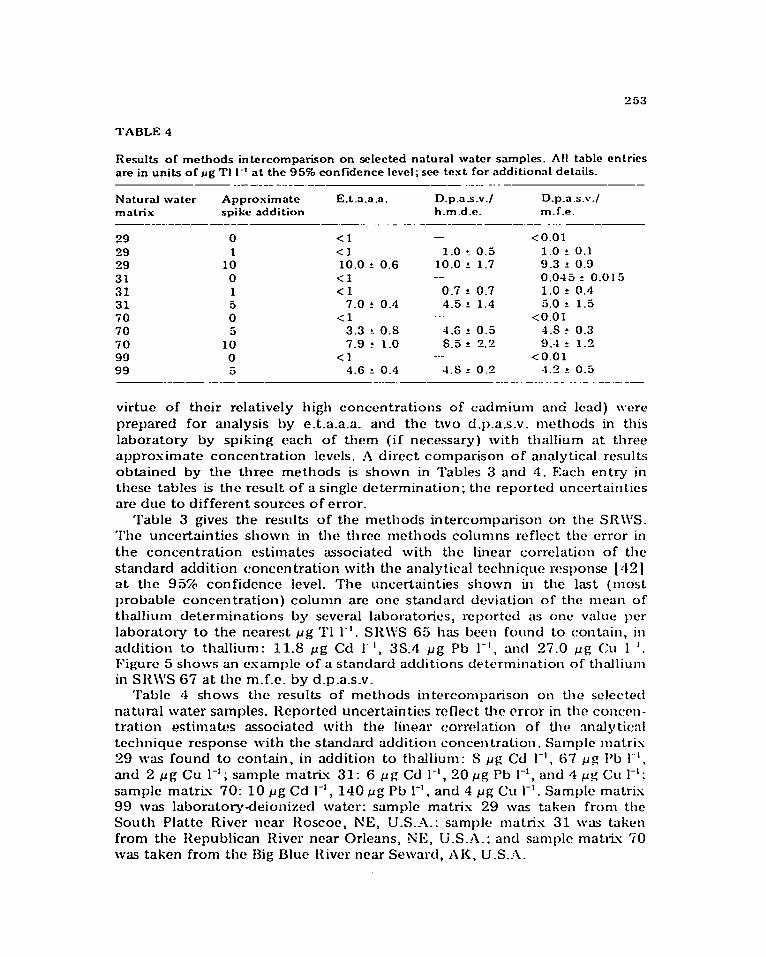
TABLE 4
Results of methods in&comparison on selected natural water sample. All table entries are in units of rg TI I-’ at the 95% confidence level; see text for additional details.
__--_-_ _.._ -.-- -- ._ -. . - --
Natural water Approsimate i2.t.a.a.a. D.p.as.v.l D.p.a.s.v./ matrix spike addition h.m.d.e. m.f.e. --~-_.-------- -.-.. ,_ _ .-. --_-- --.-- . . . ---
29 0 <1 - <O.Ol 29 1 <I 1.0 t 0.5 1.0 ! 0.1 29 10 10.0 I 0.6 10.0 ?. 1.7 9.3 * 0.9 31 0 <l _- 0.045 f 0.015 31 1 <I 0.7 .? 0.7 1.0 f 0.4 31 5 7.0 c 0.4 4.5 ?. 1.4 5.0 f 1.5 70 0 <l ._ <O.Ol 70 c 3.3 !. 0.s 4.6 f 0.5 4.s ! 0.3 70 1; 7.9 ? 1.0 6.5 f 2.2 9:l 2 1.2 99 0 <1 _... <O.Ol 99 5 4.6 z 0.4 4.s ? 0.2 4.2 : 0.5
_--- .-.-- -.___ - _._-..-... --.-._ - ..__ . .-
virtue of their relatively high concentrations of cadmium anti lead) were prepared for analysis by e.t.a.a.a_ and the two d.p_a.s.v. methods in this laboratory by spiking each of them (if necessary) with thallium at three approsimatc concentration lcvc~ls. A direct comparison of analytical results obtained by the three methods is shown in Tables 3 and 4. F&h entry in these tables is the result of a single determination; the reported unccrtaintics arc due to different sources of error.
Table 3 gives the results of the methods intercomparison on the SR\W. The unccrtaintics shown in the three methods columns reflect the error in the concentration estimates associated with the linear correlation of the standard addition concentration with the analytical technique response [ 421 at the 95% confidence level. The uncertainties shown in the last (most probable concentration) column arc one standard deviation of the? mean of thallium determinations by several laboratories, rcportcd as one value 1x3
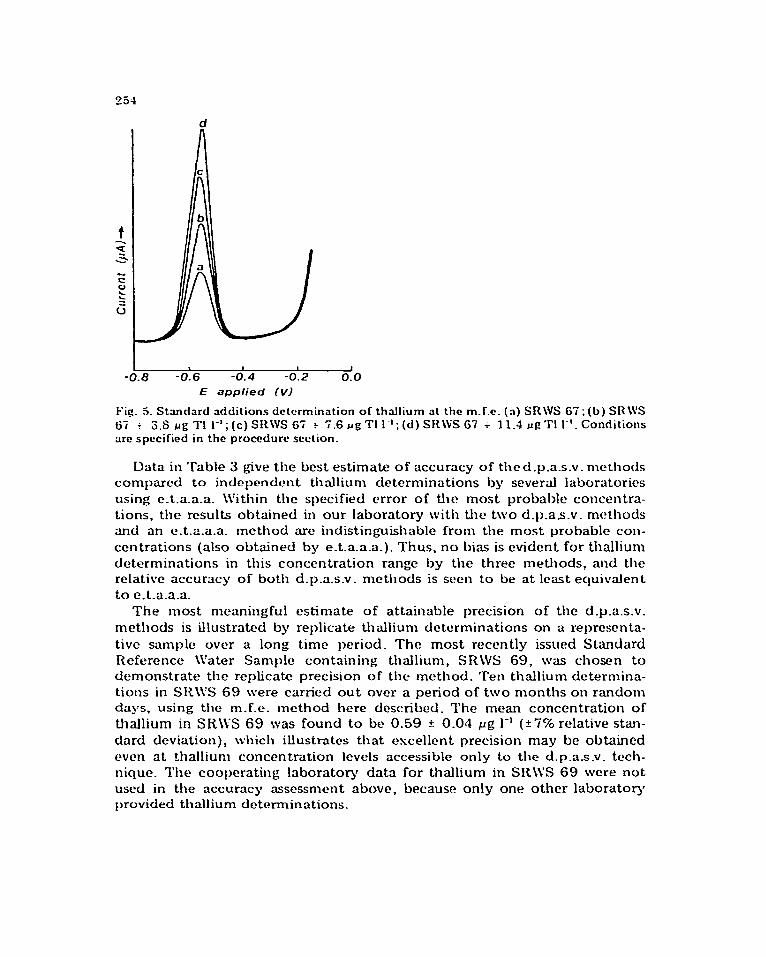
laboratory to the nearest pig ‘I’1 1-l. SIt\VS 65 has been found to contain, in addition to thallium: 11.8 ~6 Cd 1’ ‘, 3S.4 116 Pb l-‘, and 2T.0 pg 01 1 ‘. I>igurc 5 shows an csamplc of a standard additions determination of thallium in SRWS 67 at the m.f.c. by d.p.a.s.v.
Table 4 shows the results of methods in tercomparison on the selected natural water samples. Reported uncertainties reflect the error in the conwn- tration estimates associated with the linear correlation of the analytical technique rcsponsc with the standard addition concentration. Sample inatris 29 was found to contain, in addition to thallium: S pg Cd 1-l. 67 pg Pb I”‘, and 2 pg Cu 1-l; sample matri.. 31: 6 pg Cd l-‘, 20~~: Pb I-‘, and 4 pg Cu I-‘; sample matris 70: 10 pg Cd l-‘, 140 pg Pb 1-l. and 4 pg Cu I-‘. Sample matris 99 was laboratory-deionized water: sample matris 29 was taken from the South Platte River near Roscoc, NE, U.S._A.: sample mntris 31 was taken from the Republican River near Orleans, NE, U.S.A.: ancl sample matrk 70 was taken from the Big Blue River near Seward, AK, U.S.A.
I I I I
-0.8 -0.6 -0.4 -0.2 0.0
E applied [VI
Fig. 5. Standard dditions determination of thallium at the m.f.e. (n) SRWS 67; (b) SR\VS
67 i 3.6 fig ?‘I l-‘;(c) SRWS 67 t 7.6 JJ~TI l-l;(d) SR\VS 67 i 11.4 ~g”rl I-‘. Conditions
are specified in the procedure section.
Data in Table 3 give the best estimate of accuracy of t1~cd.p.a.s.v. methods compared to independent thallium determinations by several laboratories using c.t.a.a.a. \\:ithin the specified error of that most probable concentra- tions, the results obtained in our laboratory with the two d.p.as.v. methods and an c.t.a.a.a. method are indistinguishable from the most probable con- centrations (also obtained by e.t.a.a.a.). Thus, no bias is evident for thallium determinations in this concentration range by the three methods, and the relative accuracy of both d.p.a.s.v. methods is seen to be at least equivalent. to e.t.a.a.a.
The most meaningful estimate of attainable precision of the d.p.a.s.v. methods is illustrated by replicate thallium determinations on a representa- tive sample over a long time period. The most recently issued Standard Rcfercncc \\‘ater Sample containing thallium, SR\VS 69, was chosen to demonstrate the replicate precision of the method. Ten thallium determina- tions in SK\I’S 69 were carried out over a period of two months on random days, using the 1n.f.e. method here described. The mean concentration of thallium in SK\!% 69 was found to be 0.59 ?: 0.04 pg 1-l (k’i% relative stan- dard deviation), \vhich illustrates that excellent precision may be obtained wet1 at thallium concentration levels accessible only to the d.p.a.s.v. tcch- nique. The cooperating laboratory data for thallium in SR\\‘S 69 were not used in the accuracy assessment above, because only one other laboratory provided thallium determinations.
255
Techniques of quantification Three techniques of quantification available for d.p.a.s.v. determinations
are standard cuxve, st;indard additions, and internal standard. I<ach of these techniques has been discussed widely [ 28, 36]_ The standard curve technique is the least time-consuming, however, at present its use in this application would be impractical. The efficiency of the deposition and stripping steps are dependent on cell geometry, electrode placement, solution viscosity, temperature, ionic strength and several other factors. It is not possible at present, to reproduce the experimental conditions well enough to obtain suitable accuracy of determination between standards and samples. Further- more, analytical characteristics of the m.f.e. change slowly with time, which would make frequent restandardization necessary.
The internal standard approach offers a tempting alternative to standard additions, because of its ease and rapidity [ 361. This approach, however, relies on the assumption of similar chemical behavior of both analyte and internal standard clement.. Thallium is probably present in both the .I 1 and +3 osidation states in natural waters [ 121, and is relatively unaffected hy the EDT;\ ligand. It is unlikely that a similar internal standard element, determinable by d.p.a.s.v. under these conditions, could be found.
The present investigations showed that the standard additions technique gives satisfactory analytical results for thallium determinations in a wide variety of natural water matrices, and is the technique of choice for best accuracy and precision of determination.
Applications ‘I’he d.p.a.s.v. metllod described here is bcillg used for routine thallium
determinations in natural water samples submitted to the IJS. Geological Survey Central Laboratory (Denver). This method has also been used to investigate the occurrence of thallium in several samples of atmospheric deposition waters (wet and dry precipitation) collected by the U.S. Geological Survey’s precipitation monitoring network. The results of this investigation will appear elscwl~ere [ 43) _
This work was pre.sent.44 in part at the 30th Pittsburgh Conference on Analytical Chemistry and Applied Spectroscopy, Cleveland, Ohio, U.S.A., in hlarch 1979. The assistance of Mr. Gary Perryman on the c.t.a.a.a. thallium determinations is gratefully acknowledged.
REFIXENCES
1 L. II. Keith and \i’. _A. Tcllinrd. Environ. Sci. Technol.. I3 (1979) 4 16.
f? I. C. Smith and Is. L. Carson, Trace i\letalr in the Ilnvironment, Vol. 1 Thallium, Ann Arbor Science, Ann Arbor, 19i7, p. 36.
3 I\. D. nlntthcws and J. P. Riley, Anal. Chim. Xctr?, 48 (1969) 25.
:I D. F. C. Morris and R. A. Killick,‘I’alanta, -1 (1960) 51. 5 R. L. Rrown, hl. L. Jacobs and 11. E. Taylor, Am. Lab., 4 (November 1979) 29.
6 R. L. Davison. D. F. S. Natusch, J. R. Wallace and C. A. Kvnns, Jr., Environ. Sci. Technol., S (1974) 1107.
7 G. P. Sighinolfi. At. Ahsorpt. NewsI., 12 (19i3) 136. S A. S. Curry, J. F. Read and A. I~. Knott, Analyst, 94 (1969) ‘744. 9 C. It. Parker, \Vatcr r\nalysis by Atomic Absorption Spectroscopy, Varian Techtron.
London, X972, p. 20,3_3. 10 D. 31. Shaw, Geochim. Cosmochim. Acta, 3 (1962) 116. 11 E. L. Kothny, Analyst, 94 (1969) 196. 12 G. E. Batley and ‘I’. hl. Florence, J. Elcctroanal. Chcm., 61 (1975) 205. 13 L. V. Shcvchenko. V. P. Portretnyi and V. ‘1’. Chuiko, J. ?\nal. Chem. USSR. 32
(1977) 14.16. 1-I R. Neeb. Frcsenius 2. Anal. Chem., 190 (1962) 96. 13 J. Dicker and W. E. Van der Linden, Frcsenius%. Anal. Chem., 271 (1975) 97. 1 (i V. %itko, \V. V. Carson and \V. G. Carson, Bull. Environ. Contam. Tosicol., 13 (19;s)
23. l’i F. \‘ydra, K. Stulik and E. Julakova, Electrochemic;ll Stripping Analysis, Ellis iforwood,
Chichester zmtl fialstetl Press, J. \Viley. New York, 1976, p. 203. IS J. 8. Ftato, Anal. Chcm., 41 (1972) 56.4. 19 T. R. Copekxnd, .I. l-l. Christie, R. A. Osteryoung and R. K. Skogerhoc, Anal. Chcm.,
45 (19i3)3-171. 20 U. Kisncr and 11. .I. Ariel, J. Electroanal. Chem., 11 (1966) !?G. 21 I>. 1. I.evit, =\nal. Chcm.. -15 (19i3) 1291. 2’1 +J. P. Franke, P. X1. J. Coenegmcht and R. X. de ZCCUW, Xrch. Tosicol., 3.1 (19f5) 13-i. 23 I,. >lcitcs, I’olarogrophic’rcclrniqucs, J. Wley, Xew York, 1965, p. 69. 2-i I?. &own, XI. W. Skou~taci and %\I. J. Fishman. Tcclrniqucs of Water Ibsources Inwsti-
Rations of the U.S. Geological Survey, : \lcthods for Collection and :\n;llysis of Water Samples for Dissolved Xlinernls anti Cnscrs, Book 5, U.S. Gowrnment Printing Office, \Vashington, DC, 19’70, Chapter :\ 1.
35 II. A. Ostcryoung and J. II. Christie, .- trial. Chcm., 46 [ 19:.t) 351. 26 .I. P. Frank, It. X. de %eeuw and R. ftakkcrt. :\n:rl. Chem.. 50 (19i8) 137.1. '2i K. I,. Ratzlaff. i\nal. Chem., 51 (1959) 232. ?S I:, I~;lrendrccht. in .A. J. Bard (Ed.). Electroanalytical Chemistry, Vol. 2, 31. Dekkcr,
Six York, 1960, p. 53. 29 G _ E. B&Icy and 1‘. Xl _ Florence, J. E:lettroanal. Chtm.. 55 (197.1) 33. 30 It. Sceh. Fresenius Z. Anal. Chr?m., 171 (1959) 331. ?I ‘I’. It. Copclnnd. .I. Il. Christie, R. K. Skogcrboe and R. 11. Ostcryoung, ,\nal. Chcrm.,
45 (13’13) 995. 32 Xi. Stulikova. .J. Elcctroan~l. Chcm.. 4S (1973) 33. 33 Analytical Methorls for Atomic Absorption Spectrophotomctry Usitll.! the ffG;\
Graphite Furnace, Pcrkin-Elmer, Nonvnlk, Connecticut, 197’i. 3.i It. K. Skojierhoc, in J. A. Dean and ‘I’. C. Rains (Eds.). Flame Emission and htomic
Ahsorption Spcctromctv, Vol. 1, >I. Dekkcr, XCW York, 1969, Chapter 13. 35 E. ‘I’cmmcrmcln ant! I’. Verbcck. J. Electroanal. Chem.. 19 (1966) -123. 36’I‘. It. Copekmd. It. A. Ostet-young and It. K. Skogerhoc, t\nnl. Chwn.. -1G (197.1) 3-093. 37 ‘i’. ft. Copcl.znrl and JZ. K. Skogerhoc. _ e\nnI. Chcm.. 46 (397-t) 125iA. 35 .J. D. Ilem, Study and Intcrpretntion of the Chemical Characteristics of Natural ivater,
2nd win.. Ccological Survey Watcr.Supply Paper 1.173, U.S. C.overnmcnt Printing Off~cc, \\‘ashington, DC, 1970, p. 202.
3’3 .J. E. I~onclli, 12. Ii. Skogerlwc anti Ii. E. ‘I’clylor, Annl. Chim. :\ctn, 101 (1376) .t37. .iO .\I. :\&I, U. Eisncr and S. C;ottcsfeld. J. Electroanal. Chcm., 7 (196-1) 307. -8 1 ;\I. \V. Skougstad and ,\I. ,J. Fishman, in Proceeding of the AWWA Water Quality Tech-
nology Conference, :~mtrricnn Water Works I\ssoci;ltion, Ilenvcr, 1975, p. XIX--l. -I2 B. Ostle. Statistics in Rcscrtrch, The IOWZI State University I’ress, i\mcs, 1963, p. 1iO. -13 J. I<. Bonclli, I,. .I. Schrotlw, R. K. Skogcrhoe and II. E. Taylor. _Atmos. Environ..
in press.


![Ti cpractico1[1] bonelli, irrazabal](https://static.fdocuments.net/doc/165x107/5598aba41a28abc43f8b46d2/ti-cpractico11-bonelli-irrazabal.jpg)