Contradictions in social enterprise - Sheffield Hallam University
Upload
julius-carrCategory
view
218download
0
Benchmarking and the NSS
Jason LemanEducation ResearcherSheffield Hallam University

Variation within institution
The "student experience"? Differences in expectations and prior ability Differences in course within JACS Differences in elective choices within
course Differences in course-mates and academic
groups Differences in support needs and goals Differences in question interpretation and
response Differences in what part of their experience
the student thinks about when filling in the questionnaire
Variation within institution
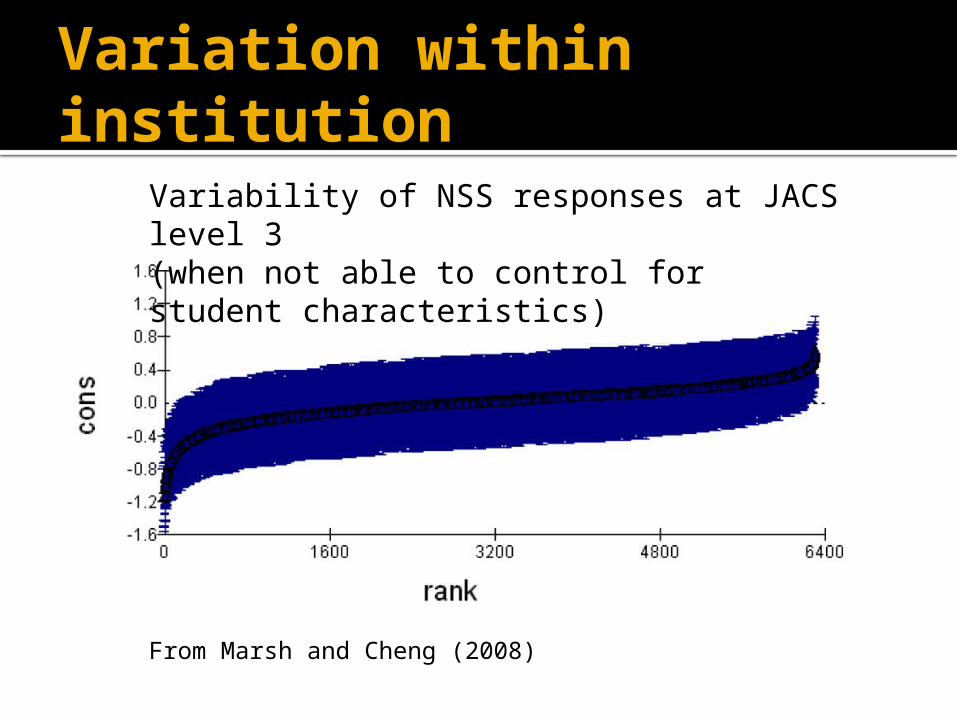
From Marsh and Cheng (2008)
Variability of NSS responses at JACS level 3(when not able to control for student characteristics)

Variation across the sector
Are differences across the sector in NSS scores due to institution type or actual quality?
-15%
-10%
-5%
0%
5%
10%
15%
1 2 3
4
5
6
7
8
9
10
11
12
13
1415
16
17 18
1920
21
22
NSS Question
Diff
ere
nce
betw
ee
n P
ost
92
U
niv
ers
itie
s A
llia
nce
a
nd
Ru
s-
se
ll G
rou
p (
20
08
-20
10
)
Re-sources
Feedback
Support Organisa-tion
Teaching Development
Assessment

Variation across the sector
100 150 200 250 300 350 400 450 50050%
60%
70%
80%
90%
100%Computer Science
100 150 200 250 300 350 400 450 50050%
60%
70%
80%
90%
100%Accounting
% a
gre
e t
each
ers
are
en
thu
sia
sti
c
Average Tariff of Entry

Variation across subjects
Within the JACS 3 code, accounting has an average of three different course titles per institution, computer science has ten
Rati
o o
f ti
tles t
o in
sti
tuti
on
s
-.200 -.100 .000 .100 .200 .300 .400 .500 .6000
2
4
6
8
10
12
Account-ing
Computer Science
Correlation between Overall Satis-faction and tariff

Variation across subjects
All
Subje
cts
His
tory
Bio
logy
Englis
h s
tudie
s
Acc
ounting
Law
Psy
cholo
gy
Ele
ctro
nic
and E
lect
rica
l Engin
eer-
ing
Nurs
ing
Soci
olo
gy
Sport
s Sci
ence
Alli
ed t
o M
edic
ine
Tra
inin
g T
each
ers
Busi
ness
stu
die
s
Com
pute
r Sci
ence
Media
stu
die
s
Soci
al W
ork
Fine A
rt
Desi
gn s
tudie
s
50%
60%
70%
80%
90%
% Average overall satisfaction (NSS 2010) for all HEIs, by subject

Variation across questions
Assessment
Feedback
Support
OrganisationResource
Develop
Overall
0
0.25
0.5
0.75
1
Correlation between Teaching and other factors on the NSS (Marsh and Cheng 2008)

Variation across questions
100 150 200 250 300 350 400 450 500 550 60030
35
40
45
50
55
60
65
70
75
80Detail of feedback
Average tarrif100 150 200 250 300 350 400 450 500 550 600
30
35
40
45
50
55
60
65
70
75
80
85Communication skills
development
Average tarrif

What variation means for us There are consistent differences in how
students respond to the NSS between groups of students, institutions, and subject areas;
What a JACS subject title such as "computer science" refers to, varies across the sector;
Different questions relate to different experiences and pedagogical practice, although not necessarily in ways we can simply interpret;
When benchmarking we either have to look at institutions that are teaching similar students, similar subjects in similar ways…
…or be very aware of the differences.

Compared to whom?

Comparators and the institution
Question
Million+Post92
Universities Alliance
Russell Group
The Teaching on My Course
1. Staff are good at explaining things. 1.8% -0.7% -3.7%
2. Staff have made the subject interesting. 1.1% -0.9% -4.2%
3. Staff are enthusiastic about what they are teaching. 1.5% -1.5% -5.0%
4. The course is intellectually stimulating. 0.3% -2.0% -10.0%
Assessment and Feedback
5. The criteria used in marking have been clear in advance. -0.4% -1.2% 6.4%
6. Assessment arrangements and marking have been fair. 0.6% -0.9% -1.8%
7. Feedback on my work has been prompt. -0.1% -2.1% 0.2%
8. I have received detailed comments on my work. -2.3% -3.9% 7.7%
9. Feedback on my work has helped me clarify things I did not understand.
-3.8% -3.3% 3.7%
Difference between one institution's NSS scores and three University groups. Note the consistent difference around teaching factors and feedback. We can hypothesise that these differences are due to consistent differences in pedagogy, student type, and subjects taught at these different groups.

(A digression)
10 20 30 40 50 60 70 80 9030
40
50
60
70
80
90Bishops
Grosseteste
Cambridge
Imperial
LMU
Winchester
Average perceived class size (HEPI 2007)
% s
ati
sfi
ed
wit
h d
eta
il o
f fe
ed
back (
NSS
)

Competitors and the subject
Question
Competitors
Comp
averageSHU 2010 to
CompRank
13
Organisation and Management
The timetable works efficiently as far as my activities are concerned.
81% -13% 8 of 8
14Any changes in the course or teaching have been communicated effectively.
68% 10% 3 of 8
15The course is well organised and is running smoothly.
64% 5% 3 of 8
22 Overall Overall, I am satisfied with the quality of the course. 79% 7% 2 of 8
Key:
Significant positive difference or trend
Significant negative difference or trend
Sample or expected response too low for robust statistical test
Institutions have been selected based on levels of 2009 applications and if they have reported in 2010 for this subject group. The last three years of results from selected competitor institutions have been used to create the sector comparison score, weighted by response. This is to provide a relatively stable benchmark against which SHU can be compared with against over time.
Scores compared to a group of competitor institutions. Competitors have been selected on the basis of cross applications. This guarantees a level of similarity with regard to subject, and also makes it likely that those institutions will report for that particular subject (unlike a University wide comparator list)
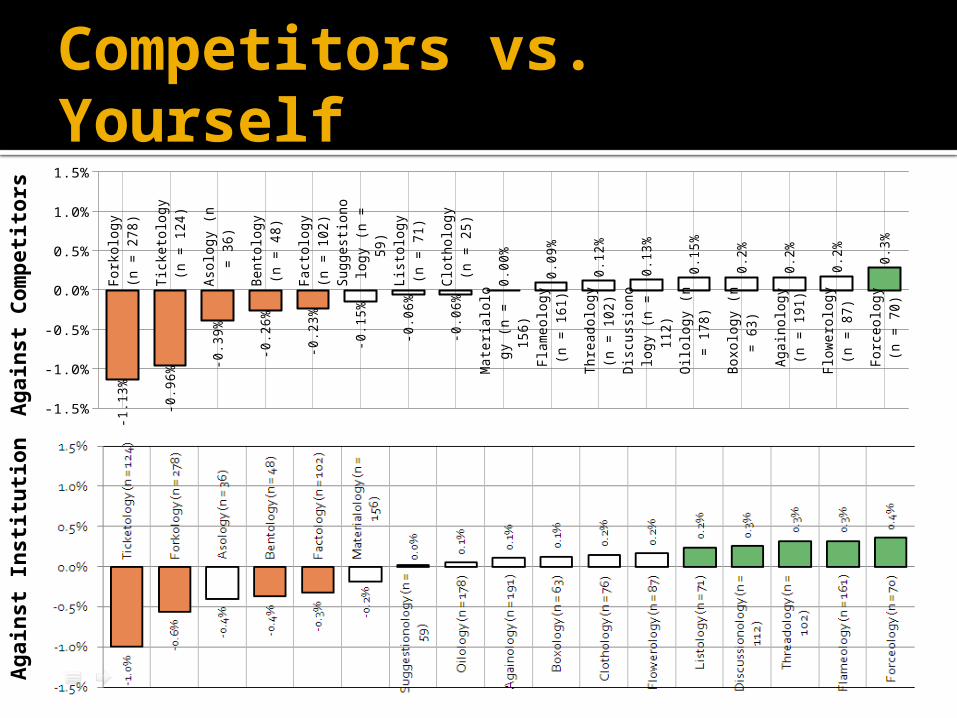
Competitors vs. Yourself
-1.5%
-1.0%
-0.5%
0.0%
0.5%
1.0%
1.5%
-1.1
3%
-0.9
6%
-0.3
9%
-0.2
6%
-0.2
3%
-0.1
5%
-0.0
6%
-0.0
6%
0.0
0%
0.0
9%
0.1
2%
0.1
3%
0.1
5%
0.2
%
0.2
%
0.2
%
0.3
%
Fo
rko
log
y (
n
= 2
78
)
Tic
ke
tolo
gy
(n =
12
4)
Aso
log
y (
n
= 3
6)
Be
nto
log
y
(n =
48
)
Fa
cto
log
y (
n
= 1
02
)
Su
gg
es-
tio
no
log
y (
n
= 5
9)
Lis
tolo
gy (
n
= 7
1)
Clo
tho
log
y
(n =
25
)
Ma
teri-
alo
log
y (
n
= 1
56
)
Fla
me
olo
gy
(n =
16
1)
Th
rea
d-o
log
y (
n
= 1
02
)D
iscu
s-si
on
olo
gy (
n
= 1
12
)
Oilo
log
y (
n
= 1
78
)
Bo
xo
log
y (
n
= 6
3)
Ag
ain
olo
gy
(n =
19
1)
Flo
we
rolo
gy
(n =
87
)
Fo
rce
olo
gy
(n =
70
)
Ag
ain
st
Com
peti
tors
Ag
ain
st
Insti
tuti
on

Navel gazing with trends
QuestionTrends
2009 to 2010 2008 to 2009 2008 to 2010
5
Assessment and Feedback
The criteria used in marking have been clear in advance.
4% 5% 9%
6Assessment arrangements and marking have been fair.
0% 11% 11%
7 Feedback on my work has been prompt. 3% 5% 8%
8 I have received detailed comments on my work. 1% 14% 15%
9Feedback on my work has helped me clarify things I did not understand.
-1% 14% 13%
22 Overall Overall, I am satisfied with the quality of the course. 3% 14% 17%
Key:
Significant positive difference or trend
Significant negative difference or trend
Sample or expected response too low for robust statistical test
Trends over time alongside a test of significance.Trends can be a useful way of gauging performance against yourself. Tests of significance are important in reducing the likelihood subject areas will react to random variation in student responses. For stable courses trends may be the most relevant benchmark of all, but in themselves might not be a motivator for action.

Identifying priority issues
-100.0%
-80.0%
-60.0%
-40.0%
-20.0%
0.0%
20.0%
40.0%
60.0%
List
olo
gy
Ofo
logy Clo
tholo
gy
Bri
dgeolo
gy
Guid
eolo
gy
Bodyolo
gy
Deepolo
gy
Ric
eolo
gy
Past
eolo
gy
Such
olo
gy
Mate
rialo
logy
Bro
thero
logy
Key:
Overall satisfaction
Development
Resources
Organisation
Support
Feedback
Assessment
Teaching

What are we doing this for?
"What best predicts educational gain is measures of educational process: what institutions do with their resources to make the most of whatever students they have …
In the UK we have few data about the prevalence of these educational practices because they are not systematically documented through quality assurance systems, nor are they (in the main) the focus of the National Student Survey.
Class size, the level of student effort and engagement, who undertakes the teaching, and the quantity and quality of feedback to students on their work are all valid process indicators. There is sufficient evidence to be concerned about all four ofthese indicators in the U K." Gibbs 2010
Conclusions
We need to benchmark with similar institutions to identify areas of concern;
Tests of significance need to be used, to reduce the impact of random variation;
The focus on reporting the NSS should be on raising questions, answered through more sophisticated evidence;
The prime use of the NSS should be as a lever for implementing known good educational practice.