
Jason Hartog Use of POAMA in...
25
Transcript of Jason Hartog Use of POAMA in...

Acknowledgements
• CSIRO
• Alistair Hobday
• BOM
• Claire Spillman
• Debbie Hudson
• Oscar Alves
• POAMA team

Use of Forecasting in aquaculture
Weatherforecasting
Seasonal forecasting
Climateforecasting
1-5 days Weeks to months Decades to centuries
Wha
t to
wea
r
Far
m m
aint
enan
ce
Har
vest
tim
e
Wha
t env
ironm
ent
for de
scen
dent
s
Equ
ipm
ent p
urch
ase
Pon
d co
nstruc
tion
Far
m lo
catio
n
Fee
d cy
cles
Sto
ckin
g tim
eLa
bour
nee
ds
Sel
ectiv
e br
eedi
ng
Aer
ator
s
• Future environmental information can aid decision making
Fee
d m
anag
emen
t
(am
ount
and
type
)
Hobday unpublished
Planning timescales

Business case for seasonal forecasting
• Seasonal timescale (1-4 months) is useful for managers• Range of decisions made on this time scale
• Provides an early window for implementation of management strategies to minimise impacts
• Not all decisions can be made instantly – e.g. stocking date
• Business performance could be improved with predictions about the future• Match growth/harvest to market needs
• Anticipation of climate variability and change is proactive adaptation• Preparing for longer time scales too
• Better managed marine resources have improved resilience under climate change
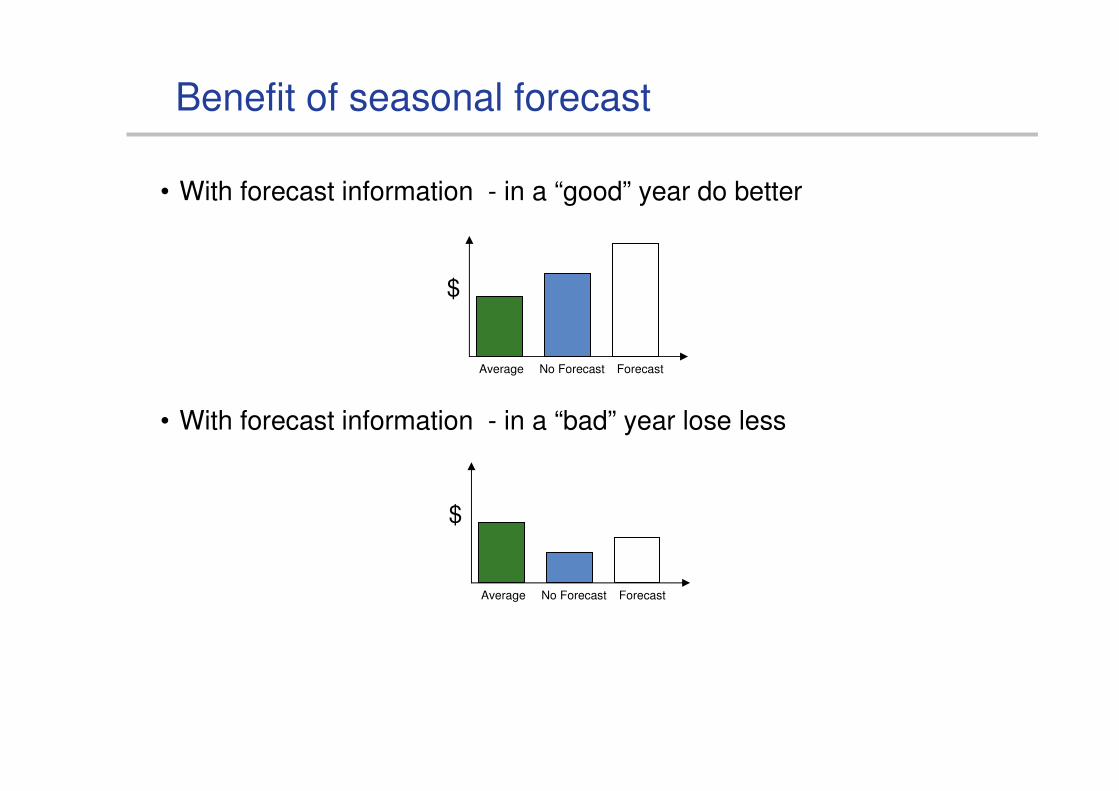
Benefit of seasonal forecast
• With forecast information - in a “good” year do better
• With forecast information - in a “bad” year lose less
Average
$
ForecastNo Forecast
Average
$
ForecastNo Forecast

Who is using POAMA based seasonal forecasts?
• Tuna (Eastern Australia) • Fishery managers zone fishing areas
• Hobday et al 2010; 2011
• Atlantic salmon (Tasmanian) • Summer water temperature
• Prawn (Queensland) • Rainfall and air temperature
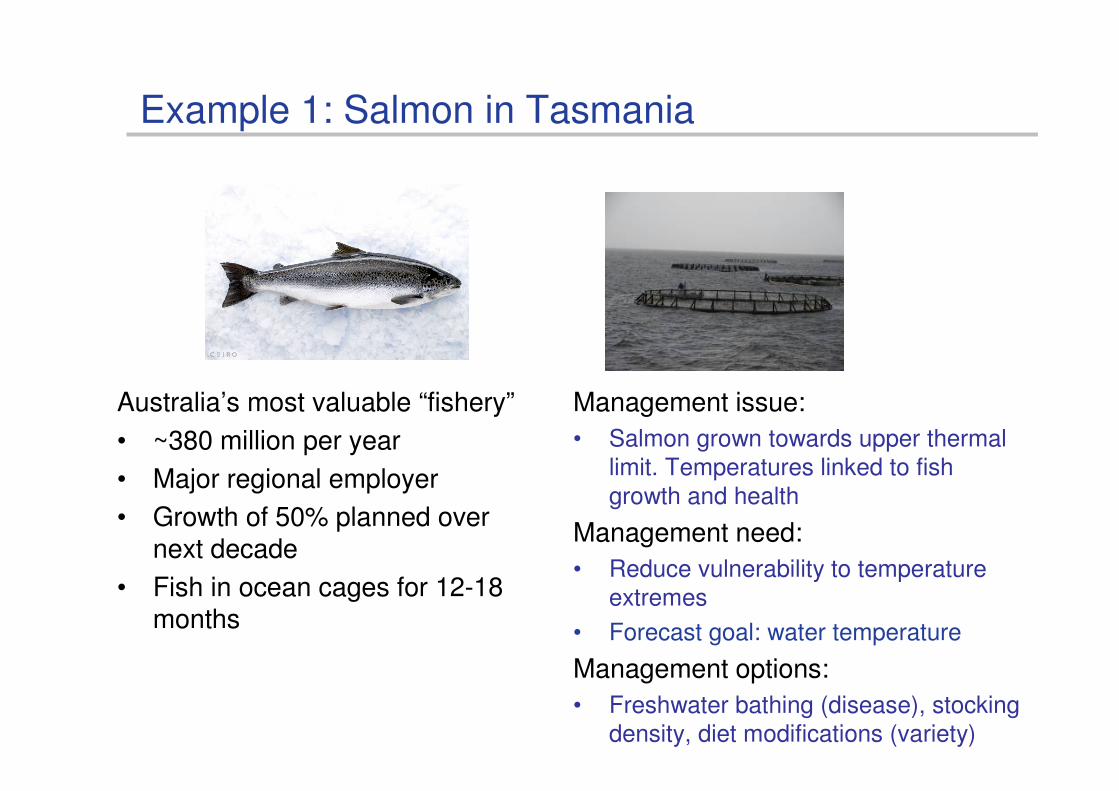
Management issue:
• Salmon grown towards upper thermal limit. Temperatures linked to fish growth and health
Management need:
• Reduce vulnerability to temperature extremes
• Forecast goal: water temperature
Management options:
• Freshwater bathing (disease), stocking density, diet modifications (variety)
Example 1: Salmon in Tasmania
Australia’s most valuable “fishery”
• ~380 million per year
• Major regional employer
• Growth of 50% planned over next decade
• Fish in ocean cages for 12-18 months
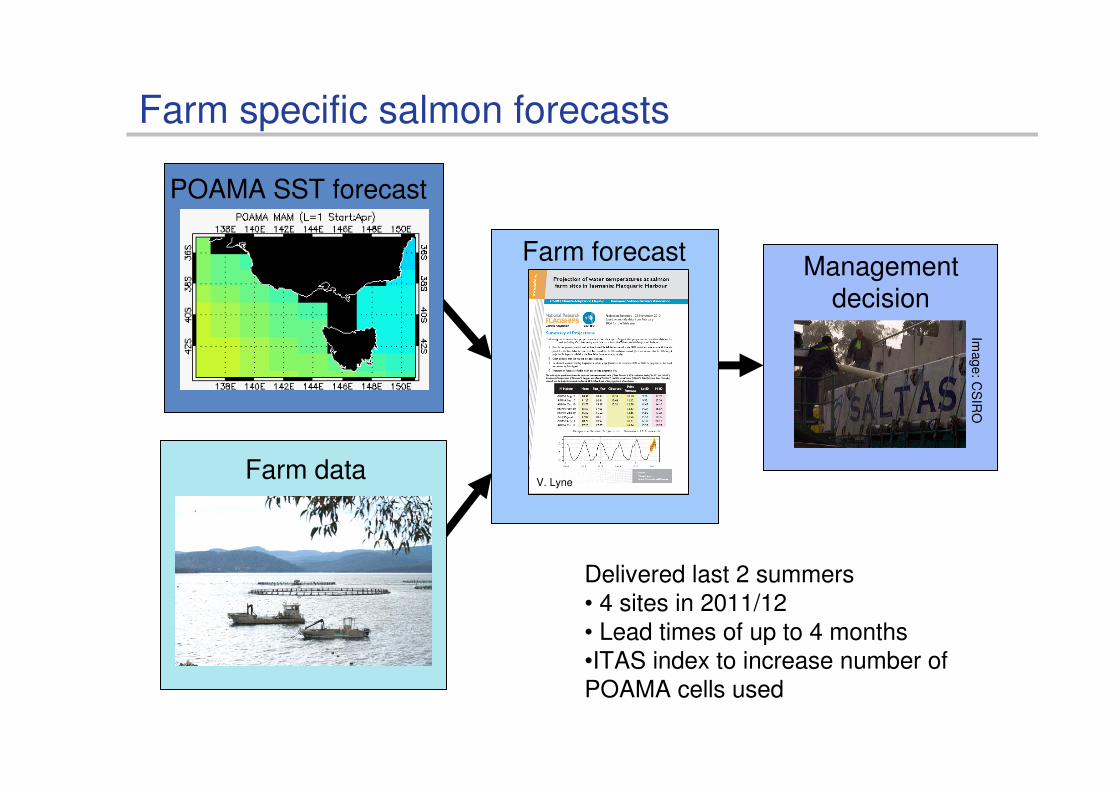
Managementdecision
POAMA SST forecast
Farm specific salmon forecasts
Farm forecast
Farm data
Image: C
SIR
O
V. Lyne
Delivered last 2 summers• 4 sites in 2011/12• Lead times of up to 4 months•ITAS index to increase number of POAMA cells used

Example 2: Southern Bluefin Tuna Habitat
Management issue:
• SBT quota managed fishery
Management need:
• Restrict interactions with SBT to fishers that hold quota
Management options:
• Partition fishery into zones:
• Core SBT habitat – quota and observers
• Buffer – limited quota and random observers
• OK – no quota, observers as part of regular ETBF observer program

Predicting tuna habitat for spatial fisheries management using electronic tags and ocean models
Managementdecision
+
Habitat preferences
3D ocean info
Habitat prediction
Hobday and Hartmann (2006)Hobday et al 2009Hartog et al, in reviewHobday et al, in review
Southern Bluefin Tuna Habitat

Jan Apr Jul Oct Jan-42
-40
-38
-36
-34
-32
-30
-28
-26
-24
Month
Latitu
de
Scenario 1 Core and Buffer Zone Edges
Buffer Zone Climatology (1994-2011)
Buffer Zone 2012
Maximum Extent Any Year
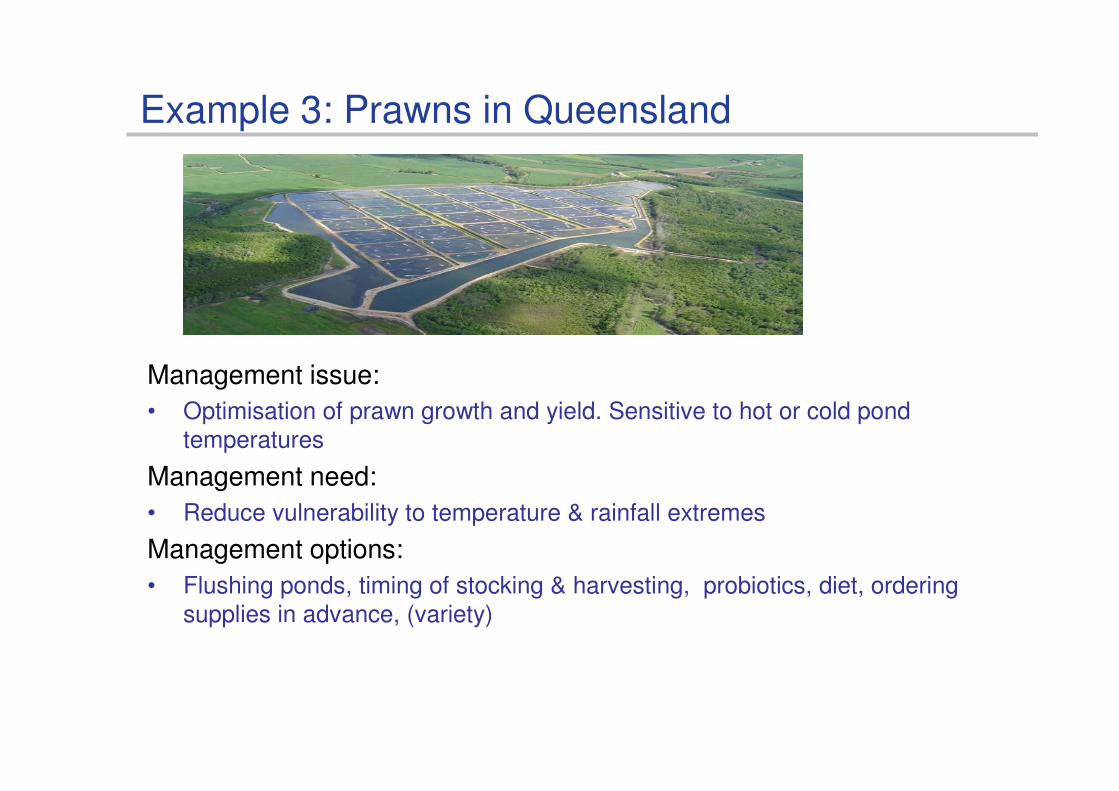
Example 3: Prawns in Queensland
Management issue:
• Optimisation of prawn growth and yield. Sensitive to hot or cold pond temperatures
Management need:
• Reduce vulnerability to temperature & rainfall extremes
Management options:
• Flushing ponds, timing of stocking & harvesting, probiotics, diet, ordering supplies in advance, (variety)

Australian prawn farming industry
• Farms located in New South Wales and Queensland.
• Produces more than 4,000 tonnes (2009) of product annually
• Farm gate value ~ $70 million.
• Provides more than 1000 direct jobs and 1800 indirect jobs.
• The Australian industry is one of the smaller volumetric producers in the world but leads the world in productivity with an average yield of more than 8,000 kg per hectare.

Managementdecision
POAMA forecasts
Prawn forecasts
Local data
Project began late 2011
Farm forecasts
Methods: Developing targeted forecasts for prawn farms
• Identified environmental variables that matter to prawn farmers
• Rainfall, max and min temperature
• Investigated time series from prawn farms (Temp)
• Long period is needed to develop strong relationship
• Used a seasonal forecast model
• Test model for these variables over Queensland at lead-times (1-4 months ahead of today)
• Test model for projecting local weather station (long local time series)
• Test relationship between local weather and prawn pond conditions
• Generate forecasts at national, regional, and local (farm) scale
• Deliver via web for national to regional forecasts
• Deliver via “email” for local scale forecasts for selected farms

Results: Prawn forecasts – national to local scale
• http://poama.bom.gov.au/marine_mw/prawn_project.shtml
National scaleRegional scale
Other links

A. National scale forecasts
(also tropical cyclones – updated in October)
ENSOLikely to be slight El Nino
(plumes representdifferent model runs)

B. Regional forecasts
Select here

Weeks 1 & 2
Rainfall Maximum air temperature

Weeks 3 & 4
Rainfall Maximum air temperature

C. Local forecast: down-scale from regional
QLD 1
QLD 2
QLD 3
POAMA -> Region (AWAP) -> Local (closest weather station)
Replace with farm
Replace with farm
Min Temp
Max Temp
Mossman Cardwell
Ayr
MackayGC

Rainfallabove the upper tercile
Fortnight 1
Fortnight 2
Month 1
(for 10-31 day leads)
Season 1
(for 10-31 day leads)
Tminbelow the lower tercile
Tmaxabove the upper tercile
KEY: INDEX REGIONS
N_QLD
C_QLD
S_QLD
Note: Tmax,Tmin, & rainfall are area-averaged over the index regions and then the skill is determined
N_QLD = 0.75 C_QLD = 0.75S_QLD = 0.74
N_QLD = 0.73C_QLD = 0.71S_QLD = 0.69
N_QLD = 0.70C_QLD = 0.72S_QLD = 0.71
N_QLD = 0.64 C_QLD = 0.62S_QLD = 0.62
N_QLD = 0.63C_QLD = 0.62S_QLD = 0.60
N_QLD = 0.62C_QLD = 0.62S_QLD = 0.62
N_QLD = 0.64C_QLD = 0.63S_QLD = 0.67
N_QLD = 0.64C_QLD = 0.63S_QLD = 0.59
N_QLD = 0.62C_QLD = 0.61S_QLD = 0.65
Verification data: BoM AWAP
N_QLD = 0.69C_QLD = 0.68S_QLD = 0.71
N_QLD = 0.65 C_QLD = 0.64S_QLD = 0.62
N_QLD = 0.68C_QLD = 0.67S_QLD = 0.66
Accuracy score
(all months 1981-2010)
Can POAMA forecast AWAP historical?

Example targeted farm report
Maximum Air Temperature (average daily max for the time period)

Engaging at a relevant timescale….
• Does thinking more about the future lead to better long term skills?
Skill in using seasonal forecasts
Long-t
erm
pla
nnin
g a
bili
ty Ho
Testing planned

Summary
• Stakeholder liaison key to understanding seasonal forecasting
• Web delivery great, but need to provide interpretation.
• How to deliver efficiently, and not lose contact / value add to product.