
Japanese Reanalysis JRA-25 and JRA-55 H. Kamahori 1, A. Ebita 2, S. Kobayashi 2, Y. Ota 2, M. Moriya...
36
Japanese Reanalysis JRA-25 and JRA-55 H. Kamahori 1 , A. Ebita 2 , S. Kobayashi 2 , Y. Ota 2 , M. Moriya 2 , R. Kumabe 2 , K. Onogi 2 , Y. Harada 2 , S. Yasui 2 , K. Miyaoka 2 , K. Takahashi 2 , C. Kobayashi 1 , H. Endo 1 , M. Soma 2 , Y. Oikawa 2 , T. Ishimizu 2 1 MRI, 2 JMA
-
Upload
randolf-simon -
Category
Documents
-
view
214 -
download
0
Transcript of Japanese Reanalysis JRA-25 and JRA-55 H. Kamahori 1, A. Ebita 2, S. Kobayashi 2, Y. Ota 2, M. Moriya...
Japanese ReanalysisJRA-25 and JRA-55
H. Kamahori1, A. Ebita2, S. Kobayashi2, Y. Ota2, M. Moriya2, R. Kumabe2, K. Onogi2,
Y. Harada2, S. Yasui2, K. Miyaoka2, K. Takahashi2, C. Kobayashi1, H. Endo1,
M. Soma2, Y. Oikawa2, T. Ishimizu2
1MRI, 2JMA
Overview of JRA-25Japanese 25-years Reanalysis
• Long range reanalysis based on JMA's operational global assimilation system
• Joint Project by JMA and CRIEPI
• Target Period : 1979-2004
• Completed in 2005
• Continued as operational JCDAS after 2005
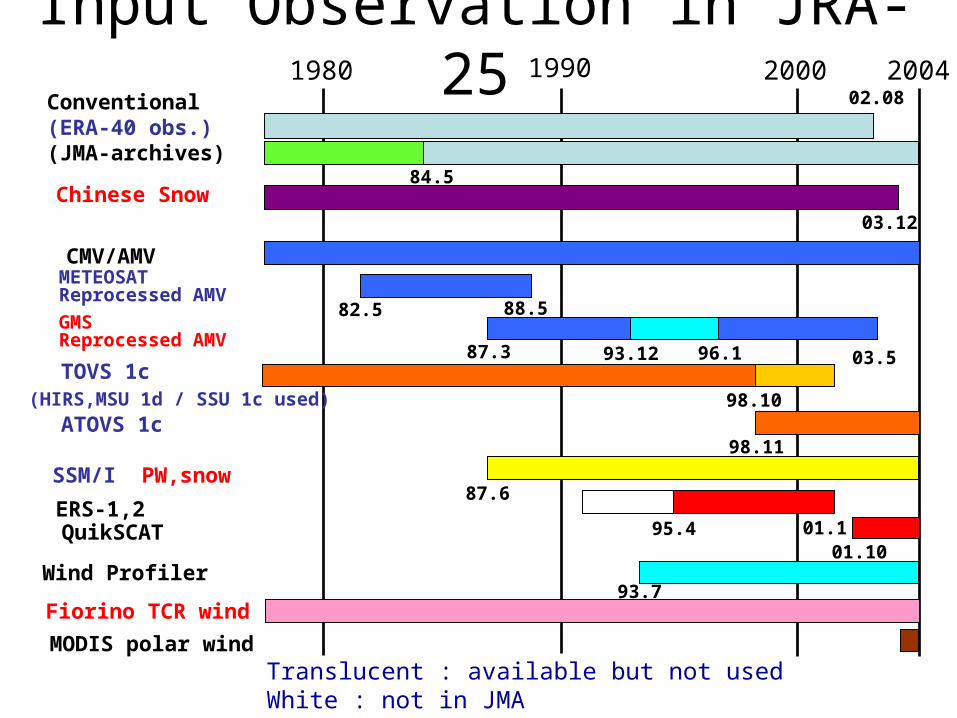
Input Observation in JRA-251980 1990 2000 2004
Translucent : available but not usedWhite : not in JMA
95.4 01.101.10
82.5
87.3
88.5
03.12
98.11
98.10
87.6
84.5
03.5
(HIRS,MSU 1d / SSU 1c used)
93.7
93.12 96.1
Conventional(ERA-40 obs.) (JMA-archives)
CMV/AMVMETEOSAT Reprocessed AMV
GMS Reprocessed AMV
TOVS 1c
ATOVS 1c
ERS-1,2QuikSCAT
Chinese Snow
SSM/I PW,snow
MODIS polar wind
Wind Profiler
Fiorino TCR wind
02.08

Performance of JRA-25
• Tropical Cyclones
• Global Temperature
• Forecast Score as initial state of JRA-25
• Global Precipitation
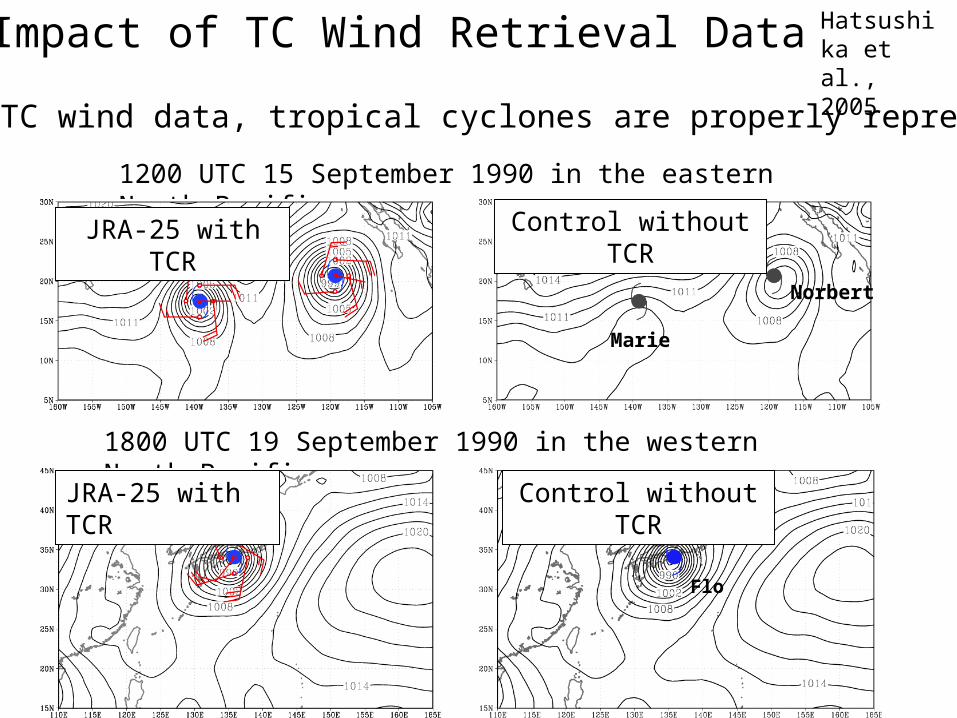
1200 UTC 15 September 1990 in the eastern North Pacific
1800 UTC 19 September 1990 in the western North Pacific
Impact of TC Wind Retrieval Data Hatsushika et al., 2005
Flo
Control without TCR
Norbert
Marie
Control without TCR
Using TC wind data, tropical cyclones are properly represented
JRA-25 with TCR
JRA-25 with TCR
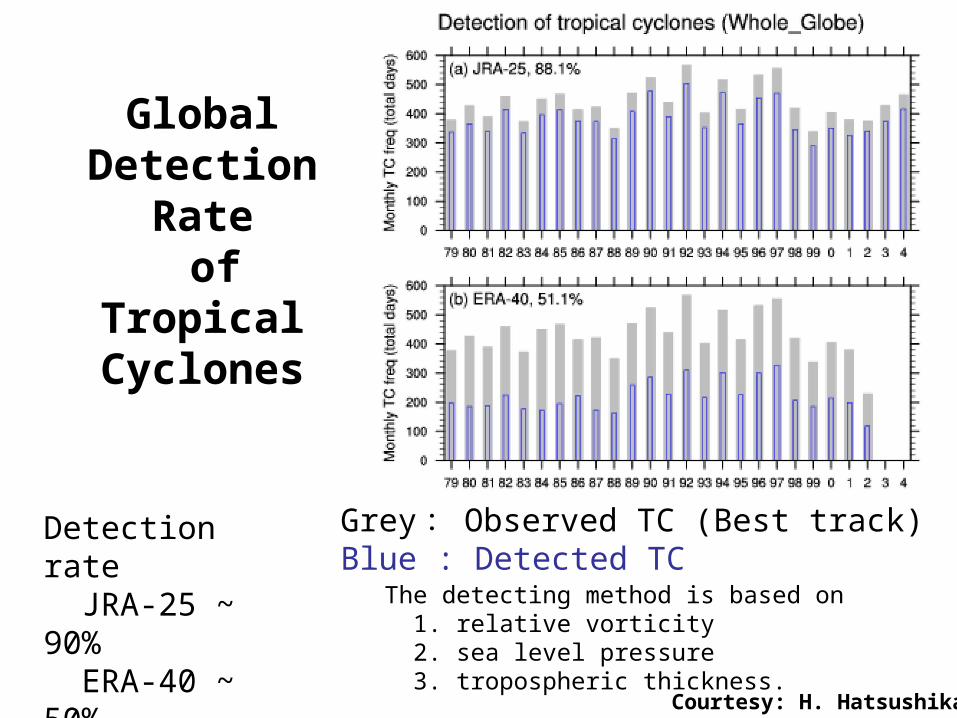
GlobalDetection
Rate of
Tropical Cyclones
Grey : Observed TC (Best track)Blue : Detected TC
Courtesy: H. Hatsushika
The detecting method is based on 1. relative vorticity 2. sea level pressure 3. tropospheric thickness.
Detection rate JRA-25 ~ 90% ERA-40 ~ 50%
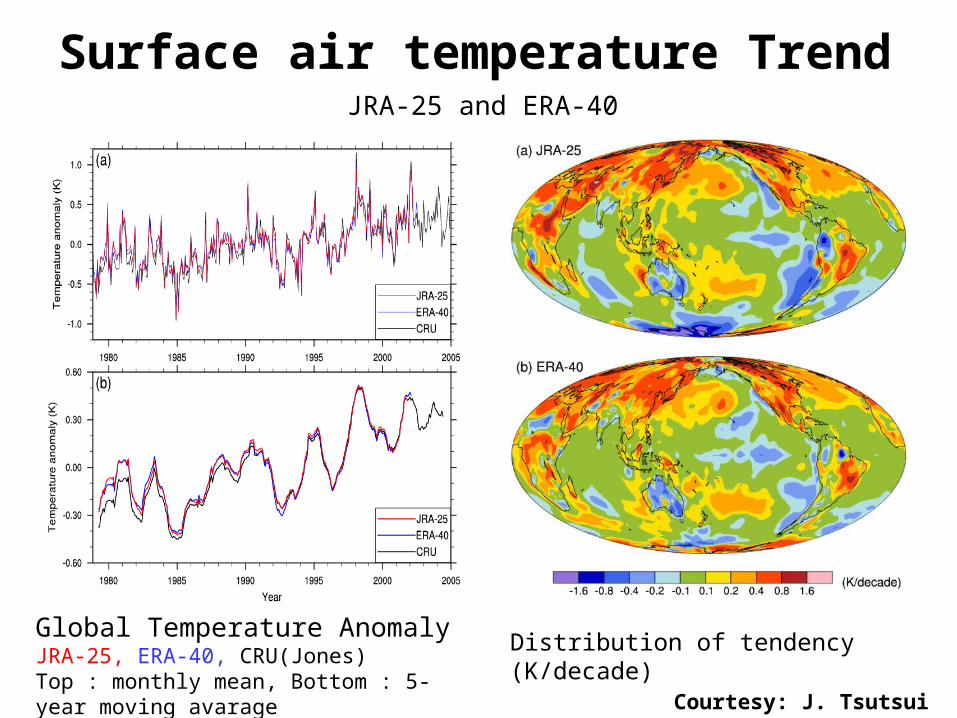
Surface air temperature Trend
Global Temperature AnomalyJRA-25, ERA-40, CRU(Jones)Top : monthly mean, Bottom : 5-year moving avarage
Distribution of tendency (K/decade)
JRA-25 and ERA-40
Courtesy: J. Tsutsui

8
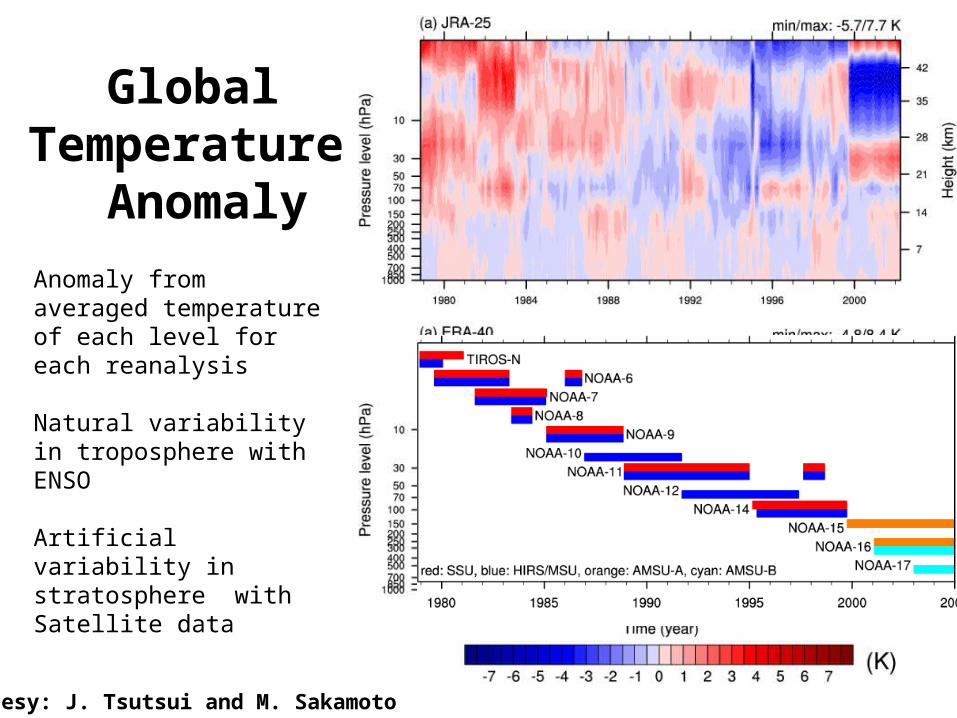
Anomaly from averaged temperature of each level for each reanalysis
Natural variability in troposphere with ENSO
Artificial variability in stratosphere with Satellite data
Courtesy: J. Tsutsui and M. Sakamoto
Global Temperature
Anomaly
year
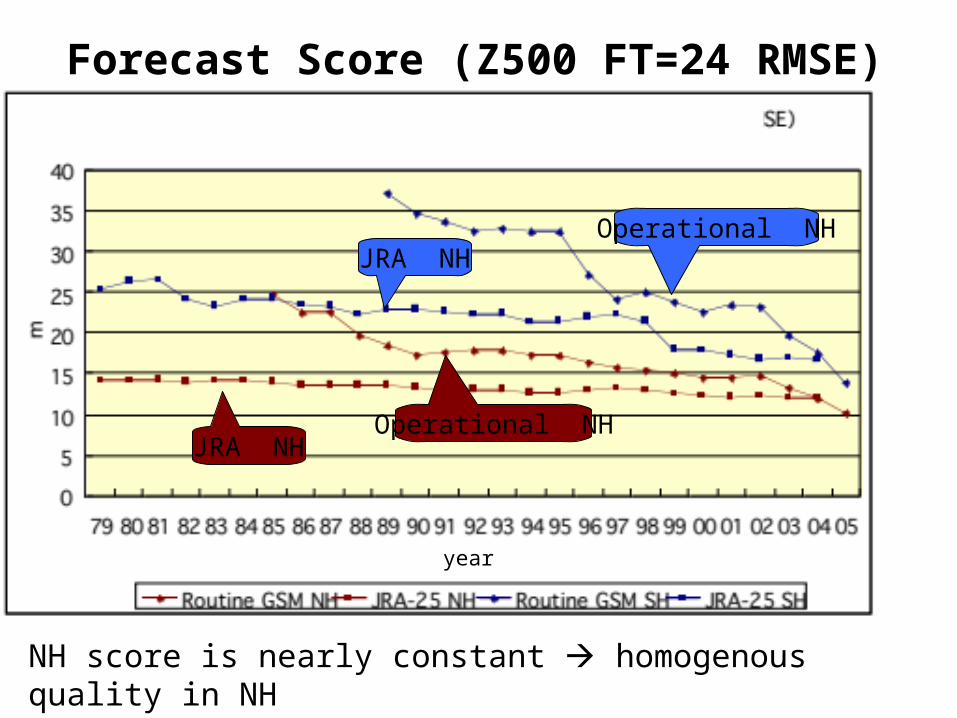
Forecast Score (Z500 FT=24 RMSE)
JRA NHOperational NH
Operational NHJRA NH
NH score is nearly constant homogenous quality in NHSH score is time dependent not homogenous in SH
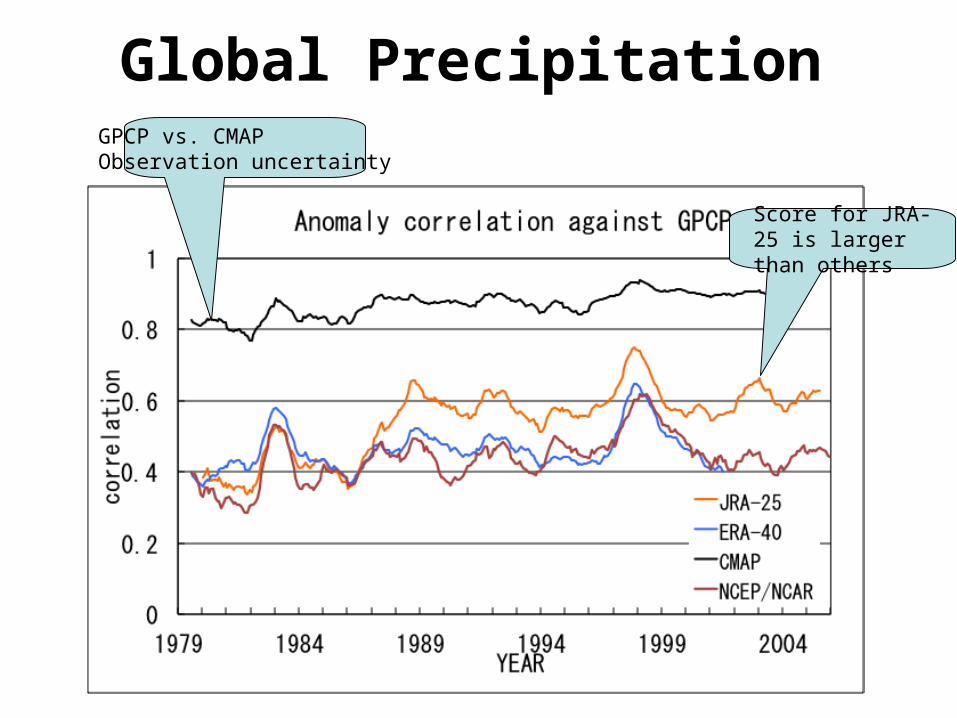
Global Precipitation
Score for JRA-25 is larger than others
GPCP vs. CMAPObservation uncertainty
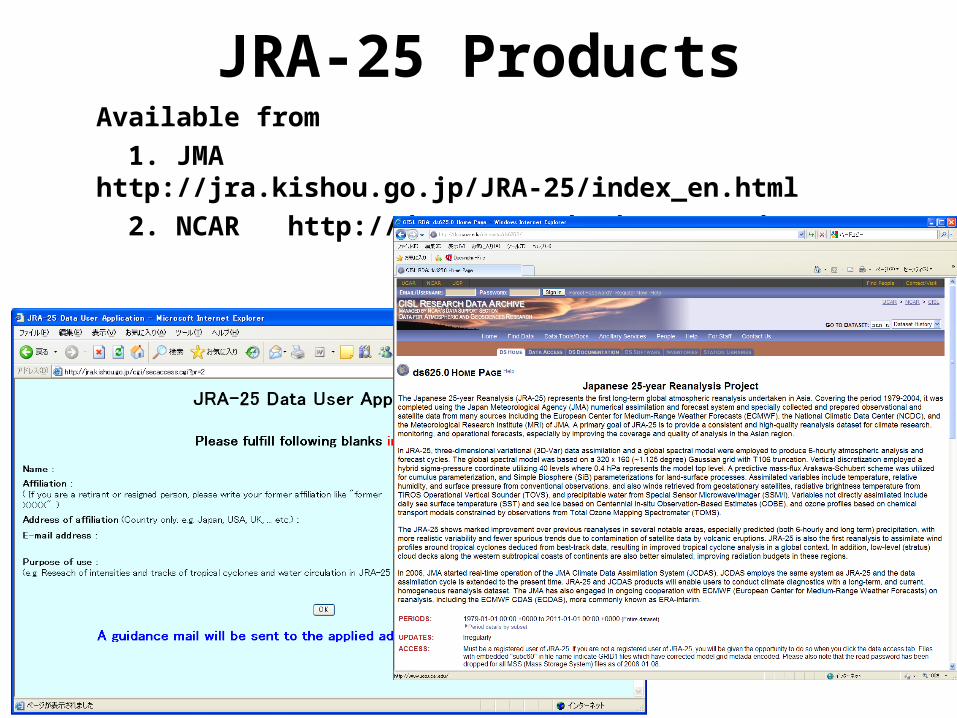
JRA-25 ProductsAvailable from
1. JMA http://jra.kishou.go.jp/JRA-25/index_en.html
2. NCAR http://dss.ucar.edu/datasets/ds625.0/
JRA-25 references
• The JRA-25 Reanalysis J. Meteor. Soc. Japan, 85, 369-432. K. Onogi, J. Tsusui, H. Koide, M. Sakamoto, S. Kobayashi, H. Hatsushika,
T. Matsumoto, N. Yamazaki, H. Kamahori, K. Takahashi, S. Kadokura, K. Wada, K. Kato, R. Oyama, T. Ose, N. Mannoji and R. Taira
• JRA-25 : Japanese 25-year Reanalysis – progress and status –
Onogi et al., QJRMS special issue of the WMO 4th DA workshop (April 2005), Vol.131, 3259-3268.
Main Feature of JRA-25
• Good points1. Better representation of global precipitation
2. Better representation of tropical cyclones
3. Stratus cloud in continental west-coast
• Shortcomings1. Relatively short target period
2. Dry bias in Amazon
3. Large bias in stratospheric temperature
Outline of JRA-55
FY2009-FY2012 : calculation
Global reanalysis(60km, 1958 - 2012)
FY2013~
Product distributeded for Research communities
New JCDAS with same system as JRA-55
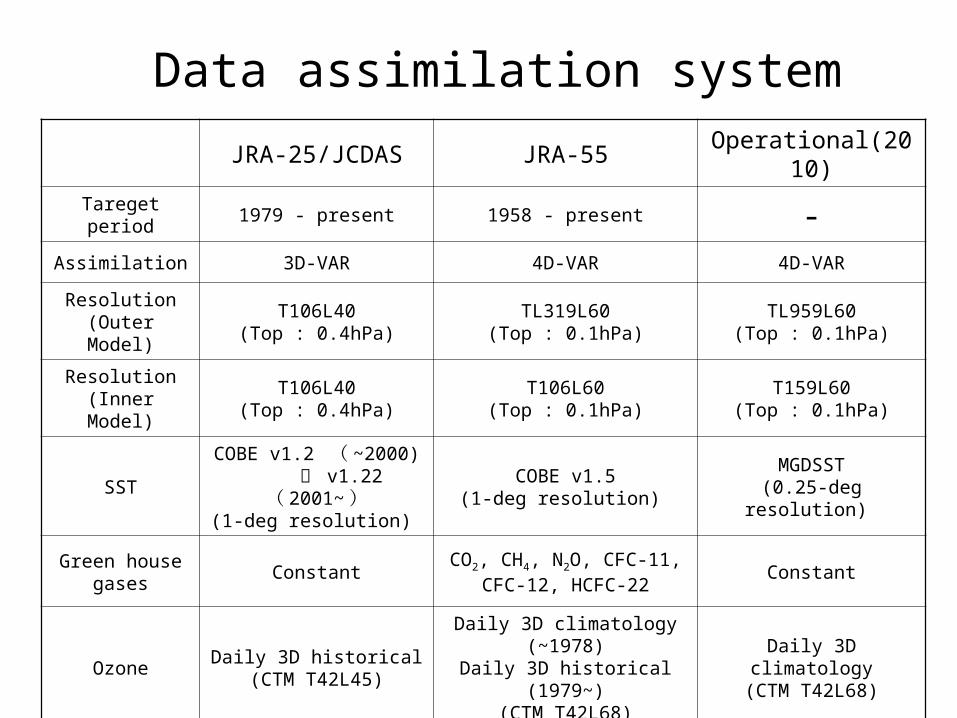
Data assimilation system
JRA-25/JCDAS JRA-55 Operational(2010)
Tareget period 1979 - present 1958 - present -Assimilation 3D-VAR 4D-VAR 4D-VAR
Resolution(Outer Model)
T106L40(Top : 0.4hPa)
TL319L60(Top : 0.1hPa)
TL959L60(Top : 0.1hPa)
Resolution(Inner Model)
T106L40(Top : 0.4hPa)
T106L60(Top : 0.1hPa)
T159L60(Top : 0.1hPa)
SSTCOBE v1.2 ( ~2000)
〃 v1.22 ( 2001~ )(1-deg resolution)
COBE v1.5(1-deg resolution)
MGDSST(0.25-deg resolution)
Green house gases
ConstantCO2, CH4, N2O, CFC-11,
CFC-12, HCFC-22Constant
OzoneDaily 3D historical
(CTM T42L45)
Daily 3D climatology (~1978)Daily 3D historical (1979~)
(CTM T42L68)
Daily 3D climatology(CTM T42L68)
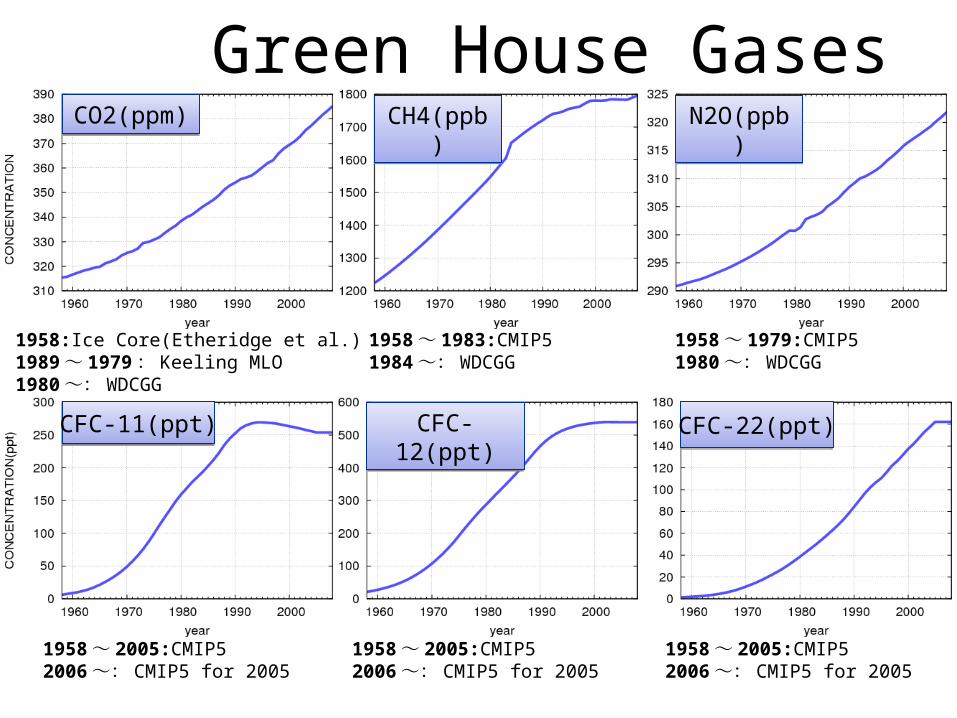
N2O(ppb)N2O(ppb)CH4(ppb)CH4(ppb)
CFC-22(ppt)CFC-22(ppt)CFC-12(ppt)CFC-12(ppt)
1958 ~ 1983:CMIP51984 ~: WDCGG
1958 ~ 1979:CMIP5 1980 ~: WDCGG
1958:Ice Core(Etheridge et al.)1989 ~ 1979 : Keeling MLO 1980 ~: WDCGG
1958 ~ 2005:CMIP52006 ~: CMIP5 for 2005
1958 ~ 2005:CMIP52006 ~: CMIP5 for 2005
1958 ~ 2005:CMIP52006 ~: CMIP5 for 2005
CO2(ppm)CO2(ppm)
CFC-11(ppt)CFC-11(ppt)
Green House Gases
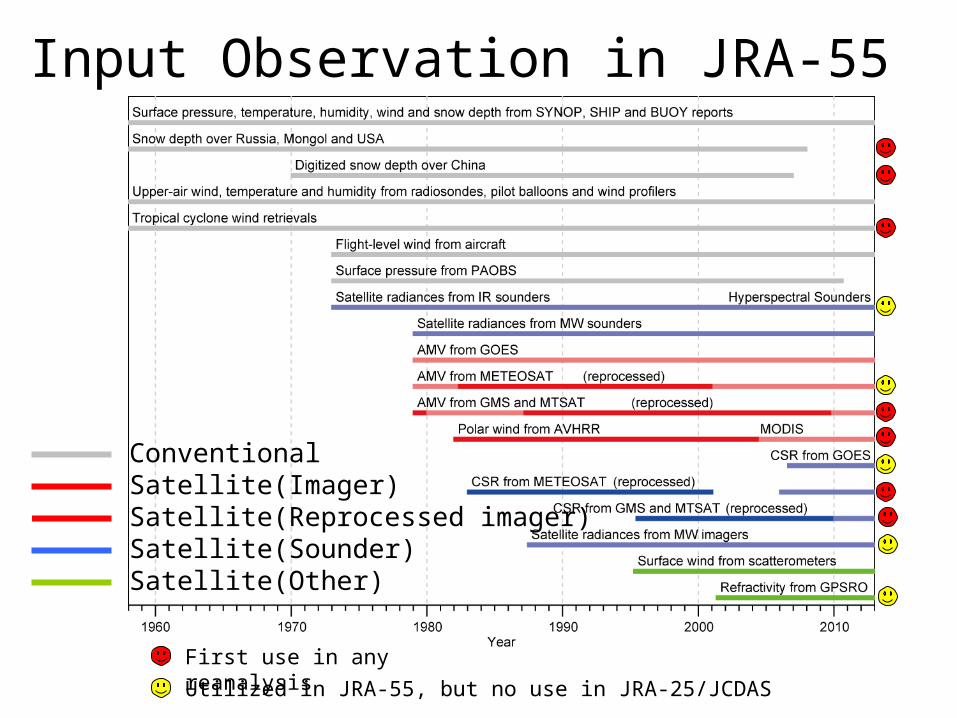
Input Observation in JRA-55
First use in any reanalysis
Utilized in JRA-55, but no use in JRA-25/JCDAS
ConventionalSatellite(Imager)Satellite(Reprocessed imager)Satellite(Sounder)Satellite(Other)
JMAECMWFUKMONCEP
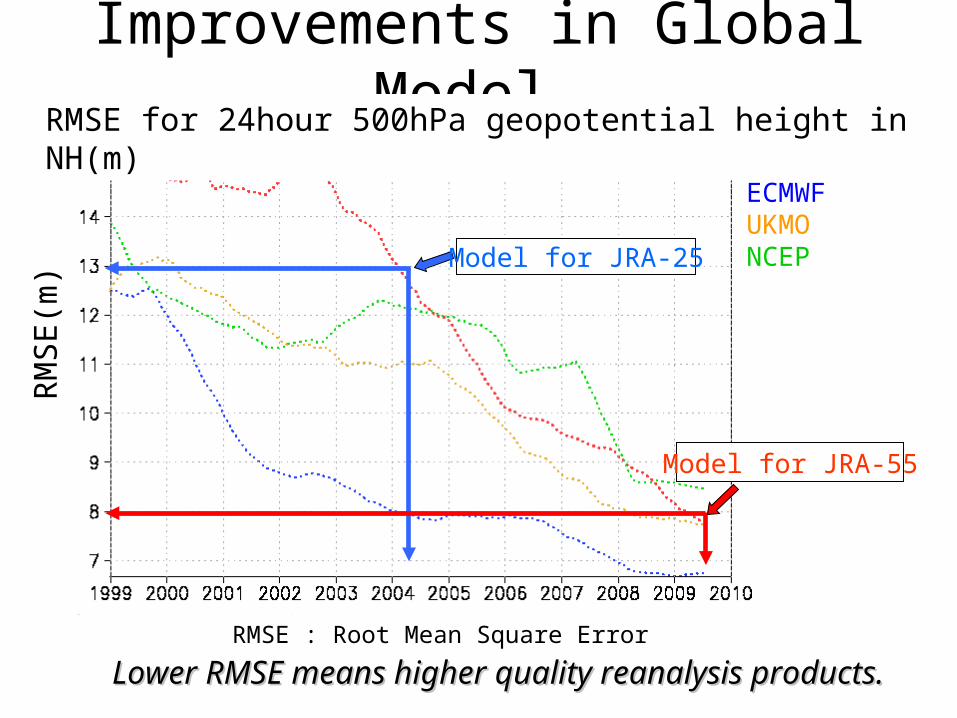
Improvements in Global Model
Model for JRA-25
Model for JRA-55
RMSE : Root Mean Square Error
RM
SE(m
)
Lower RMSE means higher quality reanalysis products.Lower RMSE means higher quality reanalysis products.
RMSE for 24hour 500hPa geopotential height in NH(m)
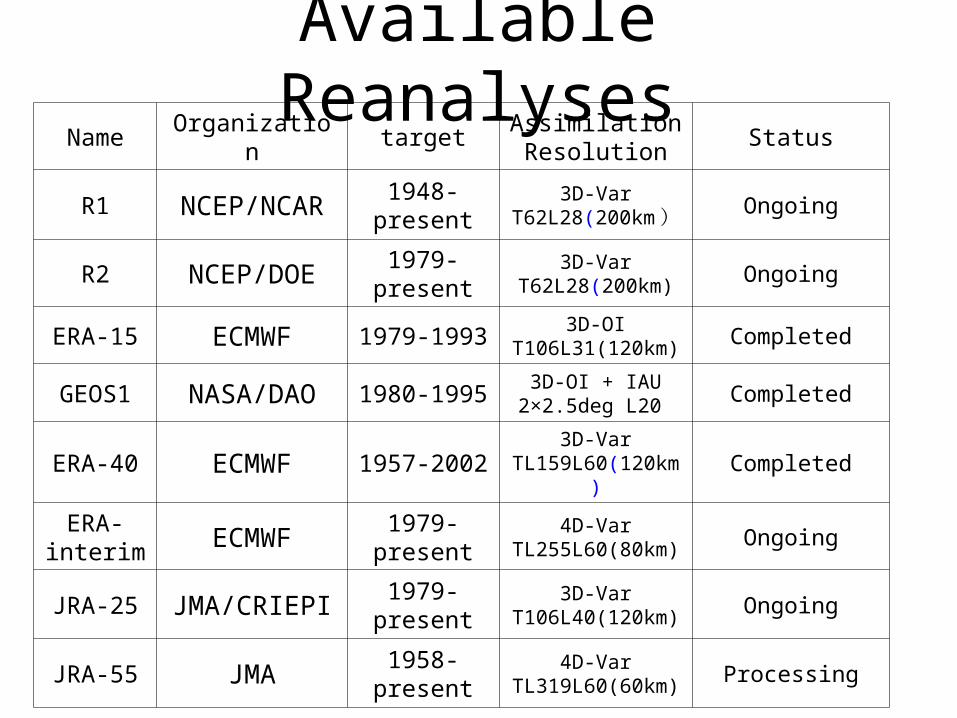
Available ReanalysesName Organization target
AssimilationResolution
Status
R1 NCEP/NCAR1948-
present3D-Var
T62L28(200km ) Ongoing
R2 NCEP/DOE1979-
present3D-Var
T62L28(200km) Ongoing
ERA-15 ECMWF 1979-19933D-OI
T106L31(120km) Completed
GEOS1 NASA/DAO 1980-19953D-OI + IAU
2×2.5deg L20 Completed
ERA-40 ECMWF 1957-20023D-Var
TL159L60(120km) Completed
ERA-interim ECMWF
1979-present
4D-VarTL255L60(80km) Ongoing
JRA-25 JMA/CRIEPI1979-
present3D-Var
T106L40(120km) Ongoing
JRA-55 JMA1958-
present4D-Var
TL319L60(60km) Processing
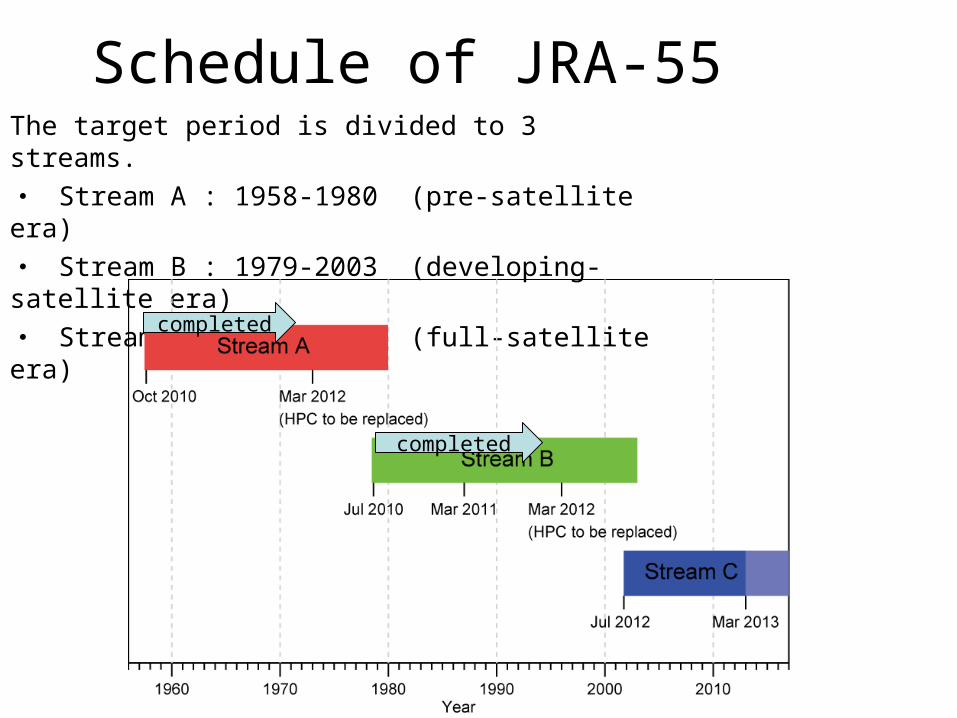
Schedule of JRA-55The target period is divided to 3 streams.
・ Stream A : 1958-1980 (pre-satellite era)
・ Stream B : 1979-2003 (developing-satellite era)
・ Stream C : 2002-2012 (full-satellite era)
completed
completed
Preliminary Results of JRA-55
• Forecast Score
• Global Temperature
• Global Precipitation
• Radiation
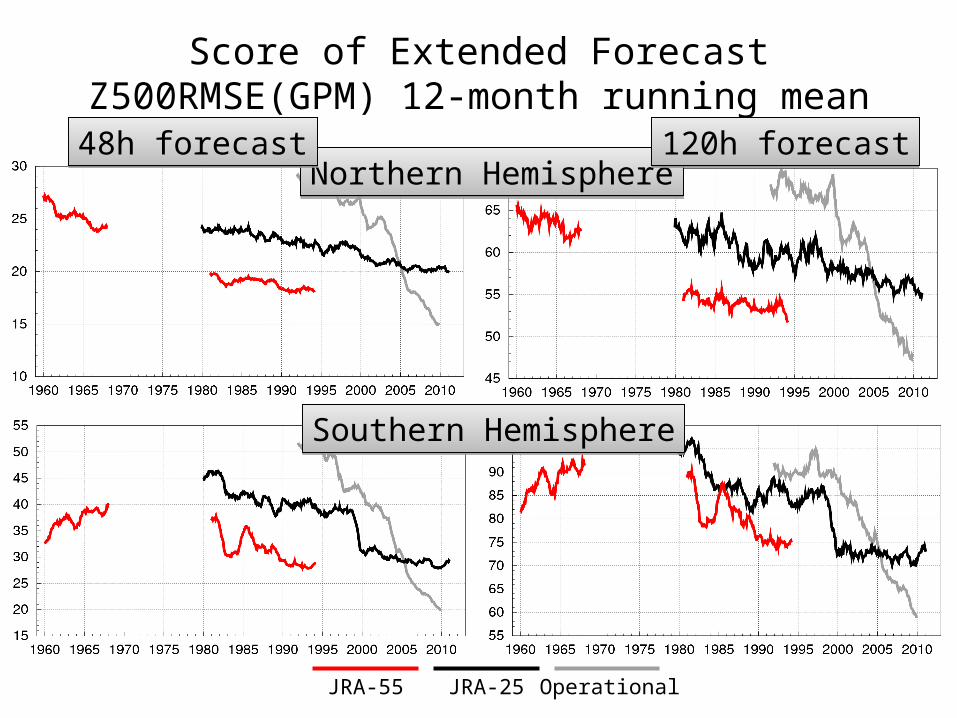
Score of Extended ForecastZ500RMSE(GPM) 12-month running mean
Northern HemisphereNorthern Hemisphere
Southern HemisphereSouthern Hemisphere
48h forecast48h forecast 120h forecast120h forecast
JRA-25JRA-55 Operational
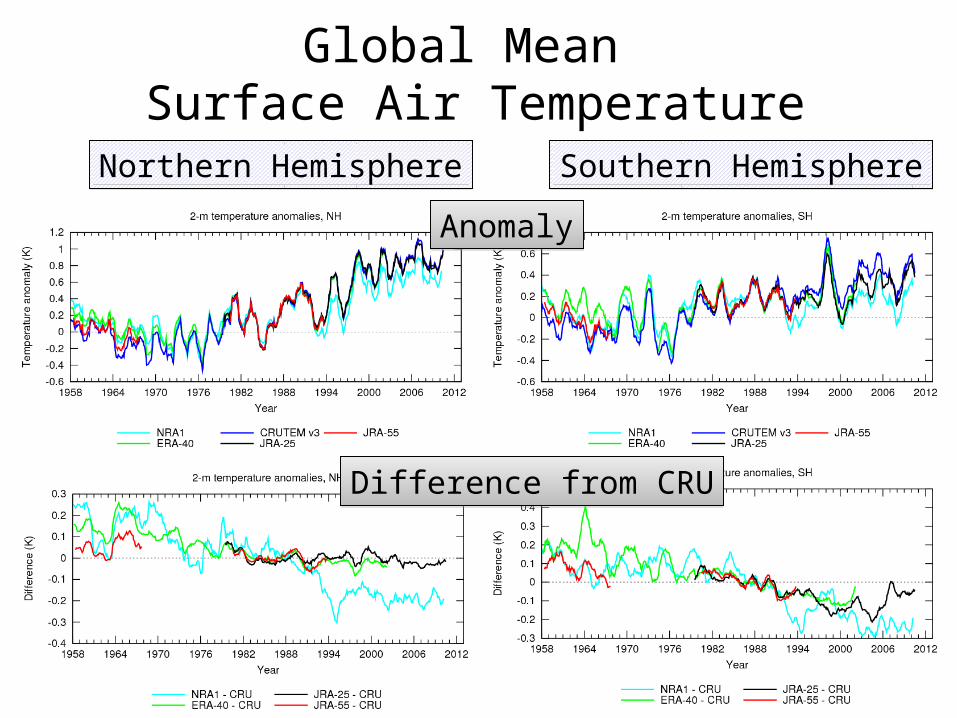
Global Mean Surface Air Temperature
Difference from CRUDifference from CRU
Northern HemisphereNorthern Hemisphere Southern HemisphereSouthern Hemisphere
AnomalyAnomaly
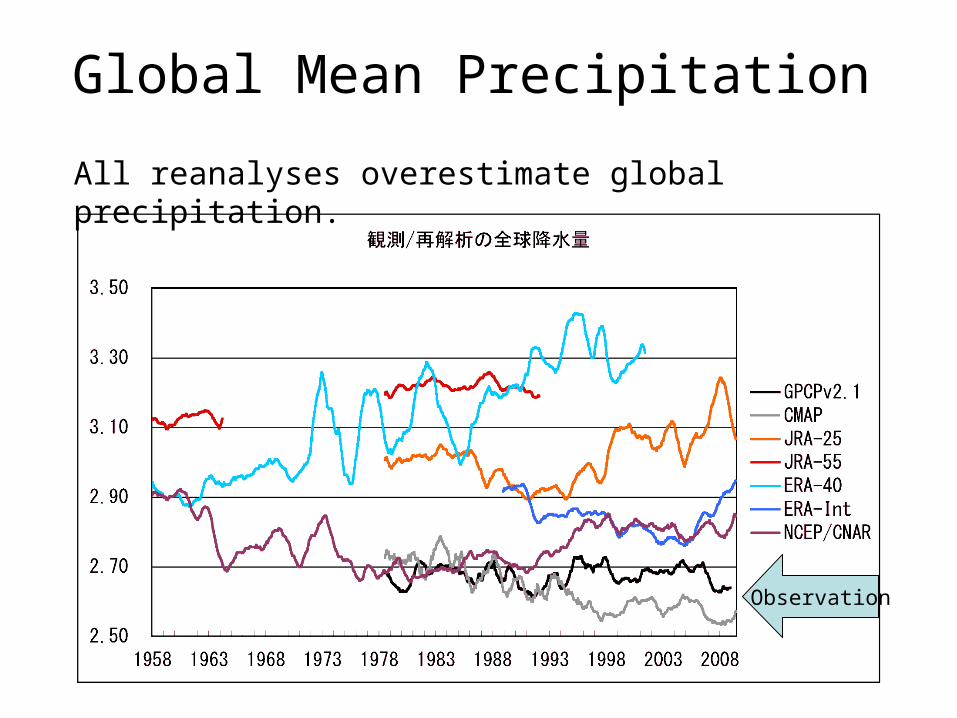
Global Mean Precipitation
Observation
All reanalyses overestimate global precipitation.
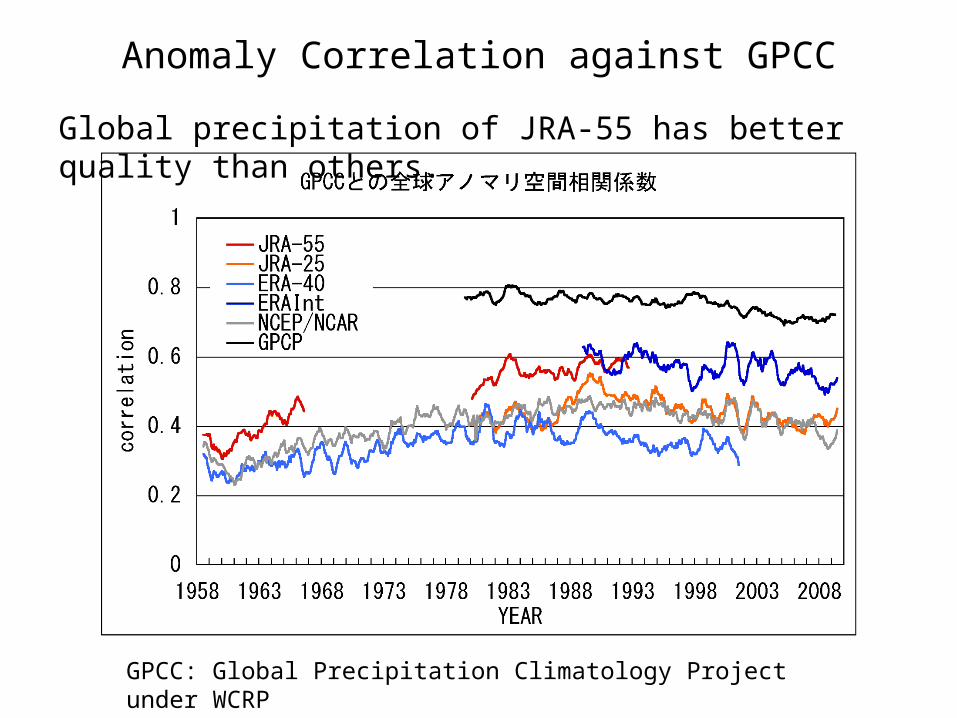
Anomaly Correlation against GPCC
GPCC: Global Precipitation Climatology Project under WCRP is gridding observation with rain gauge data (1901~).
Global precipitation of JRA-55 has better quality than others.
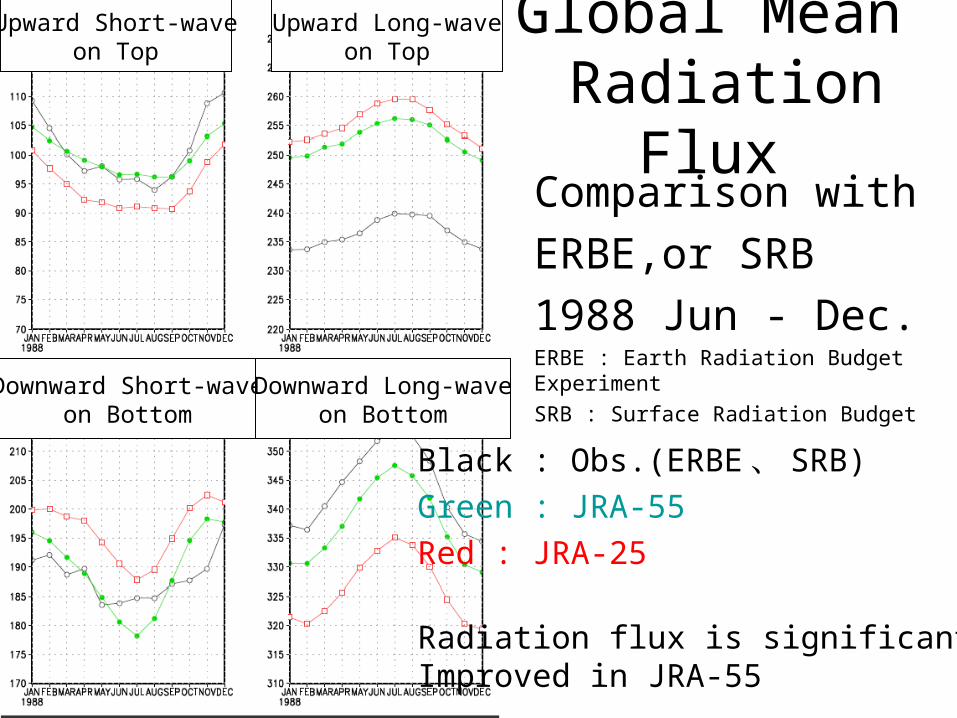
Global Mean Radiation Flux Comparison with
ERBE,or SRB
1988 Jun - Dec.ERBE : Earth Radiation Budget Experiment
SRB : Surface Radiation Budget
Black : Obs.(ERBE 、 SRB)
Green : JRA-55
Red : JRA-25
Radiation flux is significantlyImproved in JRA-55
Upward Short-waveon Top
Upward Long-waveon Top
Downward Short-waveon Bottom
Downward Long-waveon Bottom
JRA-55 Subsets
• Conventional reanalysis utilize all available observations to aim at the higher quality as possible and is for all purpose.
• Until now, we have to make such all purpose reanalysis due to limitation of computer resources and man powers.
• Now, it is possible to make reanalysis subsets for specific purposes (not for all purpose).
• Homogenous reanalysis available for climate change research.
28
Anomaly from averaged temperature of each level for each reanalysis
Natural variability in troposphere with ENSO
Artificial variability in stratosphere with Satellite data
Courtesy: J. Tsutsui and M. Sakamoto
Global Temperature
Anomaly
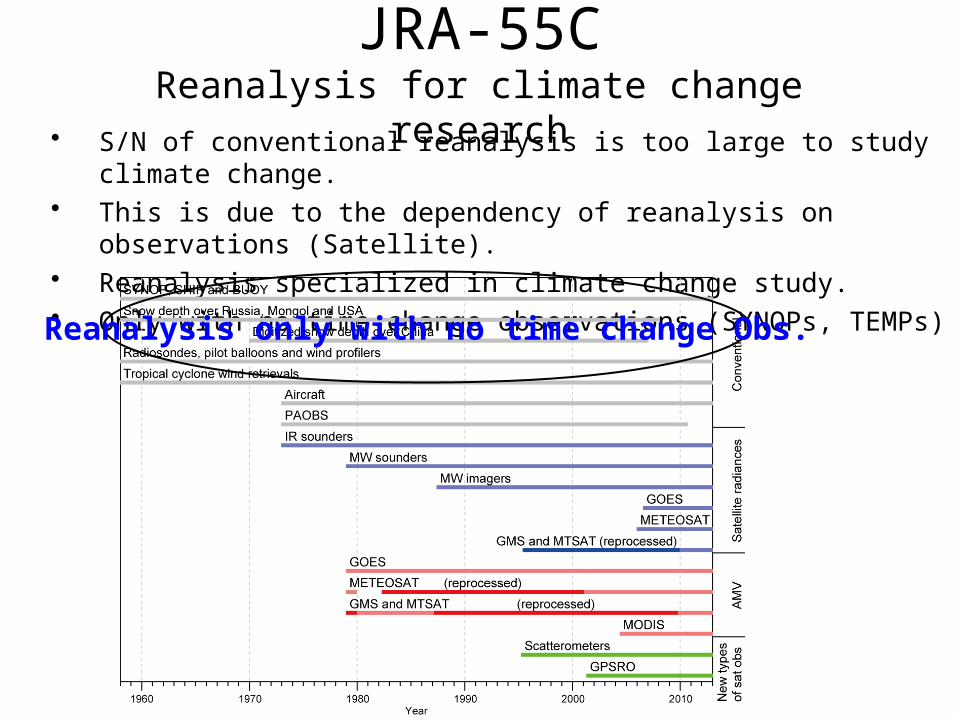
S/N of conventional reanalysis is too large to study climate change. This is due to the dependency of reanalysis on observations (Satellite). Reanalysis specialized in climate change study. Only with no time change observations (SYNOPs, TEMPs)
Reanalysis only with no time change Obs.
JRA-55CReanalysis for climate change research
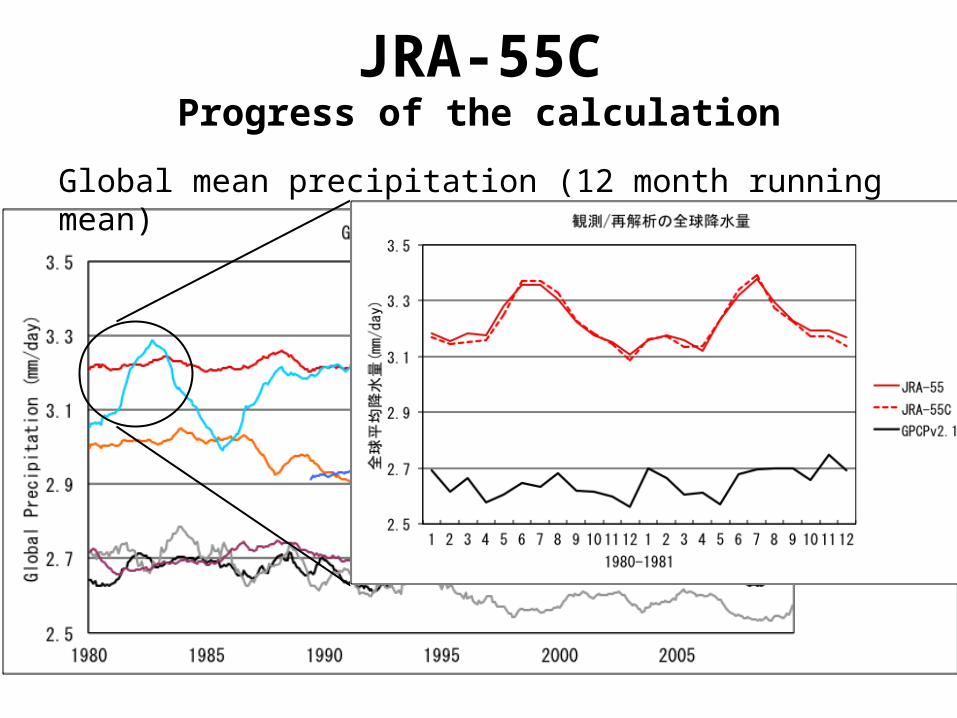
JRA-55CProgress of the calculation
Global mean precipitation (12 month running mean)
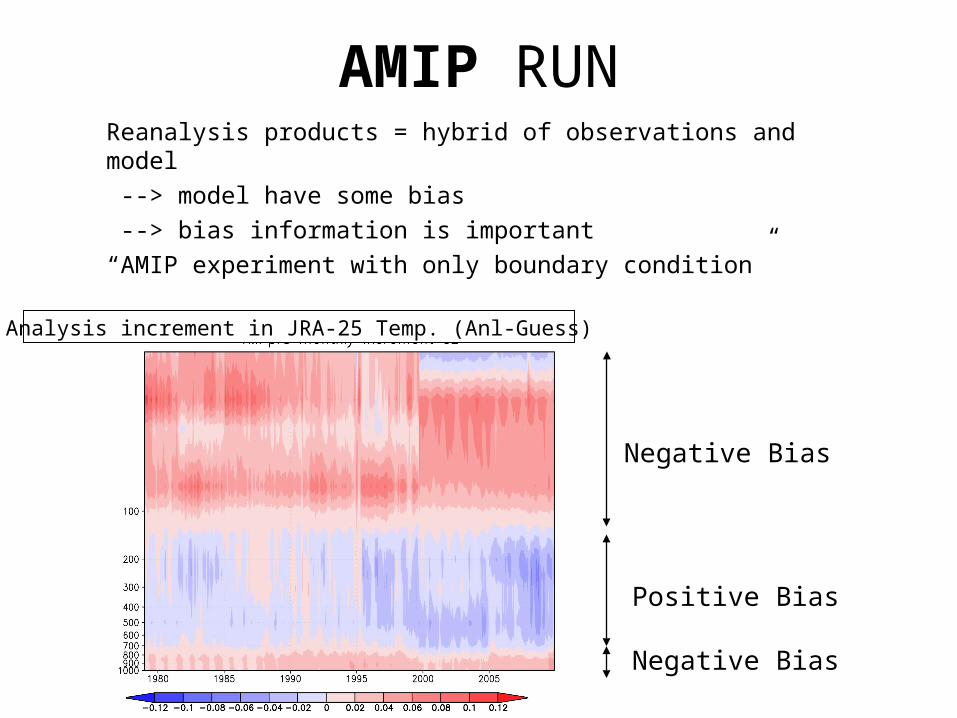
AMIP RUNReanalysis products = hybrid of observations and model
--> model have some bias
--> bias information is important
“AMIP experiment with only boundary condition”
Analysis increment in JRA-25 Temp. (Anl-Guess)
Negative Bias
Positive Bias
Negative Bias
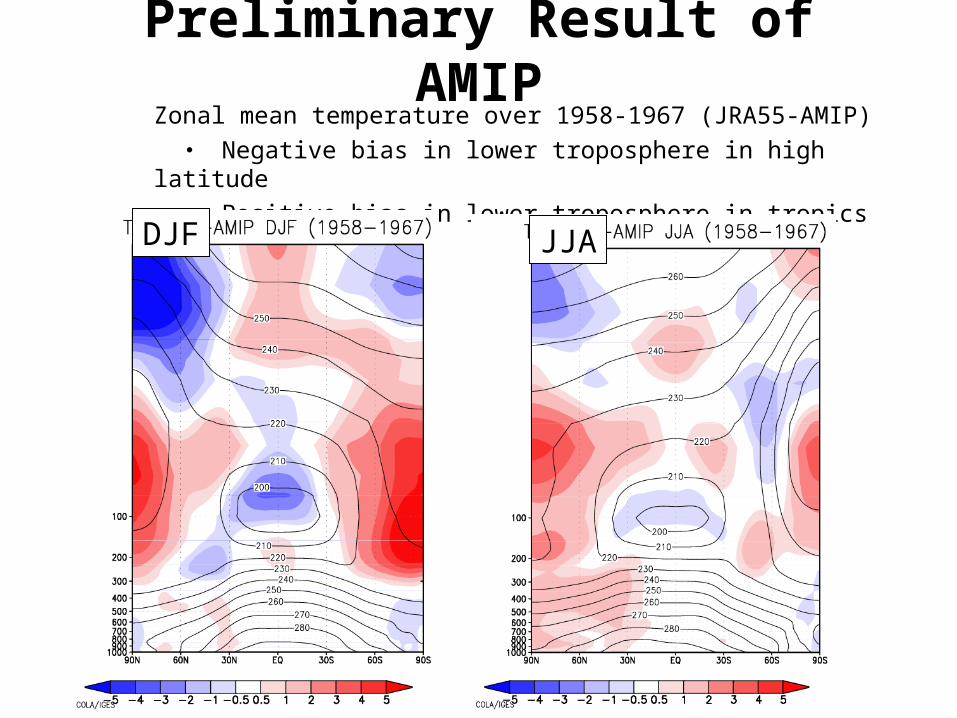
Preliminary Result of AMIP
Zonal mean temperature over 1958-1967 (JRA55-AMIP)
・ Negative bias in lower troposphere in high latitude
・ Positive bias in lower troposphere in tropics
東西風DJF JJA
Summary• JRA-55 improves many shortcomings in JRA-25.• Improved in JRA-55, precipitation, radiation fluxes,,,• JRA-55 is now processing, and a half of the period has
been completed.• JRA-55 will be completed in 2013 spring, and be started
distribution for research uses.
• MRI has also been processing JRA-55 subset for climate studies.
JRA-55C
JRA-55AMIP

Thank you very much

JRA-25 and JCDASJRA-25 (1979-2004)
Joint project by JMA and CRIPIE
JCDAS (2005-) JMA’s operational assimilation with same assimilation system as JRA-25
JRA-25 copyright by JMA and CRIPIEJCDAS copyright by JMABut, both are a series of things, and end users do not need to distinguish it.


