Japanese Government Bond Auctions: The U.S. Experience
34
Japanese Government Bond Auctions: The U.S. Experience Yasushi Hamao & Narasimhan Jegadeesh Working Paper No. 99 Yasushi Hamao is Associate Professor of Finance at Columbia Business School Narasimhan Jegadeesh is an Associate Professor of Finance at University of Illinois, Urbana-Champaign Working Paper Series Center on Japanese Economy and Business Graduate School of Business Columbia University December 1995
-
Upload
heather-gallegos -
Category
Documents
-
view
219 -
download
2
description
Trade relations
Transcript of Japanese Government Bond Auctions: The U.S. Experience

Japanese Government Bond Auctions: The U.S. Experience
Yasushi Hamao &
Narasimhan Jegadeesh
Working Paper No. 99
Yasushi Hamao is Associate Professor of Finance at Columbia Business School
Narasimhan Jegadeesh is an Associate Professor of Finance at University of Illinois, Urbana-Champaign
Working Paper Series Center on Japanese Economy and Business
Graduate School of Business Columbia University
December 1995
Japanese Government Bond Auctions: The U.S. Experience
Yasushi Hamao Graduate School of Business
Columbia University
Narasimhan Jegadeesh College of Commerce and Business Administration
University of Illinois, Urbana-Champaign
First draft: November 14, 1994 This draft: November 15, 1995
We thank Goldman Sachs (Japan), Japan Bond Trading, and Ministry of Finance, Japan for providing the data, Osamu Kamijo, Tadashi Kikugawa, Ted Leh, Naho Kimoto, Yoko Matsunaga, John McMillan, Yoshiaki Shikano and Suresh Sundaresan for helpful comments and conversations. Address correspondence to: Yasushi Hamao, Graduate School of Business, Columbia University, 409 Uris Hall, New York, NY 10027, (212) 854-5631, (212) 678-6958 (fax), e-mail: [email protected].
Abstract
There has been constant friction between the U.S. and Japan on economic issues. After
lengthy negotiations and threats of reprisal, Japan agreed to sell its Government Bonds through
auctions that were open to foreign competition. This paper examines the U.S. experience in the
Japanese Government Bond (JGB) auctions. It also empirically tests the predictions of auction
theory with JGB auction data. While the winning share of U.S. firms in 10-year JGB auction
market went through ups and downs, their share in the 20-year market has increased steadily.
We find that the winning shares by the U.S. firms are positively related to auction profits,
whereas the Japanese "Big Four" winning shares show negative association. We offer some
possible explanations for this phenomenon. Furthermore, the average profits to winning bids in
JGB auctions is not reliably different from zero, and the degree of competition and the level of
uncertainty are found to be insignificant in determining auction profits.

1. Introduction
There has been constant friction between the U.S. and Japan on economic issues. One of
the most contentious issues in the 1980s was the virtual exclusion of foreign firms from
participation in the primary market for Japanese Government Bonds (JGBs). The JGB market is
the second largest treasury bond market, with an outstanding volume of $2 trillion (more than
two-thirds of the U.S. Treasury) and annual trading volume of $12 trillion in 1993.2 The efforts
to open up the primary market for JGB to foreign competition was not easy due to several legal
and political obstacles. The negotiations were conducted at the government level, mostly
between Japan and the U.S. and the U.K. They often involved threats of retaliation in the form
of denying license for Japanese financial institutions in the U.S. and U.K. markets. A major
stepping stone was laid when an inter-governmental working group known as the U.S.-Japan
Yen-Dollar Committee issued its report in May 1984. One of the major mandates addressed in
the report was the liberalization of access of foreign financial institutions to Japanese financial
markets. Several changes followed this report, including the extension membership and seats on
the Tokyo Stock Exchange, and the introduction of the auction mechanism to the primary market
of the JGBs.
Before 1989, the JGBs were sold to investors through a syndicate of underwriters. In
syndicated offerings, a designated syndicate of underwriters buys newly issued bonds from the
Ministry of Finance at a negotiated price and distributes these bonds to retail investors. The
syndicate consisted of more than 800 banks, securities firms, and insurance companies, with only
2Bond Underwriters Association of Japan (1994).
1
small shares sold to foreign financial institutions.3 At a follow-up meeting of the U.S.-Japan
Yen-Dollar Committee in April 1988, David Mulford, Assistant Treasury Secretary claimed that
this underwriting mechanism is protectionist and treats U.S. financial institutions unfairly.4 The
U.S. indicated that the Congress may include retaliatory provisions in the Omnibus Trade Act,
which enables U.S. authorities to revoke primary dealership in the U.S. Treasury market which
had already been given to three major Japanese financial institutions. In response to the U.S.
demand, the Ministry of Finance first increased the overall share of foreign firms in the syndicate
from 2.5% to 8% in 1988, and eventually decided to issue portions of the 10-year JGBs through
an auction process, similar to that used for the U.S. Treasury auction. Under the new system,
from April 1989 to September 1990, 40% of the new 10-year JGBs were issued through
competitive discriminatory price auction and the remaining 60% were sold non-competitively to
the syndicate members, at the quantity-weighted average of successful bids. From October 1990,
again in response to continuing U.S. pressure, the auction portion was increased to 60%. The
hybrid nature of combining auction and non-competitive allocation was a compromise between
the U.S. position that the entire underwriting process should be based on an auction system and
the Ministry's position that the syndicate underwriting system offers it a more stable conduit for
distributing JGB issues.5
This paper examines the extent to which the U.S. firms were able to penetrate the
3For example, in 1985, the foreign share in the syndicate totaled only less than 1%.
AJapan Economic Journal, April 30, 1988.
5SeeSemkow(1992).
2
Japanese market subsequent to the opening of this market. The performance of the U.S. firms
will shed some light on the usefulness of the aggressive U.S. posture in commerce negotiations
with Japan. The next issue we examine is whether there are any discernible differences in the
bidding skills of the U.S. firms relative to their Japanese counterparts. One of the reasons why
the Japanese government was reluctant to open up the JGB primary market was that it was
concerned that the U.S. firms, which dominate the U.S. Treasury auction market may have
superior skills in the auction market and hence may grow to eventually take away a large share of
the JGB market from the domestic firms. We directly evaluate this concern.
Finally, we empirically test the predictions of auction theory with JGB auction data.
There is a growing literature that tests the auction theory in the context of U.S. Treasury
auctions. For example, Cammack (1991) investigates the T-bill auction in the U.S. and finds
support for the theory. On the other hand, Jegadeesh (1993) examines the Treasury notes and
bonds auctions and finds only weak support for the theory. Nyborg and Sundaresan (1994)
compare the profitability and bidding strategies in discriminatory and uniform price auctions.
Away from the U.S. market, however, there is a significant paucity of literature on this subject,
with the exception of Umlauf (1993) who examines the Mexican T-bill auctions. Our paper
makes a contribution to fill this gap.
The rest of the paper is organized as follows. The next section describes the institutional
background and the data. Section 3 examines the bids in JGB auctions and the distribution of
winning bids across different classes of bidders. Section 4 estimates the auction profits and
examines the relation between these profits and the winning shares of Japanese and U.S. bidders.
Section 5 concludes the paper.
3

2. Background and Data
The JGBs are issued by the Ministry of Finance (MOF) in discriminatory price auction.
The 10-year JGB is the largest sector of government bonds, accounting for more than 80% of the
amount outstanding. The auction schedule for 10-year JGBs is as follows. During the last 10
days of every month, the Ministry of Finance announces the coupon and the size of the next JGB
issue, which are set after negotiations with the syndicate members. The issues range from 500
billion yen to 1 trillion yen in our sample period. The announcement of the actual size and the
bond coupon occurs at 8:30 am on the auction date and bids are received from 11:30 am to 1:30
pm. Any syndicate member can bid up to 30% of the amount offered for auction. Although all
members of the syndicates are eligible to submit bids, typically most of the bids are made by
large banks and securities houses. The MOF releases the auction results at 4:30 pm (2:30 pm
after April 1993). On the next day, the remaining underwritten portion is allocated according to
the preset shares at the quantity-weighted average price of successful bids.6 An underwriting
6Although the syndicate shares may be revised every year, they are generally fixed and do not directly reflect the results of previous auctions. The breakup as of April 1994 is as follows (source: Ministry of Finance):
4

commission of 0.63 yen per 100 yen face value is paid from the government for both auctioned
and non-competitively allocated portions. Since this can be considered as a subsidy from the
government, in our analysis below, we subtract this amount from the auction prices.
The actual issue usually occurs on the 20th of the calendar month after the auction and
the payment is made on the issue date. There is no when-issued market in the pre-auction period
similar to that in the U.S. and hence it is the bidder's sole responsibility to distribute what they
win in auctions. Syndicate members can start trading the bonds on a when-issued basis after the
auction date, although there is no formal market for such transactions.
The auction mechanism for 20-year JGBs is essentially the same as that for 10-year
bonds. The main differences are: (1) they are issued much less frequently (2-4 times a year); (2)
they are sold entirely through auction (no syndicate) since September 1987; and (3) there is no
underwriting commission paid to the bidders.
The secondary market trading of JGBs is concentrated on the over-the-counter
transactions through Nihon Sogo Shoken (Japan Bond Trading Company). Roughly 95% of
transaction are on the OTC. JGBs are also listed on the Tokyo Stock Exchange on the first
trading day in the second month following the issue date, but the Exchange transactions are
aimed at small investors. The characteristics of the secondary market are discussed in detail by
5
Campbell and Hamao (1993) and Kikugawa and Singleton (1995).
We obtained data on auction results since its introduction in April 1989 for 10-year JGBs,
and since May 1991 for 20-year JGBs. Our sample period ends November 1994. The database
contains average and minimum winning bids (in prices), coverage ratio (total bids tendered
divided by amount sold in auction) and quantity of successful bids by each bidder (domestic and
foreign). These data are collected by Sanyo Securities and are published in Kinyu Facsimile
Shinbun (Financial Facsimile News), which is a newsletter circulated among dealers.
We also obtained daily secondary market prices of newly issued bonds, as well as bonds
with similar maturities from the auction date, from Goldman Sachs. We use the last dealer quote
of the day in our analysis.
3. JGB Auctions: Winning Bids
Table 1 presents the summary statistics for 10- and 20-year JGB auctions. The auctions
are grouped by the relevant Japanese fiscal year which begins in April. Our sample consists of
68 auctions for 10-year JGBs and 14 auctions for 20-year JGBs. Of the 68 10-year JGB auctions,
49 are auctions of new bonds while 19 are reopenings. Of the 16 auctions of 20-year JGBs 14
were new issues and two were reopens.
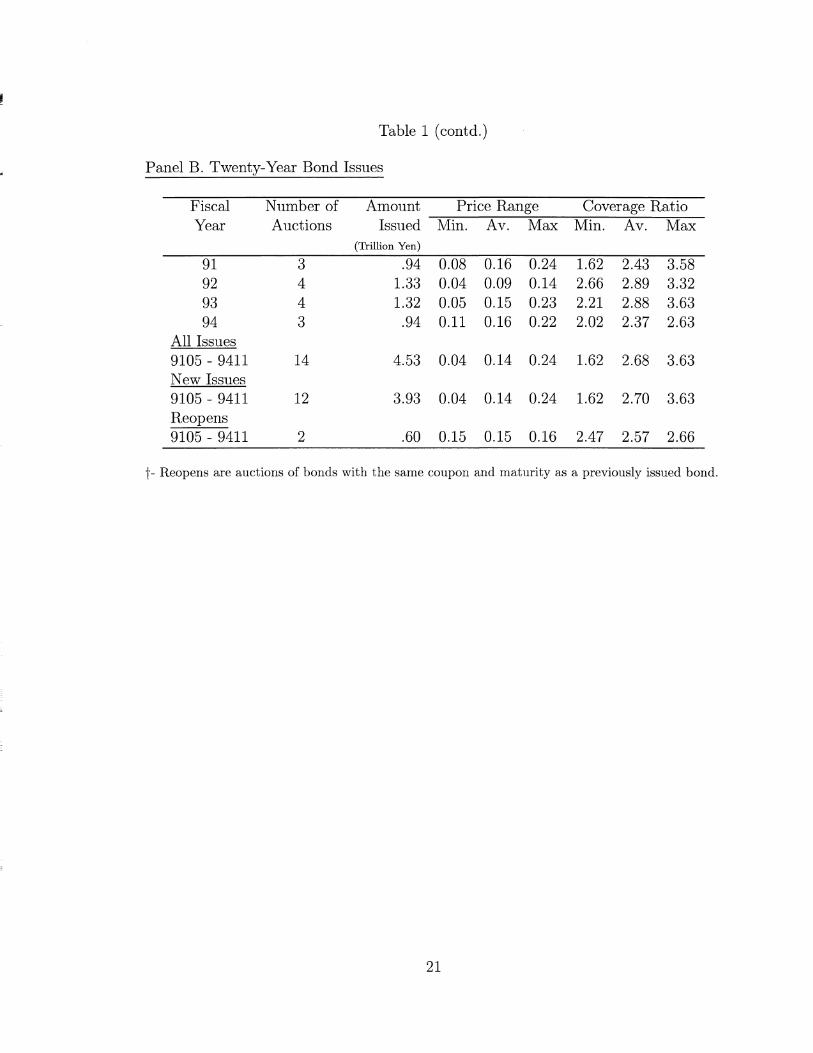
A total of 54.4 trillion yen was raised with the issue of 10-year JGBs (both through
auctions and direct issues to syndicates) during this sample period. The total issue of 20-year
JGBs was considerably smaller and the total amount raised was 4.5 trillion yen.
The average coverage ratio in the 10-year JGB auctions is 4.07. The coverage ratio is
nearly twice that for the 10-year note auctions in the U.S. where it is 2.16 (see Jegadeesh (1993)).
6

The average price range for accepted bids is 0.13%, which is significantly smaller than the
average range of 0.24% in the U.S. The lower range of accepted bids in Japan suggests that there
is less price uncertainty in the Japanese market. This is somewhat surprising since there is no
pre-auction when-issued market in Japan. Unlike in the U.S. market, the participants in the JGB
auctions do not have the benefit of price discovery provided by the when-issued market. It
appears, however, that any increased price uncertainty due to the absence of when-issued market
was more than offset by lower interest rate uncertainty in Japan and higher level of auction
participation, as indicated by the higher coverage ratio, resulting in lower dispersion of accepted
bids.
Table 2 presents the average winning bids tendered by the major participants in the
auctions. In the 10-year JGB auctions, Japanese commercial banks tendered 29.67% of the
winning bids in 1989. Their share declined to 15.16%) in 1991 and eventually recovered to
24.86% in 1994. The U.S. firms started off strong winning 25.88% of the auction in 1989 but
their share declined rapidly to 4.41% in 1992 before recovering to 13.85% in 1994. Much of the
loss of the U.S. share is due to the diminished role played by Salomon Brothers in the post-1991
period. This was the time that Salomon Brothers was embroiled in the Treasury Auction scandal
in the U.S. (see Jegadeesh (1993)). The decline in the U.S. share may be related to this scandal
and the eventual departure of key personnel in the Government Bond desk in New York.
A bulk of the loss in share of Japanese banks and U.S. firms was captured by the big four
Japanese investment banks (Daiwa, Nikko, Nomura and Yamaichi). Their share grew from
33.50% in 1989 to 73.33% in 1992 before declining to 46.64% in 1994. Foreign firms other than
U.S. firms failed to make any significant inroads into the JGB auction market and their combined
7

share hovered around one percent over the entire sample period.
It is interesting to compare the percentage winnings in auctions with syndicate
allocations. As stated earlier, only 60% of the 10-year JGB issues (40% until September 1990)
are sold through auction while the remaining 40% are allocated to a syndicate at the quantity-
weighted auction price. The MOF decides on the share of each firm in the syndicate. The
combined share of Japanese banks in the syndicate is 65% (see footnote 6) while they win on
average only 21% of the auctioned portion of the issues. On the other hand, the combined share
of foreign firms in the syndicate is only 8% while they win about 15% of the auctions. It appears
that the syndicate system in the 10-year JGB issues serves to protect a certain share for Japanese
banks that are probably not equipped to compete in the auctions, at the expense of foreign
competition.
Table 2 (Panel B) presents the shares of the major participants in the 20-year JGB
auctions. In these auctions the share of Japanese commercial and investment banks declined over
time. In 1991, the Japanese commercial and investment banks won 25.84%) and 68.24%
respectively but their shares declined to 13.96% and 5432% by 1994. Meanwhile, the share of
the U.S. investment banks increased from a mere 5.70% in 1991 to 27.09%o in 1994. A large part
of the gain in the U.S. share came from the increased share of Goldman Sachs. Here again,
foreign firms other than U.S. firms failed to make a significant entry.7
7It should be noted that Japanese commercial banks participate in the auction mainly as ultimate investors, not as dealers. Banks owned 36%) of JGBs outstanding as their investment in 1992 (Bond Underwriters Association of Japan, 1994). Banks are also allowed to sell government bonds to their clients since 1985, but these transactions tend to be retail-oriented and small in volume.
8
It appears that the effort of the U.S. government to open the Japanese market paid off at
least in the short run in terms of enabling the U.S. firms to gain a significant share of the market.
The U.S. firms will be able to retain this share and grow over time if they possess superior
bidding skills. Many market participants in Japan, however, argue that the early U.S. gains in the
auction are due to their aggressive bidding because of an eagerness to establish a presence in the
market even at a loss in the auction. In this case, the U.S. market share in the auction may not be
sustainable.
4. A Test of Auction Theory
This section tests the predictions of auction theory with JGB auction data. We also
examine whether U.S. securities houses exhibit differential bidding skills relative to their
Japanese counterparts.
The specifics of the discriminatory price auction designed for JGB auctions has a number
of complex features that are difficult to entirely incorporate into an analytically tractable model.
Our tests, therefore, rely on the predictions of first-price auctions where each bidder submits one
bid for one unit of the auctioned good.8 The predictions of these models which do not
specifically depend on auction design are tested here. The models that form the basis of our tests
are Milgrom and Weber (1982), Englebrecht-Wiggins et al. (1983) and French and McCormick
(1984).
8In first-price auctions, the highest bidder gets the auctioned good at the price that he or she bids. In a second-price auction the highest bidder gets the auctioned good at the highest losing price.
9

In these auction models, each bidder first forms an expectation of the value of the
auctioned good conditional on his or her information and conditional on winning the auction.
The expected value of the good conditional on winning the auction is less than the expected
value without this conditioning due to the "winner's curse." Adjusting for winner's curse
provides an unbiased estimate of the value of the good. If one were to subsequently bid this
amount and win, the expected profit would be zero.
When there are a finite number of bidders, each bidder bids below the winner's curse-
adjusted expected value of the good. The difference between the conditional expected value and
the bid is the expected profit for the winner in the auction. Two factors that affect the expected
profit to the winner are the extent of dispersion of opinion among bidders and the number of
bidders. The marginal probability of losing an auction by lowering the bid by a given amount
decreases with an increase in the dispersion of bidders' pre-auction valuations. Therefore,
auction theory predicts that higher dispersion of opinion on average results in lower bids and
higher auction profits. The marginal probability of losing an auction by lowering the bid by a
given amount increases with increasing levels of competition. Therefore, increased competition
on average results in higher bids and lower profits. It should be noted that both these predictions
obtain when there is a finite number of bidders. When the number of bidders is large
(technically, tending to infinity) then the auction is characterized by perfect competition and the
expected auction profit is zero. All bidders bid their winner's curse-adjusted conditionally
expected values.
To examine whether the Japanese or U.S. investment banks systematically exhibit
superior bidding skills we use the predictions of Englebrecht-Wiggins, Milgrom and Weber
10
(1983). Englebrecht-Wiggins et al. consider an auction for a common value good in a setting
where one bidder is informed and the other is uninformed. In their model, the expected profit
conditional on the informed bidder winning the auction is higher than the expected profit
conditional on the uninformed bidder winning the auction.
We estimate the auction profits using two approaches. In the first approach the auction
profit is measured simply as the percentage return for buying the bond at the auction at the
average auction price and holding it until date t. The first measure of auction profit, say 6 is:
where APta is the percentage change in price between the auction and date t. Since trading in the
auction bonds is on a forward basis until the issue date, no adjustments are required for carrying
cost or accrued coupons.
This measure of ex-post profit contains the expected auction profit component as well as
any price change due to unexpected changes in interest rates. Price changes due to interest rate
changes add noise to the profit estimates. We therefore compute a second profit measure which
controls for price changes due to interest rate changes. The second measure, say 62^ is:
where APtc is the average percentage change in price of three control bonds from the auction
date to date t. The control bonds are bonds with maturities closest to the auction bonds.9 This
9Our results were qualitatively similar when we used one control bond rather than three bonds.
11
measure uses the average control bond price change to filter out the effect of price changes due to
interest rate changes. Since the control bonds are traded in the spot market, we adjust their
returns for accrued coupon and carrying cost.
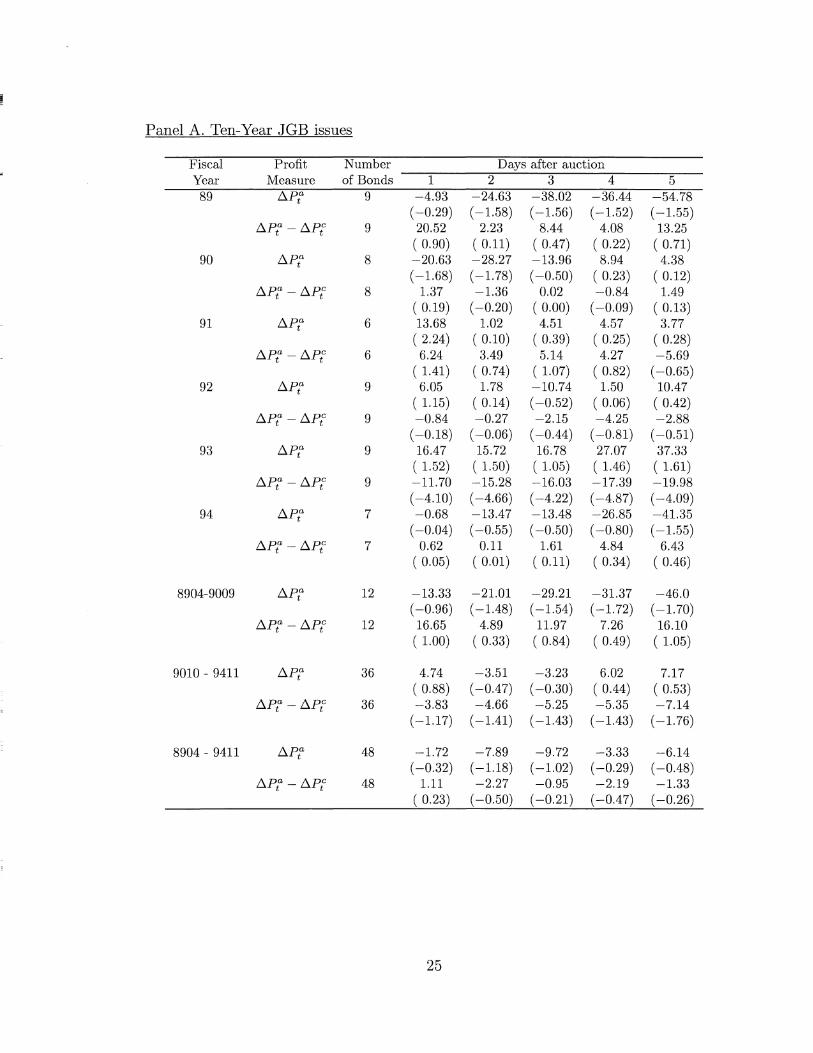
Table 3 presents both measures of auction profits for t = 1 to 5. We restrict the sample to
new issues only and exclude reopenings.10 For 10-year JGBs, both measures of auction profit are
typically negative on average and close to one another but they are not reliably different from
zero. In comparison, Jegadeesh (1993) finds that for 10-year Treasury notes in the U.S., the
average auction profit is 12 basis points, which is reliably positive. Nyborg and Sundaresan
(1994), using transactions data, also find statistically significant positive profits. The lower
expected auction profits in Japan are perhaps due to a combination of more intense competition
in the auctions, as reflected in higher coverage ratios, and lower price uncertainty as reflected in
the narrower price range.
Although both profit measures of profits are quite close for the entire sample period, in
certain auctions these measures were of opposite signs. For instance, 6t t is on average negative
in 1989 while 821 is positive. This is due to the fact that the interest rates rose in the period after
the auction date but the effect of interest rate change was effectively removed when we measure
the profits relative to the price changes of control bonds. Because of this, 621 exhibits lower
volatility than 6ir For instance, the variance of 821 is 80% of that of 6X and the variance of
82 5 is 15% of that of 815 . Since 821 is more precisely measured, we use this measure of auction
10We examined reopened issues separately. Since the prices of reopened bonds after the auction date are the same as the existing identical bonds, we measure the auction profits by comparing the average auction price and the price on the day after the auction. The resulting auction profits are also not significantly different from zero.
12
profit in further analysis.11
Table 3, Panel B presents the profits for 20-year JGB auctions. The average profit in this
auction is also not reliably different from zero, as in the case of 10-year bonds. Here again 62
exhibits lower variance than 6ir
There has been a public policy debate on the design of Treasury auctions. Several
authors have argued that uniform price auctions would result in higher revenues for the seller
than discriminatory price auctions.12 Nyborg and Sundaresan (1994) find that consistent with
this view, auction profits for uniform price auctions in the U.S. Treasury market are lower. In the
Japanese context, however, there is unlikely to be a room for further improvement (from the
government's point of view) by introducing uniform price auctions, since the current system of
discriminatory price auction creates no economically significant auction profits.
In our tests of the auction theory, we use the coverage ratio (Ratio) as the measure of
competition. High coverage ratio indicates intense competition and hence is expected to be
associated with low auction profit. We use the difference between the average auction price and
the lowest accepted bid (Range) as a measure of dispersion of pre-auction valuation.
As mentioned earlier, sales of JGB s through auctions was a result of negotiations between
the U.S. and Japanese governments. The introduction of auction marked the point where foreign
11 Since the period between the auction and the issue date (typically 15 business days) does not have an organized market, one might consider trading during this period may not be active, making measures of auction profits less meaningful. Although we do not have the data on volume during this period and the period after the issue date, we examined auction profits for 30 days after auction. The results reported for five days are qualitatively the same for the longer period.
12See Goldstein (1962)'s quotation of Milton Friedman, and Milgrom and Weber (1982).
13
securities firms were able to freely compete with their Japanese counterparts for the first time in
the primary market of the JGB. Therefore it is interesting to investigate into the performance of
these two competing sectors. To examine the relative skills of the U.S. and Japanese securities
houses, we examine whether auction profits are related to the share of auction won by each group
after controlling for the effects of Ratio and Range, Our focus here is to compare behaviors of
directly competitive players in the JGB market, the four largest Japanese and U.S. investment
banks. We do not consider commercial banks since they are not directly competing with
investment banks in the secondary market (see footnote 7).13
The variables Big4Japan and Big4US used in the regression below are the fractions of the
auction won by the four major Japanese investment banks (Daiwa, Nikko, Nomura, and
Yamaichi) and four major U.S. investment banks (Goldman Sachs, Merrill Lynch, Morgan
Stanley, and Salomon Brothers), respectively. If the Japanese firms have superior information,
then the profits would on average be large in auctions where they win a large fraction than in the
auctions where they win a small fraction.
We control for the competitiveness and uncertainty in auction and fit the following two
regressions for our tests:
13 After excluding commercial banks and other Japanese securities houses, the shares of the largest four Japanese and U.S. investment banks are not perfectly negatively correlated.
14
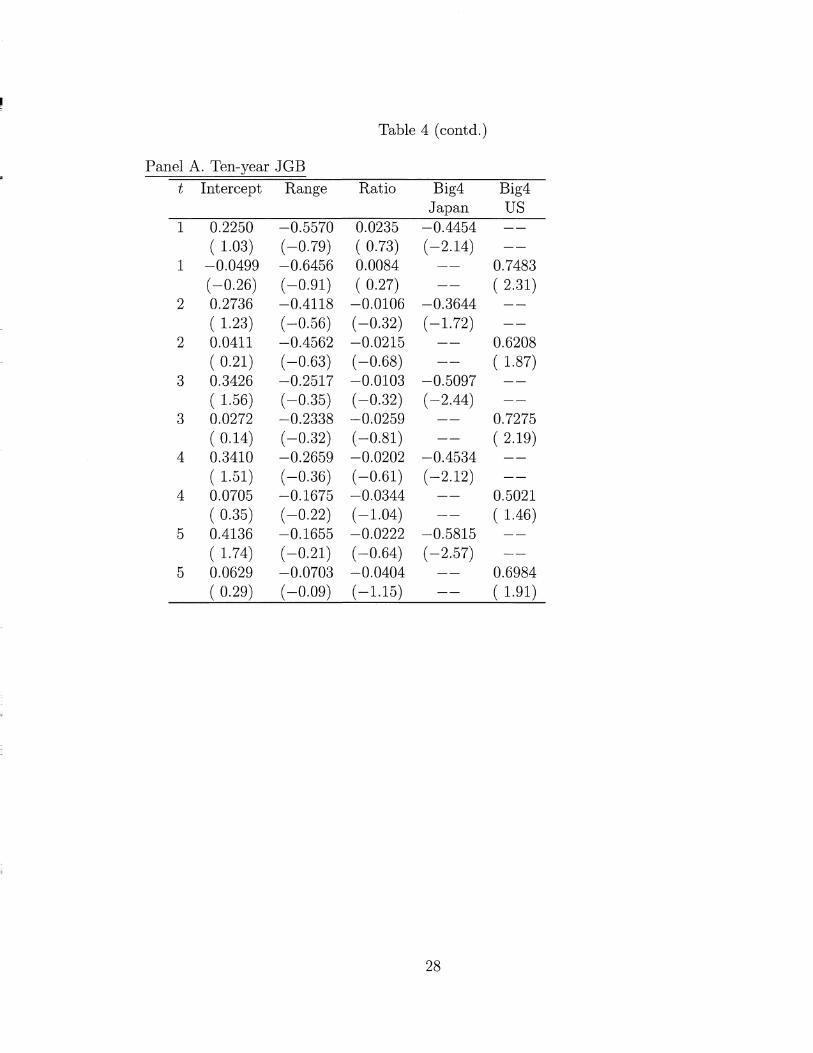
Table 4 presents the regression estimates. The slope coefficients on both the Ratio and
Range are not reliably different from zero. This suggests that the level of competition or the
level of uncertainty do not play a significant role in determining auction profits. This is true for
both 10- and 20-year JGB auctions (Panels A and B respectively). This result is consistent with
our finding that the average auction profit is zero. It appears that the number of bidders is
sufficiently large so that the expected auction profit is driven down to zero. In this case, since
the theory predicts that ex-ante expected profit is zero there will be no relation between ex-post
profits and the variables Range and Ratio.
Turning to the slope coefficients on the country variables for the 10-year JGB auction, we
find that the slope coefficient of Big4Japan is reliably negative. On the other hand, the slope
coefficient on the variable Big4US is reliably positive. This indicates that the larger winnings of
the Japanese firms in the auction are related to lower profits and the larger winnings of the U.S.
firms are related to higher profits. For the 20-year JGB auctions the slope coefficient of
Big4Japan is significantly negative. The slope coefficient of Big4US is on average positive but
not reliably different from zero. The lack of significance of this slope coefficient is likely due to
the limited sample size and the resulting lack of precision with which the parameters are
estimated. Nevertheless, the general result suggests that the U.S. firms have bidding skills
superior to those of their Japanese counterparts.
To further analyze this point, we sort auctions into three groups by the percentage won by
the Big 4 Japanese and U.S. firms, respectively. These results provide a more direct picture of
the linkage between the auction profits and the winning share of the Japanese and the U.S. firms.
Table 5 presents the average profits from one to five days after the auctions. For the 10-year
15
JGB, when the Japanese Big 4 firms win a low proportion of the auction, the auction profits are
positive (although not statistically significantly so). But when they win a high proportion of the
auction, the profits are significantly negative and increasing over time. On the contrary, for the
U.S. Big 4 firms, the profits are significantly negative when they win a low percentage of the
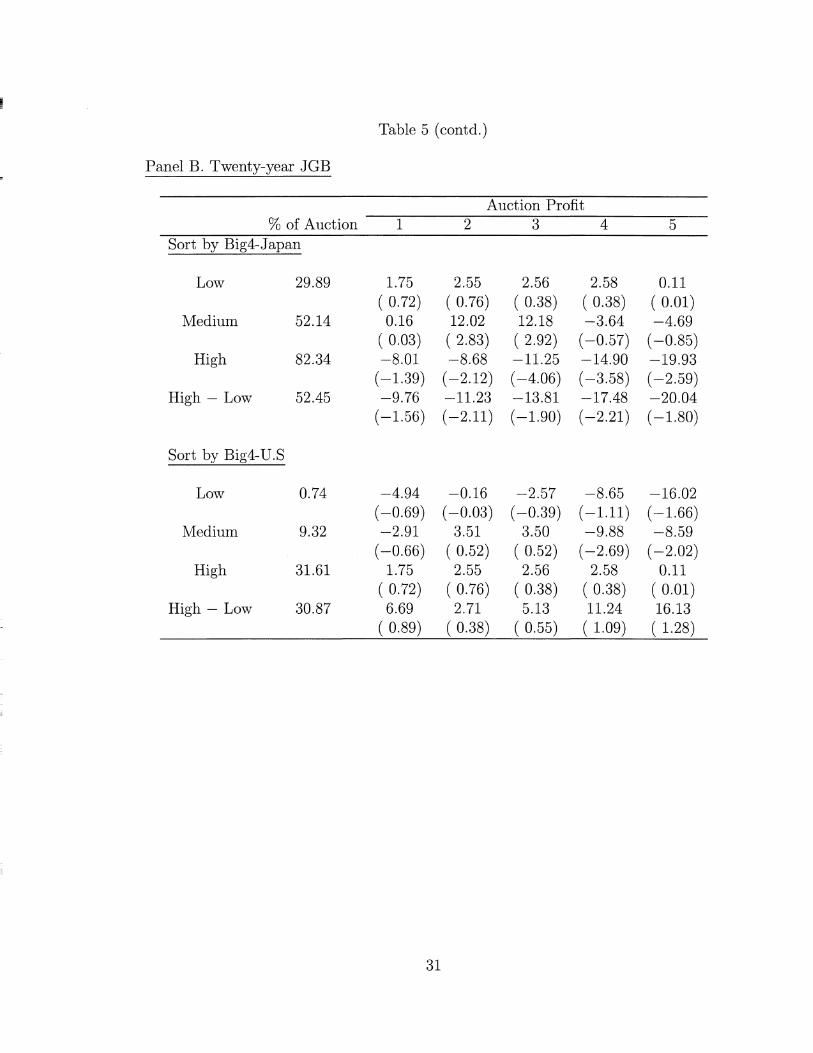
auctioned bond. A similar pattern is observed in the 20-year JGB auctions. While significantly
negative auction profits are associated with the high winning proportions by the Japanese Big 4
firms, positive profits are seen when U.S. Big 4 firms win high proportions.
One interpretation for this pattern is that the U.S. firms have the advantage in processing
the information concerning the value of the JGBs sold in the auctions. They win relatively more
in auctions when the expected profits are high. The Japanese investment banks seem to be
willing to bid even when the bonds they get in auctions are expected to generate losses.
Another interpretation of our evidence is also possible. The Japanese Big 4 firms may
have private value associated with bidding in the auctions that is not readily evident when we
consider only the profits in the auction. For example, the Japanese Big 4 firms may be in a better
position to sell the JGBs to investors through their institutional distribution network, especially
to regional, relation-oriented clients. There have been several accounts in the press suggesting
this point. For example, the trade publication Nikkei Newsletter on Bond and Money reports that
"... aggressive bidding prices by Japanese houses are only justifiable by their ability to sell JGBs
to their clients in combination with other attractive products such as new issues of convertible
bonds that they underwrite (April 17, 1989)." Other anecdotal evidence suggests that some
Japanese investment banks often receive orders for large bids from Japanese institutional
investors who wish to be anonymous at the time of auctions. These are called "proxy bids (Dairi
16
Nyusatsu)" and are submitted by investment banks at the prices and quantities the clients specify.
If the price risk of the auction bonds in the primary market is borne by clients (as indicated in
these anecdotal stories) and if the market impact of purchasing the newly issued bonds in the
secondary market is large, this "distribution advantage" would play a major role in the sales of
JGBs, and hence influence the bidding strategy. In this case, for the major Japanese investment
banks, their private valuation is not captured when we look only at auction profits. This would
imply that it is not appropriate to characterize the JGB auction as common value good auction.
We can further speculate another possible explanation. It is well known that the financial
system in Japan is rather tightly regulated. Regulation of financial markets by the government
also implies protection of (domestic) financial institutions by the government. In the post-war
period, there has been no bankruptcy of Japanese securities houses despite occasional financial
distresses for these firms. For example, a financial crisis of Yamaichi Securities in the 1960s was
avoided by a low-interest rate loan made by the Bank of Japan. After the loss-compensation
scandal by Japanese securities firms in 1991, some suggested deregulating the current fixed
commission system on equity transactions. This was met by strong opposition from the
securities firms as well as the government who were concerned about the adverse effect on
revenues for the securities industry. Under these circumstances of "give and take" between the
financial industry and the government, it is conceivable that domestic investment banks are
obliged to purchase government bonds even at unfavorable prices in order to maintain a good
long-term relationship with the government. Although the introduction of the auction system in
the JGB market is one step toward deregulation, the performance of Japanese and U.S.
investment banks as shown in our paper seem to indicate that the competition on a level playing
17
field is yet to be achieved.
5. Conclusions
Japan introduced an auction mechanism to sell government bonds after lengthy
negotiations with the U.S. and the U.K. This paper examines the performance of the U.S. firms
in the 10- and 20-year JGB auction market. We find that the U.S. firms quickly gained a
significant share of this market. While the U.S. share in the 10-year JGB auctions went through
ups and downs, the U.S. share has steadily increased over time in the 20-year JGB market. We
examined the relation between auction profits and winning shares by the "Big 4" Japanese and
U.S. investment banks. We find that the U.S. firms are more "profit sensitive" than their
Japanese counterparts. We present some possible explanations for this finding.
This paper also tested the predictions of auction theory with JGB auction data. We find
that the average auction profit is not reliably different from zero. We also do not find any
association between auction profits and measures of competition and dispersion of opinion
among bidders, as predicted by the theory. Our results indicate that the JGB auctions are better
characterized by auctions with an infinite number of bidders where perfect competition (resulting
in zero expected profits) is achieved, than by an auction with a finite number of bidders where
each informed bidder expects to make non-zero profits.
18
References
Bond Underwriters Association of Japan, Bond Review, December 1994
Cammack, Elizabeth, 1991, "Evidence of Bidding Strategies and the Information in Treasury Bill Auctions," Journal of Political Economy 99, 100-130.
Campbell, John, and Yasushi Hamao, 1993, "The Interest Rate Process and the Term Structure of Interest Rates in Japan," in Kenneth Singleton (ed.), Japanese Monetary Policy, Chicago, IL: University of Chicago Press.
Englebrecht-Wiggins, Richard, Paul Milgrom, and Robert Weber, 1983, "Competitive Bidding and Proprietary Information," Journal of Mathematical Economics 11, 161-169.
French, Kenneth and Robert McCormick, 1984, "Sealed Bids, Sunk Costs and the Process of Competition," Journal of Business 57, 417-441.
Goldstein, Henry, 1962, "The Friedman Proposal for Auctioning Treasury Bills," Journal of Political Economy 70, 386-92.
Jegadeesh, Narasimhan, 1993, "Treasury Auction Bids and the Salomon Squeeze," Journal of Finance 48, 1403-1419.
Kikugawa, Tadashi, and Kenneth Singleton, 1994, "Modeling the Term Structure of Interest Rates in Japan," Journal of Fixed Income 4-2, 6-16.
Milgrom, Paul, and Robert Weber, 1982, "A Theory of Auctions and Competitive Bidding," Econometrica 50, 1089-1122.
Nyborg, Kjell, and Suresh Sundaresan, 1994, "Discriminatory versus Uniform Treasury Auctions: Evidence from When-Issued Transactions," Working Paper, Columbia University.
Semkow, Brian, 1992, "Foreign Financial Institutions in Japan," Law and Policy in International Business 23, 331-413.
Umlauf, Steven, 1993, "An Empirical Study of the Mexican Treasury Bill Auction," Journal of Financial Economics 33, 313-340.
19
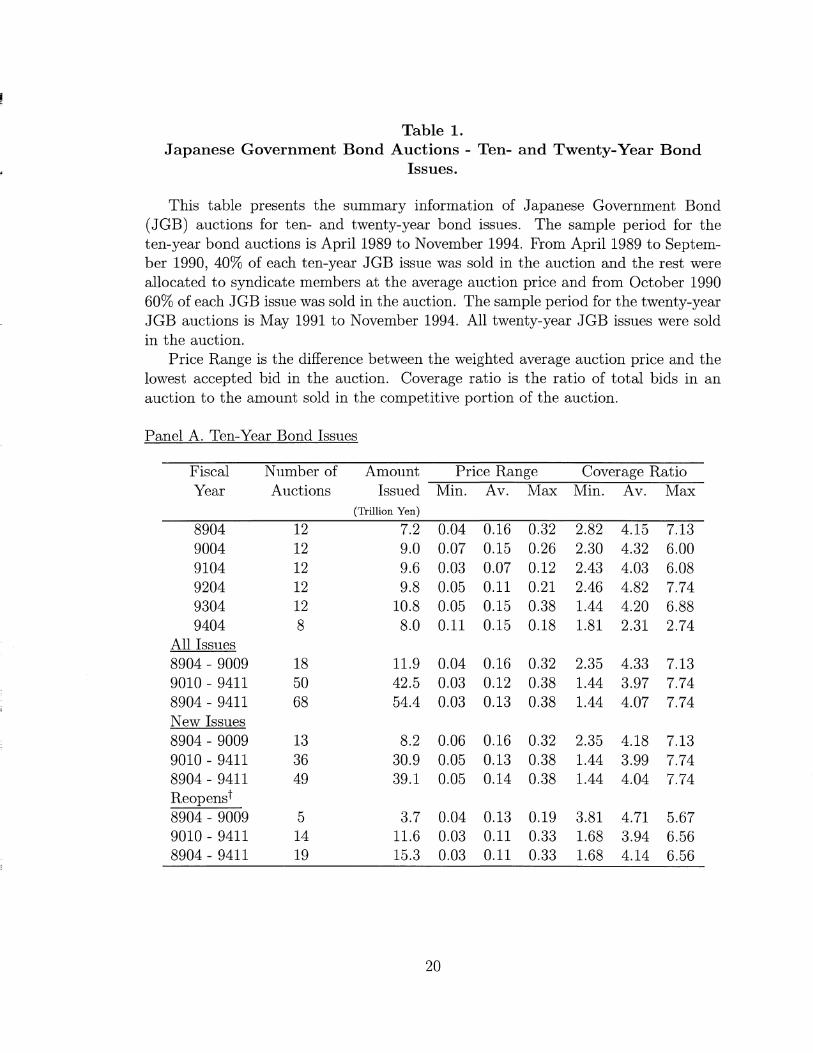
Table 1. Japanese Government Bond Auctions - Ten- and Twenty-Year Bond
Issues.
This table presents the summary information of Japanese Government Bond (JGB) auctions for ten- and twenty-year bond issues. The sample period for the ten-year bond auctions is April 1989 to November 1994. From April 1989 to September 1990, 40% of each ten-year JGB issue was sold in the auction and the rest were allocated to syndicate members at the average auction price and from October 1990 60% of each JGB issue was sold in the auction. The sample period for the twenty-year JGB auctions is May 1991 to November 1994. All twenty-year JGB issues were sold in the auction.
Price Range is the difference between the weighted average auction price and the lowest accepted bid in the auction. Coverage ratio is the ratio of total bids in an auction to the amount sold in the competitive portion of the auction.
20
21
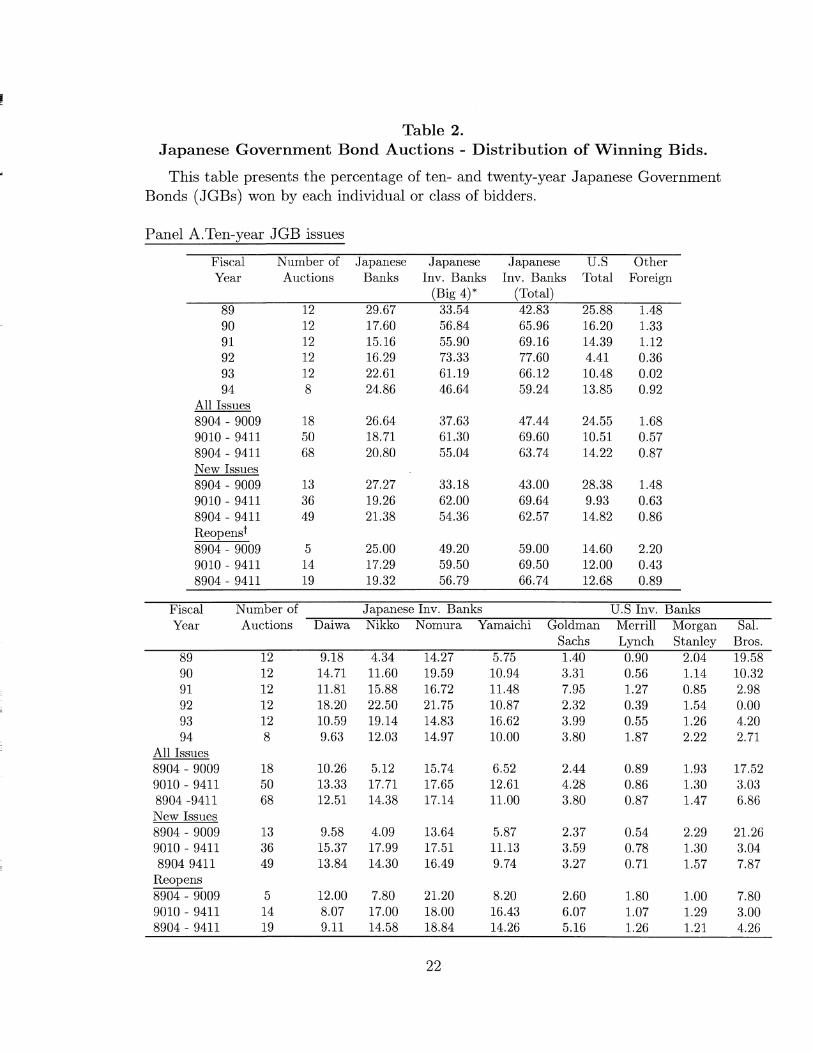
Table 2. Japanese Government Bond Auctions - Distribution of Winning Bids.
This table presents the percentage of ten- and twenty-year Japanese Government Bonds (JGBs) won by each individual or class of bidders.
22

23

Table 3. Profits to winning bids in Japanese Government Bond Auctions - Ten-
and Twenty-Year Bonds.
This table presents the average profits to winning bids in the ten- and twenty-year JGB auctions. Two measures of auction profits are reported here. AP t
a is the percentage change in price of the auction bond (expressed in basis points) from the value-weighted average auction price to the secondary market price at the close of t days after the auction. APf is the average percentage change in the secondary market price of three seasoned bonds with maturity closest to the auction bond. The secondary market price changes of seasoned bonds account for changes in accrued coupon and carrying costs.
24
25

I
26

Table 4 Association of Japanese Government Bond Auction Profits with Price
Range, Coverage ratio and Winning Shares of Japanese and U.S. Investment Banks: Regression Analysis
This table reports the parameter estimates of the following regression:
where auction profit is defined as APf—APtc; APf is the percentage change in price of
the auction bond (expressed in basis points) from the value-weighted average auction price to the secondary market price at the close of t days after the auction. AP£ is the average percentage change in the secondary market price of three seasoned bonds with the maturity closest to the auction bond. See Table 1 for definition of "Ratio" and "Range." "Big-4 Japan" is the fraction of the auction won by the following four Japanese investment banks: Daiwa, Nikko, Nomura and Yamaichi; "Big-4 U.S" is the fraction of the auction won by the following four U.S. investment banks: Goldman Sachs, Merrill Lynch, Morgan Stanley and Salomon Brothers, ^-statistics are reported in parentheses.
27

29
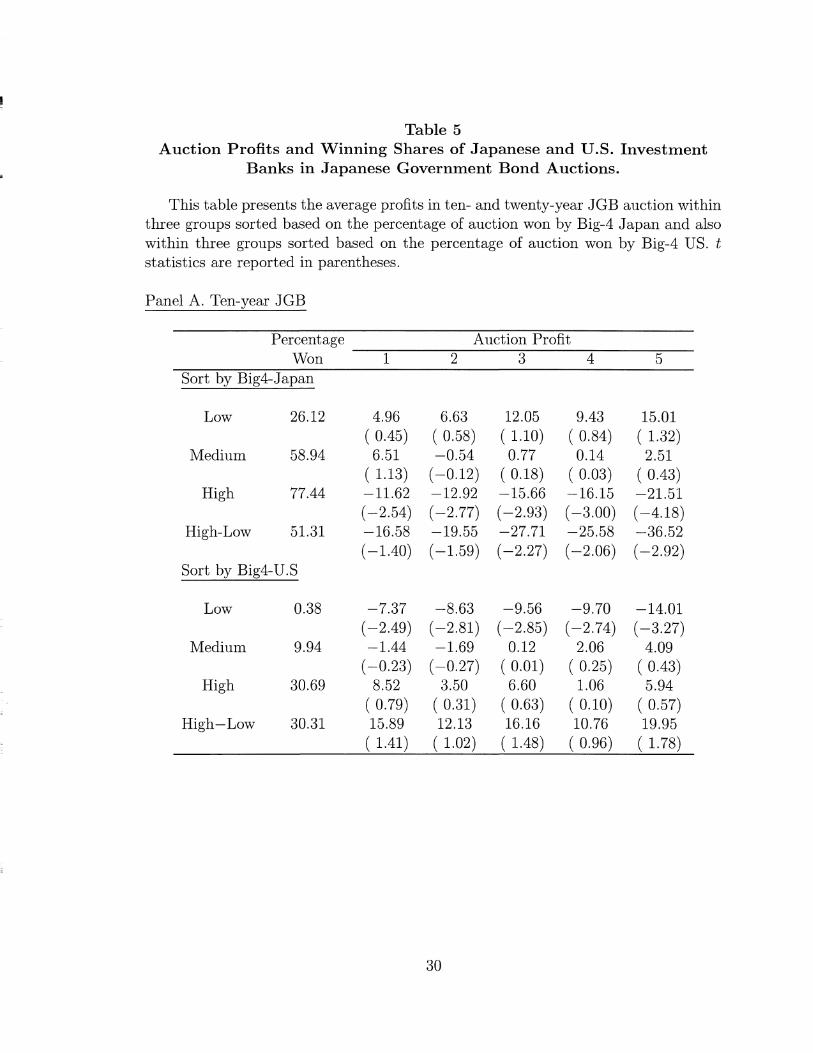
Table 5 Auction Profits and Winning Shares of Japanese and U.S. Investment
Banks in Japanese Government Bond Auctions.
This table presents the average profits in ten- and twenty-year JGB auction within three groups sorted based on the percentage of auction won by Big-4 Japan and also within three groups sorted based on the percentage of auction won by Big-4 US. t statistics are reported in parentheses.
Panel A. Ten-year JGB
30
31


![[REFERENCETRANSLATION] Japanese Government …...Japanese Government Bond Over-the-Counter Transaction Clearing Business Rules Chapter 1 General Provisions (Article 1 Purpose) 1. These](https://static.fdocuments.net/doc/165x107/5fb6cf4fd433311e084cb95e/referencetranslation-japanese-government-japanese-government-bond-over-the-counter.jpg)