Japan Oilseeds and Products Annual 2018 Japan Oilseeds … GAIN Publications... · ·...
31
THIS REPORT CONTAINS ASSESSMENTS OF COMMODITY AND TRADE ISSUES MADE BY USDA STAFF AND NOT NECESSARILY STATEMENTS OF OFFICIAL U.S. GOVERNMENT POLICY Date: GAIN Report Number: Approved By: Prepared By: Report Highlights: Steady economic growth in Japan is forecasted to contribute to moderate growth in vegetable oil production and consumption in marketing years 2017/18 and 2018/19. Greater expected profitability for rapeseed oil will lead to increased imports of rapeseed for crushing and reduced imports of oil-grade soybeans. Higher domestic soybean production will decrease demand slightly for imported identity preserved food-use soybeans. On tighter soybean meal imports from China, Japanese compound feed manufacturers will increase imports of distiller's dried grains with solubles from the United States. Industrial use of palm oil and palm kernel shells is forecasted to increase, taking advantage of Japan’s feed-in tariff. Daisuke Sasatani Jess K. Paulson 2018 Japan Oilseeds and Products Situation and Outlook Oilseeds and Products Annual Japan JA8019 4/1/2018 Required Report - public distribution
Transcript of Japan Oilseeds and Products Annual 2018 Japan Oilseeds … GAIN Publications... · ·...
THIS REPORT CONTAINS ASSESSMENTS OF COMMODITY AND TRADE ISSUES MADE BY
USDA STAFF AND NOT NECESSARILY STATEMENTS OF OFFICIAL U.S. GOVERNMENT
POLICY
Date:
GAIN Report Number:
Approved By:
Prepared By:
Report Highlights:
Steady economic growth in Japan is forecasted to contribute to moderate growth in vegetable oil
production and consumption in marketing years 2017/18 and 2018/19. Greater expected profitability
for rapeseed oil will lead to increased imports of rapeseed for crushing and reduced imports of oil-grade
soybeans. Higher domestic soybean production will decrease demand slightly for imported identity
preserved food-use soybeans. On tighter soybean meal imports from China, Japanese compound feed
manufacturers will increase imports of distiller's dried grains with solubles from the United States.
Industrial use of palm oil and palm kernel shells is forecasted to increase, taking advantage of Japan’s
feed-in tariff.
Daisuke Sasatani
Jess K. Paulson
2018 Japan Oilseeds and Products Situation and Outlook
Oilseeds and Products Annual
Japan
JA8019
4/1/2018
Required Report - public distribution

Oilseeds Section
Commodities:
Table 1: Production, supply and distribution of soybean (oilseed)
Oilseed, Soybean 2016/2017 2017/2018 2018/2019 Market Begin Year Oct 2016 Oct 2017 Oct 2018
Japan USDA Official New Post USDA Official New Post USDA Official New Post
Area Planted 150 150 155 150 0 152
Area Harvested 150 150 155 150 0 152
Beginning Stocks 255 255 212 212 0 220
Production 236 238 260 249 0 264
MY Imports 3175 3175 3250 3230 0 3088
Total Supply 3666 3668 3722 3691 0 3572
MY Exports 0 0 0 0 0 0
Crush 2392 2392 2350 2392 0 2269
Food Use Dom. Cons. 908 927 1000 940 0 940
Feed Waste Dom. Cons. 154 137 160 139 0 143
Total Dom. Cons. 3454 3456 3510 3471 0 3352
Ending Stocks 212 212 212 220 0 220
Total Distribution 3666 3668 3722 3691 0 3572
Yield 1.5733 1.5867 1.6774 1.66 0 1.7368
(1000 HA) ,(1000 MT) ,(MT/HA)
Table 2: Production, supply and distribution of rapeseed (oilseed)
Oilseed, Rapeseed 2016/2017 2017/2018 2018/2019 Market Begin Year Oct 2016 Oct 2017 Oct 2018
Japan USDA Official New Post USDA Official New Post USDA Official New Post
Area Planted 0 2 0 2 0 2
Area Harvested 2 2 2 2 0 2
Beginning Stocks 67 67 21 13 0 18
Production 4 4 4 4 0 4
MY Imports 2392 2392 2450 2442 0 2543
Total Supply 2463 2463 2475 2459 0 2565
MY Exports 0 0 0 0 0 0
Crush 2437 2437 2450 2436 0 2542
Food Use Dom. Cons. 0 0 0 0 0 0
Feed Waste Dom. Cons. 5 13 5 5 0 5
Total Dom. Cons. 2442 2450 2455 2441 0 2547
Ending Stocks 21 13 20 18 0 18
Total Distribution 2463 2463 2475 2459 0 2565
Yield 2 2 2 2 0 2
(1000 HA) ,(1000 MT) ,(MT/HA)
Oilseed, Rapeseed
Oilseed, Soybean
Area Harvested
Soybean
Japan has adopted measures to increase the planting of soybeans such as rice paddy and dry field
diversion incentives. Based on planting records since the programs were implemented, FAS/Tokyo
forecasts Japan’s soybean planted area to increase 152,000 hectares (ha) in marketing year (MY;
October to September) 2018/19—a marginal increase of 2,000 hectares ha from the revised 2017/18
planted area.
Based on Ministry of Agriculture, Forestry and Fisheries (MAFF) production data, FAS/Tokyo has
revised the MY2017/18 planted area to 150,200 ha—a decrease of 3 percent from the previous forecast.
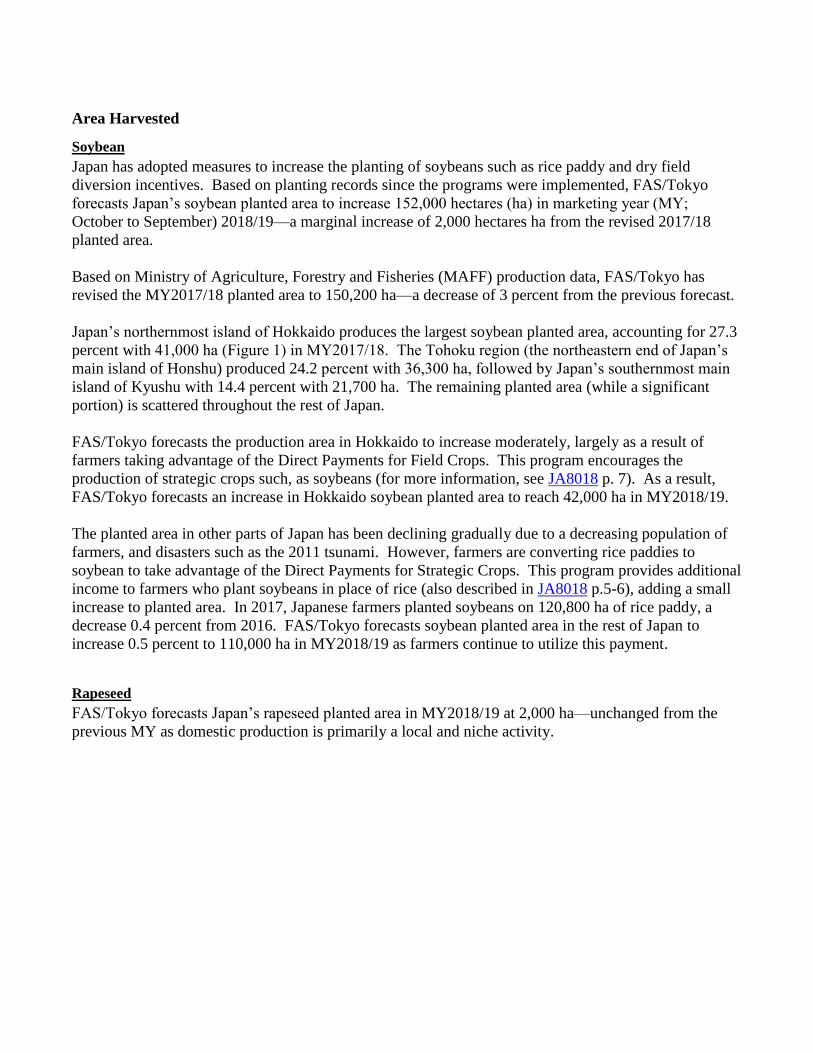
Japan’s northernmost island of Hokkaido produces the largest soybean planted area, accounting for 27.3
percent with 41,000 ha (Figure 1) in MY2017/18. The Tohoku region (the northeastern end of Japan’s
main island of Honshu) produced 24.2 percent with 36,300 ha, followed by Japan’s southernmost main
island of Kyushu with 14.4 percent with 21,700 ha. The remaining planted area (while a significant
portion) is scattered throughout the rest of Japan.
FAS/Tokyo forecasts the production area in Hokkaido to increase moderately, largely as a result of
farmers taking advantage of the Direct Payments for Field Crops. This program encourages the
production of strategic crops such, as soybeans (for more information, see JA8018 p. 7). As a result,
FAS/Tokyo forecasts an increase in Hokkaido soybean planted area to reach 42,000 ha in MY2018/19.
The planted area in other parts of Japan has been declining gradually due to a decreasing population of
farmers, and disasters such as the 2011 tsunami. However, farmers are converting rice paddies to
soybean to take advantage of the Direct Payments for Strategic Crops. This program provides additional
income to farmers who plant soybeans in place of rice (also described in JA8018 p.5-6), adding a small
increase to planted area. In 2017, Japanese farmers planted soybeans on 120,800 ha of rice paddy, a
decrease 0.4 percent from 2016. FAS/Tokyo forecasts soybean planted area in the rest of Japan to
increase 0.5 percent to 110,000 ha in MY2018/19 as farmers continue to utilize this payment.
Rapeseed
FAS/Tokyo forecasts Japan’s rapeseed planted area in MY2018/19 at 2,000 ha—unchanged from the
previous MY as domestic production is primarily a local and niche activity.
Production
Soybean
Yields were considerably higher in Hokkaido, where the weather and field type are more suitable to
soybean production. Favorable weather in Hokkaido contributed to an improved national average yield
of 1.66 metric tons (MT)/ha in MY2017/18, up from 1.59 in MY2016/17. Assuming normal weather
conditions, Japanese soybean yield is expected to be 1.74 metric tons (MT)/ha, resulting in 264,000 MT
of soybeans produced in MY2018/19. Virtually all soybeans produced in Japan are used by domestic
soy food manufacturers (e.g., tofu, miso, and natto) or consumed locally. Therefore, domestic
production does not compete with the bulk of soybean imports, which are used for oil crush and feed.
However, a marginal increase in domestic soybean production will reduce demand for imported food-
grade special variety soybeans from the United States, Canada, and China.
The official MAFF production report for soybeans is 238,000 MT in 2016/17 and 248,600 MT in
2017/18. FAS/Tokyo revises Japan’s MY2017/18 soybean production down 11,000 MT, a reduction of
4 percent from the previous forecast based on smaller than expected planted area.
The “Basic Plan for Food, Agriculture and Rural Areas” sets a soybean production target of 320,000 MT
by 2025 (see JA5013 for more information). However, limited planted area for soybean production
makes reaching this target unlikely.

It is important to note that these forecasts do not include edamame area or production. Edamame are
soybeans harvested before they mature, and MAFF classifies edamame as a vegetable. In 2016 (the last
year data is available), Japan planted 12,800 ha and harvested 66,000 MT of edamame. Edamame
cultivation is popular in the northwestern region that faces the Sea of Japan (e.g., Niigata, Yamagata,
Akita), the Kanto area (e.g., Gunma, Chiba, Saitama, and Kanagawa), and Hokkaido.
Rapeseed
Rapeseed production is forecast to remain unchanged at 4,000 MT in MY2018/19. Rapeseed is
sometimes planted for landscape and ornamental purposes that are not included in these numbers.
Domestic rapeseed is generally consumed by small local crushers. Japan is expected to increase the
planted area of rapeseed, but by a negligible amount that does not register in the reported value.
Demand and Consumption
Japanese Demographics and Economy
Economic growth and recession cycles suspend or reverse the general trend of gradual decline in
consumption. Japan’s population has been aging for decades and officially began to shrink in 2004.
Japan’s Ministry of Internal Affairs and Communications estimates that Japan’s total population peaked
at 127,840,000 in December 2004 and was 126,560,000 in February 2018. Further, the ratio of people
aged 65 and above jumped from 19.5 percent in 2004 to 27.9 percent in 2018. The National Institute of
Population and Social Security Research forecasts Japan’s population to decline below 100 million by
the year 2053, and that the ratio of people aged 65 and above is expected to reach 40 percent. Although
senior consumers present a marketing opportunity for soybean food and soy protein products, the trend
contributes to the general decline in consumption.
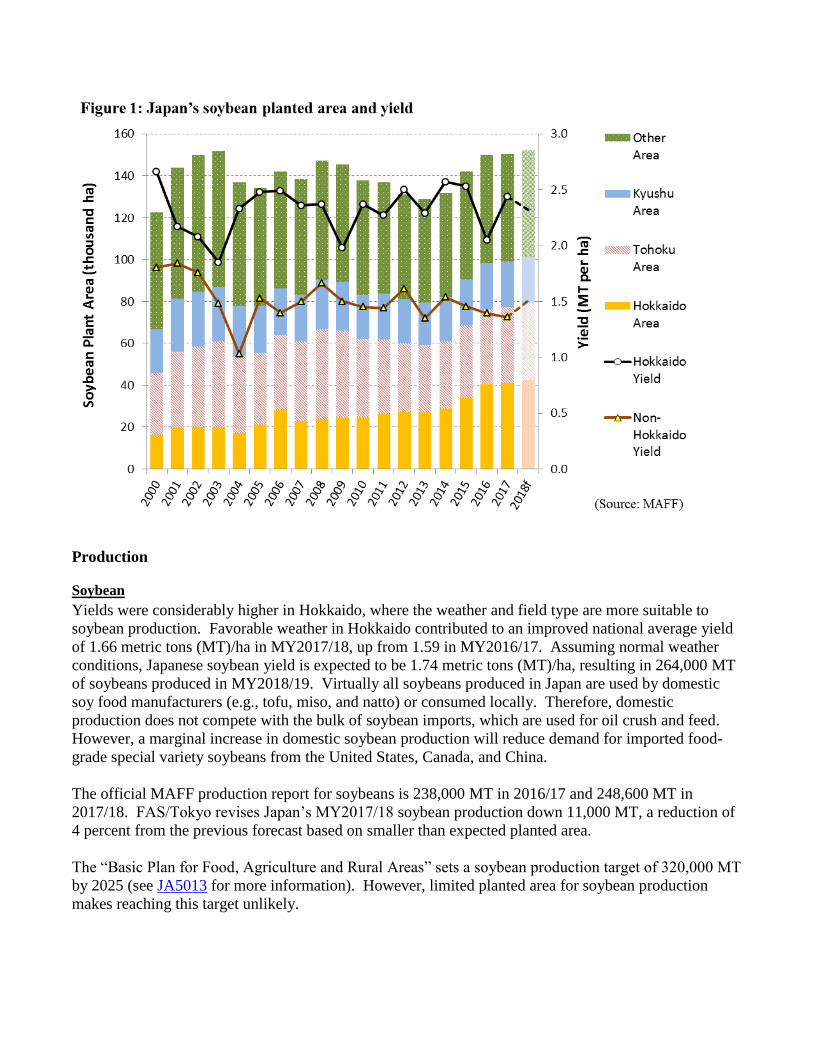
Similar to the effect of demographics, the strength of the economy has a direct effect on vegetable oil
consumption as consumers increase or decrease dining out. Japan’s Cabinet Office reported that Japan’s
real gross domestic product (GDP) has grown for eight straight quarters, which is the longest growth
streak since 1980 (Figure 2). Japan’s real GDP expanded 0.9 percent in 2016 and 1.7 percent in 2017.
As of January 2018, the International Monetary Fund (IMF) has forecast Japan’s economy to grow 1.2
percent in 2018 and 0.9 percent in 2019.
And as the economy moves through cycles, currency fluctuations also influence the balance between
rapeseed and soybean imports. During the global financial crisis in 2007 and 2008, the Japanese yen
became a currency safe-haven and contributed to an appreciation of the yen against the U.S. dollar.
Simultaneously, commodity prices fell and commodity currencies, such as the Canadian dollar,
depreciated. At the end of 2012, Shinzo Abe was reelected as Prime Minister, and the cabinet and the
Bank of Japan began the policy commonly known as “Abenomics.” Monetary easing and fiscal
stimulus led to a rapid depreciation of the Japanese yen. Since then, exports and stronger global demand
for Japanese products have driven an expansion that has helped to offset a shrinking and ageing
population.
In addition, inbound tourists have contributed to Japanese economy and consumption. According to the
Japan Tourism Agency, 28.7 million tourists visited Japan in 2017 (an increase of 15.4 percent from
2016) contributing an additional 4.4 trillion yen to the economy. The Cabinet approved the Tourism-
based Country Promotion Basic Act in 2017 with the hop of attracting 40 million tourists who will
contribute 8 trillion yen to the economy by 2020.
Vegetable Oil Demand and Domestic Crush
Japan’s production of edible vegetable oils declined following the global economic crisis in 2008 and
has recovered steadily over the last ten years. Figure 3 depicts monthly crushing data and the long-term
trend and growth in edible oil production. The trend of Japanese vegetable oil production in Figure 3
highly correlates to Japanese real GDP in Figure 2.
There are three reasons why Japan’s vegetable oil production has increased despite Japan’s shrinking
and aging population. First, as the economy recovers, people eat out more often and consume more
ready-to-eat food products. Second, in part due to a weak Japanese yen, Japan has been a popular
destination for tourists and Japanese exports of processed food products have increased. Third, a weaker
yen made domestically produced vegetable oil cheaper and imported oil products more expensive to
Japanese consumers, and hotel, restaurant and institutional (HRI) and food manufacturing sectors.

FAS/Tokyo forecasts that Japan’s edible vegetable oil (soy, rapeseed, corn, rice bran, sesame,
cottonseed, and others) production will increase 0.5 percent to 1.74 million MT in MY2017/18 based on
moderate economic growth and projections for increased tourism. FAS/Tokyo forecasts total edible
vegetable oil production to further increase 1 percent in MY2018/19 to 1.76 million MT on continued
economic growth, including further expansion of tourism.
Industry contacts expect oil production to increase slightly over the next few years, especially through
the Tokyo Olympic Games in 2020. However, they also expect oil production to decline shortly after
the Olympics due to Japan’s liberalization of import tariffs with the effectuation of the Japan-EU
Economic Partnership Agreement (EPA) and the Comprehensive and Progressive Agreement for Trans-
Pacific Partnership (CPTPP), which reduce the duties on imported vegetable oils.
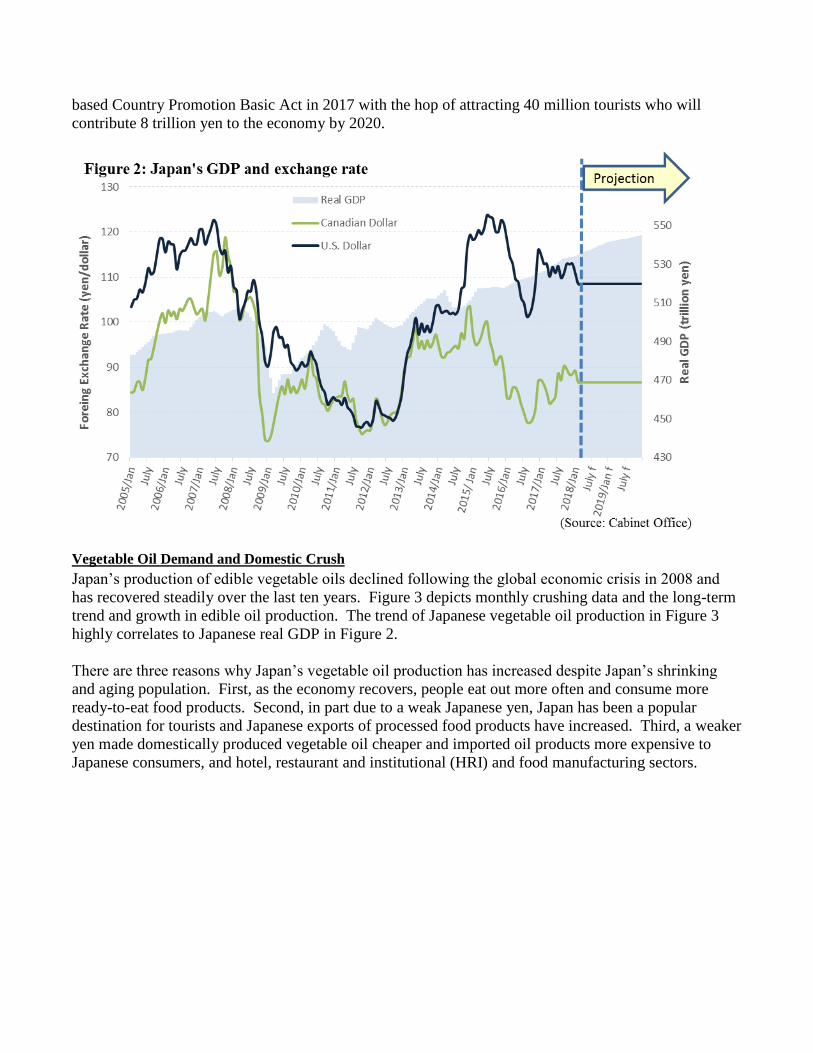
During the period from 2007 to 2012, Canadian rapeseed became relatively cheaper than U.S. soybeans.
As shown in Figure 4, the Japanese oil industry increased the crush of rapeseed and decreased the crush
of soybeans at that time. In 2013, U.S. soybeans became relatively cheaper than Canadian rapeseed and
the Japanese oil industry increased the crush of soybeans and reduced rapeseed crush. Although many
different global factors drive the price fluctuation of rapeseed and soybeans, the empirical
competitiveness of rapeseeds and soybeans in Japan’s vegetable oil production highly correlates to the
yen-dollar exchange rate (i.e., a stronger Japanese yen equates to increased imports of rapeseed, relative
to the import of soybeans).
While currency exchange is one variable that tracks the proportional volumes of Japanese soybean oil
and rapeseed oil production, this correlation loosened in 2016. Contrary to the respective exchange
rates, the production of soybean oil is higher and production of rapeseed oil is lower than the exchange
rate would suggest. FAS/Tokyo has identified two possible explanations for this discrepancy. First, J-
Oil Mills, one of the largest oil crushers in Japan, built a new soybean crushing plant in Kurashiki,
Okayama Prefecture, and began full operations in June 2017 (See JA7046). The capacity of the mill is
370,000 MT/year (70,000 MT/year of oil and 300,000 MT of meal), and crushes solely soybeans.
The second reason, however, provides more insight. Since autumn 2016, Japan’s import of soybean
meal from China declined significantly. (For more information on this development, please see the
Meals section.) FAS/Tokyo believes that reduced access to imported soybean meal from its neighbors,
Japanese domestic crush will continue to outpace the historic correlation with the yen-dollar exchange
rate over the short term. In particular, soybean oil production is expected to rise 8.5 percent more than
what the exchange rate would suggest, while that of rapeseed oil is expected to decline 3.5 percent over
the same period.
FAS/Tokyo forecasts Japan’s rapeseed oil production to increase to 1.07 million MT in MY2017/18 as
higher profitability is expected to encourage an increase in rapeseed oil production. Industry contacts
believe this profitability will continue into MY2018/19, and therefore FAS/Tokyo forecasts an increase
in rapeseed oil production to 1.11 million MT in MY2018/19.
On the other hand, FAS/Tokyo forecasts Japan’s soybean oil production to decrease very slightly to
463,000 MT in MY2017/18, given lower profitability but high demand for soybean meal. Consistent
with the forecast for rapeseed oil, FAS/Tokyo forecasts MY2018/19 soybean oil production to decline to
442,000 MT in MY2018/19.
Based on this volume of soybean oil demand, and applying an oil extraction rates for soybeans of 0.194,
FAS/Tokyo forecasts Japan’s total soybean demand at 2.39 million MT in MY2017/18. Applying an oil
extraction rate of 0.195 MT to the forecast soybean oil demand in MY2018/19, FAS/Tokyo expects total
Japanese demand for soybeans to decrease to 2.27 million MT.
Similarly, based on a rapeseed oil extraction rate of 0.439, FAS/Tokyo expects Japan’s total demand for
rapeseed to increase to 2.44 million MT in MY2017/18. An extraction rate of 0.437 in MY2018/19 is
projected to increase demand for rapeseed to 2.54 million MT.
Soybean Food Demand
Soybeans are an essential food ingredient in the Japanese diet, but Japan relies on imported soybeans to
meet demand. As Japanese soy manufacturers are reluctant to market products made from genetically
engineered (GE) soybeans, a substantial portion of Japan’s food soy demand is met by identity-
preserved (IP) soybeans from the U.S. and Canada, as well as soybeans from China. MAFF claims that
virtually all Japanese soybeans are used for food consumption. Between 76 and 79 percent of Japanese
soybean production is used by processed foods manufacturers. The remainder, roughly 40,000 MT, is
consumed or traded locally.
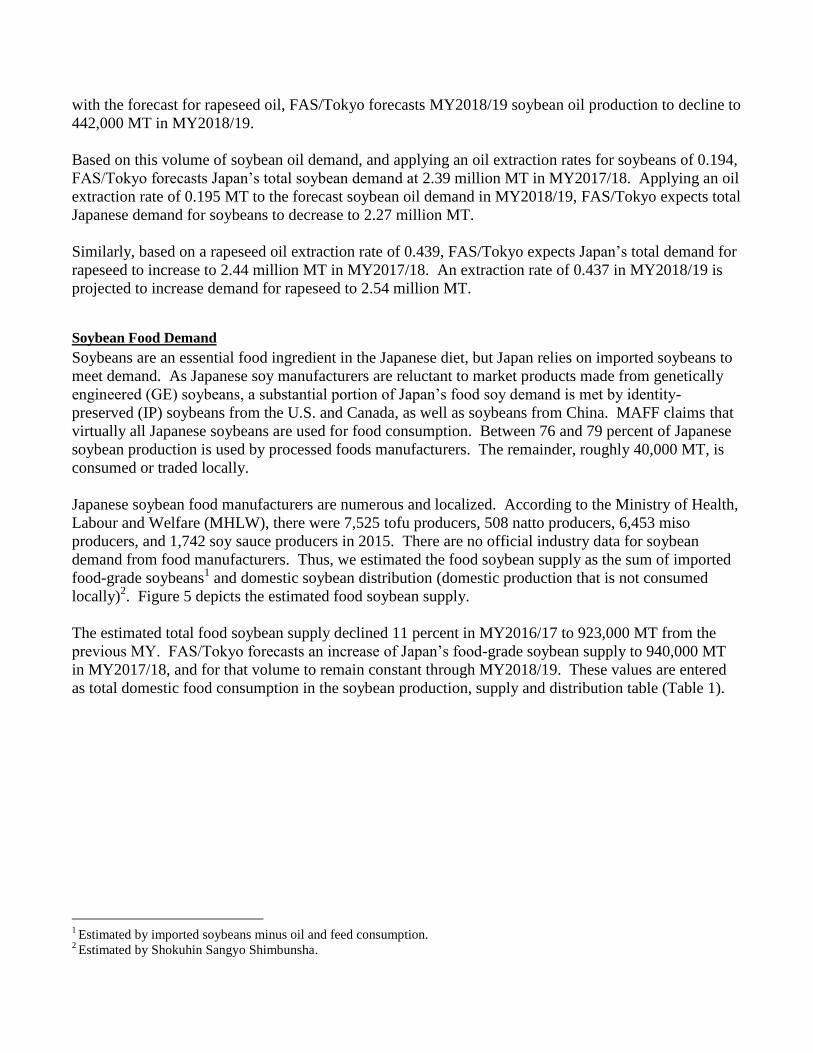
Japanese soybean food manufacturers are numerous and localized. According to the Ministry of Health,
Labour and Welfare (MHLW), there were 7,525 tofu producers, 508 natto producers, 6,453 miso
producers, and 1,742 soy sauce producers in 2015. There are no official industry data for soybean
demand from food manufacturers. Thus, we estimated the food soybean supply as the sum of imported
food-grade soybeans1 and domestic soybean distribution (domestic production that is not consumed
locally)2. Figure 5 depicts the estimated food soybean supply.
The estimated total food soybean supply declined 11 percent in MY2016/17 to 923,000 MT from the
previous MY. FAS/Tokyo forecasts an increase of Japan’s food-grade soybean supply to 940,000 MT
in MY2017/18, and for that volume to remain constant through MY2018/19. These values are entered
as total domestic food consumption in the soybean production, supply and distribution table (Table 1).
1 Estimated by imported soybeans minus oil and feed consumption.
2 Estimated by Shokuhin Sangyo Shimbunsha.
Local consumption of soybeans (those consumed by farmers or within the community) should be
considered separate from the total supply. The total Japanese food soybean supply for food
manufacturers is therefore estimated to be 883,000 MT in MY2016/17 and 900,000 MT in MY2017/18
and in MY2018/19 (Figure 5).
Japanese food manufacturers imported approximately 427,000 MT of U.S. IP food-grade soybeans in
MY 2015/16 (43.7 percent market share) and 338,000 MT in MY2016/17 (38.2 percent market share).
Canada and the U.S. compete in the Japanese food soybean market, and many factors, such as
production volume and exchange rate, determine their market share. As discussed earlier, Japan is
expected to increase soybean production, increasing the volume of domestic beans in the market and
reducing the need for imports.
Domestic soybean production is expected to increase 12.2 percent to 208,600 MT in MY2017/18, and
230,000 MT in MY2018/19. Taking advantage of a weaker Canadian dollar and strong IP soybean
production, Canada is expected to increase food-grade soybean exports to Japan over the short term.
Therefore, the market share of U.S. food-grade soybeans is expected to drop to 37.1 percent (334,000
MT) in MY2017/18.
The food industry news journal, Shokuhin Sangyo Shimbunsha, estimates the use and consumption of
food-grade soybeans every calendar year. Their estimates are based on data collected from food
industry organizations, trade statistics, MAFF data, and the opinions of industry experts. The estimated
food-grade soybean demand of food manufacturers has been stable since 2010 (Figure 6).

The tofu industry is estimated to have used 455,000 MT of soybeans in 2017, of which approximately
40 percent were U.S. IP soybeans, and 24 percent were domestic soybeans. The natto industry used
138,000 MT of soybeans in 2017, of which 72 percent were U.S. IP soybeans, 7 percent were Canadian
IP soybeans, and 20 percent were domestic soybeans. The miso industry used 118,000 MT of soybeans,
of which approximately 46 percent were U.S. IP soybeans, 37 percent were Canadian IP soybeans, and 8
percent were domestic soybeans. Soy milk producers and koya tofu (freeze-dried tofu) producers used
52,000 and 20,000 MT of soybeans, respectively. Producers of simmered soybeans used 56,000 MT in
2017. The soy sauce industry used 27,000 MT of soybeans, but this accounts for about 20 percent of
soy sauce production, and another 80 percent of soy sauce is made from soybean meal, which we’ll
discuss in the Meals section.
Because soy food manufacturers demand specific characteristics for their products, these industries
strongly prefer specific soybean varieties. Approximately, 60 percent of domestic soybeans are
contracted to Japan Agricultural Cooperatives (or similar entities) for collection and distribution to
wholesalers, and therefore receive direct payment subsidies. As the consignee, the cooperative is able to
determine the varieties of soybean the farmers plant, which is closely tied to the type of soybeans
demanded by food manufacturers. For example, the tofu industry prefers high-protein soybeans,
whereas the natto industry prefers soybeans of a uniform size. Manufacturers of simmered soybeans,
however, prefer large and sweet soybeans. And yet other food manufacturers, such as some tofu
producers, prefer to use older soybeans, which they believe offer better flavor. For more information
about the availability of new soybean varieties, and why they aren’t adopted as quickly, please see pages
3-4 of JA7046.
Industry experts explain that Japanese food soybean manufacturers and wholesalers have held additional soybeans in MY2015/16. They explain that Japan procured additional food soybeans in MY2015/16 to compensate for supply constraints during the port strike on the U.S. west coast from the end of 2014 to the

beginning of 2015. A significant volume of U.S. IP soybeans are transported to west coast by train and then shipped to Japan in containers. Food soybean imports then declined 13.5 percent in MY2016/17 as food manufacturers consumed and reduced their stocks. The moving average of food-grade soybean supplies was added to Figure 6 (green line), and it seems to more accurately reflect the actual consumption of the Japanese processed food sector. However, it is extremely difficult to accurately estimate the stock level of food-grade
soybean as these are included in the food use consumption rather than in stocks in the soybean production,
supply and distribution table (Table 1).
Feed, Seed, Waste Consumption
We assume that 1 percent of soybean imports and 5 percent of domestic production are loss/feed.
Approximately 50 kg of soybeans are needed to plant every 1 ha field of soybean and edamame.
Accordingly, Japan will require 8,150 MT to plant 150 ha of soybean and 13 ha of edamame fields in
MY2017/18. Consistent with our forecast for increased domestic production, Japanese seed demand
will increase to 8,250 MT to plant 152 ha of soybean and 13 ha of edamame fields in MY2018/19.
According to MAFF, 79,877 MT of soybeans were used for livestock and poultry feeding in
MY2016/17. FAS/Tokyo estimates 78,000 MT and 77,000 MT of soybeans to be used for animal feed
in MY2017/18 and in MY2018/19, respectively. Approximately 5,000 MT were annually used to feed
other animals, such as aquaculture.
Consumption Summary
Soybean
The total Japanese domestic consumption of soybeans is expected to increase very slightly to 3.5 million
MT in MY2017/18. Of this volume, 68 percent (or 2.39 million MT) is for crushing, and 27 percent
(940,000 MT) is consumed as food, and the rest is feed and waste.
The total consumption of soybean oil in MY2018/19 is expected to decrease 4 percent to 3.35 million
MT as higher profitability is expected to encourage an increase in rapeseed oil production. As a result,
soybean consumption for crushing is expected to decrease 5 percent to 2.27 million MT, while food
soybean consumption is staple, expected to remain at 940,000 MT in MY2018/19.
Rapeseed
The total Japanese rapeseed consumption is expected to be 2.44 million MT in MY2017/18, virtually all
of which is for crushing. MY2018/19 total consumption is expected to increase 4 percent to 2.54
million MT on higher profitability of rapeseed crush.
Policy
Japan’s Consumer Affairs Agency is reviewing Japan’s labeling requirements for genetically engineered
products. Proposed revisions to current requirements for GE labeling are of great concern to Japanese
food manufacturers who may not be able to claim that products are free of GE despite procuring IP
soybeans. The timeline for the adoption of a new requirement is still undetermined. For additional
information on the proposed policies, see JA7067, JA7093, JA7121, JA8014, and JA8017.
Trade

As soybean oil crush is steady and food-grade soybean stock is reduced, Japan is expected to increase
soybean imports 1.7 percent to 3.23 million MT in MY2017/18. However, as rapeseed oil is expected to
replace soybean oil, soybean exports are then expected to decline 4.4 percent in MY2018/19 to 3.09
million MT.
Of Japan’s estimated oil and feed-grade soybean imports in 2016/17, approximately 20 percent was
from Brazil and 80 percent was from the United States. U.S. imports in MY2016/17 were slightly
higher than the long term average (77.5 percent) due to a strong harvest. FAS/Tokyo forecasts a slight
increase in oil and feed beans from Brazil to 559,000 MT (22.5 percent) in MY2017/18, and a decrease
of 2.1 percent in U.S. soybeans to 1.92 million MT (77.5 percent) due to lower U.S. protein content.
With a forecast increase in rapeseed and distiller’s dried grains with solubles (DDGS) utilization in
MY2018/19, Japanese demand for U.S. soybeans is expected to decline a further 5 percent to 1.82
million MT.
FAS/Tokyo estimates Japan’s import of rapeseed at 2.44 million MT in MY2017/18, and forecasts an
increase of 4.3 percent to 2.54 million MT in MY2018/19.
Stocks
Japanese oil crushers typically keep 3-4 weeks of inventory on hand. MAFF data show that soybean
stock held by oil crushers were 255,229 MT at the beginning of MY2016/17 (October 1, 2016). The
number dropped to 212,452 MT by the end of MY2016/17 (September 30, 2017).
FAS/Tokyo estimates Japanese rapeseed stock at 67,000 MT at the beginning of MY2016/17. MAFF
data shows stocks sharply declined during MY2016/17, and FAS/Tokyo estimates rapeseed stock
numbers at 13,000 MT at the end of MY2016/17.
Japan is a net-importer of oilseeds, and trading houses and oil crushers plan the logistics of their supplies
efficiently, maintaining relatively small inventories. FAS/Tokyo estimates crushers’ stocks to remain at
approximately 220,000 MT for soybeans, and 18,000 MT for rapeseed.
Data for food-grade soybeans stocks are unavailable. As some food manufacturers prefer to use aged
soybeans, food manufactures hold quite large soybean stocks. During MY2016/17, FAS/Tokyo
estimates food manufacturers consumed 34,000 MT from stocks as they reduced from volumes built
during the west coast disruption in 2014. However, soybean stocks held by food manufacturers are
included in the food use domestic consumption category rather than recorded as soybean stocks in the
production, supply and distribution table (Table 1).
Meals Section
Commodities:
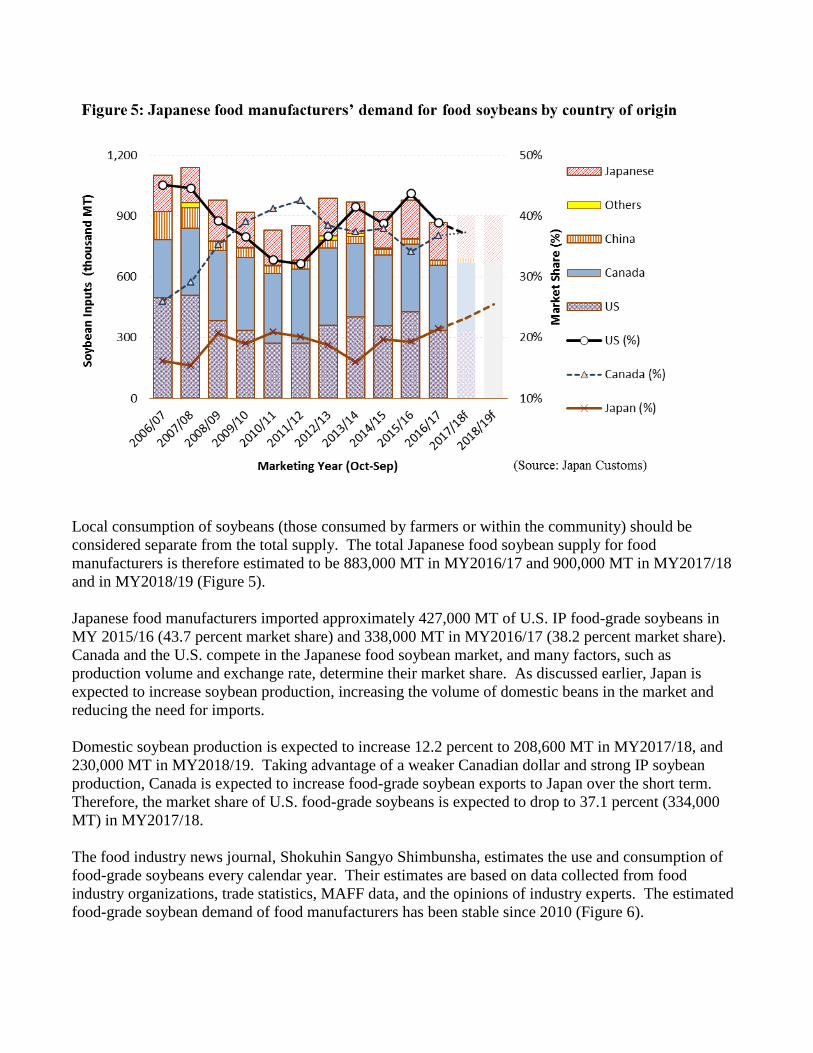
Table 3: Production, supply and distribution of soybean meal
Meal, Fish
Meal, Palm Kernel
Meal, Rapeseed
Meal, Soybean
Meal, Soybean 2016/2017 2017/2018 2018/2019 Market Begin Year Oct 2016 Oct 2017 Oct 2018
Japan USDA Official New Post USDA Official New Post USDA Official New Post
Crush 2392 2392 2350 2392 0 2269
Extr. Rate, 999.9999 0.7546 0.7546 0.7532 0.7533 0 0.7558
Beginning Stocks 47 47 50 50 0 50
Production 1805 1805 1770 1802 0 1715
MY Imports 1621 1621 1700 1565 0 1524
Total Supply 3473 3473 3520 3417 0 3289
MY Exports 0 1 0 1 0 1
Industrial Dom. Cons. 280 245 280 240 0 240
Food Use Dom. Cons. 120 180 140 181 0 182
Feed Waste Dom. Cons. 3023 2997 3050 2945 0 2816
Total Dom. Cons. 3423 3422 3470 3366 0 3238
Ending Stocks 50 50 50 50 0 50
Total Distribution 3473 3473 3520 3417 0 3289
(1000 MT) ,(PERCENT)
Table 4: Production, supply and distribution of rapeseed meal
Meal, Rapeseed 2016/2017 2017/2018 2018/2019 Market Begin Year Oct 2016 Oct 2017 Oct 2018
Japan USDA Official New Post USDA Official New Post USDA Official New Post
Crush 2437 2437 2450 2436 0 2542
Extr. Rate, 999.9999 0.556 0.5511 0.5551 0.5554 0 0.5527
Beginning Stocks 61 61 57 40 0 50
Production 1355 1343 1360 1353 0 1405
MY Imports 8 8 7 8 0 8
Total Supply 1424 1412 1424 1401 0 1463
MY Exports 7 7 5 7 0 7
Industrial Dom. Cons. 250 157 250 219 0 238
Food Use Dom. Cons. 0 0 0 0 0 0
Feed Waste Dom. Cons. 1110 1208 1120 1125 0 1168
Total Dom. Cons. 1360 1365 1370 1344 0 1406
Ending Stocks 57 40 49 50 0 50
Total Distribution 1424 1412 1424 1401 0 1463
(1000 MT) ,(PERCENT)
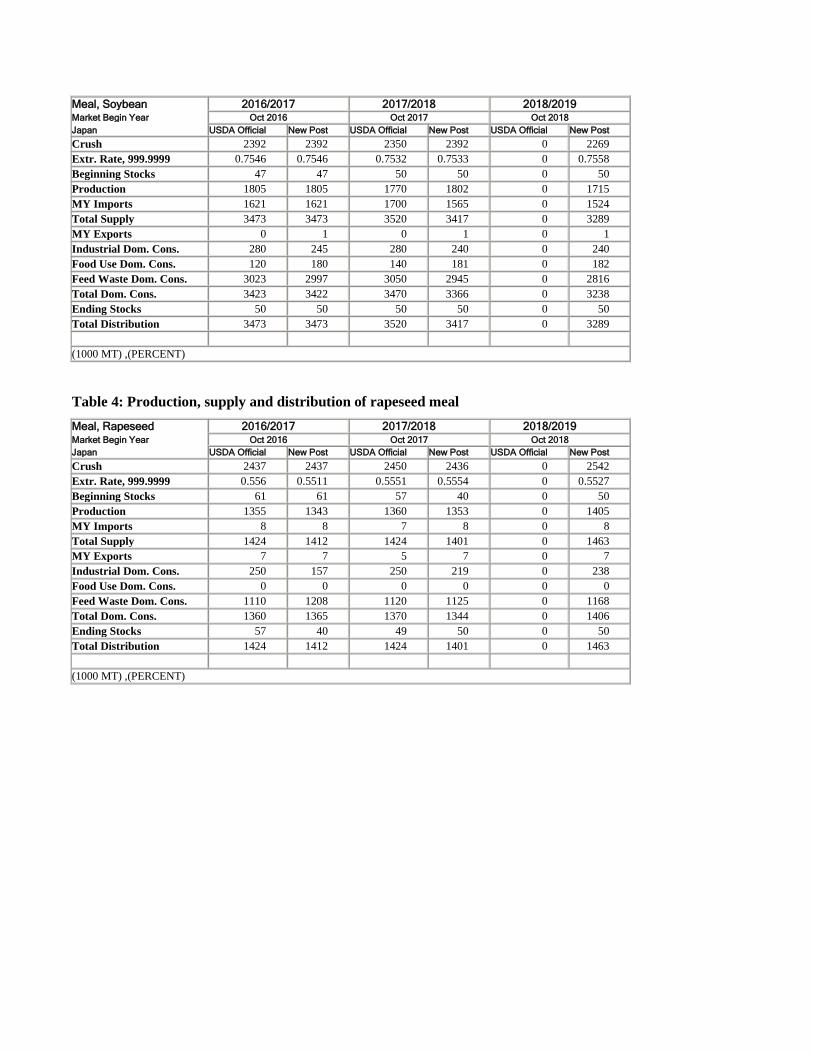
Table 5: Production, supply and distribution of palm kernel meal and palm kernel shell
Meal, Palm Kernel 2016/2017 2017/2018 2018/2019 Market Begin Year Oct 2016 Oct 2017 Oct 2018
Japan USDA Official New Post USDA Official New Post USDA Official New Post
Crush 0 0 0 0 0 0
Extr. Rate, 999.9999 0 0 0 0 0 0
Beginning Stocks 0 0 0 0 0 0
Production 0 0 0 0 0 0
MY Imports 1109 1109 1200 1306 0 1550
Total Supply 1109 1109 1200 1306 0 1550
MY Exports 0 7 0 0 0 0
Industrial Dom. Cons. 1100 1093 1191 1297 0 1541
Food Use Dom. Cons. 0 0 0 0 0 0
Feed Waste Dom. Cons. 9 9 9 9 0 9
Total Dom. Cons. 1109 1102 1200 1306 0 1550
Ending Stocks 0 0 0 0 0 0
Total Distribution 1109 1109 1200 1306 0 1550
(1000 MT) ,(PERCENT)
Note: Stocks only include palm kernel meals, and do not include palm kernel shells.
Table 6: Production, supply and distribution of fish meal
Meal, Fish 2016/2017 2017/2018 2018/2019 Market Begin Year Jan 2017 Jan 2018 Jan 2018
Japan USDA Official New Post USDA Official New Post USDA Official New Post
Catch For Reduction 860 840 860 835 0 830
Extr. Rate, 999.9999 0.2151 0.2155 0.2151 0.2156 0 0.2157
Beginning Stocks 14 14 18 14 0 14
Production 185 181 185 180 0 179
MY Imports 180 180 160 162 0 149
Total Supply 379 375 363 356 0 342
MY Exports 1 4 2 2 0 2
Industrial Dom. Cons. 50 50 50 48 0 46
Food Use Dom. Cons. 0 0 0 0 0 0
Feed Waste Dom. Cons. 310 307 295 292 0 280
Total Dom. Cons. 360 357 345 340 0 326
Ending Stocks 18 14 16 14 0 14
Total Distribution 379 375 363 356 0 342
(1000 MT) ,(PERCENT)
Production
Based on the forecasted oilseeds consumption of Japanese crushers in the previous Oilseeds Section,
Japan is expected to produce 1.80 million MT of soybean meal in MY2017/18 and to decrease 5 percent
to 1.72 million MT in MY2018/19 as rapeseed oil is expected to replace soybean oil. As Japanese
crushers expect higher profitability from rapeseed, Japan is expected to increase rapeseed meal
production to 1.35 million MT in MY2017/18. Based on industry contacts expectations that this
profitability will continue, FAS/Tokyo forecast a further increase to 1.41 million MT in MY2018/19.
And since domestic meal production is unable to meet the protein demand of domestic livestock in
Japan, additional supplies of protein are imported. One source of protein that is growing in Japan is
DDGS.
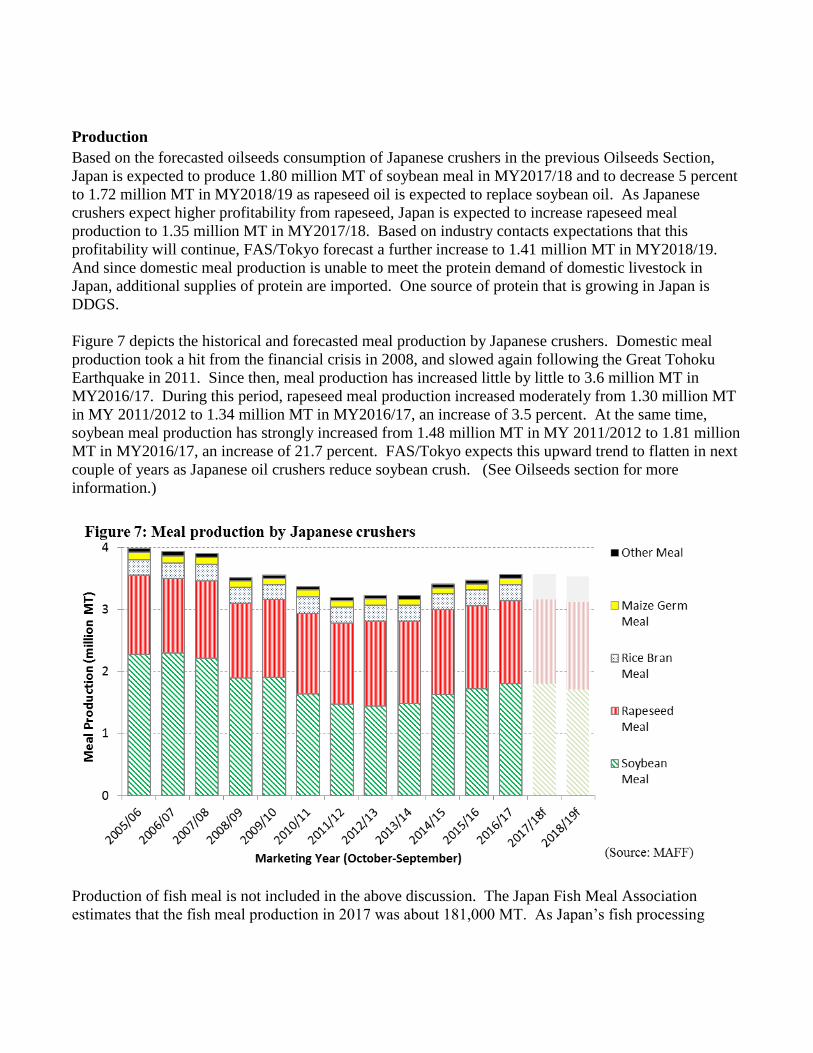
Figure 7 depicts the historical and forecasted meal production by Japanese crushers. Domestic meal
production took a hit from the financial crisis in 2008, and slowed again following the Great Tohoku
Earthquake in 2011. Since then, meal production has increased little by little to 3.6 million MT in
MY2016/17. During this period, rapeseed meal production increased moderately from 1.30 million MT
in MY 2011/2012 to 1.34 million MT in MY2016/17, an increase of 3.5 percent. At the same time,
soybean meal production has strongly increased from 1.48 million MT in MY 2011/2012 to 1.81 million
MT in MY2016/17, an increase of 21.7 percent. FAS/Tokyo expects this upward trend to flatten in next
couple of years as Japanese oil crushers reduce soybean crush. (See Oilseeds section for more
information.)
Production of fish meal is not included in the above discussion. The Japan Fish Meal Association
estimates that the fish meal production in 2017 was about 181,000 MT. As Japan’s fish processing
sector has been slowly shrinking, FAS/Tokyo forecasts that fish meal production will decline slowly,
from 180,000 MT in 2018 to 179,000 MT in 2019.
Meal Demand
Feed Consumption
Grain demand (see Japan 2018 Grain and Feed Annual, JA8018) and meal demand is driven by
domestic livestock and poultry production. The total protein demand is a function of the number of
domestic animals, especially pigs, broilers, and layers. As of February 2017, MAFF reported Japan’s
herd of pigs increased 0.4 percent to 9.35 million head from February 2016. The USDA forecast for
January 2018 is a 0.4 percent decline to 9.31 million head (see Japan 2018 Livestock and Products
Semi-annual, JA8010). It is assumed the long-term downward trend of swine to continue and is
expected to become 9.26 million by January 2019. As of February 2017, the number of broilers were
135 million and layers were 176 million (see Japan 2017 Poultry and Products Annual, JA7113).
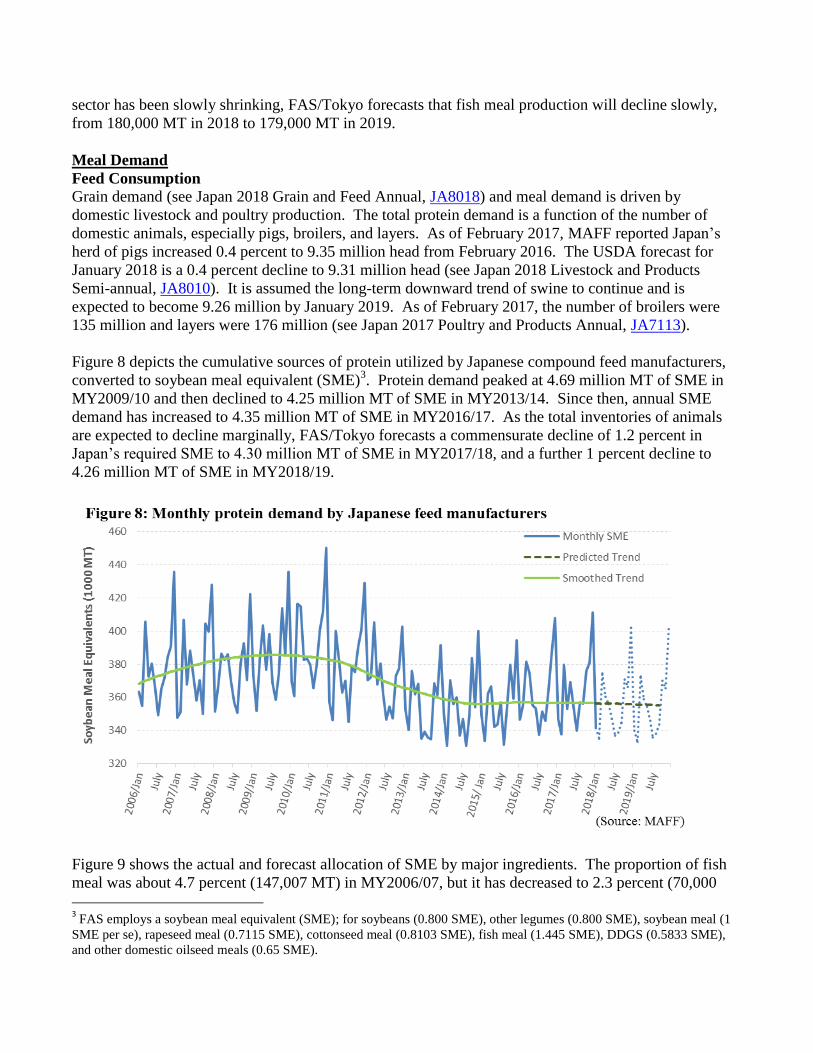
Figure 8 depicts the cumulative sources of protein utilized by Japanese compound feed manufacturers,
converted to soybean meal equivalent (SME)3. Protein demand peaked at 4.69 million MT of SME in
MY2009/10 and then declined to 4.25 million MT of SME in MY2013/14. Since then, annual SME
demand has increased to 4.35 million MT of SME in MY2016/17. As the total inventories of animals
are expected to decline marginally, FAS/Tokyo forecasts a commensurate decline of 1.2 percent in
Japan’s required SME to 4.30 million MT of SME in MY2017/18, and a further 1 percent decline to
4.26 million MT of SME in MY2018/19.
Figure 9 shows the actual and forecast allocation of SME by major ingredients. The proportion of fish
meal was about 4.7 percent (147,007 MT) in MY2006/07, but it has decreased to 2.3 percent (70,000
3 FAS employs a soybean meal equivalent (SME); for soybeans (0.800 SME), other legumes (0.800 SME), soybean meal (1
SME per se), rapeseed meal (0.7115 SME), cottonseed meal (0.8103 SME), fish meal (1.445 SME), DDGS (0.5833 SME),
and other domestic oilseed meals (0.65 SME).
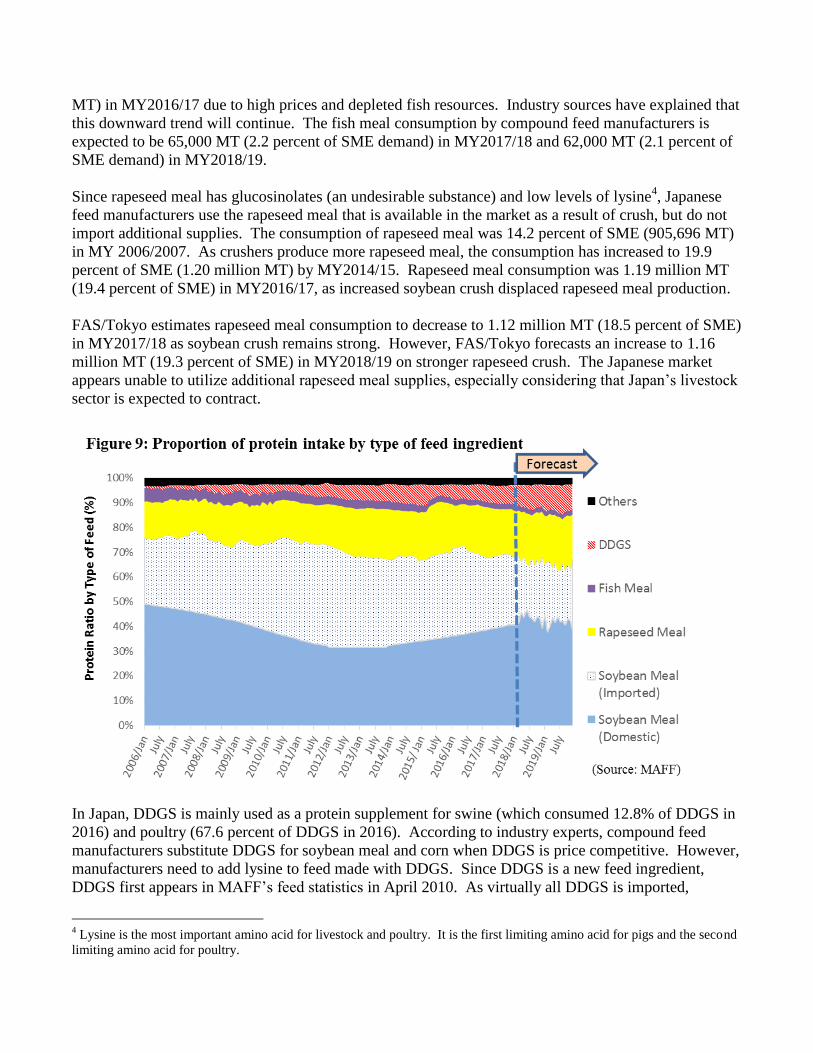
MT) in MY2016/17 due to high prices and depleted fish resources. Industry sources have explained that
this downward trend will continue. The fish meal consumption by compound feed manufacturers is
expected to be 65,000 MT (2.2 percent of SME demand) in MY2017/18 and 62,000 MT (2.1 percent of
SME demand) in MY2018/19.
Since rapeseed meal has glucosinolates (an undesirable substance) and low levels of lysine4, Japanese
feed manufacturers use the rapeseed meal that is available in the market as a result of crush, but do not
import additional supplies. The consumption of rapeseed meal was 14.2 percent of SME (905,696 MT)
in MY 2006/2007. As crushers produce more rapeseed meal, the consumption has increased to 19.9
percent of SME (1.20 million MT) by MY2014/15. Rapeseed meal consumption was 1.19 million MT
(19.4 percent of SME) in MY2016/17, as increased soybean crush displaced rapeseed meal production.
FAS/Tokyo estimates rapeseed meal consumption to decrease to 1.12 million MT (18.5 percent of SME)
in MY2017/18 as soybean crush remains strong. However, FAS/Tokyo forecasts an increase to 1.16
million MT (19.3 percent of SME) in MY2018/19 on stronger rapeseed crush. The Japanese market
appears unable to utilize additional rapeseed meal supplies, especially considering that Japan’s livestock
sector is expected to contract.
In Japan, DDGS is mainly used as a protein supplement for swine (which consumed 12.8% of DDGS in
2016) and poultry (67.6 percent of DDGS in 2016). According to industry experts, compound feed
manufacturers substitute DDGS for soybean meal and corn when DDGS is price competitive. However,
manufacturers need to add lysine to feed made with DDGS. Since DDGS is a new feed ingredient,
DDGS first appears in MAFF’s feed statistics in April 2010. As virtually all DDGS is imported,
4 Lysine is the most important amino acid for livestock and poultry. It is the first limiting amino acid for pigs and the second
limiting amino acid for poultry.
FAS/Tokyo referenced trade statistics to estimate the DDGS feed consumption before April 2010. As
shown in Figure 9, Japanese feed manufacturers have gradually increased the use of DDGS for a decade.
China, the largest importer of U.S. DDGS until 2016, suddenly imposed a 33.8 percent duty on DDGS
imports in September 2016 and Vietnam suspended imports of U.S. DDGS in December 2016. These
events contributed to lower DDGS prices, and Japan’s increase of DDGS imports. Japanese feed
manufacturers consumed a record 501,962 MT (6.7 percent of total SME) of DDGS in MY2016/17.
Assuming the current trade conditions continues, FAS/Tokyo forecasts DDGS consumption to
continuously increase by 22.4 percent to 615,000 MT (8.3 percent of total SME) in MY2017/18, and a
further 16.5 percent increase to 716,000 MT (9.8 percent of total SME) in MY2018/19.
The majority of soybean meal crushed domestically is used for feed5 and based on the soybean crush
forecasts, 39.9 percent of Japan’s protein demand was supplied by domestic soybean crush in
MY2017/18 (1.72 million MT) and 39.3 percent (1.68 million MT) in MY2018/19.
Imported soybean meal meets the remainder of Japan’s protein demand. Japanese feed manufacturers
prefer to import soybean meal in containers from nearby suppliers, historically from China, to shorten
the lead time, move smaller volumes to ports with smaller capacities, and reduce inventory. However,
as China reduced its imports of DDGS, Japanese imports of soybean meal from China has declined
sharply. Japanese feed manufacturers and trading houses have begun importing soybean meal from
other parts of the world, including the U.S., Argentina, Brazil, and Paraguay. FAS/Tokyo forecasts
Japanese compound feed manufacturers to reduce imports of soybean meal by 12 percent to 1.15 million
MT (26.9 percent of total SME) in MY2017/18. FAS/Tokyo forecasts a further 7 percent decline to 1.08
million MT (25.2 percent of total SME) in MY2018/19.
According to MAFF, Japanese compound feed manufacturers consumed a total of 2.93 million MT of
soybean meal (56 percent from domestic crush and 45 percent from imports) in MY2016/17, a decrease
of 2.9 percent from MY2015/16. The total soybean meal demand by feed manufacturers is forecast to
decrease 1.7 percent to 2.88 million MT (59.8 percent domestic crush and 40.2 percent from imports) in
MY2017/18, and to decrease a further 4.5 percent to 2.75 million MT (60.9 percent domestic crush and
39.1 percent from imports) in MY2018/19 because feed manufactures are expected to increase use of
rapeseed meal and DDGS.
The above discussion does not include feed for fish and “other animals6”. According to MAFF, fish and
other animals consumed 31,690 MT of soybean meal, 8,002 MT of rapeseed meal, and 115,744 MT of
fish meal in MY2016/17. MAFF surveys the largest aquaculture operators, resulting in an under-
reporting of fish meal consumption in the official data. The Japan Fish Meal Association estimates that
200,000 MT of fish meal was used for aquaculture. Much of Japan's farm-raised fish, such as tuna
(maguro), Japanese amberjack (hamachi), red sea bream (tai), Japanese halibut (hirame), and Japanese
pufferfish (fugu), are typical carnivorous saltwater fish and require a high protein and low sugar diet.
However, these fish usually cannot consume much soybean meal as soybean trypsin inhibitors
negatively influence growth. Given the high price of fish meal, many Japanese institutions are
researching alternative fish feed containing low levels fish meal.
5 Some portions are used for fertilizer and ingredient of food products, such as soy sauce.
6 MAFF data reflects fish and “other animals”, which includes pet food.
Food Consumption
Soybean meal7 is also used in the manufacture of food products, such as soy sauce and plant protein.
Soy sauce is made from fermented soybeans and soybean meal. Approximately 80 percent of soy sauce
manufactured in Japan is mad from soybean meal rather than from soybeans. This soybean meal is often
produced in Japan, or imported from the U.S. or India. Also, plant protein is extracted from soybean
meal for use in nutrition supplements (e.g., protein powder, baby formula) and is mixed with other
ingredients to produce snacks, bread, processed meat products, dumplings, and surimi. Since food
manufacturers prefer to use non-GE soybean meal, they either use IP soybean meal produced by
Japanese crushers8 or import non-GE soybean meals from the United States.
According to the Japan Plant Protein Food Association, the annual production volume of soybean-based
plant protein has increased from 36,616 MT in 2012 to 39,402 MT in 2017, a 7.6 percent increase over
five years. Soybean meal is also used to produce other edible products such as condiments and food
additives. FAS/Tokyo estimates that Japan used 180,000 MT of soybean meal in MY2016/17; 120,000
MT by food manufacturers and 60,000 MT by plant protein and food ingredient manufactures. As the
steady growth of plant-based protein food products, FAS/Tokyo forecasts the food use demand for
soybean meal to increase to 181,000 MT in MY2017/18 and 182,000 MT in MY2018/19.
Industrial Consumption
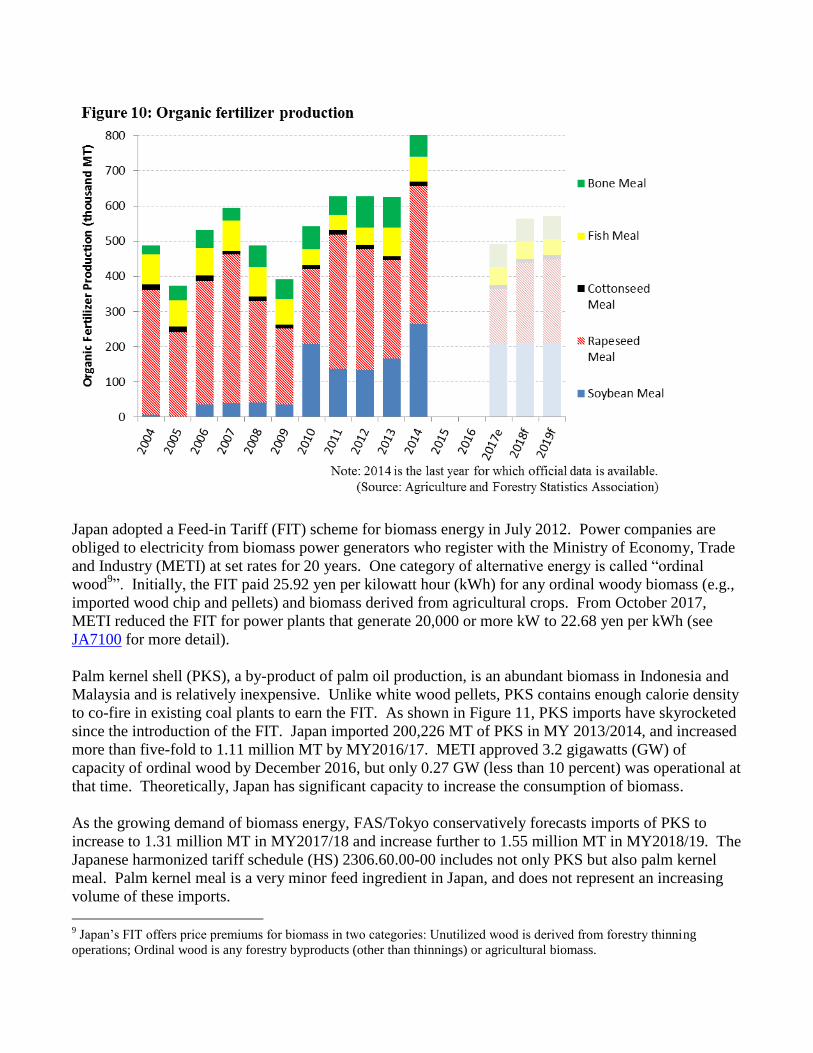
Organic fertilizer can be made from any type of meal. As shown in Figure 10, the industrial
consumption of organic fertilizer fluctuates significantly each year. The latest available data show that
organic fertilizer production in 2014 was exceptionally high; 264,848 MT of soybean meal, 392,433 MT
of rapeseed meal, 12,705 MT of cottonseed meal, and 69,226 MT of fish meal. FAS/Tokyo estimates
that 245,000 MT of soybean meal and 157,000 MT of rapeseed meal were used in the manufacture of
organic fertilizer in MY 2015/16.
The largest in put for fertilizer is rapeseed meal, and approximately 17 percent of rapeseed meal from
domestic crush is used for fertilizer. FAS/Tokyo forecasts organic fertilizer producers to consume
240,000 MT of soybean meal and 219,000 MT of rapeseed meal in MY2017/18, which is consistent
with the historical trend. Fertilizer consumption of soybeans is expected to remain flat at 240,000 MT in
MY2018/19, but increasing rapeseed crush will contribute to increased consumption of rapeseed meal,
which FAS/Tokyo forecasts to reach 238,000 MT.
7 Food manufacturers prefer to use the term “defatted processed soybeans” rather than soybean meal.
8 At this moment, the demand for non-GE soybean oil is very limited in Japan. Some crushers use non-GE soybeans in order
to produce non-GE soybean meal. Non-GE soybean oil is generally mixed with other oil.
Japan adopted a Feed-in Tariff (FIT) scheme for biomass energy in July 2012. Power companies are
obliged to electricity from biomass power generators who register with the Ministry of Economy, Trade
and Industry (METI) at set rates for 20 years. One category of alternative energy is called “ordinal
wood9”. Initially, the FIT paid 25.92 yen per kilowatt hour (kWh) for any ordinal woody biomass (e.g.,
imported wood chip and pellets) and biomass derived from agricultural crops. From October 2017,
METI reduced the FIT for power plants that generate 20,000 or more kW to 22.68 yen per kWh (see
JA7100 for more detail).
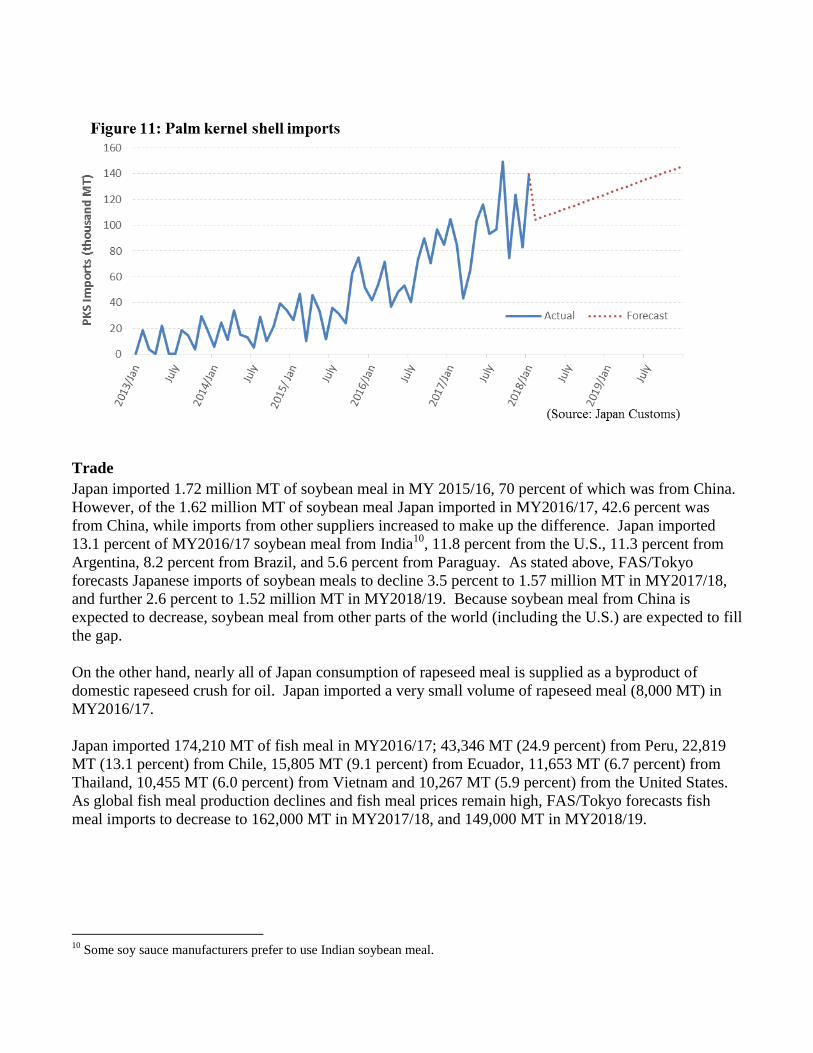
Palm kernel shell (PKS), a by-product of palm oil production, is an abundant biomass in Indonesia and
Malaysia and is relatively inexpensive. Unlike white wood pellets, PKS contains enough calorie density
to co-fire in existing coal plants to earn the FIT. As shown in Figure 11, PKS imports have skyrocketed
since the introduction of the FIT. Japan imported 200,226 MT of PKS in MY 2013/2014, and increased
more than five-fold to 1.11 million MT by MY2016/17. METI approved 3.2 gigawatts (GW) of
capacity of ordinal wood by December 2016, but only 0.27 GW (less than 10 percent) was operational at
that time. Theoretically, Japan has significant capacity to increase the consumption of biomass.
As the growing demand of biomass energy, FAS/Tokyo conservatively forecasts imports of PKS to
increase to 1.31 million MT in MY2017/18 and increase further to 1.55 million MT in MY2018/19. The
Japanese harmonized tariff schedule (HS) 2306.60.00-00 includes not only PKS but also palm kernel
meal. Palm kernel meal is a very minor feed ingredient in Japan, and does not represent an increasing
volume of these imports.
9 Japan’s FIT offers price premiums for biomass in two categories: Unutilized wood is derived from forestry thinning
operations; Ordinal wood is any forestry byproducts (other than thinnings) or agricultural biomass.
Trade
Japan imported 1.72 million MT of soybean meal in MY 2015/16, 70 percent of which was from China.
However, of the 1.62 million MT of soybean meal Japan imported in MY2016/17, 42.6 percent was
from China, while imports from other suppliers increased to make up the difference. Japan imported
13.1 percent of MY2016/17 soybean meal from India10
, 11.8 percent from the U.S., 11.3 percent from
Argentina, 8.2 percent from Brazil, and 5.6 percent from Paraguay. As stated above, FAS/Tokyo
forecasts Japanese imports of soybean meals to decline 3.5 percent to 1.57 million MT in MY2017/18,
and further 2.6 percent to 1.52 million MT in MY2018/19. Because soybean meal from China is
expected to decrease, soybean meal from other parts of the world (including the U.S.) are expected to fill
the gap.
On the other hand, nearly all of Japan consumption of rapeseed meal is supplied as a byproduct of
domestic rapeseed crush for oil. Japan imported a very small volume of rapeseed meal (8,000 MT) in
MY2016/17.
Japan imported 174,210 MT of fish meal in MY2016/17; 43,346 MT (24.9 percent) from Peru, 22,819
MT (13.1 percent) from Chile, 15,805 MT (9.1 percent) from Ecuador, 11,653 MT (6.7 percent) from
Thailand, 10,455 MT (6.0 percent) from Vietnam and 10,267 MT (5.9 percent) from the United States.
As global fish meal production declines and fish meal prices remain high, FAS/Tokyo forecasts fish
meal imports to decrease to 162,000 MT in MY2017/18, and 149,000 MT in MY2018/19.
10
Some soy sauce manufacturers prefer to use Indian soybean meal.
Stocks
MAFF reported soybean meal stocks11
of 47,279 MT held by oil crushers at the beginning of
MY2016/17 (October 1, 2016). The number increased to 50,453 MT held by oil crushers by the end of
MY2016/17 (September 30, 2017).
Rapeseed meal stocks12
held by oil crushers were 61,308 MT at the beginning of MY2016/17 (October
1, 2016). The number sharply decreased to 40,549 MT by oil crushers by the end of MY2016/17
(September 30, 2017) due to the shortage of soybean meal.
As Japanese trading houses and oil crushers plan the distribution of their supplies efficiently, meal
stocks will remain at relatively small levels. FAS/Tokyo estimates meal stocks held by oil crushers to
remain at approximately 50,000 MT for soybeans, and 50,000 MT for rapeseed meal.
Assuming biomass power generators store several weeks of consumption as inventory, stocks of PKS
are expected to grow as Japan increases PKS imports. However, it is estimated that the stocks of palm
kernel meal are zero since palm kernel meal is minor feed ingredient in Japan.
11
Feed manufacturers held addition soybean meal stocks of 18,791 MT at the beginning of MY2016/17 for a combined total
of 96,786 MT. Feed manufacturer stocks increased to 52,760 MT by the end of MY2016/17 for a combined total of 103,213
MT. The soybean meal production, supply and distribution table (Table 3) reflects only the soybean meal stocks of oil
crushers. 12
Feed manufacturers held addition rapeseed meal stocks of 49,507 MT by at the beginning of MY2016/17 for a combined
total of 80,099 MT. Feed manufacturer stocks decreased to 18,405 MT by the end of MY2016/17 for a combined total of
58,954 MT. The rapeseed meal production, supply and distribution table (Table 4) reflects only rapeseed meal stocks of oil
crushers.

Oils Section
Commodities:
Table 7: Production, supply and distribution of soybean oil
Oil, Soybean 2016/2017 2017/2018 2018/2019 Market Begin Year Oct 2016 Oct 2017 Oct 2018
Japan USDA Official New Post USDA Official New Post USDA Official New Post
Crush 2392 2392 2350 2392 0 2269
Extr. Rate, 999.9999 0.1948 0.1952 0.1936 0.1936 0 0.1948
Beginning Stocks 15 15 26 16 0 16
Production 466 467 455 463 0 442
MY Imports 5 5 5 6 0 8
Total Supply 486 487 486 485 0 466
MY Exports 0 0 0 0 0 0
Industrial Dom. Cons. 40 30 40 30 0 30
Food Use Dom. Cons. 420 441 423 439 0 420
Feed Waste Dom. Cons. 0 0 0 0 0 0
Total Dom. Cons. 460 471 463 469 0 450
Ending Stocks 26 16 23 16 0 16
Total Distribution 486 487 486 485 0 466
(1000 MT) ,(PERCENT)
Table 8: Production, supply and distribution of rapeseed oil
Oil, Rapeseed 2016/2017 2017/2018 2018/2019 Market Begin Year Oct 2016 Oct 2017 Oct 2018
Japan USDA Official New Post USDA Official New Post USDA Official New Post
Crush 2437 2437 2450 2436 0 2542
Extr. Rate, 999.9999 0.4354 0.4354 0.4388 0.4388 0 0.4371
Beginning Stocks 31 31 27 27 0 30
Production 1061 1061 1075 1069 0 1111
MY Imports 15 15 18 18 0 25
Total Supply 1107 1107 1120 1114 0 1166
MY Exports 1 1 1 1 0 1
Industrial Dom. Cons. 60 60 60 60 0 60
Food Use Dom. Cons. 1019 1019 1021 1023 0 1075
Feed Waste Dom. Cons. 0 0 0 0 0 0
Total Dom. Cons. 1079 1079 1081 1083 0 1135
Ending Stocks 27 27 38 30 0 30
Total Distribution 1107 1107 1120 1114 0 1166
(1000 MT) ,(PERCENT)
Oil, Sunflowerseed
Oil, Palm
Oil, Rapeseed
Oil, Soybean

Table 9: Production, supply and distribution of palm oil
Oil, Palm 2016/2017 2017/2018 2018/2019 Market Begin Year Oct 2016 Oct 2017 Oct 2018
Japan USDA Official New Post USDA Official New Post USDA Official New Post
Area Planted 0 0 0 0 0 0
Area Harvested 0 0 0 0 0 0
Trees 0 0 0 0 0 0
Beginning Stocks 22 22 62 21 0 25
Production 0 0 0 0 0 0
MY Imports 700 700 720 767 0 846
Total Supply 722 722 782 788 0 871
MY Exports 0 0 0 0 0 0
Industrial Dom. Cons. 40 137 60 197 0 275
Food Use Dom. Cons. 620 564 650 566 0 568
Feed Waste Dom. Cons. 0 0 0 0 0 0
Total Dom. Cons. 660 701 710 763 0 843
Ending Stocks 62 21 72 25 0 28
Total Distribution 722 722 782 788 0 871
Yield 0 0 0 0 0 0
(1000 HA) ,(1000 TREES) ,(1000 MT) ,(MT/HA)
Table 10: Production, supply and distribution of sunflowerseed oil (excluding safflower oil)
Oil, Sunflowerseed 2016/2017 2017/2018 2018/2019 Market Begin Year Oct 2016 Oct 2017 Oct 2018
Japan USDA Official New Post USDA Official New Post USDA Official New Post
Crush 0 0 0 0 0 0
Extr. Rate, 999.9999 0 0 0 0 0 0
Beginning Stocks 5 5 5 3 0 2
Production 0 0 0 0 0 0
MY Imports 30 24 35 25 0 26
Total Supply 35 29 40 28 0 28
MY Exports 0 0 0 0 0 0
Industrial Dom. Cons. 0 2 0 2 0 2
Food Use Dom. Cons. 30 24 35 24 0 24
Feed Waste Dom. Cons. 0 0 0 0 0 0
Total Dom. Cons. 30 26 35 26 0 26
Ending Stocks 5 3 5 2 0 2
Total Distribution 35 29 40 28 0 28
(1000 MT) ,(PERCENT)

Production
See the Oilseed section Consumption discussion for an explanation of vegetable oil production in Japan.
Due to steady economic growth and a weaker Japanese yen, FAS/Tokyo forecasts Japan’s edible oil
production to increase 0.5 percent to 1.74 million MT in MY2017/18. Production in MY2018/19 is
expected to increase to 1.76 million MT in MY2018/19.
As discussed already, Japan’s soybean oil production is expected to be 463,000 MT in MY2017/18 (26.7
percent of edible vegetable oil production) and 442,000 MT in MY2018/19 (25.1 percent of edible
vegetable oil production).
Due to higher profitability, Japan’s rapeseed oil production is expected to be 1.07 million MT in
MY2017/18 (61.5 percent of edible vegetable oil production) and 1.11 million MT in MY2018/19 (63.0
percent of edible vegetable oil production).
The remaining 205,000 MT in MY2017/18 and 210,000 MT in MY2018/19 represent other edible
vegetable oil, such as rice bran oil, corn oil, sesame oil and cottonseed oil. Japan also produces flaxseed
oil; however, MAFF categorizes it as non-edible vegetable oil and thus it is not included in this
discussion. Some flaxseed oil bottles are sold at retail stores as nutritious edible oil and as a source of
an omega-3 fatty acid.
Consumption
Total Vegetable Oil Consumption
Japanese consumption of vegetable oil (the sum of imported oil and crush) has risen gradually since the
global economy slowed in 2008 (see Figure 12). Vegetable oil consumption includes cooking oil,
processed oil products (e.g., margarine, shortening, non-dairy creamers, trans-fat substitute), and non-
food products (e.g., soap, paint, bioenergy). MY2016/17 consumption was 2.7 million MT and
represents an increase from 2.4 million MT in M 2008/09. Rapeseed oil led Japanese oil consumption in
MY2016/17 with 1.08 million MT, followed by palm oil (700,000MT) and soybean oil (472,000 MT).
Soybean oil and rapeseed oil are highly interchangeable in blended salad oil, especially in the HRI
sector. Increasing soybean oil results in decreasing rapeseed oil, and vice versa. Soybean oil accounted
for 24.4 percent of vegetable oil in MY2005/06, but declined to 15.9 percent by MY2013/14, largely due
to the strong U.S. dollar and a poor soybean crop in the United States. Soybean oil then recovered to
17.4 percent by MY2016/17. Rapeseed oil is a substitute for soybean oil, and demand for rapeseed oil is
inverse to that of soybean oil.
Rapeseed oil accounted for 38.2 percent of vegetable oil in MY2005/06, but increased to 43.0 percent by
MY2011/12. It then dropped to 39.6 percent by MY2016/17. Soybean oil and rapeseed oil shares have
decreased in recent years due to the increased share of palm oil. The share of palm oil has increased
from 18.9 percent in MY2005/06 to 25.7 percent in MY2016/17.

Food Use vs Industrial Use
Figure 13 shows the MAFF-estimated break-down of consumption for each vegetable oil in 2015. It is
important to note that vegetable oils are used very differently as market conditions, technological
advancements, and policies change. Japan imports the great majority of olive oil from Southern Europe,
85 percent of which was used as cooking oil and 13 percent was for non-food use. Safflower (i.e.,
benibana) oil is largely used as luxury cooking oil (66 percent) with the remainder (26 percent) being
used for processed food products. Sunflower oil is mainly used for processed food, and only 11 percent
is used for cooking oil.
About 60 percent of rapeseed oil and 47 percent of soybean oil are used as cooking oil. However, 35
percent of rapeseed oil and 45 percent of soybean oil are used for food-processing, such as margarine
and shortening. Non-food uses of soybean and canola oil accounts for approximately 6 percent of their
consumption.
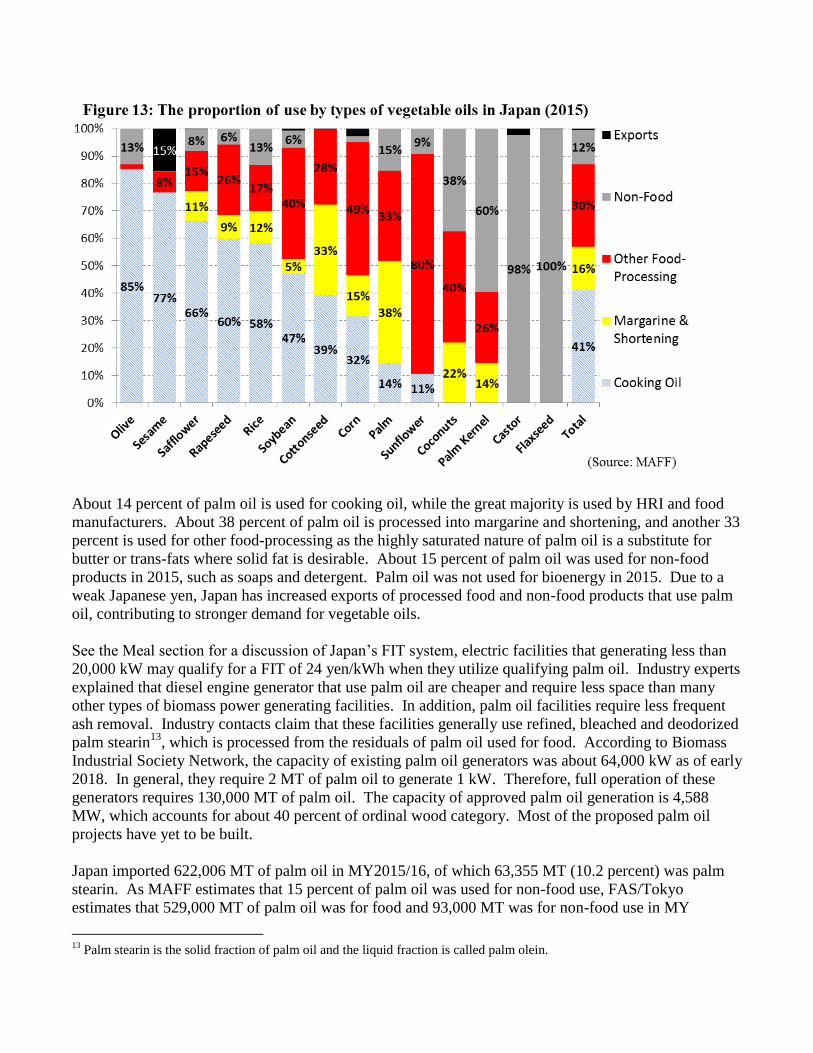
About 14 percent of palm oil is used for cooking oil, while the great majority is used by HRI and food
manufacturers. About 38 percent of palm oil is processed into margarine and shortening, and another 33
percent is used for other food-processing as the highly saturated nature of palm oil is a substitute for
butter or trans-fats where solid fat is desirable. About 15 percent of palm oil was used for non-food
products in 2015, such as soaps and detergent. Palm oil was not used for bioenergy in 2015. Due to a
weak Japanese yen, Japan has increased exports of processed food and non-food products that use palm
oil, contributing to stronger demand for vegetable oils.
See the Meal section for a discussion of Japan’s FIT system, electric facilities that generating less than
20,000 kW may qualify for a FIT of 24 yen/kWh when they utilize qualifying palm oil. Industry experts
explained that diesel engine generator that use palm oil are cheaper and require less space than many
other types of biomass power generating facilities. In addition, palm oil facilities require less frequent
ash removal. Industry contacts claim that these facilities generally use refined, bleached and deodorized
palm stearin13
, which is processed from the residuals of palm oil used for food. According to Biomass
Industrial Society Network, the capacity of existing palm oil generators was about 64,000 kW as of early
2018. In general, they require 2 MT of palm oil to generate 1 kW. Therefore, full operation of these
generators requires 130,000 MT of palm oil. The capacity of approved palm oil generation is 4,588
MW, which accounts for about 40 percent of ordinal wood category. Most of the proposed palm oil
projects have yet to be built.
Japan imported 622,006 MT of palm oil in MY2015/16, of which 63,355 MT (10.2 percent) was palm
stearin. As MAFF estimates that 15 percent of palm oil was used for non-food use, FAS/Tokyo
estimates that 529,000 MT of palm oil was for food and 93,000 MT was for non-food use in MY
13
Palm stearin is the solid fraction of palm oil and the liquid fraction is called palm olein.
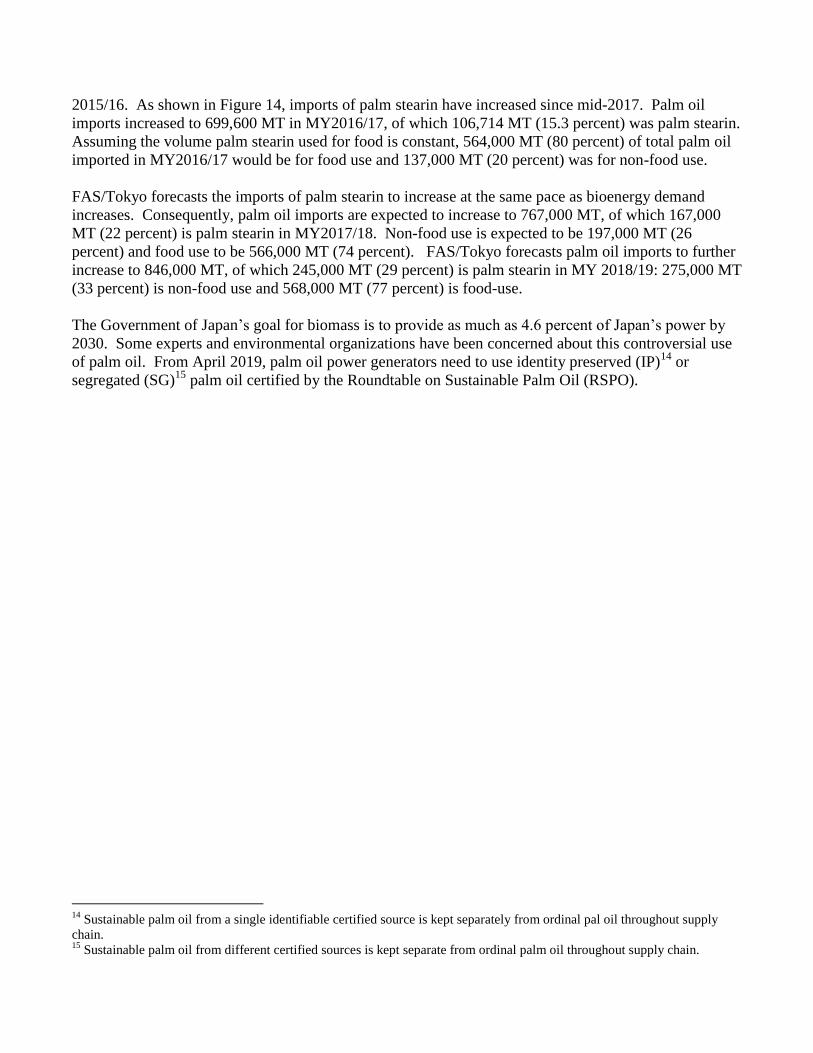
2015/16. As shown in Figure 14, imports of palm stearin have increased since mid-2017. Palm oil
imports increased to 699,600 MT in MY2016/17, of which 106,714 MT (15.3 percent) was palm stearin.
Assuming the volume palm stearin used for food is constant, 564,000 MT (80 percent) of total palm oil
imported in MY2016/17 would be for food use and 137,000 MT (20 percent) was for non-food use.
FAS/Tokyo forecasts the imports of palm stearin to increase at the same pace as bioenergy demand
increases. Consequently, palm oil imports are expected to increase to 767,000 MT, of which 167,000
MT (22 percent) is palm stearin in MY2017/18. Non-food use is expected to be 197,000 MT (26
percent) and food use to be 566,000 MT (74 percent). FAS/Tokyo forecasts palm oil imports to further
increase to 846,000 MT, of which 245,000 MT (29 percent) is palm stearin in MY 2018/19: 275,000 MT
(33 percent) is non-food use and 568,000 MT (77 percent) is food-use.
The Government of Japan’s goal for biomass is to provide as much as 4.6 percent of Japan’s power by
2030. Some experts and environmental organizations have been concerned about this controversial use
of palm oil. From April 2019, palm oil power generators need to use identity preserved (IP)14
or
segregated (SG)15
palm oil certified by the Roundtable on Sustainable Palm Oil (RSPO).
14
Sustainable palm oil from a single identifiable certified source is kept separately from ordinal pal oil throughout supply
chain. 15
Sustainable palm oil from different certified sources is kept separate from ordinal palm oil throughout supply chain.
Oil Consumption Summary
FAS/Tokyo forecasts Japan soybean oil consumption at 447,000 MT (417,000 MT for food use) in
MY2017/18, and 426,000 MT (396,000 MT for food use) in MY2018/19.
Japan is also expected to consume 1.08 MMT (1.02 MMT for food use) in MY2017/18, and 1.14 MMT
(1.08 MMT for food use) of rapeseed oil in MY2018/19.
Japan is expected to consume 763,000 MT of palm oil in MY2017/18, 566,000MT as food (such as
cooking oil, margarine, cocoa substitute, etc.) and 197,000 MT for industrial use (such as soap, biomass
generation, etc.), and 843,000MT in MY2018/19, 568,000MT of which to be used food and 275,000 MT
for industrial use.
Trade
Since Japan imposes import duties on soybean oil and rapeseed oil, domestic crushing supplies domestic
demand. Japan imported 5,000 MT of soybean oil and 15,000 MT of rapeseed oil in MY2016/17.
However, Japan has committed to gradually eliminate oil import duties for trade partners that are part of
the Japan-EU EPA and the CPTPP that is expected to encourage the import of soybean and canola oil.
Japan did not crush sunflower seed in MY2016/17and imported 24,000 MT, the large majority of which
(about 80 percent) was used for food processing such as cocoa butter substitute, mayonnaise, and
dressing. Considering the decline of global sunflower seed oil prices, FAS/Tokyo forecasts Japan to
increase sunflower seed imports marginally to 25,000 MT in MY2017/18 and to 26,000 MT in
MY2018/19. Japanese traders are conscious of gradual tariff reductions on oil products under the Japan-
EU EPA that are expected to be effectuated in 2019.
The HS codes 151211 and 151219 include not only sunflower seed oil but also safflower oil. Japan
imported 9,000 MT of safflower oil in MY2016/17.
Stocks
MAFF data shows that soybean oil stocks were 14,871 MT at the beginning of MY2016/17 (October 1,
2016). The number increased to 15,785 MT by the end of MY2016/17 (September 30, 2017).
MAFF data shows that rapeseed oil stocks were 30,010 MT at the beginning of MY2016/17 (October 1,
2016). The number dropped to 26,558 MT by the end of MY2016/17 (September 30, 2017).
Japanese soybean oil stocks are expected to remain at approximately 16,000 MT, and rapeseed oil stocks
at 30,000 MT. Stocks of palm oil are expected to proportionally grow as Japan increases palm oil
imports.