Japan Food Processing Ingredients Food Processing...Source: Shurui Shokuhin Tokei Geppo...
22
THIS REPORT CONTAINS ASSESSMENTS OF COMMODITY AND TRADE ISSUES MADE BY USDA STAFF AND NOT NECESSARILY STATEMENTS OF OFFICIAL U.S. GOVERNMENT POLICY Date: GAIN Report Number: Approved By: Prepared By: Report Highlights: The value of the Japanese food processing industry was estimated at 23 trillion Yen in 2014, an increase of 0.2% from 2013. The Japanese food processing industry continues to be viewed as a stable industry. Post: Commodities: Tokyo ATO Tommy Aoki, Senior Marketing Specialist Anne Oakley, Intern Rachel Nelson, Director Food Processing Food Processing Ingredients Japan JA5014 12/18/2015 Required Report - public distribution
Transcript of Japan Food Processing Ingredients Food Processing...Source: Shurui Shokuhin Tokei Geppo...

THIS REPORT CONTAINS ASSESSMENTS OF COMMODITY AND TRADE ISSUES MADE BY
USDA STAFF AND NOT NECESSARILY STATEMENTS OF OFFICIAL U.S. GOVERNMENT
POLICY
Date:
GAIN Report Number:
Approved By:
Prepared By:
Report Highlights:
The value of the Japanese food processing industry was estimated at 23 trillion Yen in 2014, an increase
of 0.2% from 2013. The Japanese food processing industry continues to be viewed as a stable industry.
Post:
Commodities:
Tokyo ATO
Tommy Aoki, Senior Marketing Specialist
Anne Oakley, Intern
Rachel Nelson, Director
Food Processing
Food Processing Ingredients
Japan
JA5014
12/18/2015
Required Report - public distribution

SECTION I: Market Summary
A. Overall Market Summary
The value of the Japanese food processing industry was estimated at 23 trillion Yen in 2014, an increase
of 0.2% from 2013. The Japanese food processing industry continues to be viewed as a stable industry.
Products related to health foods and home-cooking options such as frozen foods experienced the most
growth. Because of the fluctuating exchange rates in recent years, the value data in this report is
reported in Japanese Yen. The following table of average annual exchange rates is provided as a
reference (The yen continued to weaken, hitting 119.58 yen to the dollar by December 2014):
Figure 1: Average Yen by Year
Yearly average 2011 2012 2013 2014
JPY per USD 80.84 80.82 98.65 106.85
Source: http://murc-kawasesouba.jp/fx/year_average.php
Figure 2: Sales Value of the Japanese Food Processing Industry 2012-2014
Category
of Foods
2013
(Million
s of
Yen)
2014
(Million
s of
Yen)
2015
Est.(Milli
ons of
Yen)
Year to Year %
Composit
ion Ratio
(%)
Composit
ion Ratio
(%)
(2014/20
13)
(2015/20
14) 2013 2014
Soft
Drinks,
Juices,
Water
3,708,29
7
3,660,58
1
3,651,191 98.7% 99.7% 16.5% 15.9%
Alcoholic
Beverage
3,322,64
6
3,358,82
1
3,379,432 101.1% 100.6% 14.6% 14.6%
Wheat
Flower
2,351,20
0
2,370,10
0
2,354,000 100.1% 100.8% 10.3% 10.3%
Confection
ary
2,343,70
0
2,350,00
0
2,358,200 100.3% 100.3% 10.3% 10.2%
Dairy 2,181,41
5
2,152,30
0,
2,167,480 98.7% 100.7% 9.3% 9.4%
Fats &
Oils
1,917,56
0
1,927,15
8
1,938,590 100.5% 100.6% 8.4% 8.4%
Processed
Farm
Products
1,640,43
0
1,645,92
0
1,651,440 100.3% 100.3% 7.2% 7.2%
Health
Foods
1,000,00
0
1,070,00
0
1,140,000 107.0% 106.5% 4.3% 4.7%
Tea,
Coffee, &
Cocoa
938,070
950,600 946,050 101.3% 99.5% 4.2% 4.1%
Processed
Meats 726,500
739,000 739,000 101.7% 99.5% 3.2% 3.2%

Other
Marine
Products
697,935
688,300 677,004 98.6% 98.4% 3.0% 3.0%
Frozen
Foods 677,373
703,650 710,600 103.9% 101.0% 2.9% 3.1%
Sugars 504,790 488,970 491,150 96.9% 100.4% 2.2% 2.1%
Retort 332,000 338,220 340,010 101.9% 100.5% 1.5% 1.5%
Fish Paste 300,196 303,965 301,275 101.3% 99.1% 1.3% 1.3%
Canned &
Bottled
Foods
213,923
213,440 209,549 99.8% 98.2% 1.0% 0.9%
Total 22,746,2
30
22,884,8
85
23,058,72
5
100.6% 100.8% 100% 100%
Source: Shurui Shokuhin Tokei Geppo (酒類食品統計月報1月号,January 2014 pp21, 2015 pp19)
Changes in 2014 were very minor. Soft drinks, juices, & water, canned & bottled foods, fish paste, other
marine products, and tea, coffee, & cocoa saw slight decreases. Alcoholic beverages, frozen foods, and
health foods continue to rise. Other sectors remained flat, showing the stability of the food processing
sector.
Figure 3: Japan Food Processing Industry 2014

Source: Shurui Shokuhin Tokei Geppo (酒類食品統計月報, January 2015)
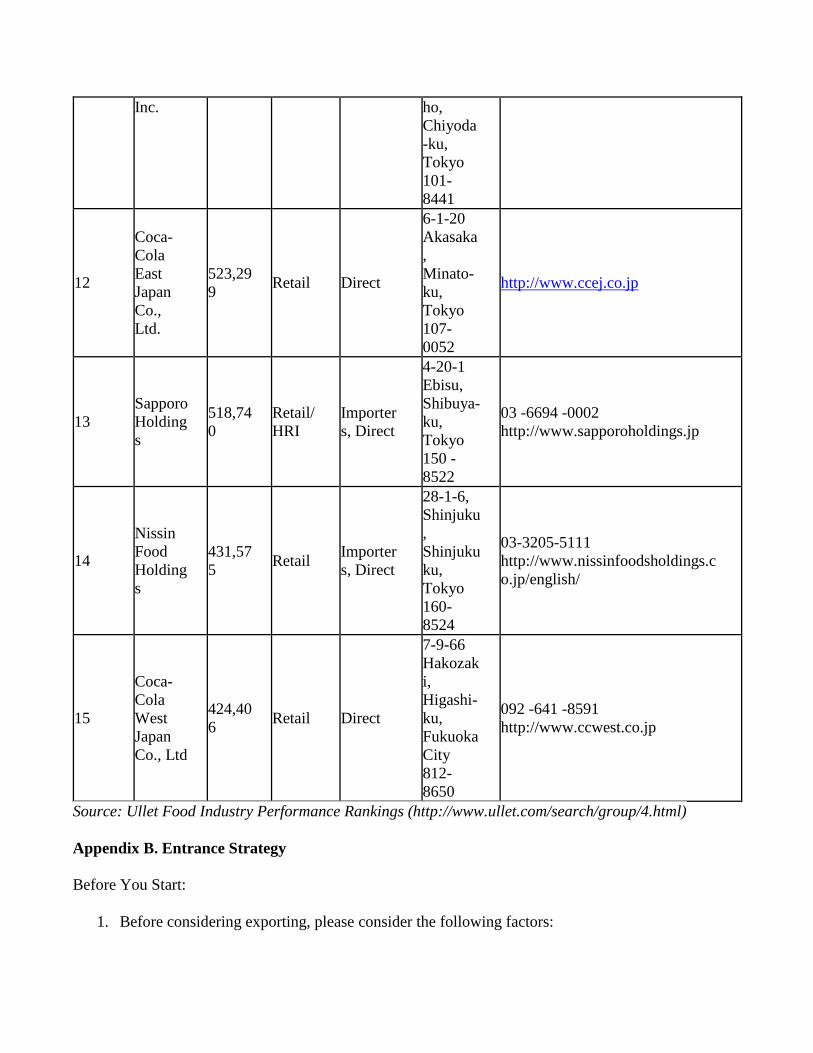
B. Domestic Companies
The Japanese food processing industry is dominated by 15 major companies that made up 59.5% of the
market sales in 2014. The largest company, is Kirin Holdings Co., Ltd. Appendix A provides a table of
the top 15 Japanese food processing companies with their net sales, end channels, production locations,
procurement channels, and contact information. This table has been included to provide a more detailed
image of the current food processing industry in Japan.
C. Key Market Drivers
Key market drivers for the food processing sector include:
A deflationary economic environment over the past decade, causing processors to seek out lower
cost food inputs and international processing options in order to remain competitive.
Increasing interest in health and functional foods with an emphasis on the growing aging
population.

Increasing emphasis on convenience, ready-to-eat, and value-priced foods.
Continued diversification of the Japanese diet.
Personalization and individualization of food and food marketing.
Larger focus on the demographic of twenty- to thirty- year olds.
Heightened consumer and retailer food safety concerns.
D. U.S. Involvement in the Industry The United States is by far the largest exporter and supplier of agricultural products to the Japanese
market, representing 26.31% of all imports by value in 2014. This is an increase from the 23.7% figure
in 2013, and the gross value increased from $13.7 billion to $14.6 billion. The U.S. remains the
dominant exporter for agricultural products both in terms of market share and value. This is more than
double the sales from the second leading competitor, China. Other countries remained relatively stable
in 2014 or saw small declines in exports to Japan while the United States experienced a market share
increase of over 6%.
Figure 5: Major Food Exporters to Japan
Rank Partner Country USD (millions) % Share % Change
2012 2013 2014 2012 2013 2014 2013/2014
World 61,569 57,779 55,570 100.00 100.00 100.00 -3.82
1 United States 15,756 13,740 14,618 25.59 23.78 26.31 6.39
2 China 7,919 7,286 7,194 12.86 12.61 12.95 -1.28
3 Australia 4,771 4,340 3,946 7.75 7.51 7.10 -9.10
4 Canada 4,653 4,223 3,782 7.56 7.31 6.81 -10.44
5 Thailand 4,401 4,009 3,777 7.15 6.94 6.80 -5.81
6 Brazil 3,428 3,993 2,761 5.57 6.91 4.97 -30.86
7 France 1,800 1,593 1,659 2.67 2.76 2.98 4.05
8 New Zealand 1,541 1,387 1,445 2.50 2.40 2.60 4.16
9 Indonesia 1,645 1,555 1,267 2.92 2.69 2.28 -18.53
10 Argentina 598 1,181 1,098 0.97 2.05 1.98 9.63
Source: Global Trade Atlas: Agricultural Total Group 2
Source: Global Trade Atlas
Figure 6: Major Exporters to Japan

Figure 7: Japan Import Statistics from United States 2014
Description United States Dollars % Change
2012 2013 2014 2013/2014
Beverages 390,185,600 384,615,631 361,244,972 -6.08
Preserved Foods 44,216,081 44,533,083 43,177,909 -3.04
Cereals 14,849,145 10,295,847 16,326,165 58.57
Misc. Grain, Seed 3,625,708 3,372,642 3,434,570 1.84
Miscellaneous Food 611,814 790,077 869,208 10.02
Meat 510,046 535,914 543,424 1.40
Edible Fruit & Nuts 382,223 326,385 269,393 -2.45
Vegetables 201,283 179,508 162,429 -9.51
Prepared/Preserved Meat 116,639 129,320 122,692 -5.13
Dairy, Eggs, Honey 71,504 67,898 87,173 28.39
Baking Related 76,943 79,470 74,749 -5.94
Sugars 56,614 60,582 67,868 12.03
Sausages & Similar Products 10,651 12,035 10,732 -10.82
Cocoa 7,625 7,540 6,542 -13.25
Spices, Coffee, Tea 3,958 4,135 3,540 -14.38
Global Trade Atlas, Japan Import Statistics, All AG Simplified.(Figures Rounded)
E. Analysis There are three key factors affecting food exports to Japan:

1. Imported food products are often less expensive than their domestic counterparts.
2. Japanese consumers show great acceptance of imported food.
3. The yen exchange rate impacts the price of imports to Japan.
For example, in 2014, U.S. cereal product exported to Japan increased in volume by 58.57% from the
previous year. Japanese consumers and importers continue to demonstrate a preference for U.S. goods.
F. Key Advantages & Challenges for U.S. Food Products
In addition to the U.S. being the largest food exporter to Japan, Japanese consumers are familiar with
ingredients from the U.S. such as meats, dried fruits, nuts, etc. Products from the U.S. are also
recognized for their high quality, cultural influence, and health conscious aspects. Some of the key
advantages and challenges for U.S. food products are:
Advantages Challenges
The U.S. has a reputation as a reliable supplier of
food inputs in terms of availability and delivery.
Consumers perceive Japanese food production
as safer than overseas production, including
the U.S.
Manufacturers in the United States produce many
specialty food products that are attractive to
Japanese consumers.
Getting detailed information to the most
appropriate purchaser in some companies can
be difficult in Japan.
Many Japanese consumers love American culture
and cuisine.
Getting you product information to the
consumer is a challenge.
G. Industry Developments With a stable market and only a few sectors showing a significant increase or decrease, there is a desire
in the Japanese food processing industry to find some way to prompt strong growth. In an attempt to
reduce costs, facilitate international partnerships, and increase revenue, Japanese food processors have
been looking into off-shore acquisitions to source processed food items.
There were a few notable acquisitions and mergers in 2014. One notable one worth mentioning is the
Suntory Holdings Ltd. acquisition of Beam Inc. on April 30, 2014. After being renamed Beam Suntory
Inc. as a result of the transaction, the company is number 3 in the Global Premium Alcohol Market.
Beam Suntory Inc. will continue to operate in Deerfield, Illinois under its current CEO, despite Suntory
Holdings Ltd. headquarters being located in Osaka, Japan.
Another international merger occurred when the Mizkan Group entered an agreement with Conopco
Inc., a subsidiary of Unilever, on May 22, 2014 in order to acquire Ragu and Bertolli pasta sauce
brands. While both production facilities will be located in the U.S., Mizkan hopes to continue the
expansion of the product locally as well as globally.
The year 2014 saw an increase in health-related food products, snacks, and home replacement meal

options. Seasonal flavors continued to be popular. Here are a few products and their descriptions.
In July 2014, after a nine-year wait, Coca-Cola reintroduced the two limited
edition flavors “orange” and “lemon” to the Seven & I Holdings store 7/11 for a
period of three months, according to Nikkei Asian Review. With healthy foods
trending in 2014, the fruity Coca-Cola flavors stood out in the soft drink
category. The product was met with a favorable response from consumers who
appreciated the zesty twist on the traditional cola flavor.
In April 2014, Otsuka Pharmaceutical launched the French
product “Milical” – a line of healthy diet food products
including shakes, soups, and bars. The Japanese market debut
included eight different choices of products and is meant to
supplement less healthy snack-food. Its purpose is to make it
easier for a person to stick to a diet plan while still being allowed a delicious treat.
In August 2014, House Foods introduced a new type of stew mix
“Rich and Creamy” to their existing line of sweet corn, beef, and
cream stew mixes. House Foods stated that it had increased the
amount of milk and cheese in the product for a thicker, creamier
stew. Designed to be easy to melt in the microwave, it is a great
choice for a quick and easy meal. It is ideal for single households
who don’t spend a lot of time in the kitchen.
In July 2014 Lotte, a popular snack creator, released a limited edition soda float
ice cream flavor to their Shari~tsu line just in time for summer. It is best
described as a perfect combination between refreshing soda and vanilla ice
cream. Another planned flavor, Fuji Apples, was announced in October 2014.
Ice cream continues to be a popular sweet treat targeting all demographics.
Also on the list is of new products is Marumiya’s March 2014 introduction of the Chicken
Flavor and the Scallop & Japanese Pepper flavors to their Soft Sprinkle line. This product
is meant to be served over rice. This line,praised in consumer reviews as being healthy,
currently spans nearly 20 products for a wide variety of consumers.
Myojo Chuka Zanmai’s Chinese-style ramen line in April 2014. launched a
brand renewal in April 2014, with the aim of supplying non-fried noodles and a
richer flavor of soup. They offered a new manufacturing method and new
packaging to show off the relaunch of the long-standing product, and Japanese
consumers are responding positively to the healthy change to this popular at-
home dining option.
In September 2014, Suntory added PREMIUM BOSS to its Boss coffee line. Highly
anticipated since its announcement in June, PREMIUM BOSS was very popular among
Japanese consumers. Reviewed as having the richest, strongest flavor of canned coffee thus

far, Suntory revealed that it achieved the flavor by adding more espresso to the product, which is then
blended with finely ground coffee beans. The Suntory Boss coffee line remains an extremely popular
product line in Japan.
SECTION II: Market Structure & Entry
A. Market Structure
The Japanese market structure and distribution system is different from the U.S.. The following
illustration is a basic flowchart showing how imported products would enter and move through the
traditional Japanese distribution system:
Figure 7: Food Ingredient Distribution Flow Chart
Your product will most likely be handled by a:
1. General trading company
2. First-line wholesaler
3. Second-line wholesaler
4. Retailer, HRI or food processor
Trading companies play the following roles:
1. Legal importer
2. Financier
3. Customs clearance handler
4. Warehousing
5. Preparer of order and shipping documentation
In the past, trading companies would normally sell to first-line wholesalers, who would then sell product
Exporter
Retailers & HRI
Japanese Importer
- Large trading company
- Specialty importer
Large Food
Processors
Primary
Wholesaler
Secondary
Distributor
Small Food
Processor

to secondary distributors. This pattern has changed in the past decade as companies seek to reduce
logistical costs. Large food processors and retailers are now purchasing sizeable quantities of product
directly from trading companies.
In some cases, the HRI and retail sectors are choosing to directly import items themselves if the size of
the transaction makes it cost effective, as displayed in the graph above by the dotted line from exporters
to retailers and HRI.
These HRI importers are often large family chain restaurants, kaiten (conveyer belt) sushi restaurants,
and regional restaurants. Often times, the importer or trading company needs to also add value through
special processing, designing, or packaging. These transactions circumvent the usual second-line
wholesalers and distributors, but in these tough economic times wholesalers and trading companies
realize traditions need to be circumvented.
B. Market Entry The Japanese market can be a complicated market in which to enter. There are many factors to consider
before entering this market, specifically the strict regulations on specific ingredients and additives.
Despite this, the Japanese market is still one of enormous potential. With the changing population,
demand is shifting and new opportunities are constantly presenting themselves. These trends are
discussed in the later sections of the report.
Strategies for entering the Japanese market will vary depending on product characteristics, competition,
and the market environment. Tools such as The Market Assessment Checklist are an effective way to
begin the process of evaluating your product’s potential in the Japanese market.
The Market Assessment Checklist can be found at:
http://www.fas.usda.gov/agx/market_research/Market_Assessment_Checklist.pdf
For further guidance and a more detailed outline of the variety of resources available to U.S. exporters
please refer to Appendix B.
SECTION III: Sector Trends and Products with Good Sales Potential
A. Consumer Trends At the consumer level, the following trends are driving the way food processors are marketing their
products.
1. Food Safety
Japanese consumers have always been sensitive to food safety issues and the earthquake, tsunami and
nuclear disaster of March 11, 2011 further drove home that sensitivity. Japanese are responsive to two
concepts Anzen (safety), and Anshin (peace of mind). It is not enough for consumers to know that a
product is safe; they demand that foods promote a peace of mind and lack of worry. Merchants and
retailers can always promote safety, but only time and reputation can bring about that feeling of peace of
mind.
2. Health & Functional Foods

Healthy and functional foods are very popular. The official definition of functional foods (FOSHU) and
drinks in Japan is "foods which are expected to have a specified effect on health due to the relevant
constituents or foods from which allergens have been removed." Functional ingredients such as dietary
fiber, oligosaccharides, non-calorie sweeteners, calcium, iron, mineral absorption promoters, beta-
carotene, chitosan, specified soy protein, collagen, polyphenols, lactic acid bacteria cultures, soy iso-
flavones and germinated brown rice (GABA) have been included in functional foods marketed in Japan.
Examples of functional foods include yogurt with lactic bacteria to help digestion and candies with
collagen to target skin health. Bread with added wheat germ is another example of functional food that
can be found in the market.
In addition to these specialty functional foods, traditional health foods such as soy milk, have become
popular due to perceived health benefits. Diet conscious consumers have been switching from sugar,
soft drinks, cakes and ice creams to low calorie teas, mineral water, as well as fruit and vegetable juices.
Tree nuts, especially almonds and walnuts, are also becoming popular.
Snack foods are an area that is truly evolving . There are limited snack bar and on-the-go snack options
in Japan that specifically target health. While products like Soy Joy have begun to pioneer the path,
there are still opportunities to introduce health-based snack products such as low-calorie nutritional
bars, energy bars, and processed fruits and vegetables snacks. Many of the health bars and snack options
on the market are targeted towards men or athletes and the few low-calorie options that do exist for
women are very expensive.
The major distribution line for these snack products is through super markets and convenience stores,
where sales are split between Otsuka Pharmaceuticals, the makers of Soy Joy and CalorieMate, and
Asahi, which produces a cereal bar. Affordable health snacks and nutritional bars, both low-calorie and
otherwise, have significant potential in this market. In an effort to avoid the high volume, competitive
market of convenience stores sales, another recommended entry point is through high-end coffee shops.
These types of products might need to be tailored for the Japanese market though, in terms of flavor,
ingredients and size.
3. The Aging Population
Japan is in the midst of a major demographic change. Much like the trend that will also hit the United
States in the next couple of decades, the percentage of young people has been shrinking since the
1980’s, and the aging population has been growing. By the end of this decade, there will be three
pensioners for every child under 15 in Japan. This significant change is creating a substantial new
market with new demands. Many domestic firms in Japan have begun the process of creating product
lines that cater to the physical and dietary needs of this aging population. These companies claim that
products in the market need improvement in the areas of taste, texture, and price.
Raising the quality and lowering the price of these products is the current goal of manufacturers and
thus many are demanding new purees, specifically meat, fish, vegetable, and fruit, to add as a base for
their soft foods. In the past few years on average, Japanese aged 60+ accounted for 44%, or $1.18trillion
(¥145trillion) of the consumer spending in Japan, and this trend is only increasing. Further exemplifying
the power of this segment, 70% of the $1.18trillion was in the 65+ age bracket. Researchers expect

spending by seniors worldwide to double to $15 trillion (the size of the U.S. GDP in 2011) and see
Japan’s rich aging consumers as a dynamic market.
4. Growth of Convenience Foods
The fast-paced Japanese lifestyle has led to the growth of processed foods as a replacement for meals
made from scratch at home. The best example is the rapid expansion of convenience (konbini) store
chains over the past decades, which specialize in a large variety of prepared meals. Examples of
prepared meals are traditional bento lunch boxes, onigiri (rice balls), pasta dishes, sandwiches, salads,
baked goods, and desserts. Ingredients such as low-cost processed vegetables for bento lunches or
ingredients in very popular snack foods such as korokke, a breaded and fried potato or meat patty, are in
high demand. Additionally items such as lunch meats and fruit or nut ingredients for confectionery use
are also in demand. With over 48,000 convenience stores in Japan, these prepared food options are
major competitors for fast-food chains. Major fast food companies describe these konbini as
competition because they are located in high traffic areas and thus are easy to access on lunch breaks
and on the way home for dinner. They are open 24 hours and the meals are inexpensive and very high
quality.
In addition to these pre-made meals available at convenience stores, processed and packaged
convenience food is also becoming very popular. Over the last 7 years, there has been a decline in
restaurant dining as many Japanese are looking for less expensive options in the form of Ready-to eat,
Home Meal Replacement (HMR) type products (obento lunch boxes at the office are one example). It is
estimated that 22% of all meals in Japan are HMR. There are many new kinds of frozen home meal
replacement options available now with prepared foods composing 56.8% of the frozen food market.
Some examples of these foods include cooked rice dishes, Asian and Western noodles, breads, and fish.
These dishes have a long shelf life and are easy to prepare.
Another factor contributing to the demand for ready to go meals is that young Japanese are marrying
later, and so tend to want easy-to-prepare single portion meals. Packaged sauces, meals in-a-box, instant
meals, and other convenient options are growing in popularity and will most likely continue to grow.
5. Breakfast
Traditionally, breakfast in Japan has been eaten at home at the kitchen table. External changes to the
Japanese lifestyle have led to the growing need for on-the-go breakfast options. As more women enter
the workforce and as young Japanese begin to get married at an older age, there has been a significant
move toward eating fast, easy, and inexpensive meals. The growing trend of convenient on-the-go
breakfast products can be seen in almost every office building when the work day begins, as people now
bring their breakfast to work. Items such as hearty instant soups, breakfast bars, and granola are
stepping in as substitutes for the traditional sit down meal. While some bring these items from home,
many Japanese are picking their breakfast up as they go. The McDonald’s breakfasts, given the name
asamaku, (literally: morning McDonald’s) as well as other fast food breakfast items have become
increasingly popular. People are attracted to their convenience, price, and the variety of hearty options.
Items as muffins and morning pastries are also becoming more popular as a result of the growing
Western influence of coffee shops. However, while these sweet breakfast items are growing, more
savory and filling food items are preferred in the morning by both men and women.

6. Beauty & Anti-aging
Beauty and anti-aging products have always been popular in the Japanese market, yet have remained
mainly within the areas of cosmetics and pharmaceuticals. Along similar lines as functional foods,
beauty and anti-aging is becoming a new marketing tactic in Japan, targeting the growing senior
population. This trend is also showing up in the area of processed foods. While one approach is to
educate the public on the natural anti-aging effects of things such as juices and processed fruits and
vegetables, some companies have started to add anti-aging ingredients, such as collagen, to candies,
beverages, and snack foods. Foods with these beautifying and anti-aging ingredients are becoming very
popular among women of all ages. Although this portion of the industry continues to grow, Japanese
regulations surrounding health claims are extremely strict.
7. Diversification in the Diet
The internationalization of the Japanese diet offers U.S. exporters an opportunity to supply ingredients
to meet this changing demand. As Japanese consumers have embraced U.S. food ingredients into their
diets; nuts, fruits, vegetables, and meat products have become a standard part of Japanese dietary habits.
B. Producer Trends Food producers in Japan have certain priorities for their products and set ideas about the way to present
them to their customers. In general, the best place to see producer trends are at the large trade shows
(see Appendix: Entry Strategy: part 3). One of the largest in Japan is FOODEX , which has roughly
75,000+ unique visitors per year who come to look at both domestic and foreign vendors. The
FOODEX Japan 2015 report shows the fifteen most common overseas products exhibited and the 15

most sought after products.
Exhibited Items
Ranking Product Type # of Companies
1 Wine 252
2 Halal 178
3 Kosher 109
4 Snack Food 108
5 Dry Fruit 90
6 Olive Oil 86
7 Biscuit/Cookie 81
8 Processed Vegetable in Bottle/Can 79
9 Frozen Vegetable 77
10 Chocolate 74
11 Fresh Fruit 72
12 Frozen Fruit 70
13 Nuts 69
14 Natural Food 68
15 Fruit Juice/Vegetable Juice 67
Most Sought After Items According to Buyers
Ranking Product Type % of Companies
1 Sweets & Snacks 12.6
2 Livestock products 10.7
3 Vegetables & Fruits 10.5
4 Marine Products 8.8
5 Seasonings and Ingredients 8.0
6 Alcohol 7.4
7 Bread, Noodles, Pasta 7.3
8 Coffee & Tea 7.1
9 Grains 6.4
10 Drinks & Water 5.3
11 Milk & Egg Products 4.4
12 Health & Beauty Food 4.1
13 Other 3.5
14 Organic 2.8
15 Sugar & Spreads .8
Source: FoodEX Japan 2015 (http://www.jma.or.jp/foodex/en/pdf/pdf-2015showreport.pdf)
C. Products Not Present Due to Significant Barriers
1. Items Containing Prohibited Ingredients or Ingredients in Excess of Allowable Limits
Because of the strict Japanese regulations on food additives, some U.S. food products containing

prohibited additives or residues/additives in excess of allowable limits cannot enter Japan. It is highly
recommended that U.S. exporters check their product compliance as a first step when considering
business in Japan. Contact ATO Japan at [email protected]
For more information on food additives, please refer to JETRO’s Specifications and Standards for
Foods, Food Additives, etc. Under the Food Sanitation Act (2010)
http://www.jetro.go.jp/en/reports/regulations/pdf/foodext201112e.pdf
2. High Tariff Rate or Quota Restricted Items
A variety of dairy products such as butter, edible non-fat dry milk and whey products, cheese, yogurt,
and other dairy products are subject to TRQ/high tariffs. Likewise, sugar and rice face very high tariff
rates. It is wise to check the tariff rates as well as quota restrictions for your product classification.
Quotas still exist on some items such as dry beans. Refer to the latest Japan Customs’ tariff schedule:
http://www.customs.go.jp/english/tariff/2012_4/index.htm (April 2012). These may change after
ratification of the TPP agreement.
3. Quarantine Restricted Items
Numerous fresh produce products are prevented from entering Japan due to the Japanese plant
quarantine regulations. For example, fresh potatoes are prohibited to import except under a strict
protocol.
You can check whether or not your products are allowed by contacting the USDA Animal and Plant
Health Inspection Service office in Tokyo at (011-81-3) 3224-5111 or emailing the USDA Agricultural
Trade Office (ATO) at [email protected]
SECTION IV: Post Contact & Further Information For those with questions or seeking additional assistance, please contact the U.S. ATO in Tokyo or
Osaka at the following addresses:
ATO Tokyo
U.S. Embassy
1-10-5, Akasaka, Minato-ku, Tokyo 107-8420
Tel: 81-3-3224-5115 Fax: 81-3-3582-6429
E-mail address: [email protected]
ATO Osaka
American Consulate General
2-11-5, Nishi Tenma, Kita-ku, Osaka City, Osaka 530-8543
Tel: 81-6-6315-5904 Fax: 81-6-6315-5906
E-mail address: [email protected]
Websites: http://www.us-ato.jp, http://www.usdajapan.org, http://www.myfood.jp
Note: It is recommended that U.S. exporters verify relevant import requirements with their foreign

customers, who normally have the most updated information on local requirements, prior to exportation.
Final import approval of any product is subject to the importing country's rules and regulations as
interpreted by border officials at the time of product entry
SECTION V:
Appendix A. Company Profiles
Rank
ing
Compa
ny
(Main
Produc
ts)
Sales
(¥
Mil)
End
User Is
Procure
ment
Channel
s
Address Phone # Website
1
Kirin
Holding
s
2,195,
795
Retail/
HRI
Importer
s, Direct
4-10-2
Nakano,
Nakano-
ku,
Tokyo
164-
0001
03-5541-5321
www.kirinholdings.co.jp
2 Asahi
Group
1,785,
478
Retail/
HRI
Importer
s, Direct
1-23-1
Azumab
ashi,
Sumida-
ku,
Tokyo
130-
8602
03-5608-51112
http://www.asahibeer.com/
3 Suntory
Ltd.
1,257,
280
Retail/
HRI
Importer
s, Direct
2-1-40
Dojimah
a-ma,
Kita-ku,
Osaka
City
530-
8203
06-6346-1131 www.suntory.co.jp/
4
Nippon
Meat
Packers
Inc.
1,212,
802
Retail/
HRI
Importer
s, Direct
3-6-14
Minami-
Honmac
hi,
Chuo-
ku,
Osaka
City
541-
0054
http://www.nipponham.co.jp/en/
5 Meiji 1,161, Retail/ Importer 1-2-10 03-3273-4001

Holding
s
152 HRI s, Direct Shinsun
a, Koto-
ku,
Tokyo
136-
8908
http://www.meiji.com/english/
6
Ajinom
oto Co.,
Inc
1,006,
630
Retail/
HRI
Importer
s, Direct
1-15-1
Kyobash
i, Chuo -
ku,
Tokyo
104 -
8315
03 -5250 -8111
www.ajinomoto.co.jp
7
Yamaza
ki
Baking
Co.,
Ltd.
995,01
1
Retail/
HRI
Importer
s, Direct
3-10-1,
Iwamoto
-cho,
Chiyoda
-ku,
Tokyo
101-
8585
03-3864-3111
http://www.yamazakipan.co.jp/en
glish/index.html
8
Morina
ga Milk
Industry
Co.,
Ltd.
594,83
4
Retail/
HRI
Importer
s, Direct
5-33-1
Shiba,
Minato-
ku,
Tokyo
108 -
8384
03 -3798 -0111
http://www.morinagamilk.co.jp/en
glish/
9
Mega-
Milk
Snow
Brand
Co.,
Ltd,
549,81
6
Retail/
HRI
Importer
s, Direct
13
Honshio
-cho
Shinjuku
-ku,
Tokyo
160-
8575
03 -6887 -3690 http://www.meg -
snow.com/english/
10
Nichiei
Corpora
tion
545,26
6
Retail/
HRI
Importer
s, Direct
6-19-20
Tsukiji,
Chuo-
ku,
Tokyo
104 -
8402
03 -3248 -2101
http://www.nichirei.co.jp/english/i
nde x.html
11
Nisshin
Seifu
Group
526,14
4
Retail/
HRI
Importer
s, Direct
1-25
Kanda,
Nishikic
03 -5282 -6666
http://www.nisshin.com
Inc. ho,
Chiyoda
-ku,
Tokyo
101-
8441
12
Coca-
Cola
East
Japan
Co.,
Ltd.
523,29
9 Retail Direct
6-1-20
Akasaka
,
Minato-
ku,
Tokyo
107-
0052
http://www.ccej.co.jp
13
Sapporo
Holding
s
518,74
0
Retail/
HRI
Importer
s, Direct
4-20-1
Ebisu,
Shibuya-
ku,
Tokyo
150 -
8522
03 -6694 -0002
http://www.sapporoholdings.jp
14
Nissin
Food
Holding
s
431,57
5 Retail
Importer
s, Direct
28-1-6,
Shinjuku
,
Shinjuku
ku,
Tokyo
160-
8524
03-3205-5111
http://www.nissinfoodsholdings.c
o.jp/english/
15
Coca-
Cola
West
Japan
Co., Ltd
424,40
6 Retail Direct
7-9-66
Hakozak
i,
Higashi-
ku,
Fukuoka
City
812-
8650
092 -641 -8591
http://www.ccwest.co.jp
Source: Ullet Food Industry Performance Rankings (http://www.ullet.com/search/group/4.html)
Appendix B. Entrance Strategy
Before You Start:
1. Before considering exporting, please consider the following factors:
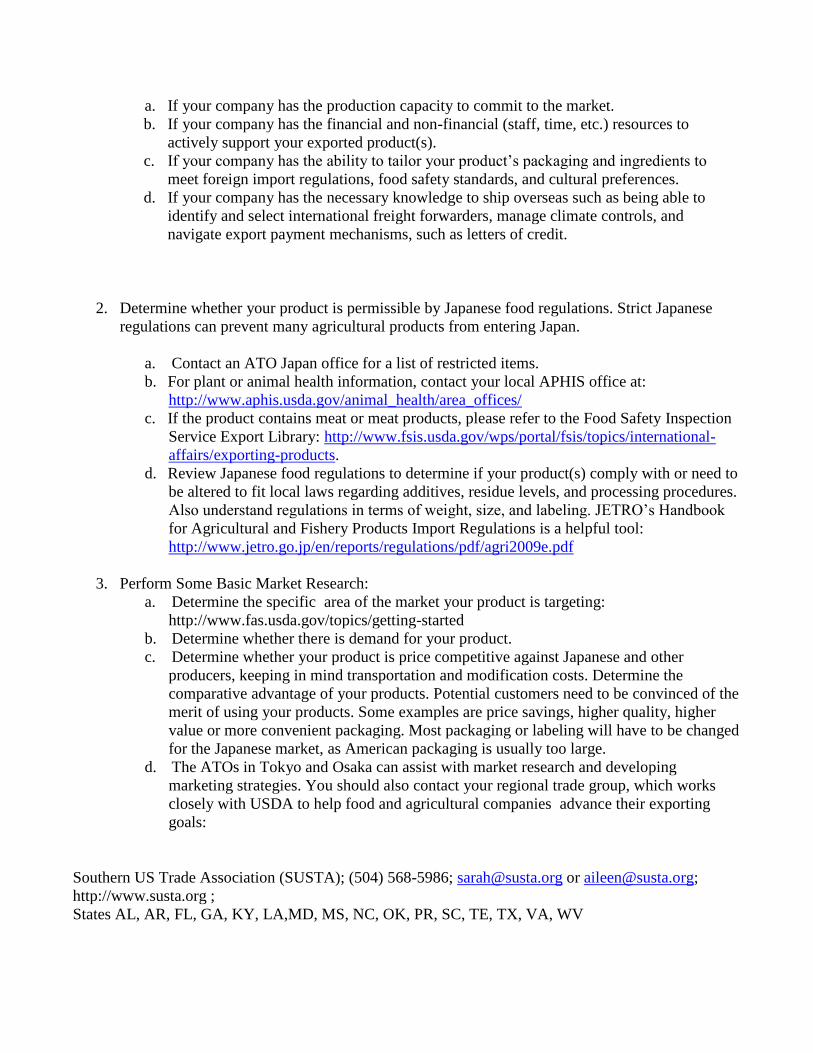
a. If your company has the production capacity to commit to the market.
b. If your company has the financial and non-financial (staff, time, etc.) resources to
actively support your exported product(s).
c. If your company has the ability to tailor your product’s packaging and ingredients to
meet foreign import regulations, food safety standards, and cultural preferences.
d. If your company has the necessary knowledge to ship overseas such as being able to
identify and select international freight forwarders, manage climate controls, and
navigate export payment mechanisms, such as letters of credit.
2. Determine whether your product is permissible by Japanese food regulations. Strict Japanese
regulations can prevent many agricultural products from entering Japan.
a. Contact an ATO Japan office for a list of restricted items.
b. For plant or animal health information, contact your local APHIS office at:
http://www.aphis.usda.gov/animal_health/area_offices/
c. If the product contains meat or meat products, please refer to the Food Safety Inspection
Service Export Library: http://www.fsis.usda.gov/wps/portal/fsis/topics/international-
affairs/exporting-products.
d. Review Japanese food regulations to determine if your product(s) comply with or need to
be altered to fit local laws regarding additives, residue levels, and processing procedures.
Also understand regulations in terms of weight, size, and labeling. JETRO’s Handbook
for Agricultural and Fishery Products Import Regulations is a helpful tool:
http://www.jetro.go.jp/en/reports/regulations/pdf/agri2009e.pdf
3. Perform Some Basic Market Research:
a. Determine the specific area of the market your product is targeting:
http://www.fas.usda.gov/topics/getting-started
b. Determine whether there is demand for your product.
c. Determine whether your product is price competitive against Japanese and other
producers, keeping in mind transportation and modification costs. Determine the
comparative advantage of your products. Potential customers need to be convinced of the
merit of using your products. Some examples are price savings, higher quality, higher
value or more convenient packaging. Most packaging or labeling will have to be changed
for the Japanese market, as American packaging is usually too large.
d. The ATOs in Tokyo and Osaka can assist with market research and developing
marketing strategies. You should also contact your regional trade group, which works
closely with USDA to help food and agricultural companies advance their exporting
goals:
Southern US Trade Association (SUSTA); (504) 568-5986; [email protected] or [email protected];
http://www.susta.org ;
States AL, AR, FL, GA, KY, LA,MD, MS, NC, OK, PR, SC, TE, TX, VA, WV

Western US Agricultural Trade Association (WUSATA); (360)693-3373 x 314; [email protected];
https://www.wusata.org/
States: AL, AZ, CA, CO, HI, ID, MT, NV, NM, OR, UT, WY
FOODEXPORT Northeast; (215) 829-9111; [email protected]; https://www.foodexport.org/
States: DE, NY, VT, CT, MA, ME, RI, NH, NJ, PA
FOODEXPORT Midwest, (312) 334-9200; [email protected]; https://www.foodexport.org
States: IL, IN, KS, MN, MO, NE, IA, MI, ND, OH, SD, WI
4. Develop an Export Action Plan:
Once you have collected the general market, products, and regulatory information, begin the
process of creating an export action plan. This will be instrumental in helping distributors and
buyers see your vision. Keep in mind that many portions of this plan will change after personal
interaction with the market or as more information is gathered.
This action plan should include:
· Objective
· Goals and benchmarks, short-term and long-term
· Product
· Market
· Product packaging and handling
· Product modifications, if applicable
· Financial resources to be committed
· Non-financial resources to be committed
· Additional financing
· Potential importers and buyers
· Schedule
· Marketing plan
· Evaluation
5. Get to Know the Market Personally:
Once you have determined that exporting your product to Japan is feasible and you have
developed a basic strategy, either visit Japan to explore opportunities first-hand or find a
representative to do so. When appointing agents, be sure your partner has a good reputation and
track record in the market.
This face-to-face interaction is very important in business because in Japan personal
relationships are very important. Additionally, keep in mind that it takes time to form these
relationships.

Understand how the Japanese distribution system works and begin the process of figuring out
where you are to enter.
Finding a Buyer:
1. Trade shows: There are a variety of trade shows, large and small, which act as the best tools for
market research as well as for finding potential distributors. A list of USDA endorsed trade
shows can be found at: http://www.fas.usda.gov/topics/trade-shows
a. The three recommended trade shows in Japan for the food processing sector are:
i. FOODEX JAPAN http://www3.jma.or.jp/foodex/en/
ii. International Food Ingredients and Additives Exhibition (IFIA) Japan :
http://www.ifiajapan.com
iii. Health Ingredients Japan http://www.hijapan.info/eng/
b. Contact one of the State Regional Groups listed in 3.d above, and ask if they have any
upcoming activities involving your target market such as trade missions or showcases.
c. Try to meet with Japanese importers who distribute the types of agricultural products that
you wish to export to learn more about.
d. Once you make contacts, visit potential customers to emphasize your interest and learn
more about them, such as how they normally source products. Ask if/how products are
normally reformulated and how packaging could be tailored to better fit the marketplace.
Documentation and Shipping:
1. After revising your export action plan and finding an importer/distributor, begin the process of
setting up a payment structure and working on import documentation requirements. Information
on this area can be found at: http://www.fas.usda.gov/topics/regulations-and-requirements
2. When ready to ship, begin the process of finding a freight forward that often will handle many
of the logistics of shipping for a fee. Refer to the website above for more information on this
procedure.
Marketing: When ready to market your product, use the ATO Tokyo or Osaka offices as resources for information
on promotion and marketing.
For any additional export information, refer to the USDA Foreign Agricultural Service’s export
assistance website: http://www.fas.usda.gov/topics/exporting and http://www.us-ato.jp
Helpful Tips: Points to remember when doing business in Japan:
a. Be clear with importers about the conditions under which price adjustments may occur.
b. Be aware that Japan is a very service oriented culture and requires quick responses to
both product complaints and requests for information.

c. Doing business for the first time in Japan requires patience. Orders normally start small
to determine whether the product will meet market requirements.
d. Arranging a credit check can be a good way to avoid problems. Companies such as the
following will conduct credit checks in English:
Teikoku Databank America, Inc. 780 Third Avenue, 22nd Floor
New York, NY 10017
Tel: 212-421-9805 | Fax: 212-421-9806
Email: [email protected]