JAPAN CAPITAL MARKETS...Nomura 2 20.766 507,756 81 2 21.079 -0.313 Daiwa Securities 3 19.443 475,395...
13
JAPAN CAPITAL MARKETS LEAGUE TABLES FY 2018 Preliminary As of 22 March 2019
Transcript of JAPAN CAPITAL MARKETS...Nomura 2 20.766 507,756 81 2 21.079 -0.313 Daiwa Securities 3 19.443 475,395...
JAPANCAPITALMARKETSLEAGUE TABLES
FY 2018 PreliminaryAs of 22 March 2019
The Bloomberg Capital Markets Tables represent the top arrangers, bookrunners and advisors across a broad array of deal types including loans, bonds, equity and M&A transactions; according to Bloomberg standards.
LEAG<GO> for a full range of league tables
MA<GO> for a full range of merger & acquisition tables
NI LEAG CRL<GO> or http://www.bloomberg.com/ for a full range of market-specific league table publications
Due to the dynamic nature of the Professional Service product, league table rankings may vary between this release and data found on the Bloomberg Professional Service.
MANAGER RANKINGS
JAPAN CAPITAL MARKETS
DATA SUBMISSIONS AND QUERIES
Equities
Fixed Income
Loans
Contact EmailPhone
FY 2018 PRELIMINARY AS OF 22 MARCH 2019
© 2019 Bloomberg Finance L.P. All rights reserved.
+81 3 3201 8236
+81 3 3201 7880
+852 2974 3196
Yukako Ito
Adam Wahid
Dave Lin
Bloomberg PreliminaryJapanCapitalMarkets|FY2018
BloombergLeagueTableReports Page1
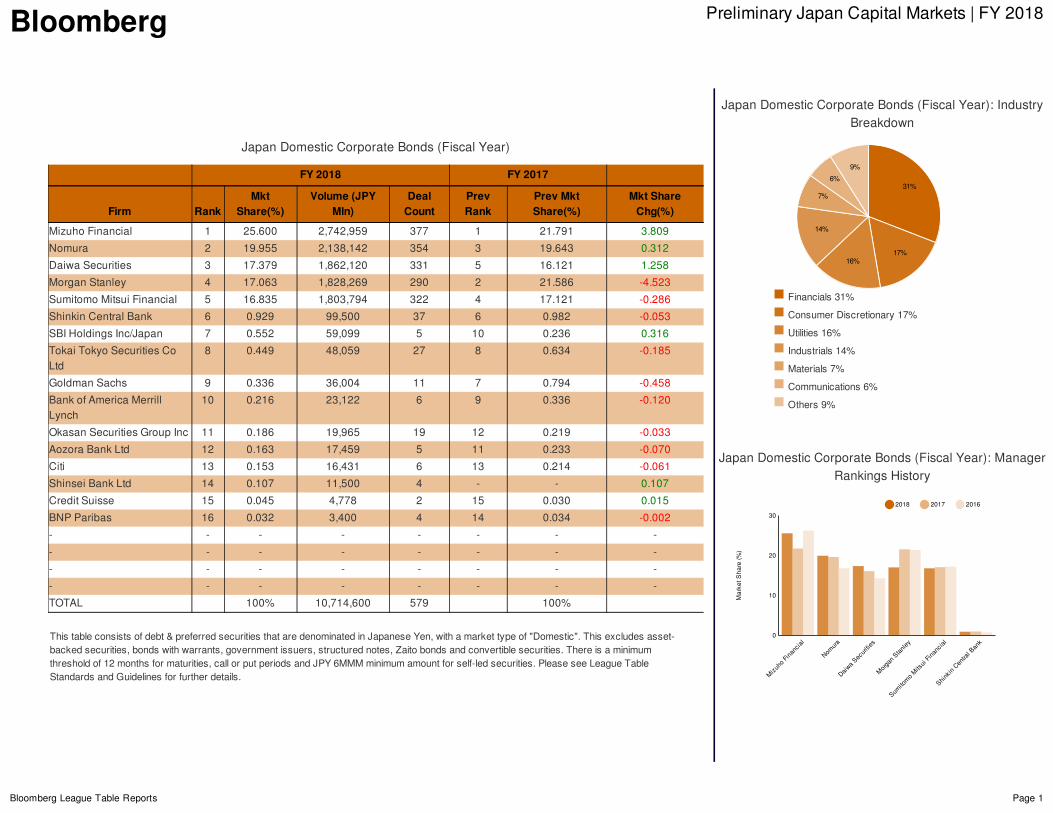
JapanDomesticCorporateBonds(FiscalYear)
FY2018 FY2017
Firm RankMkt
Share(%)Volume(JPY
Mln)DealCount
PrevRank
PrevMktShare(%)
MktShareChg(%)
MizuhoFinancial 1 25.600 2,742,959 377 1 21.791 3.809
Nomura 2 19.955 2,138,142 354 3 19.643 0.312
DaiwaSecurities 3 17.379 1,862,120 331 5 16.121 1.258
MorganStanley 4 17.063 1,828,269 290 2 21.586 -4.523
SumitomoMitsuiFinancial 5 16.835 1,803,794 322 4 17.121 -0.286
ShinkinCentralBank 6 0.929 99,500 37 6 0.982 -0.053
SBIHoldingsInc/Japan 7 0.552 59,099 5 10 0.236 0.316
TokaiTokyoSecuritiesCoLtd
8 0.449 48,059 27 8 0.634 -0.185
GoldmanSachs 9 0.336 36,004 11 7 0.794 -0.458
BankofAmericaMerrillLynch
10 0.216 23,122 6 9 0.336 -0.120
OkasanSecuritiesGroupInc 11 0.186 19,965 19 12 0.219 -0.033
AozoraBankLtd 12 0.163 17,459 5 11 0.233 -0.070
Citi 13 0.153 16,431 6 13 0.214 -0.061
ShinseiBankLtd 14 0.107 11,500 4 - - 0.107
CreditSuisse 15 0.045 4,778 2 15 0.030 0.015
BNPParibas 16 0.032 3,400 4 14 0.034 -0.002
- - - - - - - -
- - - - - - - -
- - - - - - - -
- - - - - - - -
TOTAL 100% 10,714,600 579 100%
Thistableconsistsofdebt&preferredsecuritiesthataredenominatedinJapaneseYen,withamarkettypeof"Domestic".Thisexcludesasset-backedsecurities,bondswithwarrants,governmentissuers,structurednotes,Zaitobondsandconvertiblesecurities.Thereisaminimumthresholdof12monthsformaturities,callorputperiodsandJPY6MMMminimumamountforself-ledsecurities.PleaseseeLeagueTableStandardsandGuidelinesforfurtherdetails.
Financials31%
ConsumerDiscretionary17%
Utilities16%
Industrials14%
Materials7%
Communications6%
Others9%
JapanDomesticCorporateBonds(FiscalYear):ManagerRankingsHistory
JapanDomesticCorporateBonds(FiscalYear):IndustryBreakdown
31%
17%16%
14%
7%
6%
9%
MizuhoFinancial
Nomura
DaiwaSecurities
MorganStanley
SumitomoMitsuiFinancial
ShinkinCentralBank
10
20
MarketShare(%)
0
30
2018 2017 2016
Bloomberg PreliminaryJapanCapitalMarkets|FY2018
BloombergLeagueTableReports Page2
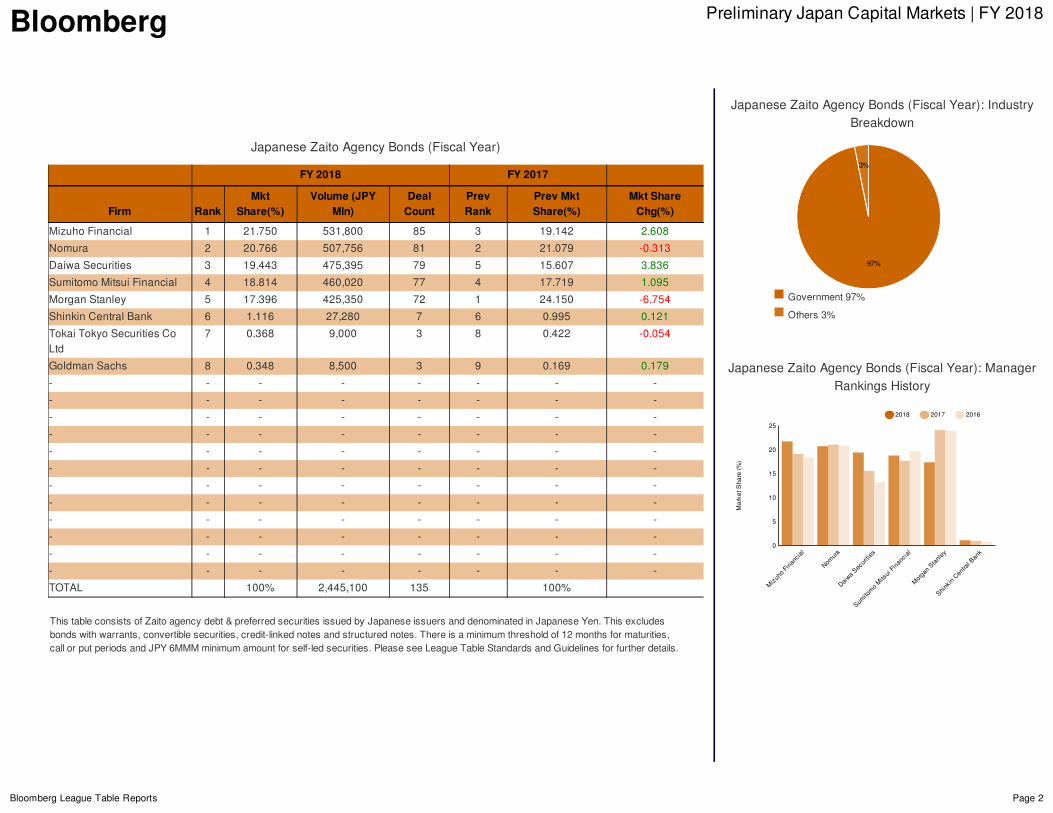
JapaneseZaitoAgencyBonds(FiscalYear)
FY2018 FY2017
Firm RankMkt
Share(%)Volume(JPY
Mln)DealCount
PrevRank
PrevMktShare(%)
MktShareChg(%)
MizuhoFinancial 1 21.750 531,800 85 3 19.142 2.608
Nomura 2 20.766 507,756 81 2 21.079 -0.313
DaiwaSecurities 3 19.443 475,395 79 5 15.607 3.836
SumitomoMitsuiFinancial 4 18.814 460,020 77 4 17.719 1.095
MorganStanley 5 17.396 425,350 72 1 24.150 -6.754
ShinkinCentralBank 6 1.116 27,280 7 6 0.995 0.121
TokaiTokyoSecuritiesCoLtd
7 0.368 9,000 3 8 0.422 -0.054
GoldmanSachs 8 0.348 8,500 3 9 0.169 0.179
- - - - - - - -
- - - - - - - -
- - - - - - - -
- - - - - - - -
- - - - - - - -
- - - - - - - -
- - - - - - - -
- - - - - - - -
- - - - - - - -
- - - - - - - -
- - - - - - - -
- - - - - - - -
TOTAL 100% 2,445,100 135 100%
ThistableconsistsofZaitoagencydebt&preferredsecuritiesissuedbyJapaneseissuersanddenominatedinJapaneseYen.Thisexcludesbondswithwarrants,convertiblesecurities,credit-linkednotesandstructurednotes.Thereisaminimumthresholdof12monthsformaturities,callorputperiodsandJPY6MMMminimumamountforself-ledsecurities.PleaseseeLeagueTableStandardsandGuidelinesforfurtherdetails.
Government97%
Others3%
JapaneseZaitoAgencyBonds(FiscalYear):ManagerRankingsHistory
JapaneseZaitoAgencyBonds(FiscalYear):IndustryBreakdown
97%
3%
MizuhoFinancial
Nomura
DaiwaSecurities
SumitomoMitsuiFinancial
MorganStanley
ShinkinCentralBank
5
10
15
20
MarketShare(%)
0
25
2018 2017 2016
Bloomberg PreliminaryJapanCapitalMarkets|FY2018
BloombergLeagueTableReports Page3
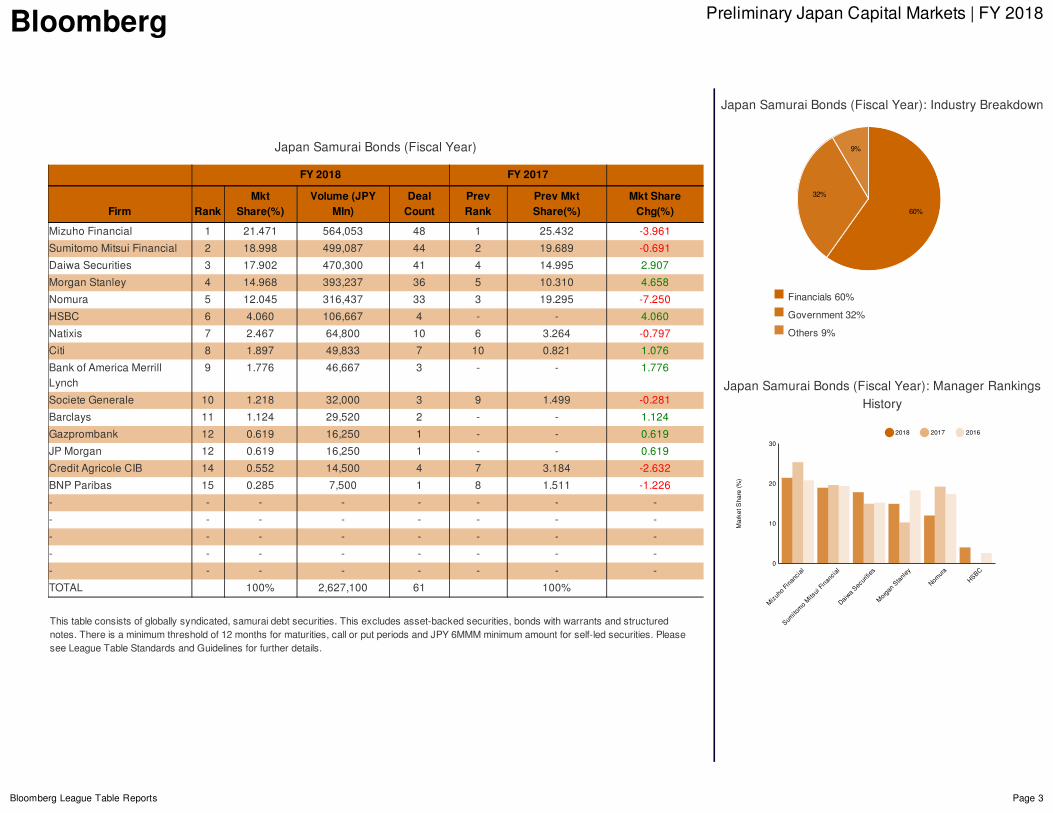
JapanSamuraiBonds(FiscalYear)
FY2018 FY2017
Firm RankMkt
Share(%)Volume(JPY
Mln)DealCount
PrevRank
PrevMktShare(%)
MktShareChg(%)
MizuhoFinancial 1 21.471 564,053 48 1 25.432 -3.961
SumitomoMitsuiFinancial 2 18.998 499,087 44 2 19.689 -0.691
DaiwaSecurities 3 17.902 470,300 41 4 14.995 2.907
MorganStanley 4 14.968 393,237 36 5 10.310 4.658
Nomura 5 12.045 316,437 33 3 19.295 -7.250
HSBC 6 4.060 106,667 4 - - 4.060
Natixis 7 2.467 64,800 10 6 3.264 -0.797
Citi 8 1.897 49,833 7 10 0.821 1.076
BankofAmericaMerrillLynch
9 1.776 46,667 3 - - 1.776
SocieteGenerale 10 1.218 32,000 3 9 1.499 -0.281
Barclays 11 1.124 29,520 2 - - 1.124
Gazprombank 12 0.619 16,250 1 - - 0.619
JPMorgan 12 0.619 16,250 1 - - 0.619
CreditAgricoleCIB 14 0.552 14,500 4 7 3.184 -2.632
BNPParibas 15 0.285 7,500 1 8 1.511 -1.226
- - - - - - - -
- - - - - - - -
- - - - - - - -
- - - - - - - -
- - - - - - - -
TOTAL 100% 2,627,100 61 100%
Thistableconsistsofgloballysyndicated,samuraidebtsecurities.Thisexcludesasset-backedsecurities,bondswithwarrantsandstructurednotes.Thereisaminimumthresholdof12monthsformaturities,callorputperiodsandJPY6MMMminimumamountforself-ledsecurities.PleaseseeLeagueTableStandardsandGuidelinesforfurtherdetails.
Financials60%
Government32%
Others9%
JapanSamuraiBonds(FiscalYear):ManagerRankingsHistory
JapanSamuraiBonds(FiscalYear):IndustryBreakdown
60%
32%
9%
MizuhoFinancial
SumitomoMitsuiFinancial
DaiwaSecurities
MorganStanley
Nomura
HSBC
10
20
MarketShare(%)
0
30
2018 2017 2016
Bloomberg PreliminaryJapanCapitalMarkets|FY2018
BloombergLeagueTableReports Page4
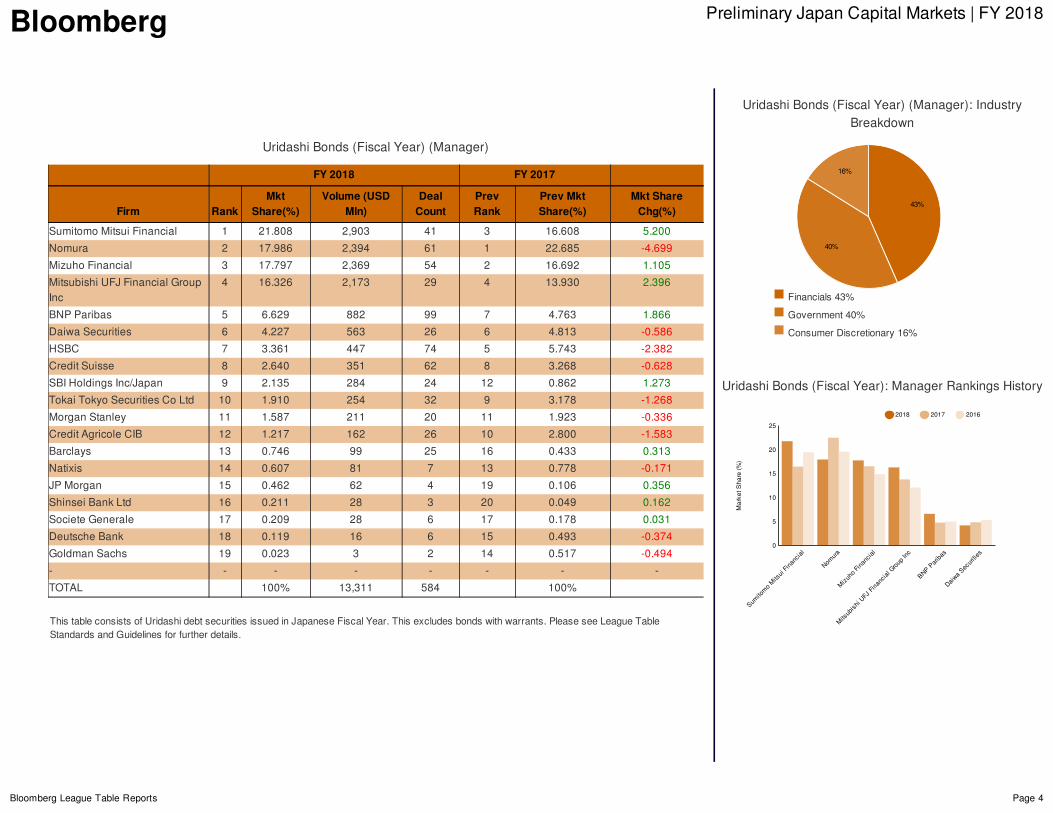
UridashiBonds(FiscalYear)(Manager)
FY2018 FY2017
Firm RankMkt
Share(%)Volume(USD
Mln)DealCount
PrevRank
PrevMktShare(%)
MktShareChg(%)
SumitomoMitsuiFinancial 1 21.808 2,903 41 3 16.608 5.200
Nomura 2 17.986 2,394 61 1 22.685 -4.699
MizuhoFinancial 3 17.797 2,369 54 2 16.692 1.105
MitsubishiUFJFinancialGroupInc
4 16.326 2,173 29 4 13.930 2.396
BNPParibas 5 6.629 882 99 7 4.763 1.866
DaiwaSecurities 6 4.227 563 26 6 4.813 -0.586
HSBC 7 3.361 447 74 5 5.743 -2.382
CreditSuisse 8 2.640 351 62 8 3.268 -0.628
SBIHoldingsInc/Japan 9 2.135 284 24 12 0.862 1.273
TokaiTokyoSecuritiesCoLtd 10 1.910 254 32 9 3.178 -1.268
MorganStanley 11 1.587 211 20 11 1.923 -0.336
CreditAgricoleCIB 12 1.217 162 26 10 2.800 -1.583
Barclays 13 0.746 99 25 16 0.433 0.313
Natixis 14 0.607 81 7 13 0.778 -0.171
JPMorgan 15 0.462 62 4 19 0.106 0.356
ShinseiBankLtd 16 0.211 28 3 20 0.049 0.162
SocieteGenerale 17 0.209 28 6 17 0.178 0.031
DeutscheBank 18 0.119 16 6 15 0.493 -0.374
GoldmanSachs 19 0.023 3 2 14 0.517 -0.494
- - - - - - - -
TOTAL 100% 13,311 584 100%
ThistableconsistsofUridashidebtsecuritiesissuedinJapaneseFiscalYear.Thisexcludesbondswithwarrants.PleaseseeLeagueTableStandardsandGuidelinesforfurtherdetails.
Financials43%
Government40%
ConsumerDiscretionary16%
UridashiBonds(FiscalYear):ManagerRankingsHistory
UridashiBonds(FiscalYear)(Manager):IndustryBreakdown
43%
40%
16%
SumitomoMitsuiFinancial
Nomura
MizuhoFinancial
MitsubishiUFJFinancialGroupInc
BNPParibas
DaiwaSecurities
5
10
15
20
MarketShare(%)
0
25
2018 2017 2016
Bloomberg PreliminaryJapanCapitalMarkets|FY2018
BloombergLeagueTableReports Page5
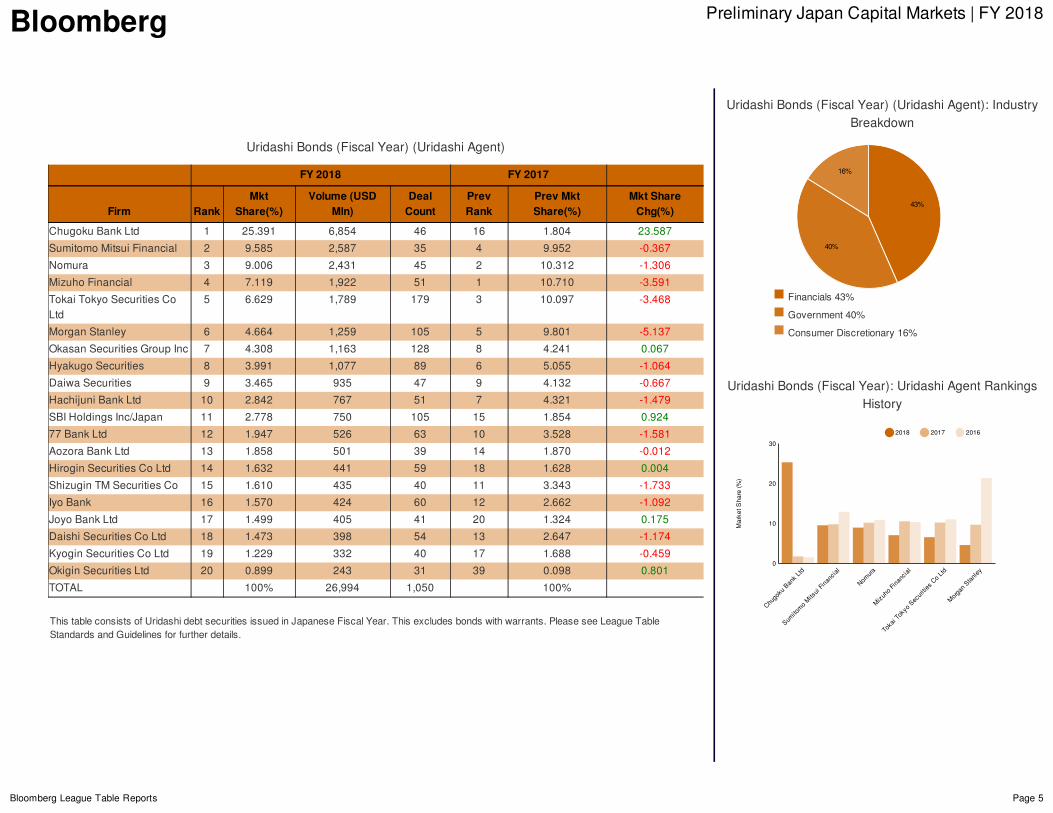
UridashiBonds(FiscalYear)(UridashiAgent)
FY2018 FY2017
Firm RankMkt
Share(%)Volume(USD
Mln)DealCount
PrevRank
PrevMktShare(%)
MktShareChg(%)
ChugokuBankLtd 1 25.391 6,854 46 16 1.804 23.587
SumitomoMitsuiFinancial 2 9.585 2,587 35 4 9.952 -0.367
Nomura 3 9.006 2,431 45 2 10.312 -1.306
MizuhoFinancial 4 7.119 1,922 51 1 10.710 -3.591
TokaiTokyoSecuritiesCoLtd
5 6.629 1,789 179 3 10.097 -3.468
MorganStanley 6 4.664 1,259 105 5 9.801 -5.137
OkasanSecuritiesGroupInc 7 4.308 1,163 128 8 4.241 0.067
HyakugoSecurities 8 3.991 1,077 89 6 5.055 -1.064
DaiwaSecurities 9 3.465 935 47 9 4.132 -0.667
HachijuniBankLtd 10 2.842 767 51 7 4.321 -1.479
SBIHoldingsInc/Japan 11 2.778 750 105 15 1.854 0.924
77BankLtd 12 1.947 526 63 10 3.528 -1.581
AozoraBankLtd 13 1.858 501 39 14 1.870 -0.012
HiroginSecuritiesCoLtd 14 1.632 441 59 18 1.628 0.004
ShizuginTMSecuritiesCo 15 1.610 435 40 11 3.343 -1.733
IyoBank 16 1.570 424 60 12 2.662 -1.092
JoyoBankLtd 17 1.499 405 41 20 1.324 0.175
DaishiSecuritiesCoLtd 18 1.473 398 54 13 2.647 -1.174
KyoginSecuritiesCoLtd 19 1.229 332 40 17 1.688 -0.459
OkiginSecuritiesLtd 20 0.899 243 31 39 0.098 0.801
TOTAL 100% 26,994 1,050 100%
ThistableconsistsofUridashidebtsecuritiesissuedinJapaneseFiscalYear.Thisexcludesbondswithwarrants.PleaseseeLeagueTableStandardsandGuidelinesforfurtherdetails.
Financials43%
Government40%
ConsumerDiscretionary16%
UridashiBonds(FiscalYear):UridashiAgentRankingsHistory
UridashiBonds(FiscalYear)(UridashiAgent):IndustryBreakdown
43%
40%
16%
ChugokuBankLtd
SumitomoMitsuiFinancial
Nomura
MizuhoFinancial
TokaiTokyoSecuritiesCoLtd
MorganStanley
10
20
MarketShare(%)
0
30
2018 2017 2016
Bloomberg PreliminaryJapanCapitalMarkets|FY2018
BloombergLeagueTableReports Page6
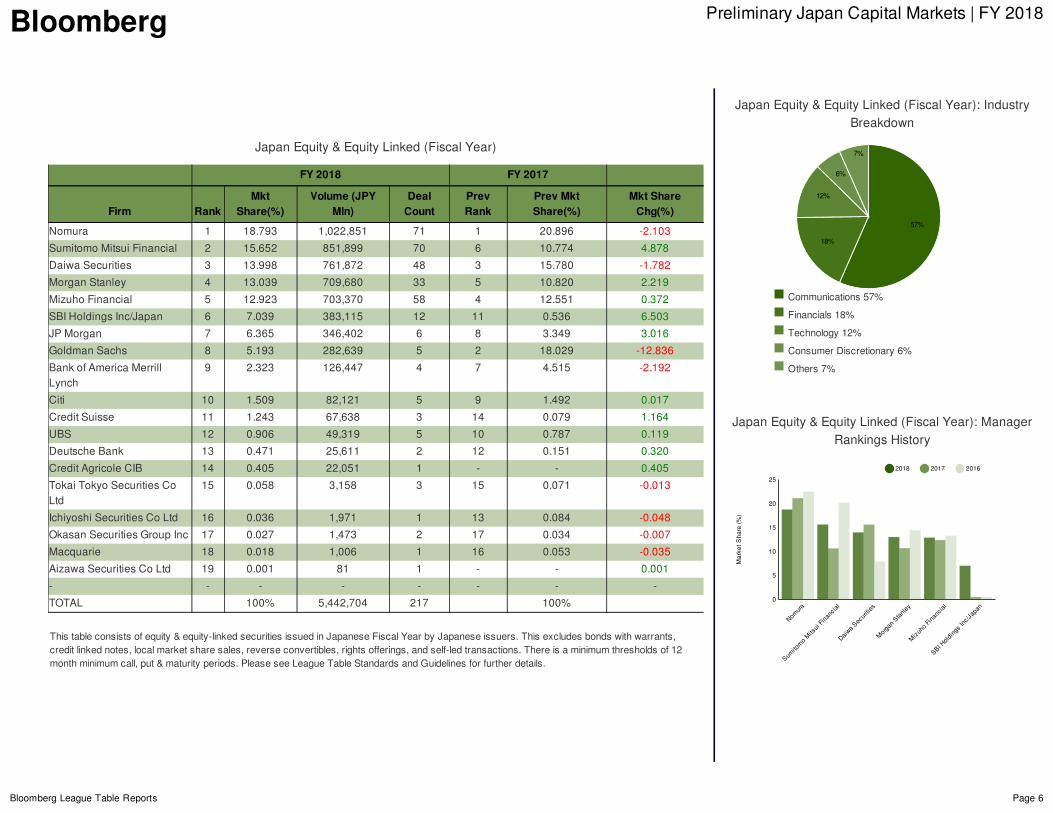
JapanEquity&EquityLinked(FiscalYear)
FY2018 FY2017
Firm RankMkt
Share(%)Volume(JPY
Mln)DealCount
PrevRank
PrevMktShare(%)
MktShareChg(%)
Nomura 1 18.793 1,022,851 71 1 20.896 -2.103
SumitomoMitsuiFinancial 2 15.652 851,899 70 6 10.774 4.878
DaiwaSecurities 3 13.998 761,872 48 3 15.780 -1.782
MorganStanley 4 13.039 709,680 33 5 10.820 2.219
MizuhoFinancial 5 12.923 703,370 58 4 12.551 0.372
SBIHoldingsInc/Japan 6 7.039 383,115 12 11 0.536 6.503
JPMorgan 7 6.365 346,402 6 8 3.349 3.016
GoldmanSachs 8 5.193 282,639 5 2 18.029 -12.836
BankofAmericaMerrillLynch
9 2.323 126,447 4 7 4.515 -2.192
Citi 10 1.509 82,121 5 9 1.492 0.017
CreditSuisse 11 1.243 67,638 3 14 0.079 1.164
UBS 12 0.906 49,319 5 10 0.787 0.119
DeutscheBank 13 0.471 25,611 2 12 0.151 0.320
CreditAgricoleCIB 14 0.405 22,051 1 - - 0.405
TokaiTokyoSecuritiesCoLtd
15 0.058 3,158 3 15 0.071 -0.013
IchiyoshiSecuritiesCoLtd 16 0.036 1,971 1 13 0.084 -0.048
OkasanSecuritiesGroupInc 17 0.027 1,473 2 17 0.034 -0.007
Macquarie 18 0.018 1,006 1 16 0.053 -0.035
AizawaSecuritiesCoLtd 19 0.001 81 1 - - 0.001
- - - - - - - -
TOTAL 100% 5,442,704 217 100%
Thistableconsistsofequity&equity-linkedsecuritiesissuedinJapaneseFiscalYearbyJapaneseissuers.Thisexcludesbondswithwarrants,creditlinkednotes,localmarketsharesales,reverseconvertibles,rightsofferings,andself-ledtransactions.Thereisaminimumthresholdsof12monthminimumcall,put&maturityperiods.PleaseseeLeagueTableStandardsandGuidelinesforfurtherdetails.
Communications57%
Financials18%
Technology12%
ConsumerDiscretionary6%
Others7%
JapanEquity&EquityLinked(FiscalYear):ManagerRankingsHistory
JapanEquity&EquityLinked(FiscalYear):IndustryBreakdown
57%
18%
12%
6%
7%
Nomura
SumitomoMitsuiFinancial
DaiwaSecurities
MorganStanley
MizuhoFinancial
SBIHoldingsInc/Japan
5
10
15
20
MarketShare(%)
0
25
2018 2017 2016
Bloomberg PreliminaryJapanCapitalMarkets|FY2018
BloombergLeagueTableReports Page7
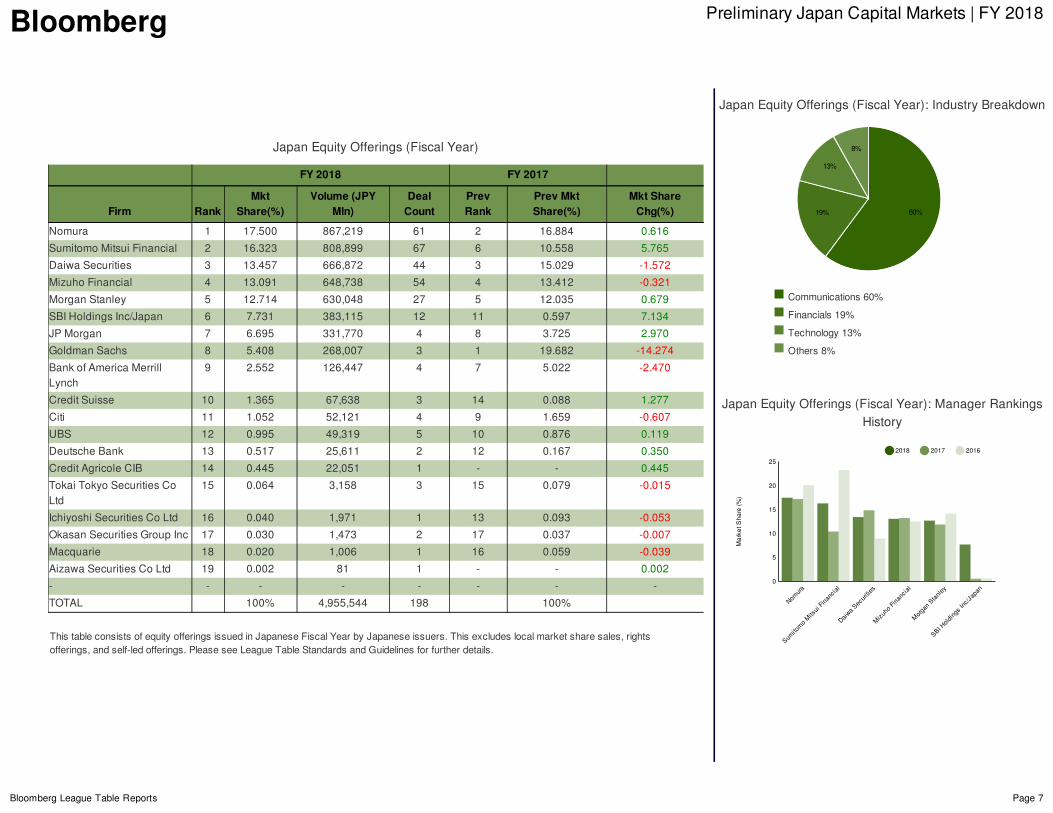
JapanEquityOfferings(FiscalYear)
FY2018 FY2017
Firm RankMkt
Share(%)Volume(JPY
Mln)DealCount
PrevRank
PrevMktShare(%)
MktShareChg(%)
Nomura 1 17.500 867,219 61 2 16.884 0.616
SumitomoMitsuiFinancial 2 16.323 808,899 67 6 10.558 5.765
DaiwaSecurities 3 13.457 666,872 44 3 15.029 -1.572
MizuhoFinancial 4 13.091 648,738 54 4 13.412 -0.321
MorganStanley 5 12.714 630,048 27 5 12.035 0.679
SBIHoldingsInc/Japan 6 7.731 383,115 12 11 0.597 7.134
JPMorgan 7 6.695 331,770 4 8 3.725 2.970
GoldmanSachs 8 5.408 268,007 3 1 19.682 -14.274
BankofAmericaMerrillLynch
9 2.552 126,447 4 7 5.022 -2.470
CreditSuisse 10 1.365 67,638 3 14 0.088 1.277
Citi 11 1.052 52,121 4 9 1.659 -0.607
UBS 12 0.995 49,319 5 10 0.876 0.119
DeutscheBank 13 0.517 25,611 2 12 0.167 0.350
CreditAgricoleCIB 14 0.445 22,051 1 - - 0.445
TokaiTokyoSecuritiesCoLtd
15 0.064 3,158 3 15 0.079 -0.015
IchiyoshiSecuritiesCoLtd 16 0.040 1,971 1 13 0.093 -0.053
OkasanSecuritiesGroupInc 17 0.030 1,473 2 17 0.037 -0.007
Macquarie 18 0.020 1,006 1 16 0.059 -0.039
AizawaSecuritiesCoLtd 19 0.002 81 1 - - 0.002
- - - - - - - -
TOTAL 100% 4,955,544 198 100%
ThistableconsistsofequityofferingsissuedinJapaneseFiscalYearbyJapaneseissuers.Thisexcludeslocalmarketsharesales,rightsofferings,andself-ledofferings.PleaseseeLeagueTableStandardsandGuidelinesforfurtherdetails.
Communications60%
Financials19%
Technology13%
Others8%
JapanEquityOfferings(FiscalYear):ManagerRankingsHistory
JapanEquityOfferings(FiscalYear):IndustryBreakdown
60%19%
13%
8%
Nomura
SumitomoMitsuiFinancial
DaiwaSecurities
MizuhoFinancial
MorganStanley
SBIHoldingsInc/Japan
5
10
15
20
MarketShare(%)
0
25
2018 2017 2016
Bloomberg PreliminaryJapanCapitalMarkets|FY2018
BloombergLeagueTableReports Page8
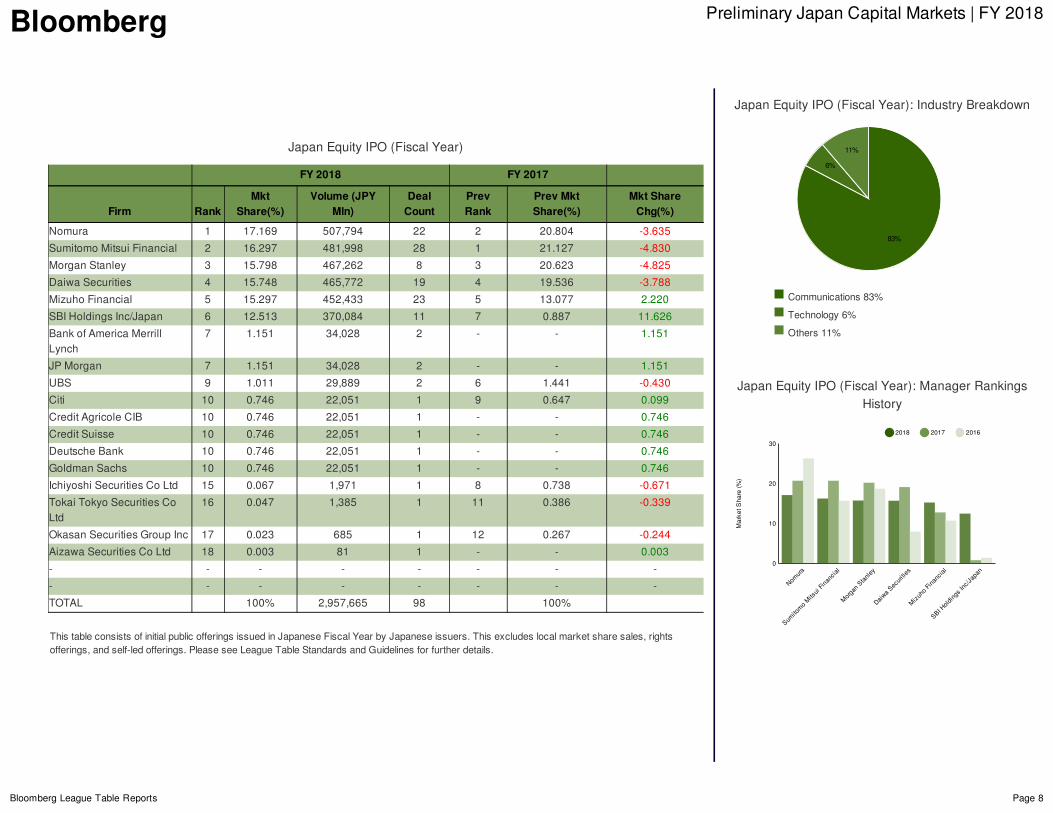
JapanEquityIPO(FiscalYear)
FY2018 FY2017
Firm RankMkt
Share(%)Volume(JPY
Mln)DealCount
PrevRank
PrevMktShare(%)
MktShareChg(%)
Nomura 1 17.169 507,794 22 2 20.804 -3.635
SumitomoMitsuiFinancial 2 16.297 481,998 28 1 21.127 -4.830
MorganStanley 3 15.798 467,262 8 3 20.623 -4.825
DaiwaSecurities 4 15.748 465,772 19 4 19.536 -3.788
MizuhoFinancial 5 15.297 452,433 23 5 13.077 2.220
SBIHoldingsInc/Japan 6 12.513 370,084 11 7 0.887 11.626
BankofAmericaMerrillLynch
7 1.151 34,028 2 - - 1.151
JPMorgan 7 1.151 34,028 2 - - 1.151
UBS 9 1.011 29,889 2 6 1.441 -0.430
Citi 10 0.746 22,051 1 9 0.647 0.099
CreditAgricoleCIB 10 0.746 22,051 1 - - 0.746
CreditSuisse 10 0.746 22,051 1 - - 0.746
DeutscheBank 10 0.746 22,051 1 - - 0.746
GoldmanSachs 10 0.746 22,051 1 - - 0.746
IchiyoshiSecuritiesCoLtd 15 0.067 1,971 1 8 0.738 -0.671
TokaiTokyoSecuritiesCoLtd
16 0.047 1,385 1 11 0.386 -0.339
OkasanSecuritiesGroupInc 17 0.023 685 1 12 0.267 -0.244
AizawaSecuritiesCoLtd 18 0.003 81 1 - - 0.003
- - - - - - - -
- - - - - - - -
TOTAL 100% 2,957,665 98 100%
ThistableconsistsofinitialpublicofferingsissuedinJapaneseFiscalYearbyJapaneseissuers.Thisexcludeslocalmarketsharesales,rightsofferings,andself-ledofferings.PleaseseeLeagueTableStandardsandGuidelinesforfurtherdetails.
Communications83%
Technology6%
Others11%
JapanEquityIPO(FiscalYear):ManagerRankingsHistory
JapanEquityIPO(FiscalYear):IndustryBreakdown
83%
6%
11%
Nomura
SumitomoMitsuiFinancial
MorganStanley
DaiwaSecurities
MizuhoFinancial
SBIHoldingsInc/Japan
10
20
MarketShare(%)
0
30
2018 2017 2016
Bloomberg PreliminaryJapanCapitalMarkets|FY2018
BloombergLeagueTableReports Page9
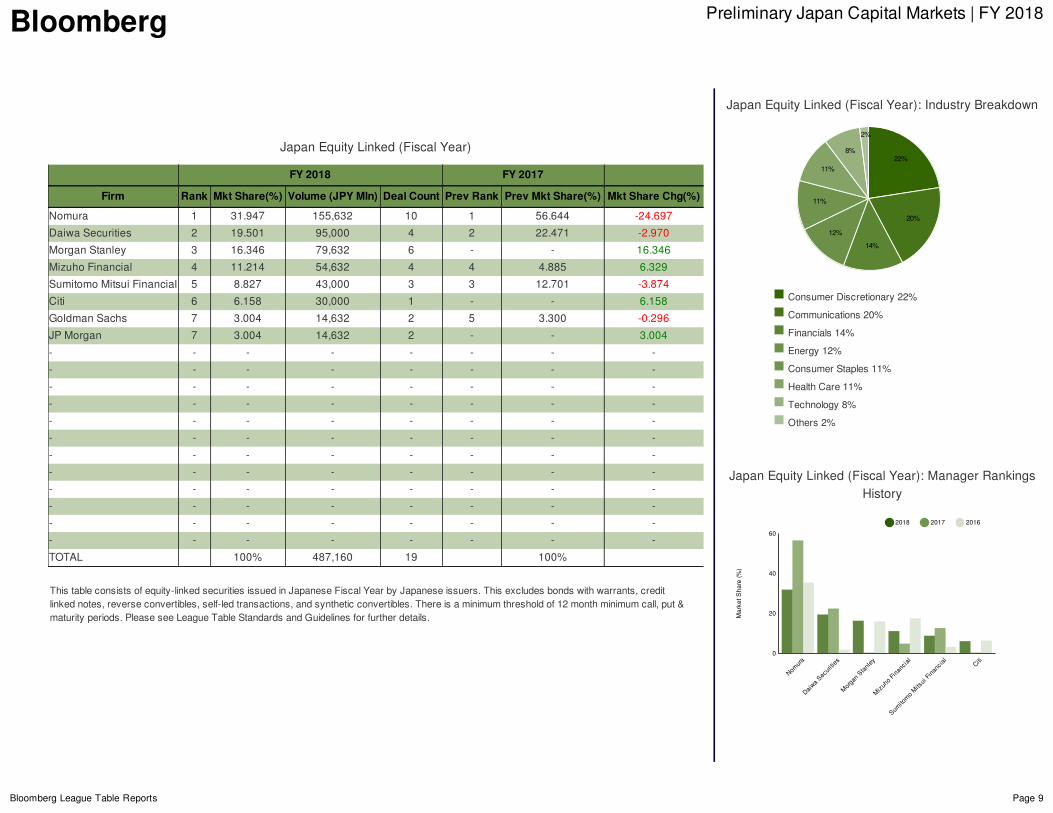
JapanEquityLinked(FiscalYear)
FY2018 FY2017
Firm Rank MktShare(%) Volume(JPYMln) DealCount PrevRank PrevMktShare(%) MktShareChg(%)
Nomura 1 31.947 155,632 10 1 56.644 -24.697
DaiwaSecurities 2 19.501 95,000 4 2 22.471 -2.970
MorganStanley 3 16.346 79,632 6 - - 16.346
MizuhoFinancial 4 11.214 54,632 4 4 4.885 6.329
SumitomoMitsuiFinancial 5 8.827 43,000 3 3 12.701 -3.874
Citi 6 6.158 30,000 1 - - 6.158
GoldmanSachs 7 3.004 14,632 2 5 3.300 -0.296
JPMorgan 7 3.004 14,632 2 - - 3.004
- - - - - - - -
- - - - - - - -
- - - - - - - -
- - - - - - - -
- - - - - - - -
- - - - - - - -
- - - - - - - -
- - - - - - - -
- - - - - - - -
- - - - - - - -
- - - - - - - -
- - - - - - - -
TOTAL 100% 487,160 19 100%
Thistableconsistsofequity-linkedsecuritiesissuedinJapaneseFiscalYearbyJapaneseissuers.Thisexcludesbondswithwarrants,creditlinkednotes,reverseconvertibles,self-ledtransactions,andsyntheticconvertibles.Thereisaminimumthresholdof12monthminimumcall,put&maturityperiods.PleaseseeLeagueTableStandardsandGuidelinesforfurtherdetails.
ConsumerDiscretionary22%
Communications20%
Financials14%
Energy12%
ConsumerStaples11%
HealthCare11%
Technology8%
Others2%
JapanEquityLinked(FiscalYear):ManagerRankingsHistory
JapanEquityLinked(FiscalYear):IndustryBreakdown
22%
20%
14%
12%
11%
11%
8%
2%
Nomura
DaiwaSecurities
MorganStanley
MizuhoFinancial
SumitomoMitsuiFinancial
Citi
20
40
MarketShare(%)
0
60
2018 2017 2016
Bloomberg – League Tables Criteria
Bloomberg L.P. reserves the right of final decision concerning league eligibility and requires adequate documentation for the same. Bloomberg L.P. and its suppliers believe the information herein was obtained from reliable sources, but they do not guarantee its accuracy. Neither the information nor the opinion expressed constitutes a solicitation of the purchase or sale of securities or commodities. Due to the dynamic nature of the Professional Service product, League Table rankings may vary between the quarterly/year-end publications and data found on the Bloomberg Professional Service.
General Guidelines
Credit is based on the total amount of the offering sold to the public. Full credit is awarded to the sole bookrunning manager or split equally among joint bookrunning managers; unless full, explicit breakdown of bookrunning is provided by an involved party. Regional and local tables are identified based on factors such as currency, market of issuer and/or country of risk/incorporation.
Fixed Income
All transactions must have a maturity/call/put option of minimum 18 months. Make-whole call and provisional call/put are exempted from this rule. Note: Criteria may vary for some local and/or regional tables. USD denominated 144A/REG S issues are credited 100% to the 144A tranche and 0% to the REG S tranche. Non-USD denominated 144A/REG S issues are credited 100% to the REG S tranche and 0% to the 144A tranche. Self-led transactions are included. New money portions of exchange offers are eligible for credit.
Exclusions: Accredited investor tranches, asset-backed issues, auction note agencies, collateralized bond obligations, collateralized loan obligations, commercial paper, municipal bonds, mortgage-backed issues, remarketed issues, repackaged bonds, government borrowing scheme retained bonds, variable principal redemption issues, variable interest equity-linked issues, and credit linked notes, selling group agency issues, strips, units, warrants, self-led under USD 50 million. Note: Criteria may vary for some local and/or regional tables.
Equities-Linked
Equity-linked transactions: Convertible bonds, convertible preferred stock and exchangeable bonds. Only issues that mature and are callable/puttable in 12 months or longer are included. Make-whole call, provisional call and provisional put are exempted from this rule. Convertible bonds with attached warrants are included. These are defined as synthetic convertibles with the combination of a fixed income instrument and warrants which can be converted into shares. The embedded warrant can be detachable or non-detachable but the bond and the warrant must be sold as a unit, i.e. there cannot be separate book building for the warrant and the bond.
Exclusions: Redemption-linked instruments, reverse convertibles or similar instruments, synthetics convertibles, issues convertible into participation in an underlying fund or investment trust, pre-IPO convertible instruments, certain lower hierarchy titles, i.e. Jr Bookrunner.
Equities
Equity market transactions: Initial public offerings, additional offerings of common stocks, units, and depositary receipts (ADRs, GDRs, etc) and rights offerings.
Exclusions: Non-underwritten/best efforts, privately placed transactions, funds, self-led, preferred offerings, pre-negotiated offerings, certain lower hierarchy titles, i.e. Jr Bookrunner. Note: Criteria may vary for some local and/or regional tables.
Bloomberg – League Tables Criteria
Bloomberg L.P. reserves the right of final decision concerning league eligibility and requires adequate documentation for the same. Bloomberg L.P. and its suppliers believe the information herein was obtained from reliable sources, but they do not guarantee its accuracy. Neither the information nor the opinion expressed constitutes a solicitation of the purchase or sale of securities or commodities. Due to the dynamic nature of the Professional Service product, League Table rankings may vary between the quarterly/year-end publications and data found on the Bloomberg Professional Service.
Loans
Includes executed syndicated loans transactions. Full credit is awarded to the banks satisfying the highest of the titles. Full credit is awarded to the sole bookrunning manager or split equally among joint bookrunning managers. Credit is allocated to amended or amended and restated transactions, where each modification is 100% at the lender’s option and not as a result of events already built into the original credit agreement. Credit is awarded for the following structural changes only: maturity extensions of three months or more, incremental basis for increased in deal size, reduction in pricing, full release of security.
Exclusions: Bilateral transactions, transactions with a maturity of less than three months, loans withdrawn prior to signing, amended or restated securitizations, receivable and guarantee facilities.
US Municipals
Standard published tables will award deal credit based on true economic credit as reported by the issuer or the bookrunner. In absence of reported economic credit, 100% will be assigned to the bookrunner.
Dollar value of credit will be assigned based on the percentage allocation reported for economic credit (or designated by the user in a custom table) and applied against the total par value of the bonds issued. Zero coupon bonds (CABS) or intermediate appreciation bonds (convertible CABs) will be included at the market value (accreted value) on the interest accrual date.
All debt issued by municipal issuers will be eligible for league credit. Taxable and tax-exempt debt is eligible for league credit unless a table includes specific tax type criteria. “Tax-exempt” is defined as federally tax-exempt and includes bonds subject to AMT and bonds designated as Bank Qualified.
Each table is provided in three formats. “Economic Credit” displays rankings based on true economic credit allocations of applicable deals. “Left Lead” assigns 100% credit to the bookrunner and 0% to all other syndicate participants. “Deal Count” displays rankings based on deal quantity rather than aggregate economic credit amounts. A “deal” refers to the aggregate series within an issuance led by a particular underwriter or syndicate. For example: a $50 million issuance is split into three series- a $10 million Series A, a $20 million Series B, and a $20 million Series C. Bank 1 is the underwriter of Series A & B, while Bank 2 is the underwriter of Series C. Bank 1 would have one “deal” worth $30 million, and Bank 2 would have one “deal” worth $20 million.
Exclusions: Derivatives, private placements, variable rate preferred securities, municipal commercial paper, and remarketings are excluded from municipal league table eligibility.
The full version of Bloomberg’s League table Standards & Guidelines can be accessed and subscribed to on the Reports tab on
LEAG<GO>.