
January/February 2017 February 2017 - Amazon Web Services · January/February 2017 February 2017 ....
35
February 2017 January/February 2017
Transcript of January/February 2017 February 2017 - Amazon Web Services · January/February 2017 February 2017 ....
February 2017 January/February 2017
February 2017
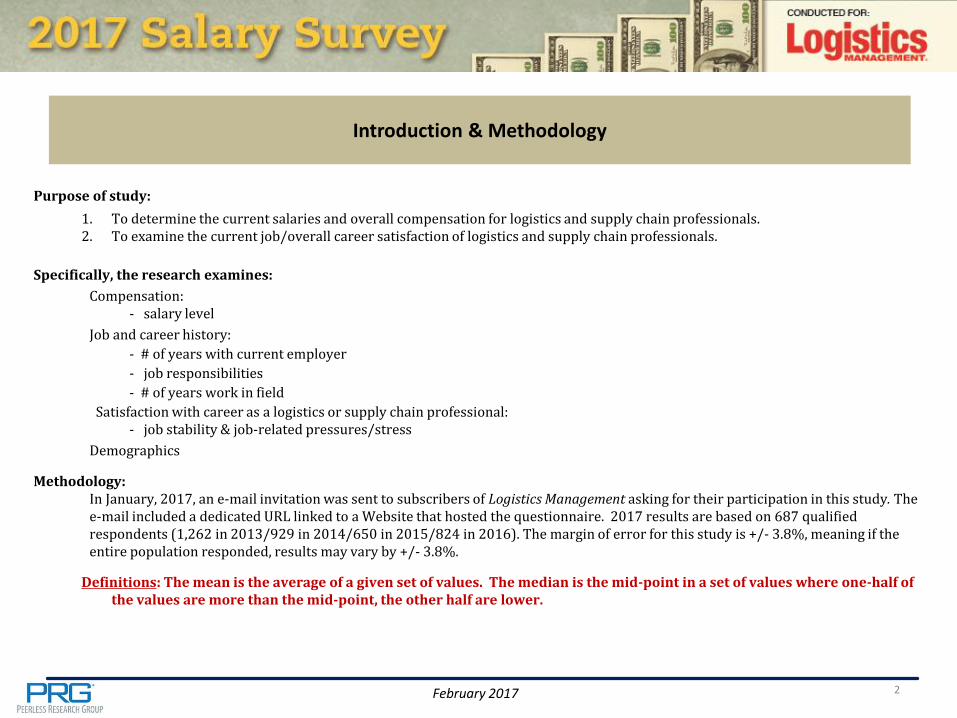
Introduction & Methodology
2
Purpose of study:
1. To determine the current salaries and overall compensation for logistics and supply chain professionals. 2. To examine the current job/overall career satisfaction of logistics and supply chain professionals.
Specifically, the research examines:
Compensation: - salary level
Job and career history:
- # of years with current employer
- job responsibilities
- # of years work in field
Satisfaction with career as a logistics or supply chain professional: - job stability & job-related pressures/stress
Demographics
Methodology: In January, 2017, an e-mail invitation was sent to subscribers of Logistics Management asking for their participation in this study. The e-mail included a dedicated URL linked to a Website that hosted the questionnaire. 2017 results are based on 687 qualified respondents (1,262 in 2013/929 in 2014/650 in 2015/824 in 2016). The margin of error for this study is +/- 3.8%, meaning if the entire population responded, results may vary by +/- 3.8%.
Definitions: The mean is the average of a given set of values. The median is the mid-point in a set of values where one-half of the values are more than the mid-point, the other half are lower.

February 2017
What is your current total annual salary for 2017? (Please include bonuses and commissions, etc.)
4%
6% 6%
9% 11%
11%
8%
12%
13%
16%
4%
4%
7% 9%
9%
12%
10%
9%
11% 11%
14%
3%
Less than$40,000
$40,000 -$49,999
$50,000 -$59,999
$60,000 -$69,999
$70,000 -$79,999
$80,000 -$89,999
$90,000 -$99,999
$100,000 -$119,999
$120,000 -$149,999
$150,000 -$249,999
$250,000 +
2017
2016
3
2017 2016 2015 2014 2013
Average salary
$113,175 $105,675 $118,880 $112,965 $113,450
Median salary
$90,000 $90,000 $95,000 $94,000 $85,000
February 2017
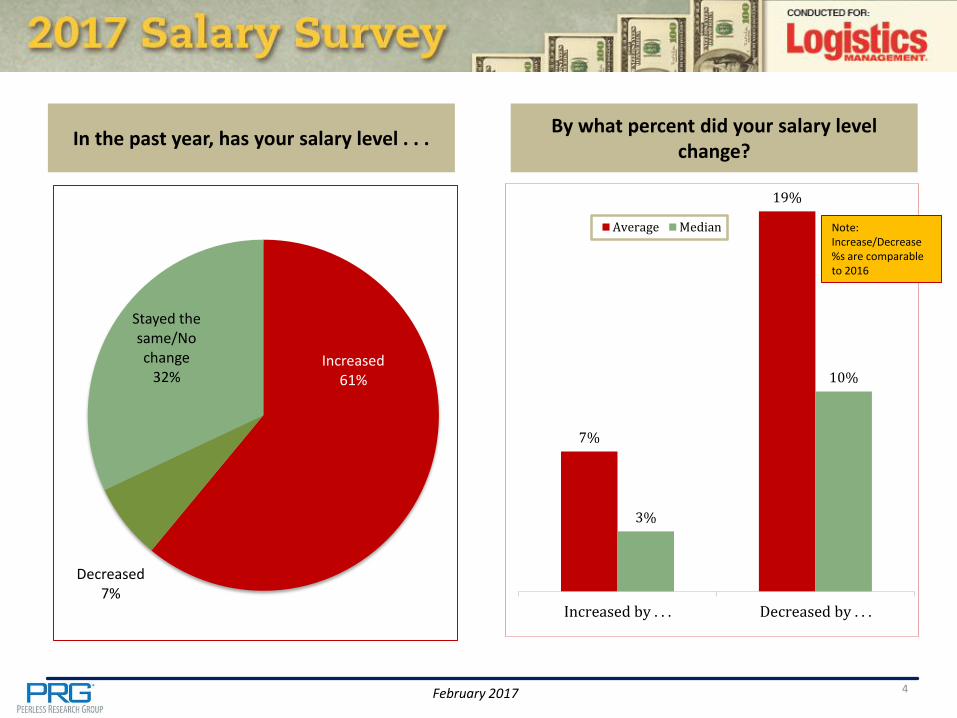
In the past year, has your salary level . . .
Increased 61%
Decreased 7%
Stayed the same/No change
32%
7%
19%
3%
10%
Increased by . . . Decreased by . . .
Average Median
4
By what percent did your salary level change?
Note: Increase/Decrease %s are comparable to 2016
February 2017
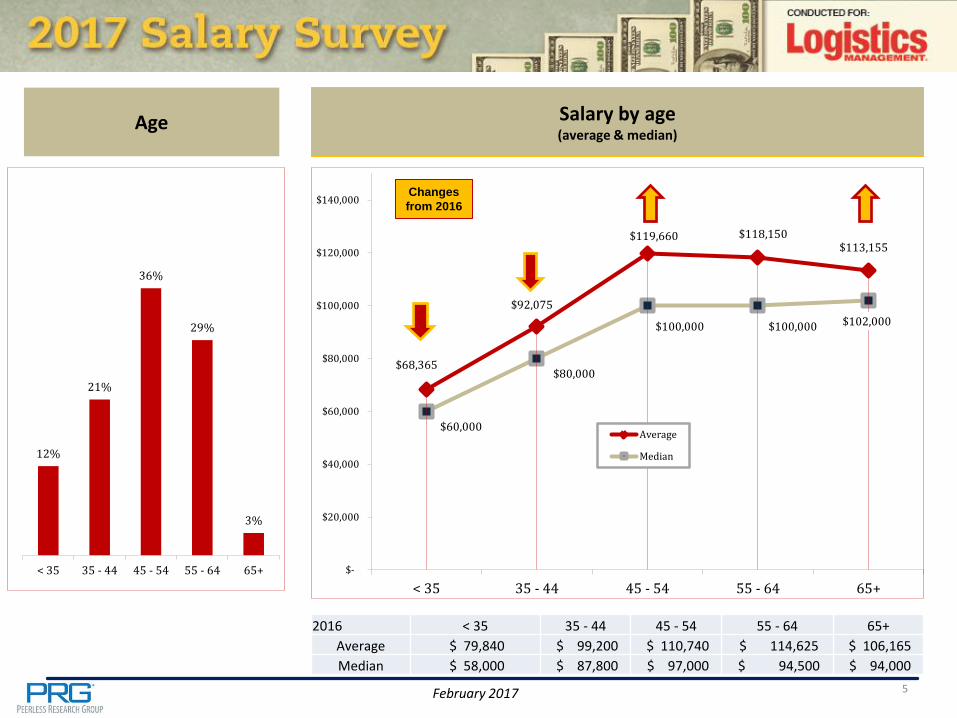
Age
12%
21%
36%
29%
3%
< 35 35 - 44 45 - 54 55 - 64 65+
5
Salary by age (average & median)
$68,365
$92,075
$119,660 $118,150 $113,155
$60,000
$80,000
$100,000 $100,000 $102,000
$-
$20,000
$40,000
$60,000
$80,000
$100,000
$120,000
$140,000
< 35 35 - 44 45 - 54 55 - 64 65+
Average
Median
2016 < 35 35 - 44 45 - 54 55 - 64 65+
Average $ 79,840 $ 99,200 $ 110,740 $ 114,625 $ 106,165
Median $ 58,000 $ 87,800 $ 97,000 $ 94,500 $ 94,000
Changes
from 2016

February 2017
Gender
82%
18%
Male Female
6
Salary by gender (average & median)
$119,236
$81,385 $85,000
$75,000
Male Female
Average Median
2016 Male Female
Average $ 110,390 $ 85,200
Median $ 92,000 $ 70,000
February 2017
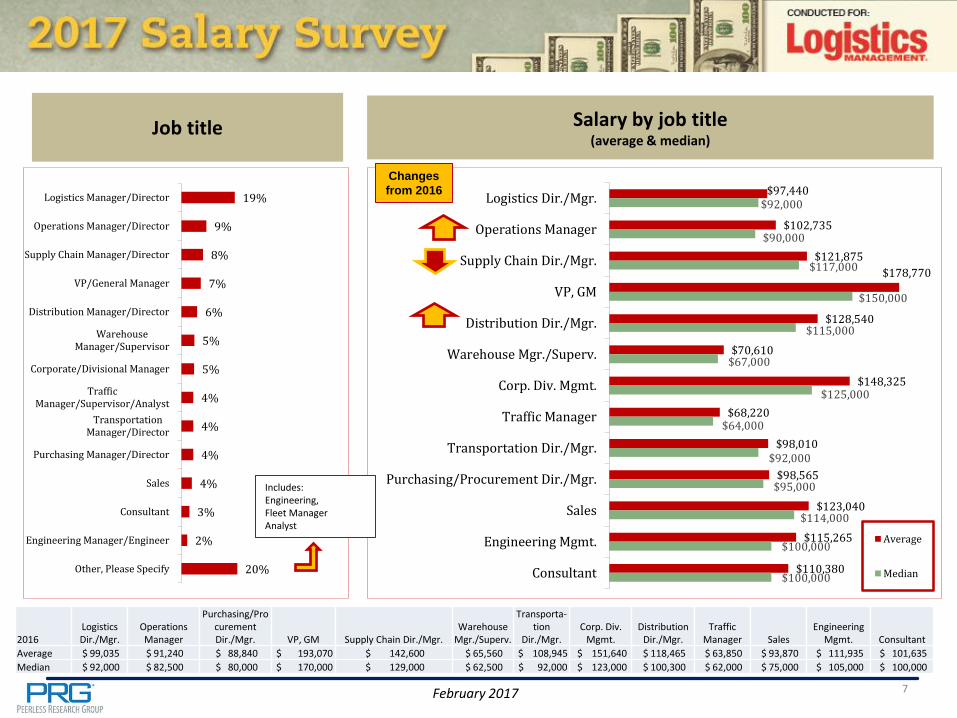
Job title
19%
9%
8%
7%
6%
5%
5%
4%
4%
4%
4%
3%
2%
20%
Logistics Manager/Director
Operations Manager/Director
Supply Chain Manager/Director
VP/General Manager
Distribution Manager/Director
WarehouseManager/Supervisor
Corporate/Divisional Manager
TrafficManager/Supervisor/Analyst
TransportationManager/Director
Purchasing Manager/Director
Sales
Consultant
Engineering Manager/Engineer
Other, Please Specify
7
Salary by job title (average & median)
$97,440
$102,735
$121,875
$178,770
$128,540
$70,610
$148,325
$68,220
$98,010
$98,565
$123,040
$115,265
$110,380
$92,000
$90,000
$117,000
$150,000
$115,000
$67,000
$125,000
$64,000
$92,000
$95,000
$114,000
$100,000
$100,000
Logistics Dir./Mgr.
Operations Manager
Supply Chain Dir./Mgr.
VP, GM
Distribution Dir./Mgr.
Warehouse Mgr./Superv.
Corp. Div. Mgmt.
Traffic Manager
Transportation Dir./Mgr.
Purchasing/Procurement Dir./Mgr.
Sales
Engineering Mgmt.
Consultant
Average
Median
Includes: Engineering, Fleet Manager Analyst
2016 Logistics Dir./Mgr.
Operations Manager
Purchasing/Procurement Dir./Mgr. VP, GM Supply Chain Dir./Mgr.
WarehouseMgr./Superv.
Transporta-tion
Dir./Mgr. Corp. Div.
Mgmt. Distribution
Dir./Mgr. Traffic
Manager Sales Engineering
Mgmt. Consultant
Average $ 99,035 $ 91,240 $ 88,840 $ 193,070 $ 142,600 $ 65,560 $ 108,945 $ 151,640 $ 118,465 $ 63,850 $ 93,870 $ 111,935 $ 101,635
Median $ 92,000 $ 82,500 $ 80,000 $ 170,000 $ 129,000 $ 62,500 $ 92,000 $ 123,000 $ 100,300 $ 62,000 $ 75,000 $ 105,000 $ 100,000
Changes
from 2016
February 2017
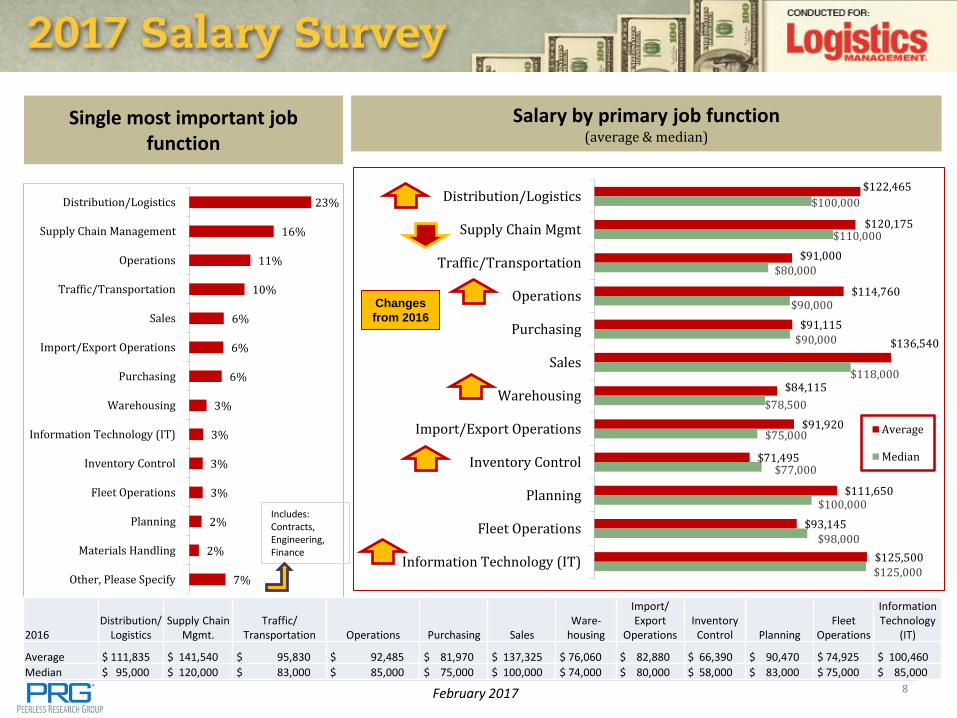
Single most important job function
23%
16%
11%
10%
6%
6%
6%
3%
3%
3%
3%
2%
2%
7%
Distribution/Logistics
Supply Chain Management
Operations
Traffic/Transportation
Sales
Import/Export Operations
Purchasing
Warehousing
Information Technology (IT)
Inventory Control
Fleet Operations
Planning
Materials Handling
Other, Please Specify
8
Salary by primary job function (average & median)
$122,465
$120,175
$91,000
$114,760
$91,115
$136,540
$84,115
$91,920
$71,495
$111,650
$93,145
$125,500
$100,000
$110,000
$80,000
$90,000
$90,000
$118,000
$78,500
$75,000
$77,000
$100,000
$98,000
$125,000
Distribution/Logistics
Supply Chain Mgmt
Traffic/Transportation
Operations
Purchasing
Sales
Warehousing
Import/Export Operations
Inventory Control
Planning
Fleet Operations
Information Technology (IT)
Average
Median
Includes: Contracts, Engineering, Finance
2016 Distribution/
Logistics Supply Chain
Mgmt. Traffic/
Transportation Operations Purchasing Sales Ware-
housing
Import/ Export
Operations Inventory Control Planning
Fleet Operations
Information Technology
(IT)
Average $ 111,835 $ 141,540 $ 95,830 $ 92,485 $ 81,970 $ 137,325 $ 76,060 $ 82,880 $ 66,390 $ 90,470 $ 74,925 $ 100,460
Median $ 95,000 $ 120,000 $ 83,000 $ 85,000 $ 75,000 $ 100,000 $ 74,000 $ 80,000 $ 58,000 $ 83,000 $ 75,000 $ 85,000
Changes
from 2016

February 2017
How many people report directly to you?
9
How many people does your company employ?
50%
27%
10%
13%
< 5 5 - 10 11 - 20 More than 20
22%
28%
9%
15%
27%
Less than 100 100 - 499 500 - 999 1,000 - 4,999 5,000 or more

February 2017
Has the number of functions you perform in your job increased, decreased or stayed the same over the last 2 to 3 years?
Increased 77%
Decreased 4%
Stayed the same/No change
19%
10
February 2017
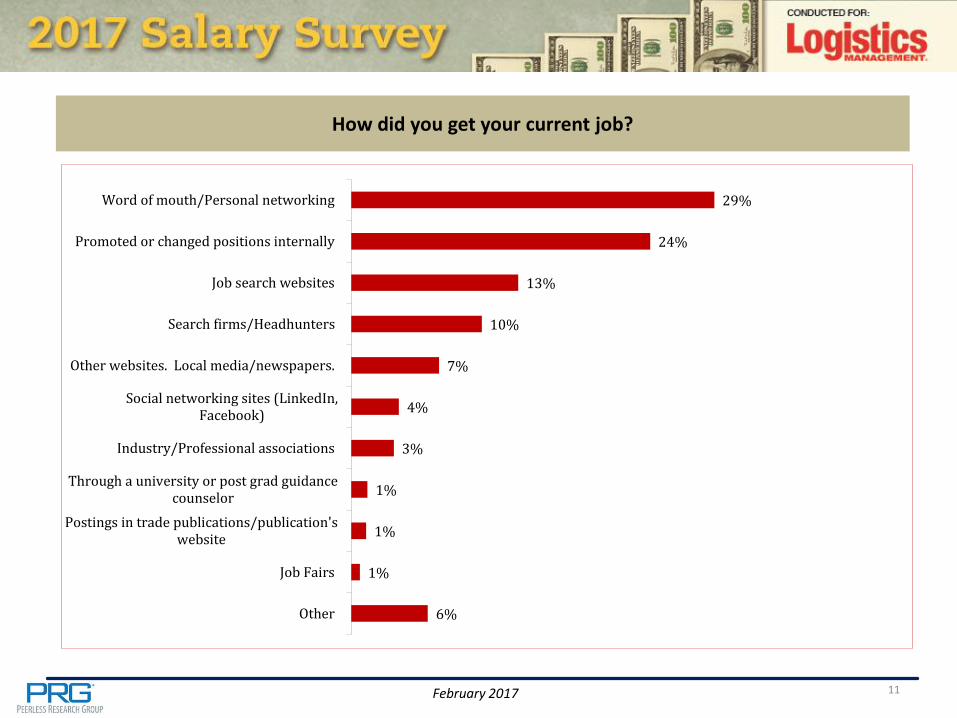
How did you get your current job?
29%
24%
13%
10%
7%
4%
3%
1%
1%
1%
6%
Word of mouth/Personal networking
Promoted or changed positions internally
Job search websites
Search firms/Headhunters
Other websites. Local media/newspapers.
Social networking sites (LinkedIn,Facebook)
Industry/Professional associations
Through a university or post grad guidancecounselor
Postings in trade publications/publication'swebsite
Job Fairs
Other
11

February 2017
Years in present position
12%
23%
26%
15%
24%
< 1 year
1 - 2 years
3 - 5 years
6 - 10 years
More than 10years
12
Salary by years in present position (average & median)
$102,730 $101,485
$109,600 $107,800
$128,600
$91,000
$85,000
$97,500
$90,000
$119,000
$-
$20,000
$40,000
$60,000
$80,000
$100,000
$120,000
$140,000
< 1 year 1 - 2 years 3 - 5 years 6 - 10 years More than 10years
Average
Median
2016 < 1 year 1 - 2 years 3 - 5 years 6 - 10 years More than 10 years
Average $ 102,835 $ 107,840 $ 104,935 $ 105,860 $ 105,690
Median $ 85,000 $ 88,000 $ 87,500 $ 97,000 $ 84,000
Changes
from 2016

February 2017
Years with present employer
8%
13%
20%
17%
42%
< 1 year
1 - 2 years
3 -5 years
6 - 10 years
More than 10years
13
Salary by # of years with present employer (average & median)
$119,965
$94,830
$101,160 $102,315
$120,450
$93,500
$85,000 $83,000
$90,000
$100,000
$-
$20,000
$40,000
$60,000
$80,000
$100,000
$120,000
$140,000
< 1 year 1 - 2 years 3 -5 years 6 - 10 years More than 10years
Average
Median
2016 < 1 year 1 - 2 years 3 -5 years 6 - 10 years More than 10 years
Average $ 93,270 $ 102,425 $ 93,320 $ 109,240 $ 111,810
Median $ 82,000 $ 80,000 $ 82,000 $ 90,000 $ 95,000
Changes
from 2016
February 2017
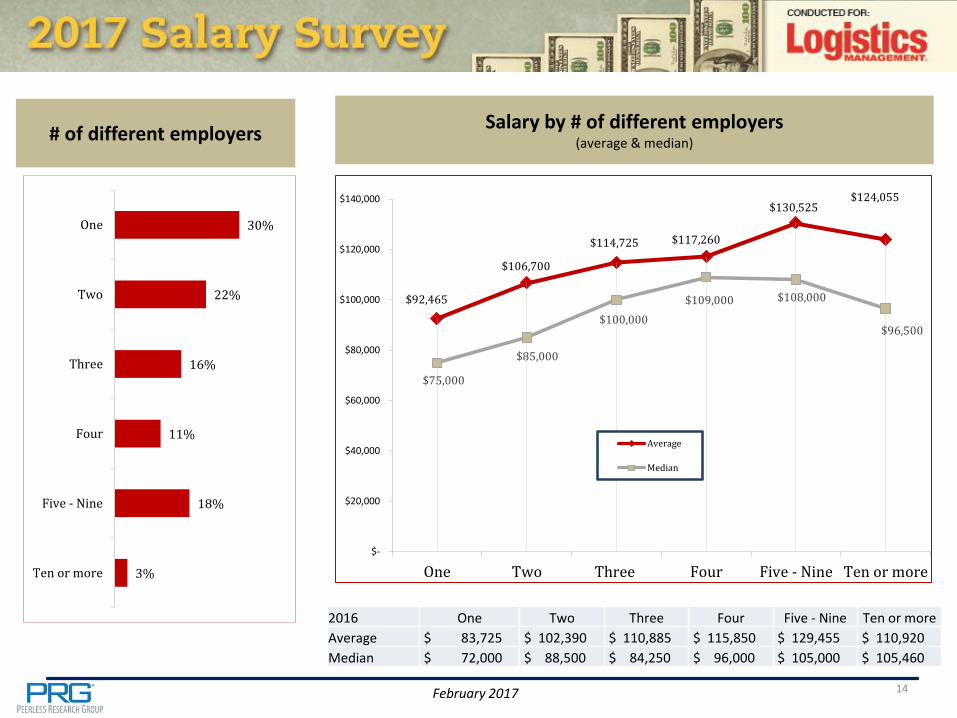
# of different employers
30%
22%
16%
11%
18%
3%
One
Two
Three
Four
Five - Nine
Ten or more
14
Salary by # of different employers (average & median)
$92,465
$106,700
$114,725 $117,260
$130,525 $124,055
$75,000
$85,000
$100,000
$109,000 $108,000
$96,500
$-
$20,000
$40,000
$60,000
$80,000
$100,000
$120,000
$140,000
One Two Three Four Five - Nine Ten or more
Average
Median
2016 One Two Three Four Five - Nine Ten or more
Average $ 83,725 $ 102,390 $ 110,885 $ 115,850 $ 129,455 $ 110,920
Median $ 72,000 $ 88,500 $ 84,250 $ 96,000 $ 105,000 $ 105,460

February 2017
Years of logistics/supply chain management experience
8%
8%
11%
14%
16%
13%
14%
16%
3 years or less
4 - 6 years
7 - 10 years
11 - 15 years
16 - 20 years
21 - 25 years
26 - 30 years
More than 30years
15
Salary by years of logistics/supply chain management experience (average & median)
$66,030
$76,650 $81,300
$96,750
$113,875
$125,685 $122,500
$150,000
$56,300
$73,000 $72,000
$80,000
$97,500
$109,000 $110,000
$124,000
$0.00
$20,000.00
$40,000.00
$60,000.00
$80,000.00
$100,000.00
$120,000.00
$140,000.00
$160,000.00
3 years orless
4 - 6 yrs. 7 - 10 yrs. 11 - 15 yrs. 16 - 20 yrs. 21 - 25 yrs. 26 - 30 yrs. More than30 yrs.
Average
Median
2016 3 years or
less 4 - 6 yrs. 7 - 10 yrs. 11 - 15 yrs. 16 - 20 yrs. 21 - 25 yrs. 26 - 30 yrs. More than 30
yrs.
Average $ 57,375 $ 77,320 $ 77,345 $ 115,950 $ 103,485 $ 113,630 $ 120,505 $ 131,875
Median $ 52,000 $ 72,400 $ 66,000 $ 87,500 $ 86,000 $ 99,000 $ 104,000 $ 110,000
Changes
from 2016
February 2017
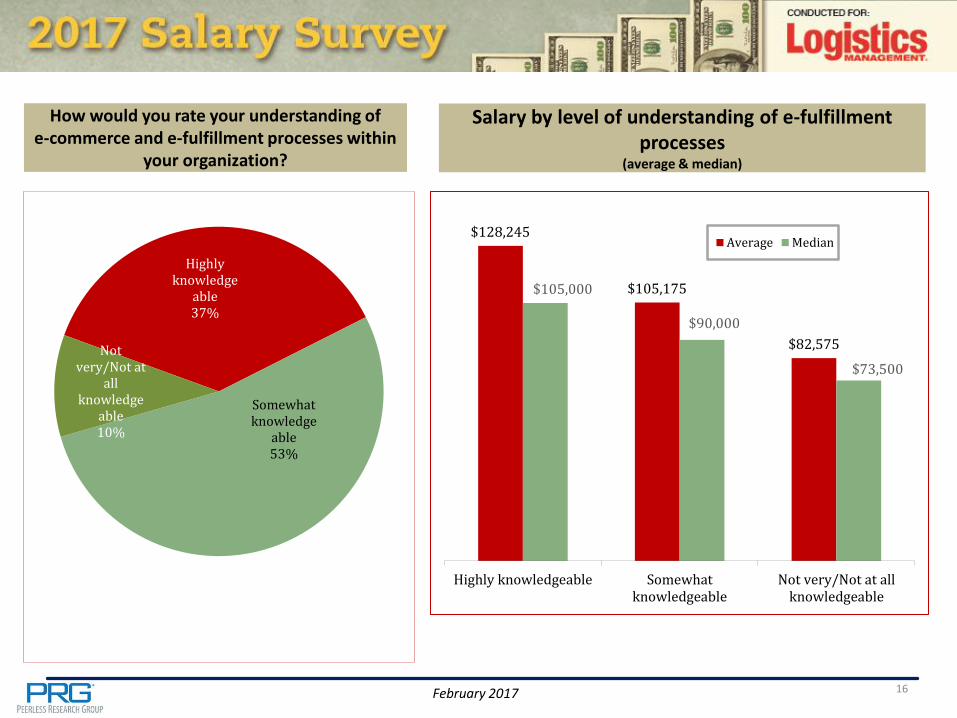
How would you rate your understanding of e-commerce and e-fulfillment processes within
your organization?
Highly knowledge
able 37%
Somewhat knowledge
able 53%
Not very/Not at
all knowledge
able 10%
16
Salary by level of understanding of e-fulfillment processes
(average & median)
$128,245
$105,175
$82,575
$105,000
$90,000
$73,500
Highly knowledgeable Somewhatknowledgeable
Not very/Not at allknowledgeable
Average Median

February 2017
Job pursuit
Actively looking
10%
Passively looking
20%
Always looking for
better opportunities
43%
Happy where I am
27%
17
Salary by job pursuit (average & median)
$95,065
$107,510 $105,450
$121,185
$80,000
$90,000
$95,000 $95,000
$-
$20,000
$40,000
$60,000
$80,000
$100,000
$120,000
$140,000
Actively looking Passively looking Always looking forbetter opportunities
Happy where I am
Average
Median
2016 Actively looking Passively looking
Always looking for better opportunities
Happy where I am
Average $ 96,870 $ 102,865 $ 101,500 $ 114,785
Median $ 78,000 $ 85,000 $ 85,000 $ 95,000
Changes
from 2016
February 2017
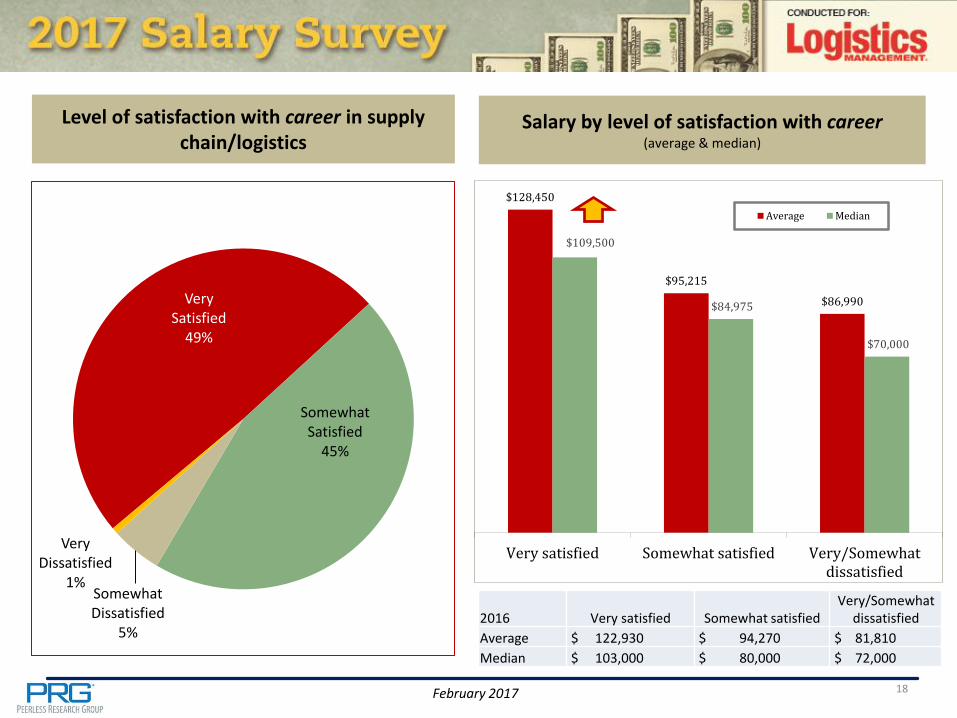
Level of satisfaction with career in supply chain/logistics
18
Salary by level of satisfaction with career (average & median)
$128,450
$95,215
$86,990
$109,500
$84,975
$70,000
Very satisfied Somewhat satisfied Very/Somewhatdissatisfied
Average Median
2016 Very satisfied Somewhat satisfied Very/Somewhat
dissatisfied
Average $ 122,930 $ 94,270 $ 81,810
Median $ 103,000 $ 80,000 $ 72,000
Very Satisfied
49%
Somewhat Satisfied
45%
Somewhat Dissatisfied
5%
Very Dissatisfied
1%

February 2017
Which factors would you say most greatly affect your satisfaction with your current job?
55%
52%
47%
45%
39%
38%
38%
38%
37%
35%
35%
31%
25%
25%
23%
23%
17%
Feeling of accomplishment
Relationship with colleagues
Salary
Relationship with boss
Job security
Benefits
Leading a team
Location
Relationship with subordinates
Company's financial health
Feeling of recognition
Managing people
Advancement opportunities
Company size
Technical challenge
Workload
Travel
19
February 2017
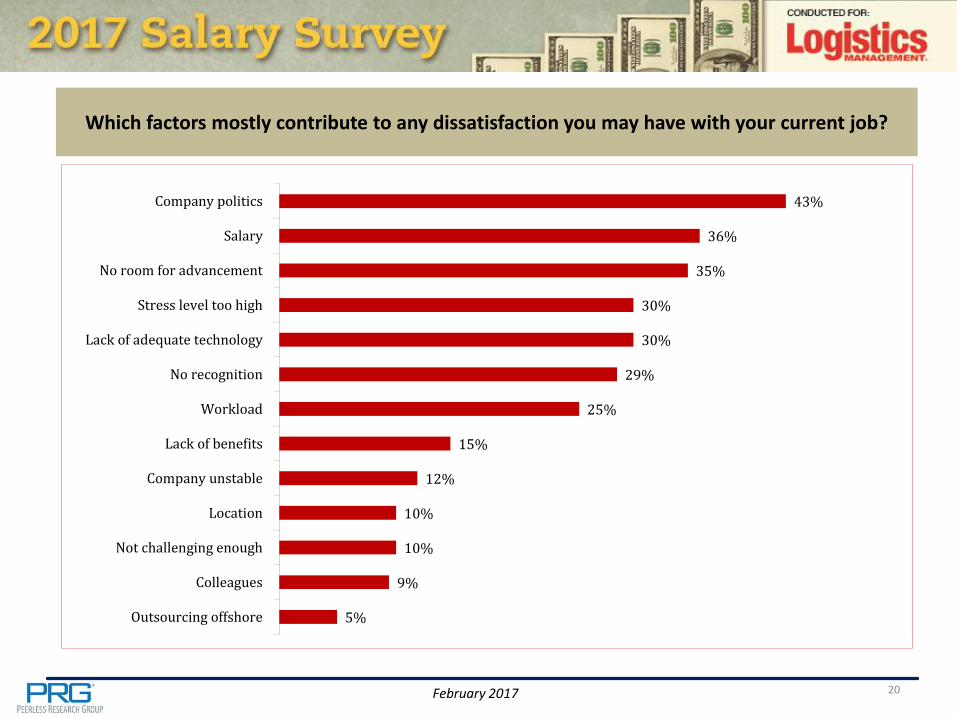
Which factors mostly contribute to any dissatisfaction you may have with your current job?
43%
36%
35%
30%
30%
29%
25%
15%
12%
10%
10%
9%
5%
Company politics
Salary
No room for advancement
Stress level too high
Lack of adequate technology
No recognition
Workload
Lack of benefits
Company unstable
Location
Not challenging enough
Colleagues
Outsourcing offshore
20
February 2017
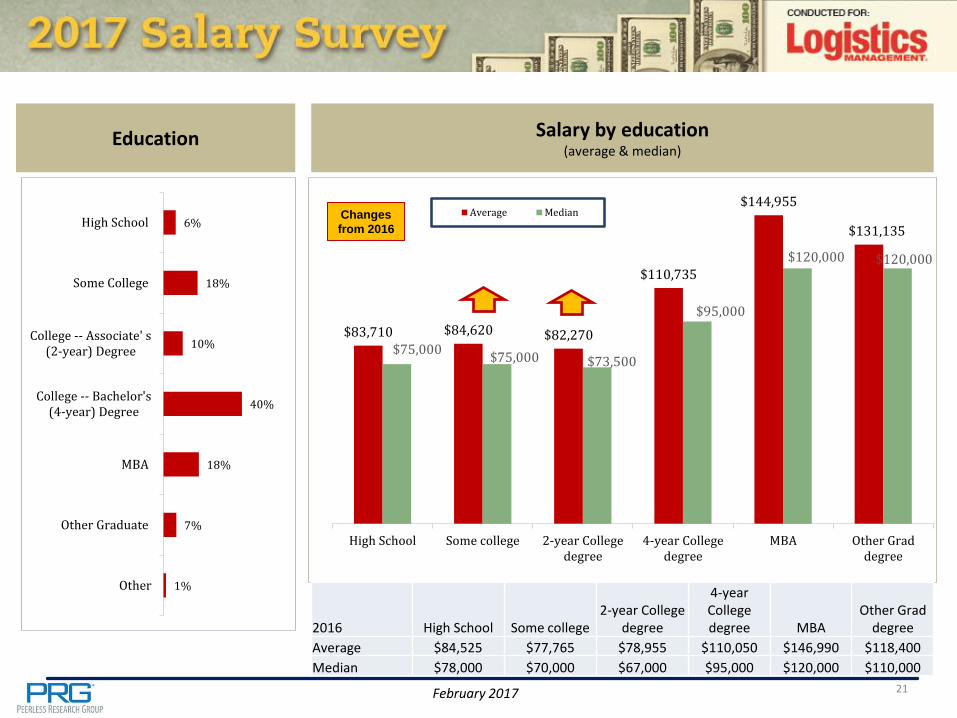
Education
6%
18%
10%
40%
18%
7%
1%
High School
Some College
College -- Associate' s(2-year) Degree
College -- Bachelor's(4-year) Degree
MBA
Other Graduate
Other
21
Salary by education (average & median)
$83,710 $84,620 $82,270
$110,735
$144,955
$131,135
$75,000 $75,000 $73,500
$95,000
$120,000 $120,000
High School Some college 2-year Collegedegree
4-year Collegedegree
MBA Other Graddegree
Average Median
2016 High School Some college 2-year College
degree
4-year College degree MBA
Other Grad degree
Average $84,525 $77,765 $78,955 $110,050 $146,990 $118,400
Median $78,000 $70,000 $67,000 $95,000 $120,000 $110,000
Changes
from 2016
February 2017 22
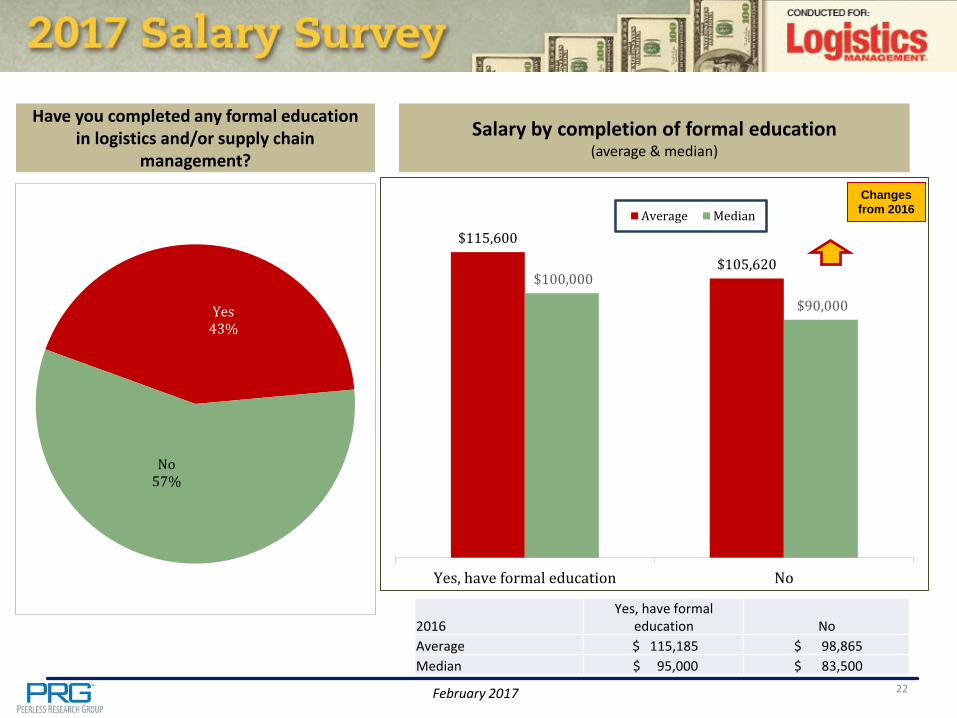
Salary by completion of formal education (average & median)
$115,600
$105,620 $100,000
$90,000
Yes, have formal education No
Average Median
Yes 43%
No 57%
Have you completed any formal education in logistics and/or supply chain
management?
2016 Yes, have formal
education No
Average $ 115,185 $ 98,865
Median $ 95,000 $ 83,500
Changes
from 2016
February 2017
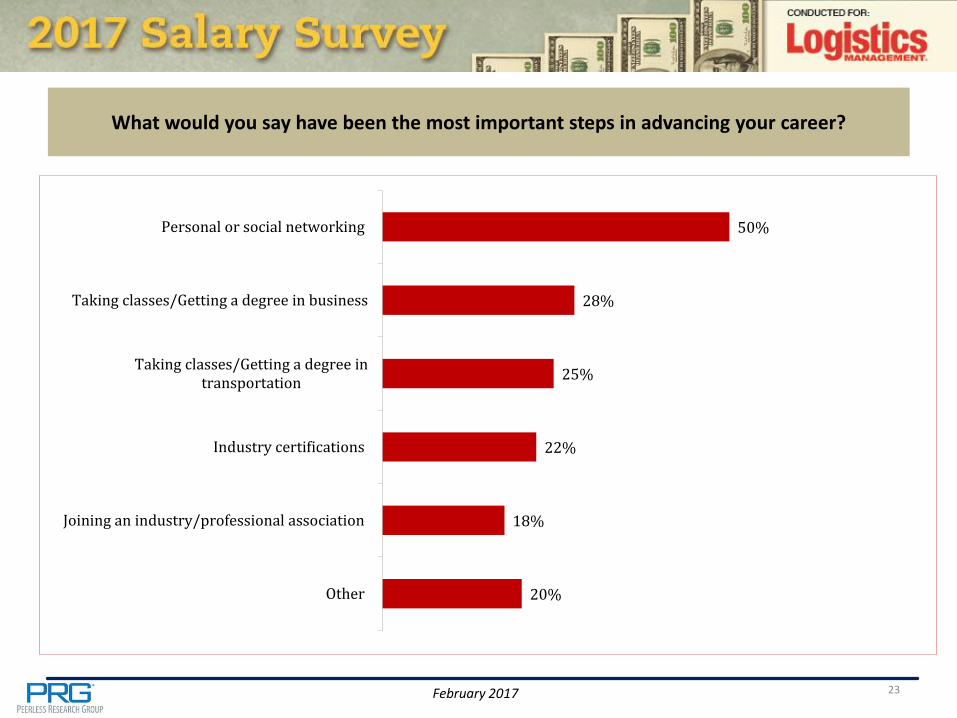
What would you say have been the most important steps in advancing your career?
50%
28%
25%
22%
18%
20%
Personal or social networking
Taking classes/Getting a degree in business
Taking classes/Getting a degree intransportation
Industry certifications
Joining an industry/professional association
Other
23
February 2017
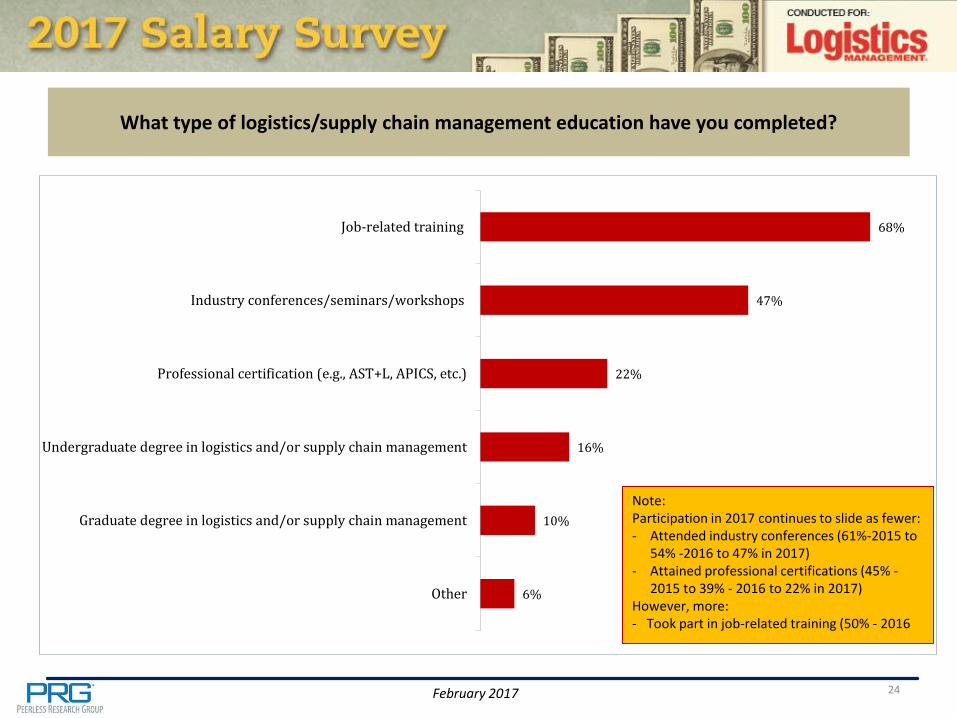
What type of logistics/supply chain management education have you completed?
68%
47%
22%
16%
10%
6%
Job-related training
Industry conferences/seminars/workshops
Professional certification (e.g., AST+L, APICS, etc.)
Undergraduate degree in logistics and/or supply chain management
Graduate degree in logistics and/or supply chain management
Other
Note: Participation in 2017 continues to slide as fewer: - Attended industry conferences (61%-2015 to
54% -2016 to 47% in 2017) - Attained professional certifications (45% -
2015 to 39% - 2016 to 22% in 2017) However, more: - Took part in job-related training (50% - 2016
24
February 2017
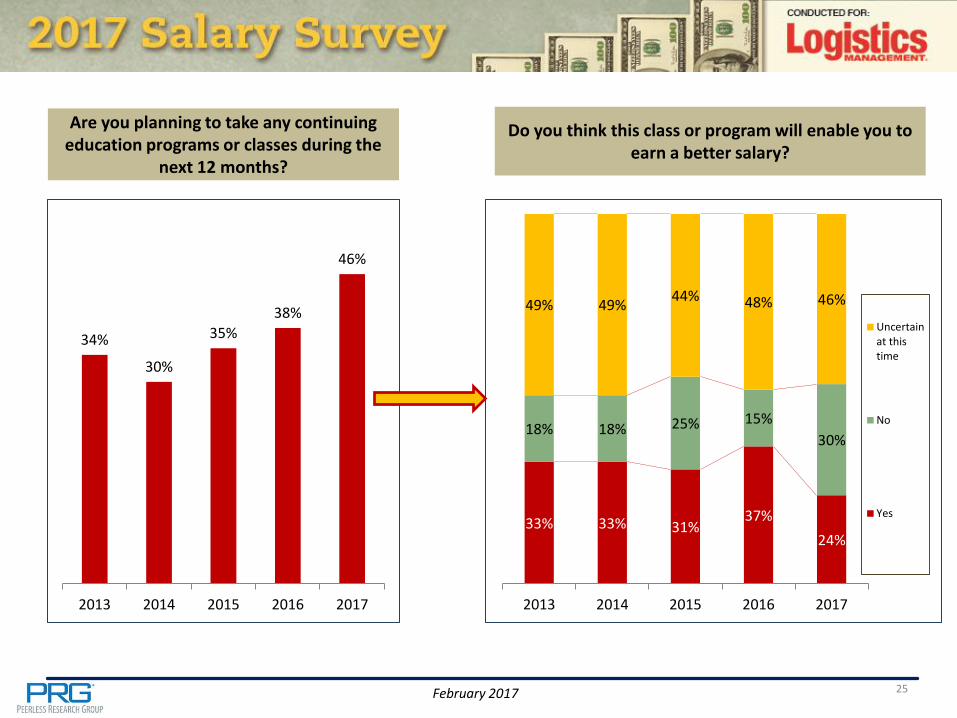
Are you planning to take any continuing education programs or classes during the
next 12 months?
25
Do you think this class or program will enable you to earn a better salary?
34%
30%
35%
38%
46%
2013 2014 2015 2016 2017
33% 33% 31% 37%
24%
18% 18% 25% 15%
30%
49% 49% 44% 48% 46%
2013 2014 2015 2016 2017
Uncertainat thistime
No
Yes

February 2017
What one skill or area of expertise would you like to have that you feel would improve your level of pay or job position?
26
Having salary of: Less than $50,000
Having salary of: $50,000 - $74,999
Having salary of: $75,000 - $99,999
Certifications
College Degree
International freight (Export and Import)
Lean/Six sigma training
Management/Leadership skills
Project management
Warehouse/Distribution management
Analytical skills
APICS/CPIM Certification
Better understanding of technology n(TMS, WMS, etc.)
Bi-lingual
Computer Programing
ERP SKILL SET
International Shipping and Distribution Law
Lean/Six sigma
Management skills
MBA
Project Management
Social skills
Supply Chain Management
Accounting
APICS Certification
Better analytical skills
Compliance/Customs Broker's license
Data Analytics
E-Commerce
Finance/Accounting
International Logistics
Leadership training
MBA
Negotiation skills
Presentations & Public Speaking
Project Management
Sales Skills
Six Sigma Certification
Supply Chain Optimization
Technology

February 2017
What one skill or area of expertise would you like to have that you feel would improve your level of pay or job position?
27
Having salary of: $100,000 - $169,999
Having salary of: $170,000 +
Automation/ Advanced distribution methods such as Pick to Voice
Computer skills
Critical Thinking
Customs Brokers License
Data analytics
Database management skills
Degree
e-commerce expertise
Finance
International Shipping
Leadership
Lean certification
MBA
Negotiation skills
People skills
Production/Contract Manufacturing
Project Management
Purchasing
Strategic Management
Supply Chain Management
Technology
Analytical skills/Big Data
Communication skills
Finance
International fulfillment
MBA
Political skills
Sales
Technology
February 2017
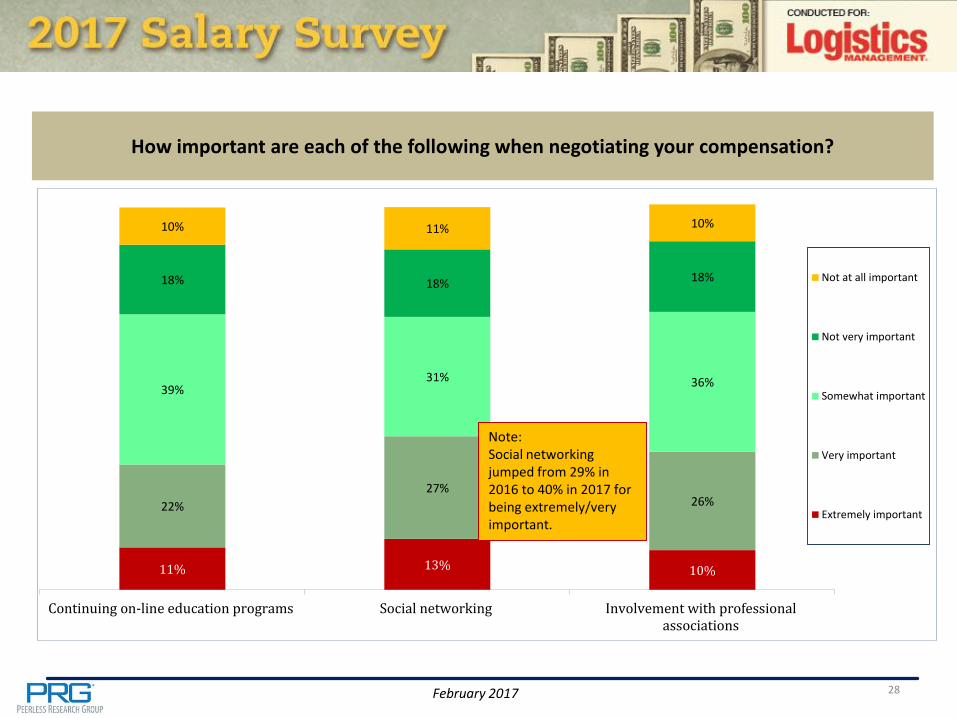
How important are each of the following when negotiating your compensation?
11% 13% 10%
22%
27% 26%
39% 31% 36%
18% 18% 18%
10% 11% 10%
Continuing on-line education programs Social networking Involvement with professionalassociations
Not at all important
Not very important
Somewhat important
Very important
Extremely important
28
Note: Social networking jumped from 29% in 2016 to 40% in 2017 for being extremely/very important.
February 2017
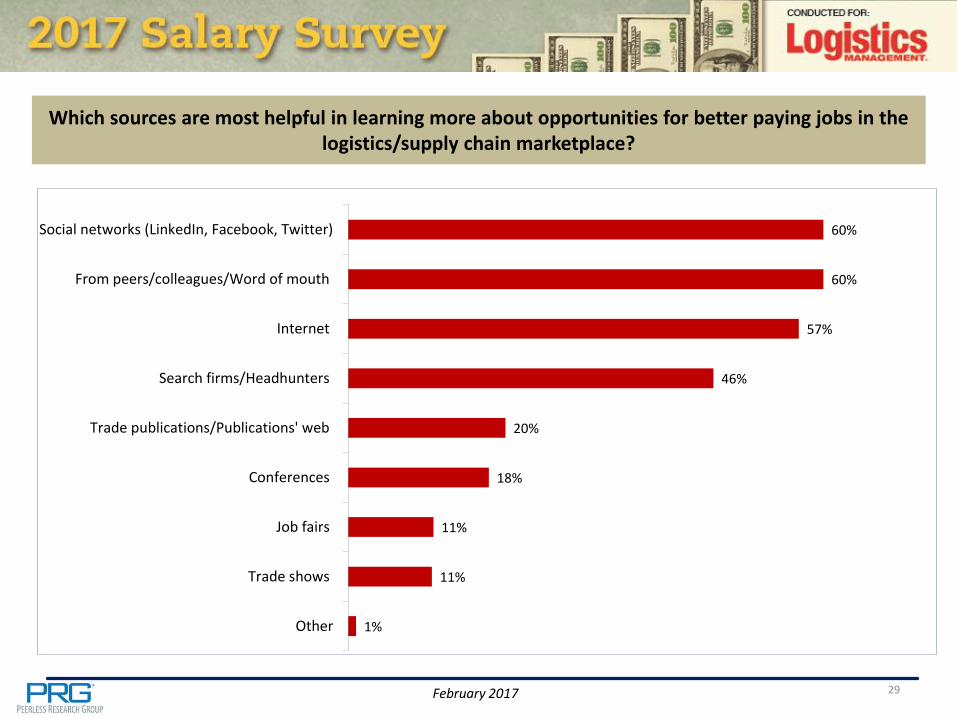
Which sources are most helpful in learning more about opportunities for better paying jobs in the logistics/supply chain marketplace?
60%
60%
57%
46%
20%
18%
11%
11%
1%
Social networks (LinkedIn, Facebook, Twitter)
From peers/colleagues/Word of mouth
Internet
Search firms/Headhunters
Trade publications/Publications' web
Conferences
Job fairs
Trade shows
Other
29
February 2017
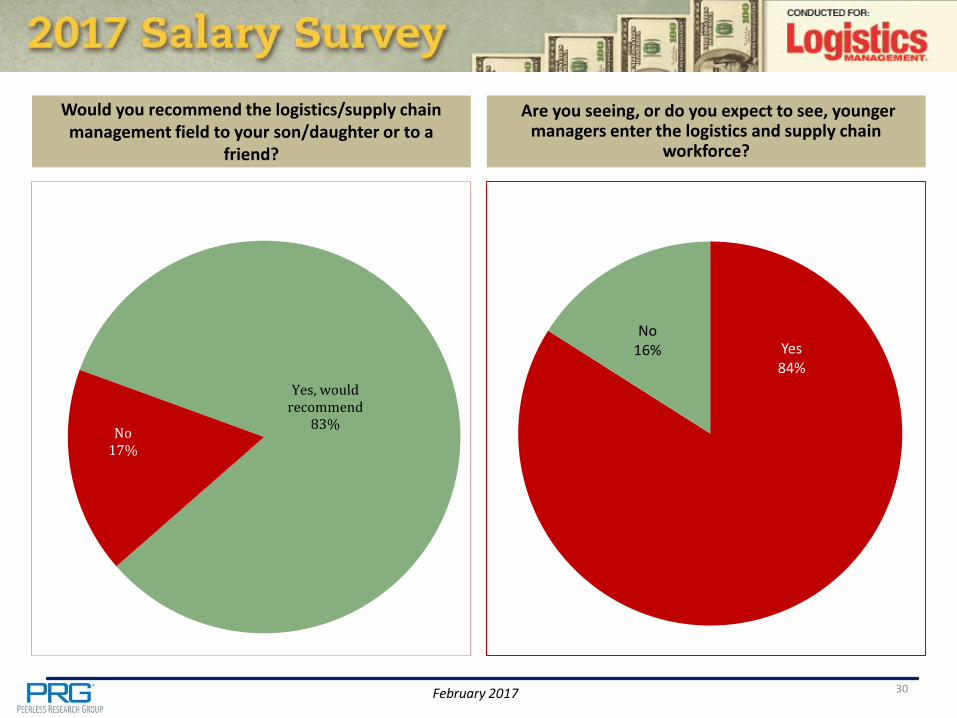
Would you recommend the logistics/supply chain management field to your son/daughter or to a
friend?
Yes, would recommend
83% No
17%
Yes 84%
No 16%
30
Are you seeing, or do you expect to see, younger managers enter the logistics and supply chain
workforce?
February 2017
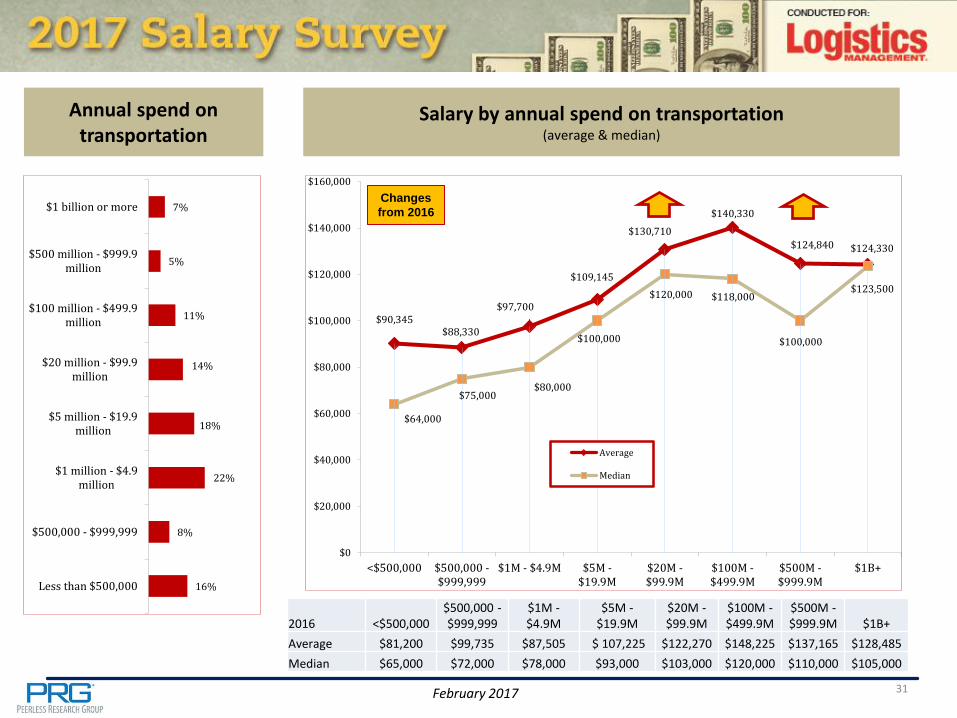
Annual spend on transportation
16%
8%
22%
18%
14%
11%
5%
7%
Less than $500,000
$500,000 - $999,999
$1 million - $4.9million
$5 million - $19.9million
$20 million - $99.9million
$100 million - $499.9million
$500 million - $999.9million
$1 billion or more
31
Salary by annual spend on transportation (average & median)
$90,345 $88,330
$97,700
$109,145
$130,710
$140,330
$124,840 $124,330
$64,000
$75,000 $80,000
$100,000
$120,000 $118,000
$100,000
$123,500
$0
$20,000
$40,000
$60,000
$80,000
$100,000
$120,000
$140,000
$160,000
<$500,000 $500,000 -$999,999
$1M - $4.9M $5M -$19.9M
$20M -$99.9M
$100M -$499.9M
$500M -$999.9M
$1B+
Average
Median
2016 <$500,000 $500,000 - $999,999
$1M - $4.9M
$5M - $19.9M
$20M - $99.9M
$100M - $499.9M
$500M - $999.9M $1B+
Average $81,200 $99,735 $87,505 $ 107,225 $122,270 $148,225 $137,165 $128,485
Median $65,000 $72,000 $78,000 $93,000 $103,000 $120,000 $110,000 $105,000
Changes
from 2016

February 2017 32
Salary by type of business (average & median)
$129,535
$104,800 $106,000
$85,000
Public Privately owned
Average Median
Public 33%
Privately owned
65%
Other 2%
Is your company public or a privately owned company?
2016 Public Privately owned
Average $ 124,640 $ 96,155
Median $ 102,000 $ 80,220
Changes
from 2016
February 2017
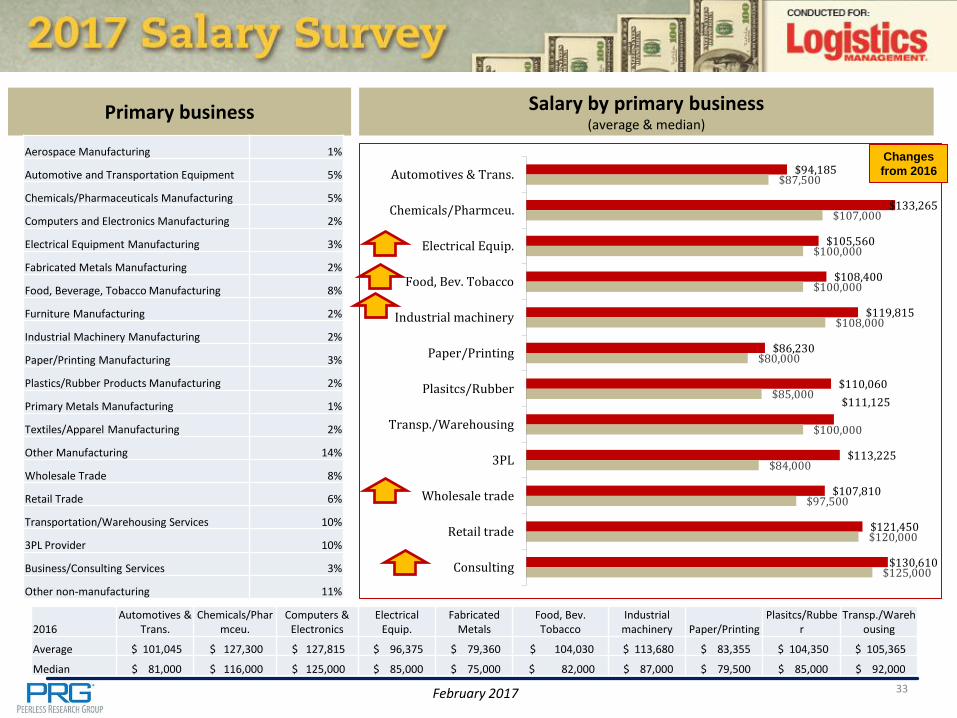
Primary business
33
Salary by primary business (average & median)
$94,185
$133,265
$105,560
$108,400
$119,815
$86,230
$110,060
$111,125
$113,225
$107,810
$121,450
$130,610
$87,500
$107,000
$100,000
$100,000
$108,000
$80,000
$85,000
$100,000
$84,000
$97,500
$120,000
$125,000
Automotives & Trans.
Chemicals/Pharmceu.
Electrical Equip.
Food, Bev. Tobacco
Industrial machinery
Paper/Printing
Plasitcs/Rubber
Transp./Warehousing
3PL
Wholesale trade
Retail trade
Consulting
2016 Automotives &
Trans. Chemicals/Phar
mceu. Computers &
Electronics Electrical
Equip. Fabricated
Metals Food, Bev. Tobacco
Industrial machinery Paper/Printing
Plasitcs/Rubber
Transp./Warehousing
Average $ 101,045 $ 127,300 $ 127,815 $ 96,375 $ 79,360 $ 104,030 $ 113,680 $ 83,355 $ 104,350 $ 105,365
Median $ 81,000 $ 116,000 $ 125,000 $ 85,000 $ 75,000 $ 82,000 $ 87,000 $ 79,500 $ 85,000 $ 92,000
Aerospace Manufacturing 1%
Automotive and Transportation Equipment 5%
Chemicals/Pharmaceuticals Manufacturing 5%
Computers and Electronics Manufacturing 2%
Electrical Equipment Manufacturing 3%
Fabricated Metals Manufacturing 2%
Food, Beverage, Tobacco Manufacturing 8%
Furniture Manufacturing 2%
Industrial Machinery Manufacturing 2%
Paper/Printing Manufacturing 3%
Plastics/Rubber Products Manufacturing 2%
Primary Metals Manufacturing 1%
Textiles/Apparel Manufacturing 2%
Other Manufacturing 14%
Wholesale Trade 8%
Retail Trade 6%
Transportation/Warehousing Services 10%
3PL Provider 10%
Business/Consulting Services 3%
Other non-manufacturing 11%
Changes
from 2016

February 2017
Estimated 2017 company revenues
24%
14%
12%
9%
10%
10%
21%
Less than $50M
$50M - $99.9M
$100M -$249.9M
$250M -$499.9M
$500M -$999.9M
$1B- $2.49B
$2.5B billion ormore
34
Salary by company revenues (average)
$91,525 $90,220
$104,335 $110,875
$100,830
$122,400
$145,560
$72,000 $80,000
$90,000 $95,500
$90,725
$98,500
$125,000
$-
$20,000
$40,000
$60,000
$80,000
$100,000
$120,000
$140,000
<$50M $50M -$99.9M
$100M -$249.9M
$250M -$499.9M
$500M -$999.9M
$1B - $2.49B $2.5B+
Average
Median
2016 <$50M $50M - $99.9M $100M - $249.9M
$250M - $499.9M
$500M - $999.9M $1B - $2.49B $2.5B+
Average $ 78,505 $ 90,245 $106,950 $ 99,840 $ 114,465 $ 127,310 $ 136,370
Median $ 65,000 $ 82,000 $ 88,000 $ 85,000 $ 97,000 $ 117,000 $ 111,000
Changes
from 2016

February 2017
Region
5%
14%
12%
35%
9%
3%
13%
5%
3%
New England (ME,NH, VT, MA, RI, CT)
Mid-Atlantic (NY, PA,NJ, DE, MD, WV, VA
Southeast (NC, SC, GA,FL)
Midwest (MI, OH, KY,TN, IN, WI, IL, MN,
South (AL, MS, AR,LA, OK, TX)
Mountain States (MT,ID, UT, WY, CO, NM)
West (CA, WA, OR,NV, AZ, AK, HI)
Canada
Other (Please specify)
35
Salary by region (average & median)
New England
Average $132,070
Median $110,000
ME, NH, VT, MA, RI, CT
Mountain
Average $79,385
Median $80,000
MT, ID, UT, WY, CO, NM
South
Average $113,350
Median $106,000
AL, MS, AR, LA, OK, TX
Midwest
Average $105,040
Median $90,000
MI, OH, KY, TN, IN, WI, IL, MN, IA, MO, ND, SD, NE, KS
Mid-Atlantic
Average $110,110
Median $91,000
NY, PA, NJ, DE, MD, WV, VA, DC
Southeast
Average $107,900
Median $90,000
NC, SC, GA, FL
West
Average $121,590
Median $100,000
CA, WA, OR, NV, AZ, AK, HI
2016 Average Median
New England $122,440 $92,000
Mid-Atlantic $115,110 $94,500
Southeast $109,310 $88,000
South $105,250 $97,000
Midwest $94,380 $81,000
Mountain $77,750 $72,000
West $113,700 $95,000
Canada
Average $89,330
Median $79,000


