
JANUARY TO MARCHmb.cision.com/Main/1145/2500457/825575.pdf · EPRA ESP, SEK/share 2.10 1.91 8.15...
28
JANUARY TO MARCH INTERIM REPORT 2018
Transcript of JANUARY TO MARCHmb.cision.com/Main/1145/2500457/825575.pdf · EPRA ESP, SEK/share 2.10 1.91 8.15...

JANUARY TO MARCHINTERIM REPORT 2018

2Q1 2018 ATRIUM LJUNGBERG
› Net sales increased to SEK 656 million (591) of which rental income increased to SEK 601 million (567). Rental income in the like-for-like portfolio increased by 3.9 per cent.
› The letting rate was 94 per cent (94), including project properties.
› The operating surplus from property management increased to SEK 409 million (384), an increase of 6.4 per cent. The increase are due primarily to new rentals, renegotiations, lower property costs and the effect of acquired properties. The operating surplus margin is unchanged at 68 per cent (68).
› The profit before changes in value increased to SEK 309 million (274).
› Unrealised changes in the value of investment properties totalled SEK 499 million (444) and are mainly explained by lower yield requirements and higher rental levels. Unrealised changes in the value of derivatives amount-ed to SEK –2 million (35).
› The profit for the period increased to SEK 618 million (622), corresponding to SEK 4.64/share (4.67).
› Investments in held properties increased to SEK 364 million (351).
› Property acquisitions amounted to SEK 0 million (1,846).
› The forecast for 2018 amounts to SEK 1,200 million for profit before changes in value. The profit after tax is considered to amount to SEK 1,315 million, corresponding to SEK 9.87/share.
INTERIM REPORT 1 JANUARY – 31 MARCH 2018
Key ratios 1)2018
jan–mar2017
jan–mar2017
jan–dec
Net sales, SEK m 656 591 2,563
Profit/loss before changes in value, SEK m 309 274 1,180
Net profit/loss for the period, SEK m 618 622 2,559
Investments in investment properties, SEK m 364 351 1,593
Acquisition of properties, SEK m – 1,846 2,265
Cash flow from operating activities, SEK m 316 272 1,166
Letting rate, % 94 94 95
Operating surplus margin, % 68 68 69
Equity/assets ratio, % 44.0 42.4 42.6
Gearing ratio, % 41.9 43.7 44.7
Adjusted gearing ratio, % 42.3 43.7 44.1
Interest coverage ratio, multiple 5.0 3.9 4.2
Average interest rate for interest-bearing liabilities, %
1.7 2.2 1.7
Earnings per share, SEK 4.64 4.67 19.21
EPRA ESP, SEK/share2.10 1.91
8.15
Cash flow, SEK/share 2.37 2.04 8.75
Share price at period end, SEK/share 123.00 136.40 130.30
EPRA NNNAV, SEK/share168.22
149.69
162.57
Shareholders’ equity, SEK/share 141.45 126.11 136.79
1) For definitions, see pages 25–26
Contracted annual rent per premises type
Contracted annual rent per region
Offices 47 %,SEK 1,109 mRetail 27 %, SEK 637 m
Residentials 3 %, SEK 81 mHealth/care 4 %, SEK 92 mRestaurant 4 %, SEK 98 mCulture/education 4 %, SEK 104 m
Other 2 %, SEK 39 m
FMCG 9 %, SEK 205 m
Stockholm 74 %, SEK 1,737 m
Malmö 9 %, SEK 214 mGothenburg 6 %, SEK 147 m
Uppsala 11 %, SEK 268 m
SIGNIFICANT EVENTS DURING THE FIRST QUARTER
› A lease agreement was signed with the co-working operator Convendum relating to just over 5,100 m2 in Glashuset on Södermalm. The agreement has a term of ten years with expected occupancy in spring 2019.
› Atrium Ljungberg was ranked as one of Sweden's best workplaces for the fifth year in a row. The company exceeded the target of achieving a confidence index of 85 per cent in the employee survey. All in all, 95 per cent of our employees think that Atrium Ljungberg is a very good workplace.
› A resolution to introduce a stock option programme for the personnel was adopted at the Annual General Meeting in March. The programme includes a maximum of 186,000 call options.
› In January, the Atrium Ljungberg head offices were moved to new premises in the old Luftverkstaden in Sickla. A full activity-based working method was implemented at the same time.
This annual report has been prepared in Swedish and translated into English. In the event of any discrepancies between the Swedish and the translation, the former shall have precedence.

3Q1 2018 ATRIUM LJUNGBERG
CEO’S STATEMENTCEO’S STATEMENT
that we are working hard on these issues throughout the company.
INVESTMENTS We currently have ten ongoing construction projects with a remaining investment of SEK 2.3 billion. During the quarter, we invested SEK 364 million in our own properties, which is in line with our forecast of an investment of SEK 1.5 billion for the full year.
In 2018, we expect to begin construction of both Bas Barkarby in Järfälla and Life City in Hagastaden, Stockholm. It is considered that construction can begin on our Bas Barkarby project in November at the earliest, when the decision by the Land and Environmental Court is expected.
Our Life City project in Hagastaden is ex-pected to start after the summer, but depends on approval by the Swedish Transport Admin-istration of a tunnel construction that is cru-cial for the building. During the quarter, an in-tention agreement was signed with the co-working operator United Spaces relating to the rental of just over 3,200 m2 on the first floor of the property. The business makes in-teraction possible between larger tenants in the building and young companies and organi-sations linked to cluster building in the life science area.
FUTURE INTEREST DEDUCTION LIMITIn March, the government submitted a referral to the Council on Legislation involving the in-troduction of a limit on interest deductions whereby the scope for deductions for negative net interest income is limited to 30 per cent of taxable EBITDA. In view of Atrium Ljungberg's current earnings and indebtedness, an aver-age interest rate of 2.4 per cent would be re-quired in order for the Group not to obtain a full
FIRST QUARTER RESULTS AND FORECAST FOR 2018The rental revenues increased by six per cent, with the comparable portfolio accounting for four per cent. This is a robust figure which largely reflects the office market, which re-mains strong. During the first quarter, we in-creased our operating surplus by six per cent to SEK 409 million. Our profit before changes in value increased by 13 per cent to SEK 309 mil-lion, with our lower average interest rates and interest cost making a positive contribution compared to the first quarter of last year. Our forecast is stable for the full year and amounts to SEK 1.2 billion. We have also had our Baa2 rating from Moody’s reaffirmed. An excellent rating.
Overall, it has been a very good start to the year and I am extremely satisfied.
STRATEGIC RENTAL During the first quarter, we signed an impor-tant rental agreement with Convendum relat-ing to just over 5,100 m2 in Glashuset beside Slussen. The agreement is for ten years and occupancy is expected to take place in April 2019. Convedum is a co-working concept in the premium segment and exists in several locations in Stockholm and also in Gothen-burg. I am extremely pleased that Convendum has chosen Glashuset. Their concept is a strong complement to our range of modern office solutions. There is a great deal happen-ing in the area at the moment and we are sure that the growth of the new Slussen will raise up the area even more in future. The estab-lishment of Convendum is confirmation of the attractiveness of the location.
E-COMMERCE AND DIGITALISATIONIt is more important than ever to work on our lo-cations to make them attractive and relevant. Digital development impacts on the way in which people live, work, reside and consume. E-commerce's share of overall commerce is constantly growing. The first few months of the new year show that our four major retail hubs experienced a one per cent decrease in sales overall, whereas rentals in the comparative portfolio increased. The development of e-com-merce requires our tenants and us, the property owner, to make changes.
Atrium Ljungberg has worked for many years to create locations where people want to be. Our locations are constantly changing to meet the requirements imposed by people on urban areas and urban developers, both now and in the future. Urban innovation is our de-velopment work for new thinking on how to build the attractive meeting places of the fu-ture.
Digitalisation and innovation go hand in hand. Digital solutions – and primarily a digital lifestyle – create new needs and solutions. The key to being able to develop our future busi-ness is to really understand the end customer. 2018 is our "innovation year", which means
right of deduction of its interest expenses. The average interest rate at present is 1.7 per cent The proposed legislation also means a reduc-tion in company tax to 21.4 per cent in 2019 and 20.6 per cent in 2021, which would mean a pos-itive effect on profit on deferred tax of approxi-mately SEK 120 million and another SEK 180 million calculated on current recognised liabil-ities. The new rules are expected to enter into force from 1 January 2019.
SWEDEN'S BEST WORKPLACESI am very proud of the fact that Atrium Ljungberg has been ranked by Great Place To Work® as one of Sweden's best workplaces for the fifth year in a row. I am happy that our em-ployees are so contented. I am convinced that it is due to the fact that we have clear expectations of our employees; we give them a great deal of responsibility and a mandate and our values serve as a compass to clearly point the way. Our long-term work is yielding results and employ-ees who are satisfied and comfortable are a prerequisite in order for us to achieve our ambi-tious goals. 95 per cent of the employees think that Atrium Ljungberg is a very good workplace.
The head office moved to the old Luftverk-staden in Sickla in January. The new office is fully activity-based and has been designed to promote activity, creativity and efficiency. We have drawn great inspiration from hotels, which often offer welcoming, restful environ-ments with high service levels. The offices show that we are on the leading edge in the of-fices we offer and they serve as both a show-room and an inspiration for our customers.
Annica Ånäs, CEO
”I am extremely pleased that Convendum has chosen Glashuset. Their concept is a strong complement to our range of modern office solutions. At present, there is a great deal going on in the area and I see the establishment of Convendum as confirmation of the attractiveness of the location.

4Q1 2018 ATRIUM LJUNGBERG
2018 2017 2017 2017/2018Amounts in SEK m 1/1–31/3 1/1–31/3 1/1–31/12 1/4–31/3
Rental income 601 567 2,389 2,423Sales, project and construction work 54 24 174 205 Net sales 656 591 2,563 2,628
Property management costs Service charge-related costs –58 –60 –186 –184 Other operating costs –38 –38 –157 –156 Management costs –35 –30 –153 –158 Repairs –15 –12 –58 –61 Property tax –36 –34 –142 –145 Leasehold fees –7 –7 –35 –35 Non-deductible VAT –3 –3 –11 –12
–192 –183 –742 –751
Project and construction work costs –55 –18 –206 –243
Gross profit/loss 408 390 1,616 1,634
– of which gross profit/loss property management (operating surplus) 409 384 1,647 1,672– of which gross profit/loss from project and construction work –1 6 –31 –38
Central administration, property management –17 –17 –48 –49Central administration, project and construction work –4 –4 –16 –15
–21 –21 –64 –64
Financial income 0 0 1 1Financial expenses –78 –95 –372 –355
–78 –95 –372 –355
Profit/loss before changes in value 309 274 1,180 1,215
Changes in value Properties, unrealised 499 444 1,817 1,872Properties, realised 5 –0 –4 0Derivatives, unrealised –2 35 121 85Derivatives, realised – – –5 –5
502 479 1,930 1,953
Profit/loss before tax 811 753 3,110 3,168
Current tax –30 – –9 –39Deferred tax –163 –131 –542 –574
–193 –131 –551 –614
Profit/loss for the period 618 622 2,559 2,554
Other comprehensive incomeItems which will be reclassified to profit/lossCash flow hedging 5 5 18 18Tax attributable to other reported income and expenses –1 –1 –4 –4Total other comprehensive income 4 4 14 14
Total comprehensive income for the period 621 626 2,573 2,568
Earnings per share, SEK 4.64 4.67 19.21 19.17
CONSOLIDATED STATEMENT OF COMPREHENSIVE INCOME

5Q1 2018 ATRIUM LJUNGBERG
TotalResidentialRetailOffice
6,9 %
0,6 %1,1 %
3,9 %
Operating surplus and operating surplus ratio
SEK m %
2015 2016 2017 2018
0
50
100
150
200
250
300
350
400
450
500
Q1Q4Q3Q2Q1Q4Q3Q2Q1Q4Q3Q2Q1
Operating surplus, SEK m Operating surplus margin, %
50
55
60
65
70
75
PROFIT/LOSS JANUARY–MARCH 2018NET SALESThe Group's net sales for the period increased to SEK 656 million (591), of which rental income comprised SEK 601 million (567). The rental income increased by 3.9 per cent in the comparable portfolio compared to the same period of the previous year.
During the year, non-recurring payments of SEK 2 million (4) were received for premature vacating of premises.
RENTAL INCOME TREND
2018 1/1–31/3
2017 1/1–31/3 Change, %
Like-for-like portfolio 541 521 3.9
Non-recurring remuneration 2 4
Project properties 29 25Properties acquired 23 0Properties sold 6 17Rental income 601 567 6.0
At the end of the period the market value for the like-for-like port-folio was SEK 34,944 million excluding building rights, correspond-ing to 84 per cent of the property portfolio's total value.
PROPERTY EXPENSESThe property costs totalled SEK –192 million (–183). For the like-for-like portfolio, property costs have increased by 0.8 per cent compared with the corresponding period last year. The low increase in property costs is primarily explained by the introduction of IFRS 9 Financial Instruments, which has affected the principles for re-serves for doubtful trade receivables and lower service charge-re-lated costs compared to the same period of the previous year.
PROPERTY COSTS TREND
2018 1/1–31/3
2017 1/1–31/3 Change, %
Like-for-like portfolio –167 –165 0.8
Project properties –14 –10
Properties acquired –8 –1
Properties sold –4 –7
Property management costs –192 –183 5.1
Like-for-like net rental income growth Operating surplus and operating surplus margin
GROSS PROFIT/LOSSThe gross profit for the property management activities (the oper-ating surplus) increased to SEK 409 million (384), corresponding to 6.4 per cent. The increase is due primarily to new rentals, renegoti-ations, lower property costs and the effect of acquired properties. The surplus ratio is unchanged at 68 per cent (68) compared to the same period of the previous year.
Contributions from acquired properties primarily relate to the property Lindholmen 30:1 in Gothenburg, which was taken over on 29 March 2017.
The gross profit for project and construction activities totalled SEK –1 million (6). The lower gross profit is primarily explained by a change in principles in the elimination of internal profit in TL Bygg within the Group. Internal Group sales for the period in TL Bygg amounted to SEK 99 million (132), which corresponds to 67 per cent (88) of total sales. TL Bygg's gross profit amounted to SEK 9 million (SEK 10 m).
SEASONAL EFFECTS The operating surplus is impacted by seasonal variations in operat-ing costs. Generally costs are higher during the first and last quar-ter of the year, primarily caused by higher costs of heating and property maintenance.
CENTRAL ADMINISTRATIONCentral administration comprises costs for the company manage-ment as well as central support functions. The cost for the period amounted to SEK –17 million (–17).
FINANCIAL INCOME AND EXPENSES Financial expenses for the period amounted to SEK –78 million (–95) despite higher interest-bearing liabilities. The average inter-est rate at the end of the period amounted to 1.7 per cent (2.2). For more information, refer to the section on financing on page 13.
CHANGES IN VALUEUnrealised changes in the value of investment properties totalled SEK 499 million (444) and are mainly explained by the market's lower yield requirements and higher operating net. For more infor-mation, refer to the section on the property portfolio on page 8.
Unrealised changes in the value of derivatives totalled SEK –2 million (35).

6Q1 2018 ATRIUM LJUNGBERG
TAXESThe current tax for the period totalled SEK –30 million (0). The cur-rent tax has been affected by tax deductible depreciation and in-vestments, and by loss carry-forwards from previous years and re-structuring of interest derivatives. The change in deferred tax amounts to SEK –163 million (–131) and has primarily been impacted by deferred tax on unrealised changes in the value of properties and derivatives and the use of tax loss carry-forwards.
The Group's accumulated tax deficit amounted to SEK 22 million (29), of which SEK 22 million (29) comprises the base of the Group's deferred tax receivable.
The residual tax value of the property stock amounts to SEK 15,890 million (15,680).
TAX CALCULATION, 31/03/2018
SEK m Current tax Deferred taxReported profit/loss before tax 811Tax deductible depreciation –103 103 investments –54 54Non-taxable/non-deductible changes in the value of properties, unrealised –499 499 changes in the value of properties, realised 5 0 changes in the value of derivatives, unrealised 2 –2 consolidated capitalisation of borrowing –4 4 consolidated internal profit 4 –4Other fiscal adjustments –13 75Taxable profit/loss before loss carry-forwards 149 729
Change in loss carry-forwards –7 7
Taxable profit/loss 142 736
Of which 22% current/deferred tax –30 –163
Reported tax expense –30 –163
PROFITThe profit before changes in value increased to SEK 309 million (274).
The profit for the period amounted to SEK 618 million (622), which corresponds to SEK 4.64/share (4.67) and was primarily affected by unrealised changes in the value of properties, a higher operating surplus and higher tax costs.
NET LETTINGNet letting, i.e. newly agreed contracted annual rents less annual rents terminated due to clients vacating the premises, amounted to SEK 10 million (–34) during the first quarter, of which SEK 3 (28) refers to project properties.
The time lag between net letting and its effect on profit is as-sessed to be 3–12 months.
CONTRACTED ANNUAL RENT AND LETTING RATEThe contracted annual rent amounted to SEK 2,365 million on 01/04/2018 (2,354 on 01/04/2017) and the rental value amounted to SEK 2,512 million (2,507 on 01/04/2017). This gives a letting rate of 94 per cent (94 on 01/04/2017) including project properties and of 95 per cent (95 on 01/04/2017) excluding project properties. The EPRA vacancy rate is thus 5 per cent (7 per cent as of 01/04/2017).
The average remaining term for contracted rent excluding resi-dentials and parking, was 3.5 years as of 01/04/2018 (5 years as of 01/04/2017).
PROFIT FORECASTThe forecast for the profit before changes in value for the full year of 2018 amounts to SEK 1,200 million. The profit after tax is consid-ered to amount to SEK 1,315 million, which corresponds to SEK 9.87/share. Future changes in value and any future property acqui-sitions and sales of properties have not been taken into account in the forecast.
Rental value and letting rate
01/04/2018 01/04/2017
Premises typeRental value,
SEK mRental value, SEK/
m2 Letting rate,%Rental value,
SEK mRental value,
SEK/m2 Letting rate, %Office 1,138 2,586 95 1,061 2,446 95Retail 924 3,504 95 977 3,265 95Other 219 1,856 95 215 1,880 96Residentials 78 1,381 100 71 1,331 100Garage/parking 52 – 93 61 – 94Business area Property 2,411 2,686 95 2,386 2,166 95Project properties 101 79 121 68Total 2,512 94 2,507 94
CONT. PROFIT/LOSS JANUARY–MARCH 2018

7Q1 2018 ATRIUM LJUNGBERG
CONSOLIDATED BALANCE SHEETS SUMMARY
Amounts in SEK m 31/03/2018 31/03/2017 31/12/2017
ASSETSInvestment properties 40,858 38,694 39,991Goodwill 240 263 240Other fixed assets 47 40 45Total fixed assets 41,145 38,997 40,276
Development properties 876 – 870Current assets 397 469 1,2721)
Liquid assets 415 152 344Total current assets 1,689 622 2,487
Total assets 42,834 39,618 42,763
SHAREHOLDERS’ EQUITY AND LIABILITIESShareholders’ equity 18,844 16,802 18,223
Deferred tax liability 4,693 4,130 4,531Long-term interest-bearing liabilities 15,433 15,721 16,415Derivatives 481 865 484Other long-term liabilities 73 63 73Total long-term liabilities 20,680 20,779 21,503
Short-term interest-bearing liabilities 2,040 1,175 1,832Derivatives – 4 0Other current liabilities 1,270 858 1,2052)
Total current liabilities 3,310 2,038 3,037
Total shareholders’ equity and liabilities 42,834 39,618 42,763
1) Including a purchase price receivable relating to the sale of Port 73.2) Including a purchase price not paid relating to the acquisition of Molekylen.
Attributable to the Parent Company shareholders
Amounts in SEK m Share capitalOther capital
contributedHedging reservesProfits brought
forwardTotal sharehold-
ers’ equityOpening balance as per 1 January 2017 333 3,960 –54 11,937 16,176Profit/loss for the period 622Other comprehensive income 4 4Closing balance, as per 31 March 2017 333 3,960 –50 12,559 16,802
Profit/loss for the period 1,937 1,937Other comprehensive income 10 10Dividend, SEK 3.95/share –526 –526Closing balance, as per 31 December 2017 333 3,960 –39 13,970 18,223
Profit/loss for the period 618 618Other comprehensive income 4 4Closing balance as per 31 March 2018 333 3,960 –36 13,969 18,844
There are a total of 133,220,736 (133,220,736) shares, of which 4,000,000 (4,000,000) are class A shares and 129,220,736 (129,220,736) are class B shares. One class A share grants entitlement to ten votes and one class B share grants entitlement to one vote. At the end of the period, the number of outstanding shares amounted to 133,220,736 (133,220,736 as of 31/12/2017). The average number of outstanding shares for the period from 01/01/2018 to 31/03/2018 amounts to 133,220,736 (133,220,736).
CONSOLIDATED CHANGES IN SHAREHOLDERS’ EQUITY

8Q1 2018 ATRIUM LJUNGBERG
PROPERTY PORTFOLIOTHE PROPERTY MARKETRent levels for offices continue to rise, particularly in Gothenburg and Malmö. The Stockholm area has the highest rents, but they have not risen at the same rate, which may be partly explained by the offer of newly-produced office spaces.
Market yields continue to be stable at low levels despite some threatening storm clouds, which primarily consist of the possibility of future interest rate rises, lower housing prices and future legis-lative proposals that will mean higher costs in property sales and lower deductions for interest expenses.
The transaction volume on the Swedish property market amounted to SEK 23 billion in the first quarter, which is lower than the level for the previous year by SEK 38 billion. The demand for of-fice properties is high and this accounted for a third of the transac-tion volume. Foreign investors have been an active presence and accounted for 38 per cent of the transaction volume.
OUR PROPERTY PORTFOLIOAtrium Ljungberg's property portfolio consists of 53 properties lo-cated in Stockholm, Gothenburg, Malmö and Uppsala. Our portfo-lio, which mainly consists of office and retail properties, has a total letting area of 1,145,000 m2.
In December 2017, an agreement was signed on sale of the prop-erty Söderby Huvudgård 2:43 in Haninge, which was completed at the beginning of February 2018.
DEVELOPMENT PROPERTIESDevelopment properties are properties that are intended to be de-veloped into tenant-owned dwellings before being sold. The devel-opment properties are recognised at the lowest of the costs ex-pended and the estimated net realisable value.
Changes in the property portfolio
SEK m2018
1/1–31/32017
1/1–31/32017
1/1–31/12Investment propertiesFair value at the start of the period 39,991 36,054 36,054Acquisitions (after deduction of deferred tax) 10 1,846 2,265Sales – – –868Investments in our own properties 357 351 1,593Unrealised changes in value 499 444 1,817Reclassification to Development properties – – –870Fair value at the end of the period 40,858 38,694 39,991
Development properties
At beginning of period 870 – –Reclassification from Investment properties – – 870Investments 6 – –Development properties, at period end 876 – 870Property portfolio, total 41,733 38,694 40,861
PROPERTY VALUESDuring the first quarter, Atrium Ljungberg internally valued the en-tire property portfolio and assumed yield requirements have been subject to quality assurance by Forum Fastighetsekonomi.
The market valuation is based on analyses of completed proper-ty transactions for properties of a similar standard and in a similar location, in order to assess the market’s yield requirements. The valuation also entails cash flow calculations, with individual as-sessments of the earning capacity of each individual property. As-sumed rental levels in conjunction with contract expirations corre-spond to current market rent levels. Operating costs have been assessed on the basis of the company’s actual costs. Development rights have been valued based on an assessed market value per m2 of GFA for determined development rights in accordance with an approved detailed development plan or where the detailed develop-
Property portfolio
31/03/2018 31/03/2017
Property typeLetting area,
’000 m2Fair value,
SEK mFair value, SEK/m1 2)
Letting area, ’000 m² Fair value, SEK m
Fair value, SEK/m2 1)
Office properties 669 21,455 41,157 618 19,605 38,476
Retail properties 336 14,419 49,356 412 14,494 43,617
Residential properties 76 1,694 26,091 71 1,433 24,258Total 1,082 37,568 42,770 1,101 35,533 39,440Project properties 40 2,589 – 75 2,447 E/T2)
Land and development rights – 701 – 714Total Investment properties 1,122 40,858 1,176 38,694Development properties 23 876 – –Total Properties 1,145 41,733 1,176 38,6941) m2 excluding garage. 2) Letting area for new production is not reported until the project is completed and the figures hence do not accurately represent the actual situation.

9Q1 2018 ATRIUM LJUNGBERG
ment plan is assessed to enter into force within the near future. Project properties are valued on the basis of completed projects, less remaining investments. A risk surcharge is added to the yield requirement on the basis of the current phase of the project.
The unrealised changes in value during the period amounted to SEK 499 million (444) and are mainly explained by the market's lower yield requirements and higher operating net.
Unrealised changes in value, properties
SEK m 31/03/2018 31/03/2017Change in yield requirements 289 363Change in operating net etc. 210 81Total 499 444
Dividend yield requirement per premises type
%31/03/2018 31/12/2017
Interval Average AverageOffice 3.7–6.5 4.6 4.7Retail 3.7–6.2 5.0 5.0Residentials 2.9–3.8 3.1 3.1Other 3.7–6.3 5.1 5.1Total 2.9–6.5 4.7 4.7
Dividend yield requirement per region
%31/03/2018 31/12/2017
Interval Average AverageStockholm 2.9–6.5 4.7 4.7Uppsala 5.0–5.2 5.1 5.1Malmö 3.8–6.3 5.4 5.4Gothenburg 4.6–5.1 4.6 4.6Total 2.9–6.5 4.7 4.7
CONFIRMED PROJECTSDuring the first quarter of 2018, investments in own properties amounted to SEK 364 million (351), of which SEK 253 million (174) was in project properties. Investments in project properties relate primarily to Sickla Front II and Gränbystaden. The other invest-ments relate primarily to tenant adaptations in properties in Sickla, Liljeholmen and Gränbystaden.
The remaining investment volume for projects decided on amounted to approximately SEK 2.3 billion on 31 March.
SICKLA – NACKASickla Front II – The completion of Sickla Front II in Sickla is in its final phase. Sickla Front II comprises two office buildings of ap-proximately 25,300 m2 letting area in total as well as 14,000 m2 GFA parking area. Along with the adjacent office property that was con-structed in 2015, they form the Sickla Front district, which now pro-vides a clear entrance to the Sickla city district, linking Sickla with Hammarby Sjöstad. The move will take place in the summer and autumn of 2018. Along with Yamaha Motor Europe, the tenants in-clude the Swedish National Courts Administration with the Nacka District Court, the Rent and Tenancy Tribunal and the Land and Environ mental Court. The ground floor is being designed to acco-modate activities for the public.
Sickla 1898 – In the autumn of 2017, work started on the recon-struction and extension project Sickla 1898. The location is histori-cally Sickla’s soul, where AB Diesels Motorer’s first factory was constructed in 1898. We are creating a health care destination here, along with shops, a cafe and a restaurant. The project comprises a total of 11,700 m2 letting area, which includes 8,100 m2 for health care and 3,600 m2 for retail. Occupancy will start at the end of 2020.
CONT. PROPERTY PORTFOLIO
Beside Järnvägsgatan we are creating a health and social care destination with physiotherapy, a health care centre and a dentist. The ground floor accommodates shops, cafés and restaurants. The location is, historically speaking, the heart of Sickla and is where AB Diesel Motorer’s first factory was built in 1898.
The old Tapetfabriken will now be transformed. In spring 2020, Nordic Choice Hotels will inaugurate a hotel with 150 rooms, a lobby, a restaurant and an events facility. The vision is to create an exciting building where old meets new in a creative way.

10Q1 2018 ATRIUM LJUNGBERG
Sickla Tapetfabriken – The reconstruction and extension of a for-mer office building in Sickla, known as “Tapetfabriken” (Wallpaper Factory) got under way. Tapetfabriken is planned to comprise 9,700 m2, with a hotel and offices, as well as a garage. At the beginning of 2018, we concluded an agreement with Nordic Choice Hotels, which will open a 7,200 m2 hotel with more than 150 hotel rooms and a 2,000 m2 lobby with a restaurant, events areas and conference prem-ises. The hotel will open in the spring of 2020.
By transforming the former office building into a hotel, with an open ground floor that has meeting places and a restaurant for the public, we are continuing to develop Sickla into an even more vi-brant urban environment.
GRÄNBYSTADEN – UPPSALADuring the year we worked in Gränbystaden on new builds and ex-tensions at both the area’s northern part and by Gränbystaden shopping centre.
Norra Gränbystaden – At the big-box hub in Northern Gränby-staden a building of 1,000 m2 letting area was completed in the fourth quarter of 2017, with Elon opening a new store in October. Work is currently underway on constructing another building, where companies like Jula, Jysk and Rusta will be opening stores in the autumn of 2018. The big-box hub in Gränbystaden will then have a leasable area of just over 31,000 m2.
Gränby Entré buildings 2 and 3 – The work to build three resi-dential buildings next to Gränbystaden shopping centre continued during the previous year and occupation of building 1 took place in October 2017. Buildings 2 and 3 contain a total of just under 140 rental apartments and commercial premises, where a number of restaurants and cafes will be established. The apartments will start
CONT. PROPERTY PORTFOLIO
An extension project is being carried on in the Gränbystaden shopping centre which involves just over 11,000 m2 of retail, culture, restaurants and entertainment. The new part is being inaugurated at the end of November and Nordisk Film is opening a new cinema with five screens.
to be released via Uppsala Bostadsförmedling in the spring of 2018, with occupancy at the end of 2018 and the beginning of 2019.
Gränbystaden, south garage – Next to Gränbystaden shopping centre, construction is ongoing of a parking garage with approxi-mately 275 underground parking spaces. The garage will open in the autumn of 2018.
Gränbystaden, south entrance – An extension project is under way at Gränby staden Galleria, which comprises an additional 11,800 m2 letting area for retail, restaurants, culture and entertain-ment. Nordisk Film will open a cinema and O’Learys will open a restaurant here at the end of November 2018.
MOBILIA – MALMÖMobilia Torghuset – New construction and extension of approxi-mately 13,500 m2 of letting area begins in May 2018. We will create additional areas for retail, residentials, restaurants and cultural activities in the heart of the district. The extension will be complete in spring 2020, when Nordisk Film will open a cinema and 74 rental apartments will be ready for occupation.
FORUMKVARTERET – UPPSALAIn Forumkvarteret in the centre of Uppsala, major reconstruction work has been carried out in all parts of the property for some time. Forumkvarteret has offices, residential properties and a shopping centre with stores and restaurants. In 2017 and spring 2018, work focused mainly on improving and reconstructing the shopping centre section, making space available and creating a clear internal concourse. The offer has been strengthened by the establishment of Espresso House on two floors and the restaurant chain Egon, which is expected to open in the third quarter of 2018.

11Q1 2018 ATRIUM LJUNGBERG
Our ambition with Forumkvarteret is to create a city centre dis-trict with a strong offering of retail, restaurants and cafes, com-bined with attractive office environments.
The new shopping centre is planned to be opened for Christmas shopping in 2018.
POTENTIAL DEVELOPMENT PROJECTSOur existing project portfolio with own land and land allocations enables future investments corresponding to approximately SEK 14 billion. In terms of area, half of the project portfolio consists of res-identials and half of offices, retail, education and hotels. The pro-ject portfolio is divided among all our areas where Sickla and Uppsala account for approximately 70 per cent. The rate at which we can complete the projects depends on the market situation and the progress made in the detailed development plan process. A project market area is not usually started until we have secured a minimum return in the form of signed lease contracts.
CONT. PROPERTY PORTFOLIO
CONFIRMED PROJECTS
Project, property MunicipalityNew builds and extensions
Sickla Front II, Sicklaön 346:1 Nacka 25,300 14,000 830 240 2018 65 E/T3) BREEAM
Sickla 1898, Sicklaön 83:22 Nacka 3,600 8,100 510 470 2020 33 – Breeam
Sickla Tapetfabriken, Sicklaön 83:22 Nacka 7,200 2,600 4,600 380 360 2020 E/T3) E/T 3) BREEAM
Northern Gränbystaden, Brillinge 8:1/9:1 Uppsala 31,300 570 50 2014–2018 50 85 BREEAM
Gränby Entré building 2, Gränby 21:4 Uppsala 900 1,300 3,300 230 120 2018 14 235) Green Building
Gränby Entre building 3, Gränby 21:4 Uppsala 1,100 1,300 3,400 240 200 2019 15 96) Green Building
Gränbystaden, southern garage, Gränby 21:4 Uppsala 11,500 190 10 2018 – – Breeam In-Use
Gränbystaden, south entrance, Gränby 21:4 Uppsala 12,100 340 230 2018 37 57 Breeam In-Use
Mobilia Torghuset, Bohus 8 Malmö 9,400 3,800 530 470 2020 35 307) Breeam/Environmental
building Reconstruction
Forumkvarteret, Dragarbrunn 27:2 Uppsala 8,100 3,200 1,400 290 120 2018 39 72 Breeam In-Use
Total 73,700 41,800 11,900 30,100 4,110 2,270 2,5898)
Other project properties 701
Total project properties 3,290
1) Including any land acquisition in connection with the project implementation, but excluding any initial values such as demolition of buildings. 2) Excluding any net sales result.3) Rental value/letting rate is not reported as a subtotal with regard to individual business transactions..4) Covers approximately 45,000 m2 GFA in total. Investment decisions and completion take place in stages, among other things connected to letting.5) The letting rate for commercial premises amounts to 46%. Residentials are let closer to completion.6) The letting rate for commercial premises amounts to 17%. Residentials are let closer to completion.7) The letting rate for commercial premises amounts to 37%. Residentials are let closer to completion. 8) Divided into SEK 1,199 million for new building and extensions and SEK 590 million for reconstructions.
Retail, lettin
g area, m²
Letting area, Office, m
²
Residentials, lettin
g area, m2
Parking, GFA
Total investment, S
EK m1)
Of which remaining, SEK m
Completed
Fair value, SEK m
Assessed rental value, SEK m
2)
Letting rate, %
Environmental certifi
cation
2018 2019 2020
Q1 Q2 Q3 Q4 Q1 Q2 Q3 Q4 Q1 Q2 Q3 Q4
Sickla Front IISickla 1898Sickla TapetfabrikenNorthern GränbystadenGränby Entré building 2Gränby Entré building 3Gränbystaden, southern garageGränbystaden, southern entranceMobilia Torghuset
CONFIRMED PROJECTS, NEW BUILDS AND EXTENSIONS
Planning Construction Completion
The projects that we expect to begin in 2018–2019 are described below. Some projects are covered by current detailed development plans and others are depended on new detailed development plans.
POTENTIAL PROJECT STARTS 2018–2019In Sickla we are planning an extension of the Sickla shopping centre of approximately 3,000 m2 GFA for retail, plus two floors for a parking garage with approximately 220 parking spaces. There is a complete detailed development plan for the expansion and the construction is expected to start at the beginning of 2019.
Detailed planning work for approximately 500 residentials in Nobel berget, 700 in Kyrkviken and 60 in Gillevägen in Sickla is in pro-gress. We expect a completed local development plan for Nobelber-get to be completed in the spring of 2018 and are planning to start selling the first 70 tenant-owned dwellings in the second half of 2018, with construction beginning in the first quarter of 2019. At Nobelber-get we want to create an attractive and dense urban environment with residentials as well as office premises and cultural activities.

12Q1 2018 ATRIUM LJUNGBERG
Beside Sickla station we have a building right of approximately 7,500 GFA m2 beside the future underground railway station for re-tail, services and offices. Along with the Municipality of Nacka, we are investigating the possibility of a larger building that could house more offices. Detailed development planning is under way, and construction is expected to start in 2019.
Detailed development plans are also ongoing for the reconstruc-tion and extension of Svindersviksskolan from the current 3,000 m2 to approximately 9,000 m2 GFA.
In Gränbystaden in Uppsala we want to continue to create urban qualities and develop the area with a mix of retail, offices and resi-dentials, as well as service and cultural activities. In addition to the rental apartments which are being constructed (see page 10), we are planning for approximately 250 more tenant-owned dwellings in the area. Construction of the first phase is expected to take place in 2019, with possession during 2020.
In Northern Gränbystaden there are opportunities to develop a further 5,000 m2 GFA more retail.
At the beginning of 2017, we received a land allocation beside the Gränbystaden shopping centre with a building right of approximately 50,000 m2 GFA. This gives us the ability to continue to develop Gränby-staden towards the vision of creating a second urban core for Upp-sala.
In Hagastaden in Stockholm, we have the possibility of con-structing 32,000 m2 GFA beside Nya Karolinska Solna (NKS). In October 2017, Stockholm City Council adopted a resolution on a
development agreement with transfer of land. After property ad-justment, we expect to be able to take possession of the land in summer 2018. Here, in the heart of the emerging life science clus-ter, we are creating Life City, a new centre for activities supporting cluster building in life science.
Construction of Life City is expected to start in mid-2018, with occupancy during the spring of 2021. The start of construction de-pends on approval by the Swedish Transport Administration of a tunnel construction which is crucial for the building.
In Barkarby in Järfälla we have a land allocation with the option of acquiring land with a development right of approximately 50,000 m2 GFA. Together with Järfälla Municipality, we are planning to cre-ate Bas Barkarby, a multi-functional district in the heart of the growing Barkarbystaden. It will promote learning focused on sci-ence and technology as well as culture, sports and business. Järfälla Municipality will lease almost 11,000 m2 of the first phase for upper secondary education, a multi-purpose hall, a library and other cultural activities. The leases are conditional on the land transfer agreement being concluded. The local development plan gained legal force in January 2018 and a decision on environmental permits by the Land and Environmental Court is expected in No-vember 2018 at the earliest.
Construction of the first phase of Bas Barkarby is expected to take place in November 2018 at the earliest, with occupancy in the summer of 2021.
CONT. PROPERTY PORTFOLIO
13Q1 2018 ATRIUM LJUNGBERG
THE FINANCIAL MARKETThe Swedish economy continues to be strong and the upturn in the rest of the world is positive for exports and industrial production.
Inflation is almost on target at two per cent, though the inflation forecasts have been revised downwards and the Riksbank has brought forward the time for when an increase in the repo rate can take place There are storm clouds in the rest of the world due to an increasing protectionism, which can lead to greater trade barriers that would be detrimental to the Swedish export industry. In March, the National Institute of Economic Research assessed growth in GDP at 2.8 per cent for 2018 and 2.1 per cent for 2019.
The variable rate, 3M Stibor, amounted to –0.36 per cent at the end of the quarter, compared to –0.46 per cent at the beginning of the year. At the end of the quarter, the 10-year swap rate amounted to 1.21 per cent compared to 1.20 per cent at the beginning of the year.
INTEREST-BEARING LIABILITIESAtrium Ljungberg meets its financing requirements through five Nordic banks and the capital market. Bank loans accounted for 48 per cent (49) of the total loan volume at the end of the period. Inter-est-bearing liabilities at the end of the period amounted to SEK 17,473 million (16,896). During the first quarter, interest-bearing li-abilities decreased by SEK 774 million due primarily to the fact that loans were repaid after a property sale.
The average interest rate at period end amounted to 1.7 per cent (2.2). Including unutilised loan guarantees the average interest rate amounted to 1.8 per cent (2.2). The average fixed interest term was 4.4 years (3.8 years) and the average capital commitment term was 3.5 years (3.7 years).
Unutilised loan guarantees in addition to loan guarantees which cover outstanding commercial paper amounted to SEK 2,150 mil-lion (860). The unutilised overdraft facility amounted to SEK 300 million (SEK 300 m).
COLLATERALAtrium Ljungberg's borrowing is partly secured by real estate mortgages. Of the interest-bearing liabilities, SEK 8,448 million (8,325) is secured by mortgage deeds which corresponds to 20 per cent (21) in relation to the total assets.
DERIVATIVESAt the end of the period, the derivative portfolio comprised of SEK 9,296 million (9,525) in interest swaps, with maturity between 2018 and 2029.
The derivatives portfolio is valued at market rate in conjunction with every closing of the accounts and the change in value is re-ported via the income statement. The unrealised change in value of derivatives amounted to SEK –2 million (35) during the period. The deficit book value of the derivatives portfolio totalled SEK –481 mil-lion (–869) at the end of the period.
PUBLIC RATING AND INCREASED BOND VOLUMEIn February 2017, we received an investment grade rating from the credit rating agency Moody's and was awarded a Baa2 grade with stable outlook. An updated report was received at the beginning of 2018 that confirmed previous levels.
Two issues of bonds were carried out in the first quarter. The volume of outstanding bonds under the MTN programme increased from SEK 5,700 million to SEK 6,300 million
FINANCING
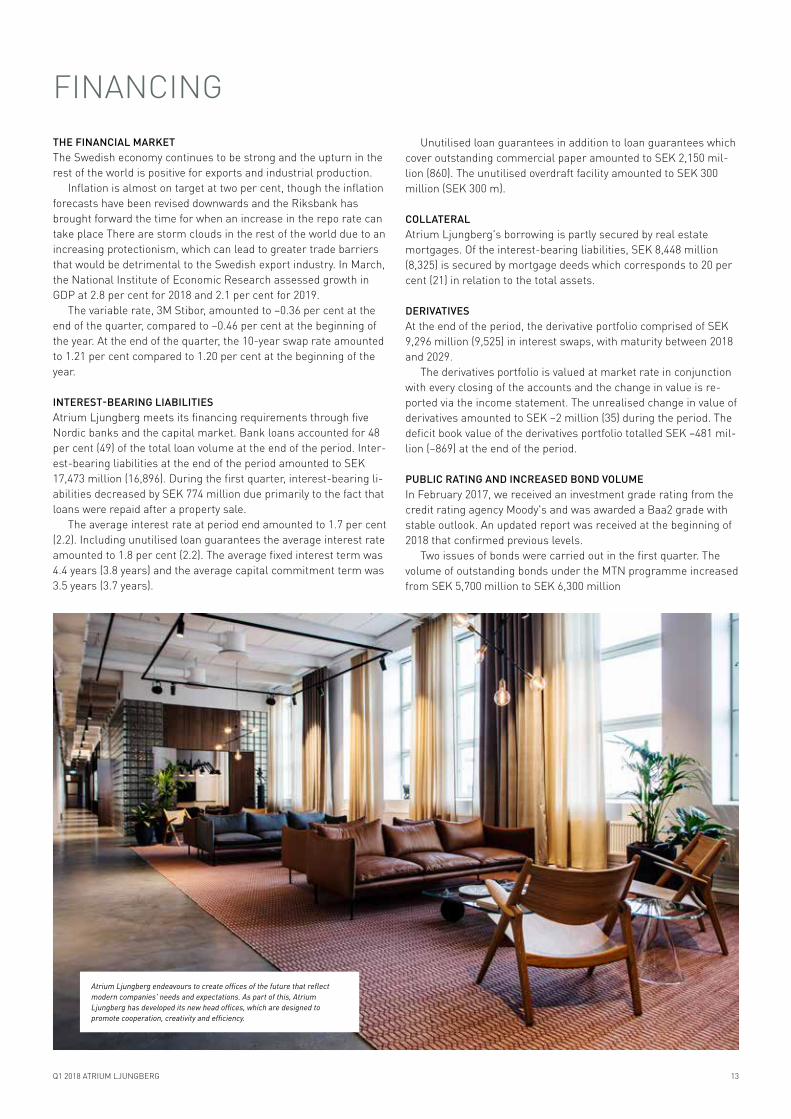
Atrium Ljungberg endeavours to create offices of the future that reflect modern companies' needs and expectations. As part of this, Atrium Ljungberg has developed its new head offices, which are designed to promote cooperation, creativity and efficiency.

14Q1 2018 ATRIUM LJUNGBERG
Fixed interest
Fixed interest term Amount, SEK m Percentage, %Average interest,
% 1)
2018 5,877 34 0.72019 800 5 0.22020 1,300 7 0.62021 760 4 4.12022 1,000 6 2.62023 and thereafter 7,736 44 2.6Total 17,473 100 1.71) The average credit margin for variable interest rates is spread over the time segment during
which the derivative falls due for payment. The average interest is reported excluding the cost of unutilised loan guarantees.
Capital commitment
Maturity date Amount, SEK m Percentage, %2018 510 3
2019 4,377 252020 5,035 292021 1,394 82022 3,517 202023 and thereafter 2,640 15Total 17,473 100
Key ratios financing
31/03/2018 31/12/2017Interest-bearing liabilities, SEK m 17,473 18,247Shareholders’ equity, SEK m 18,843 18,223Adjusted gearing ratio, % 42.3 44.1Average fixed interest term, years 4.4 4.4Average capital commitment term, years 3.5 3.5Average interest rate for interest-bearing liabilities, % 1.7 1.7
Interest-bearing liabilities
Capital structure
Shareholders’ equity 44 %, SEK 18,843 m
Unsecured loans 21 %, SEK 9,025 m
Deferred tax liability 11 %, SEK 4,693 m
Secured loans 20 %, SEK 8,448 m
Other liabilities 4 %, SEK 1,824 m
Development in financing sources 2013–2018
Interest-bearing liabilities
Bank loans 48 %, 8 448 mkrCommercial paper 16 %, 2 725 mkr
Bonds 21 %, 3 700 mkr
Green bonds 15 %, 2 600 mkr
SEK billion
Bank loans
2013 2014 2015 2016 2017 2018
Green bonds
0
5
10
15
20
Development in financing sources 2013–2017
Commercial paperBonds

15Q1 2018 ATRIUM LJUNGBERG
CONSOLIDATED STATEMENTS OF CASH FLOW
COMMENTS ON THE CASH FLOW STATEMENTThe cash flow from operating activities totalled SEK 316 million (272), corresponding to SEK 2.37/share (2.04). The higher cash flow during the period compared to the same period last year is mainly explained by net operating results.
Investment activities have contributed to a positive cash flow by SEK 529 million (–2,199) relating to sales of one property.
The cash flow in financing activities amounted to SEK –774 mil-lion (1,803) as a consequence of repayments in connection with sales of properties.
Available liquidity amounted to SEK 2,865 million (2,009) and comprised bank deposits of SEK 415 million (344), unutilised over-draft facilities of SEK 300 million (300) and unutilised lines of credit of SEK 2,150 million (1,365) in addition to credit facilities covering outstanding commercial paper.
2018 2017 2017 2017/2018Amounts in SEK m 1/1–31/3 1/1–31/3 1/1–31/2 1/4–31/3OPERATING ACTIVITIESProfit/loss before changes in value 309 274 1,180 1,215Reversal of depreciation and write-downs 3 2 8 9Other items not included in the cash flow –2 2 12 9Tax paid –16 –9 –4 –11Cash flow from operating activities before changes in working capital 293 268 1,197 1,222
Net change in working capital 22 4 –31 –13Cash flow from operating activities 316 272 1,166 1,209
INVESTMENT ACTIVITIESAcquisition of investment properties – –1,846 –1,833 12Reconstruction and new construction of investment properties –364 –351 –1,593 –1,606Sale of investment properties 902 – – 902Purchase/sale of equipment –9 –2 –17 –24Cash flow from investment activities 529 –2,199 –3,443 –716
FINANCING ACTIVITIESChange in other long-term liabilities 0 3 12 9Loans raised 718 2,175 5,178 3,721Amortisation of debts –1,492 –375 –2,028 –3,145Exercise of derivatives – – –290 –290Dividends paid – – – 526 –526Cash flow from financing activities –774 1,803 2,346 –231
Cash flow for the period 70 –124 68 262Liquid assets at the beginning of the period 344 276 276 152Liquid assets at the end of the period 415 152 344 415

16Q1 2018 ATRIUM LJUNGBERG
SUSTAINABILITY REPORTINGSUSTAINABLE ENTERPRISEOne of Atrium Ljungberg’s overall operational goals is Corporate Social Responsibility. In this context we have defined four sustaina-bility goals which are monitored quarterly:
› 100 per cent of our properties will be certified by 2021.
› Energy consumption per square metre will decrease by 30 per cent between 2014 and 2021.
› The proportion of green lease contracts will be 50 per cent of the contracted annual rent by 2021.
› We will be one of Sweden's best workplaces, which forms part of our aim to have sustainable employees and to be an attractive employer.
ENVIRONMENTAL CERTIFICATIONWe have chosen to certify our commercial premises in accordance with BREEAM and our residentials in accordance with Miljöbyggnad. On 31/03/2018, 18 per cent (15 on 31/03/2017) of leasable area was certified.
ENERGY CONSUMPTIONElectricity is responsible for the greatest share of our energy con-sumption. Usually, we provide the tenants with electricity and, with a few exceptions, we charge on the basis of actual consumption, which creates incentives for resource efficiency. A majority of our properties use district heating as their heat source. We also have two properties with geothermal heating and one project property which is heated with wood pellets and oil. Cooling has been in-stalled in the majority of the properties. This type of cooling is pro-vided partly by district cooling and partly by self-generated cooling.
The total energy intensity increased by three per cent compared to the previous year. The tenant carries on energy intensive activi-ties in a newly-acquired property. This affects the key ratios for cooling and tenant electricity. The key ratio of property energy de-creased by ten per cent compared to the previous year.
Compared to the reference year of 2014, the property's energy consumption has decreased by 25 per cent and the total energy in-tensity has decreased by 14 per cent.
ENERGY INTENSITY 31/03/2018
2017/2018 2016/2017 Change compared
to 20141)kWh/m² 1/4–31/3 1/4–31/3 Change
Heating 71 78 –9% –23 %Property electricity 49 54 –8 % –27 %District cooling 14 17 –17 % –26 %Sub-total property energy 134 149 –10 % –25 %Tenant electricity 65 55 17 % 15 %Tenant electricity, estimated 18 22 –14 % –15%Process cooling 14 –2) – –Total energy intensity 231 225 3% – 14 %1) Reference year2) At 31/03/2018 there were no properties with this type of energy
GREEN LEASE CONTRACTSSustainable and cost-efficient solutions are created in close collabo-ration between tenants and property owners. Green lease contracts are an example of a joint undertaking to reduce environmental impact together; they comprise energy, waste and transportation, for exam-ple. The goal is to achieve at least 50 per cent of contracted annual rent by 2021.
2018 201731/3 31/3
Green lease contracts, share of contracted annual rent
20 % 13 %
SUSTAINABLE EMPLOYEESWe have taken part in the Great Place to Work® evaluation of "Swe-den's best workplaces" since 2011. Our goal is to achieve an aver-age index of 85 per cent. In 2017 we exceeded our goals and achieved an index of 88 per cent (89).
ECONOMIC VALUE DISTRIBUTEDAtrium Ljungberg creates value by management, development and acquisition of properties. The generated economic value mainly comprises rental income, investments and unrealised changes in the value of properties. There is a description below of how the cre-ated economic values are distributed between suppliers, employees, lenders, society and the owners.
SEK m
2018 1/1–31/3
2017 1/1–31/3
20171/1–31/12
2017/20181/4–31/3
Suppliers 504 463 2,120 2,161Employees 45 42 166 159Lenders 82 98 387 377Society 115 62 303 356Owners – – 526 526Economic value distributed1) 746 665 3,501 3,5791) Economic value distributed corresponds to economic value generated. See reconciliation on Atrium Ljungberg’s website.
TAXAtrium Ljungberg’s directly distributed economic value to society comprises taxes and leasehold fees. These taxes mainly comprise current tax, property tax, non-deductible VAT, stamp duty, social se-curity payments and special payroll tax. The rules on these taxes are monitored carefully as this is an essential part of the commercial of-fer with requirements for high predictability and minimisation of ad-ministrative expenses. Within the framework of this, in its tax policy Atrium Ljungberg undertakes not to conduct aggressive tax plan-ning. Aggressive tax planning refers to arrangements which only aim to minimise the tax without links to own business activities.
SEK m
2018 1/1–31/3
2017 1/1–31/3
20171/1–31/12
2017/20181/4–31/3
Current tax 30 – 9 39Property tax 36 34 142 144Non-deductible VAT 13 8 54 59Stamp duty 15 – 4 19Social security payments 12 12 53 53Special payroll tax 2 1 6 7Taxes 108 55 268 321Leasehold fees 7 7 35 35Society 115 62 303 356
GREEN BONDSA green framework linked to the MTN programme was published in 2017. This enables green financing with a clear link to our sustain-able projects. There was SEK 2,600 million in green bonds out-standing at the end of the period.
District cooling, 6%
Heating, 31%
Property electricity, 21%
Tenant electricity, 28%
Process cooling, 6%
Energiintensitet 2018/2017
Tenant electricity, estimated, 8%

17Q1 2018 ATRIUM LJUNGBERG
Atrium Ljungberg's segmentation is based on two business areas: Properties and Project and construction activities.
SEGMENT REPORTING
31/03/2018
Amounts in SEK m PropertiesProject develop-
ment1) TL Bygg
Project and construction
activities
Non-allocated items and elimi-
nations The Group
Rental income 604 –3 601Sales, project and construction work 5 148 153 –99 54Net sales 604 5 148 153 –102 656
Property management costs –194 2 –192Project and construction work costs –12 –139 –151 96 –55Gross profit/loss 410 –7 9 412 –4 408
Central administration –17 –4 –21 0 –21
Financial income and expenses –78 –78Profit/loss before changes in value 393 –7 5 391 –82 309
Changes in value 5042) –23) 502
Tax –193 –193Profit/loss for the period 504 –7 5 391 –277 618
Investments and acquisitions 382 1 1 383Assets, period end 40,8574) 8765) 120 996 981 42,834
31/03/2017
Amounts in SEK m PropertiesProject develop-
ment 1) TL Bygg
Project and construction
activities
Non-allocated items and elimi-
nations The Group
Rental income 570 –3 567Sales, project and construction work 6 150 156 –132 24Net sales 570 6 150 156 –135 591
Property management costs –185 2 –183Project and construction work costs –9 –140 –149 132 –18Gross profit/loss 385 –3 10 6 0 390
Central administration –17 –4 –4 1 –21
Financial income and expenses –95 –95Profit/loss before changes in value 368 –3 6 2 –95 274
Changes in value 4446) 357) 479
Tax –131 –131Profit/loss for the period 812 –3 6 2 –191 622
Investments and acquisitions 2,197 1 1 1 2,199Assets, period end 38,6944) 111 111 813 39,618
1) The profit within project development mainly refers to costs of investigations at early project stages and ongoing development projects. 2) Properties, unrealised SEK 499 (444) million. Properties, realised SEK 5 (–0) million.3) Unrealised value changes derivatives SEK –2 (35) million. Realised changes in value of derivatives – (–).4) Refers only to Investment Properties. Other assets attributable to the segment are reported under Non-allocated items and eliminations. 5) Refers only to Development Properties. Other assets attributable to the segment are reported under Non-allocated items and eliminations.
Revenue type per segment, 31/03/2018
PropertiesProject develop-
ment TL Bygg
Project and construction
activities
Non-allocated items and elimi-
nations The Group
Rental income 604 –3 601Sales, project and construction work of which Turnkey contracts, fixed price 25 25 25
of which Turnkey contracts, open account 47 47 –35 12 of which Performance contracts, fixed price 12 12 12 of which Performance contracts, open account 65 65 –63 1 of which Other 5 0 5 5Total Project and construction sales 5 148 153 –99 54Total Net sales 604 5 148 757 –102 656

18Q1 2018 ATRIUM LJUNGBERG
KEY RATIOS 1) 2)
2018 2017 2017 2017/2018PROPERTY-RELATED KEY RATIOS 1/1–31/3 1/1–31/3 1/1–31/12 1/4–31/3Letting rate, % 94 94 95 94Operating surplus margin, % 68 68 69 68Letting area, '000 m2 1,145 1,176 1,146 68Investments in investment properties, SEK m 357 351 1,593 1,599Number of properties (period end) 53 53 53 53
FINANCIAL KEY RATIOSEquity/assets ratio, % 44.0 42.4 42.6 44.0Gearing ratio % 41.9 43.7 44.7 41.9Adjusted gearing ratio, % 42.3 43.7 44.1 42.3Interest coverage ratio, multiple 5.0 3.9 4.2 4.4Average interest rate for interest-bearing liabilities, % 1.7 2.2 1.7 1.7Return on shareholders’ equity, % 13.3 15.1 15.0 14.3Return on shareholders’ equity, excluding changes in value, % 5.3 5.5 5.5 5.5Return on total assets, % 8.3 8.9 8.7 8.5Return on total assets excluding changes in value, % 2.8 3.9 3.1 3.0
DATA PER SHARE Earnings per share, SEK 4.64 4.67 19.21 19.18Profit/loss before changes in value less applicable nominal tax, SEK 1.81 1.60 6.91 7.11EPRA EPS, SEK 2.10 1.91 8.15 8.37Cash flow, SEK 2.37 2.04 8.75 9.08Shareholders’ equity, SEK 141.45 126.11 136.79 14.45Share price at period end, SEK 123.00 136.40 130.30 123.00EPRA NNNAV, SEK 168.22 149.69 162.57 168.22Average number of outstanding shares, ‘000 133,221 133,221 133,221 133,221Number of outstanding shares at end of period, thousand 133,221 133,221 133,221 133,221
EMPLOYEESAverage number of employees 295 283 295 294
EPRA KEY RATIOS 1) 2)
31/03/2018 31/03/2017 31/12/2017EPRA Earnings, SEK m 279 254 1,086EPRA ESP, SEK/share 2.10 1.91 8.15EPRA NAV, SEK m 23,772 21,529 22,992EPRA NAV, SEK/share 178.44 161.61 172.59EPRA NNNAV, SEK m 22,410 19,941 21,658EPRA NNNAV, SEK/share 168.22 149.69 162.57EPRA Vacancy rate 5% 5 % 5 %
Share priceEPRA NNNAVEPRA NAV
SEK/share
70
90
110
130
150
170
201820172016201520142013
EPRA NAV, EPRA NNNAV and share price
1) See definitions pages 25–26. 2) See reconciliation for key ratios on Atrium Ljungberg’s website.

19Q1 2018 ATRIUM LJUNGBERG
QUARTERLY SUMMARYINCOME STATEMENTS
Amounts in SEK m2018
Q12017
Q42017
Q32017
Q22017
Q12016
Q42016
Q32016
Q2Rental income 601 603 595 624 567 553 535 538Sales, project and construction work 54 70 33 48 24 35 37 37Net sales 656 673 628 671 591 588 572 575Property management costs –192 –202 –172 –185 –183 –211 –151 –164Project and construction work costs –55 –82 –40 –66 –18 –35 –44 –41Gross profit/loss 408 389 416 421 390 342 377 371– of which gross profit/loss property management (operating surplus) 409 401 423 439 384 342 384 375– of which gross profit/loss from project and construction work –1 –12 –7 –18 6 –1 –7 –4
Central administration, property management –17 –21 –1 –9 –17 –17 –16 –20Central administration, project and construction work –4 –5 –3 –3 –4 –5 –3 –4
–21 –26 –5 –12 –21 –22 –19 –24
Financial income and expenses –78 –92 –91 –93 –95 –92 –93 –98
Profit/loss before changes in value 309 271 320 315 274 228 265 249
Properties, unrealised changes in value 499 129 332 912 444 1,483 316 959Properties, realised changes in value 5 –4 – – –0 – 13 –1Derivatives, unrealised changes in value –2 –15 24 77 35 307 –54 –248Derivatives, realised changes in value – –5 – – – – – –
502 105 357 989 479 1,790 275 710
Profit/loss before tax 811 376 676 1,304 753 2,018 539 959Tax –193 20 –152 –252 –131 –457 –121 –199Profit/loss for the period 618 396 524 1,052 622 1,561 418 760
KEY RATIOS 1) 2)
Property-related key ratios2018
Q12017
Q42017
Q32017
Q22017
Q12016
Q42016
Q32016
Q2Letting rate, % 94 95 94 94 94 93 94 94Operating surplus margin, % 68 67 71 70 68 62 72 70Letting area, 1,000 m2 (period end) 1,145 1,146 1,178 1,179 1,176 1,124 1,105 1,077Investments in properties, SEK m 364 426 422 398 351 382 213 206Number of properties (period end) 53 53 54 54 53 50 50 50
Financial key ratiosEquity/assets ratio, % 44.0 42.6 42.7 41.9 42.4 43.7 41.3 41.8Gearing ratio, % 41.9 44.7 43.3 44.4 43.7 41.9 43.7 43.6Adjusted gearing ratio, % 42.3 44.1 43.3 44.4 43.7 41.9 43.7 43.6Interest coverage ratio, multiple 5.0 3.9 4.2 4.4 3.9 3.5 3.8 3.5Average interest rate for interest-bearing liabilities, % 1.7 1.7 2.0 2.0 2.2 2.3 2.3 2.5Return on shareholders’ equity, % 13.3 8.9 11.9 23.8 15.1 40.6 11.6 21.6Return on shareholders’ equity, excluding changes in value, % 5.3 4.6 5.6 5.7 5.5 4.9 5.7 5.4Return on total assets, % 8.3 4.4 7.4 13.8 8.9 23.3 7.3 12.8Return on total assets excluding changes in value, % 2.8 2.7 3.1 3.2 3.0 2.8 3.2 3.3
Data per share Earnings per share, SEK 4.64 2.98 3.93 7.63 4.67 11.72 3.14 5.70Profit/loss before changes in value less applicable nominal tax, SEK 1.81 1.59 1.87 1.84 1.60 1.34 1.55 1.46EPRA EPS, SEK 2.10 1.90 2.20 1.89 1.91 1.73 1.85 1.79Cash flow, SEK 2.37 2.72 2.01 2.00 2.04 1.85 2.46 1.17Shareholders’ equity, SEK 141.45 136.79 133.79 129.82 126.11 121.42 109.68 106.51Long-term net worth (EPRA NAV), SEK 178.44 172.59 171.32 166.61 161.61 156.21 143.36 139.01Current net worth (EPRA NNNAV), SEK 3) 168.22 162.57 159.74 154.86 149.69 144.38 130.19 126.40Share price at period end, SEK 123.00 130.30 142.00 140.50 136.40 142.30 149.60 136.50Average number of outstanding shares, ‘000 133,221 133,221 133,221 133,221 133,221 133,221 133,221 133,221Number of outstanding shares at end of period, thousand 133,221 133,221 133,221 133,221 133,221 133,221 133,221 133,221
1) See definitions pages 25–26. 2) See reconciliation for key ratios on Atrium Ljungberg’s website.3) For calculation of current net worth (EPRA NNNAV), an estimated deferred tax of 4.0 per cent has been used.

20Q1 2018 ATRIUM LJUNGBERG
PARENT COMPANY
INCOME STATEMENTS PARENT COMPANY SUMMARY BALANCE SHEETS PARENT COMPANY
The Parent Company’s operations comprise Group-wide functions and the organisation for the management of the properties owned by the Parent Company and the subsidiary companies.
Net sales totalled SEK 99 million (84). The operating profit/loss totalled SEK 14 million (10). The profit/loss after financial items to-talled SEK 55 million (26).
Interest-bearing liabilities amount to SEK 14,618 million (14,827). These funds finance the parent company's property port-folio and are lent on to other Group companies.
2018 2017 2017Amounts in SEK m 1/1–31/3 1/1–31/3 1/1–31/12Rental income 45 43 214Management income 54 41 225Net sales 99 84 439
Property costs –15 –16 –61Management and administration expenses –64 –53 –269Depreciation –5 –5 –20Operating profit/loss 14 10 90
Result of participations in Group companies – – 450Interest income and similar profit/loss items 141 129 557Interest expenses and similar profit/loss items –99 –113 –743
41 16 264
Profit/loss after financial items 55 26 353Appropriations 0 –2 162
Profit/loss before tax 23 516Current tax –30 – –3Deferred tax –2 –10 176
–32 –10 172Profit/loss for the period 23 13 688
Amounts in SEK m 31/03/2018 31/03/2017 31/12/2017ASSETSTangible fixed assets 1,610 1,524 1,525Financial fixed assets 1,033 452 1,459Current assets 20,139 22,378 22,157Total assets 22,782 24,356 25,141
SHAREHOLDERS’ EQUITY AND LIABILITIESShareholders’ equity 7,787 7,614 7,764Untaxed reserves 61 53 61Provisions 113 296 98Long-term liabilities 12,786 13,909 13,571Current liabilities 2,035 2,483 3,646Total shareholders’ equity and liabilities 22,782 24,356 25,141
OTHER INFORMATIONMARKET DEVELOPMENT, RISKS AND UNCERTAINTY FACTORSAtrium Ljungberg’s property portfolio, with retail, offices and full-service environments, is primarily located in strong subsidiary markets in the expanding regions Stockholm, Gothenburg, Malmö and Uppsala. The primary prioritised risk management areas, in light of both their complexity and size of the amounts involved, are letting, property valuation, project activities and financing. The com-pany has good procedures for managing these risks and also has a strong financial position with strong key ratios, such as a low gear-ing ratio and high interest coverage ratio.
For further information on risks and uncertainty factors in gen-eral, please see Atrium Ljungberg’s 2017 Annual Report and the section entitled “Risks and risk management” on pages 88–92.
NOTIFIED CHANGES OF RULES IN THE AREA OF TAXOn 21 March, the government issued a revised proposal relating to rules on interest limits for companies. According to the referral, which is proposed to enter into force on 1 January 2019, the right to deduct interest for negative net interest income is limited to 30% of taxable EBITDA. The company tax rate will be reduced in two phas-es from the current 22%: first to 21.4 % (2019) and finally to 20.6 % (2021). The introduction of a general deduction, referred to as a pri-
mary deduction, is proposed at 2% per year for the first six years. This applies to newly-constructed buildings that are classified as apartment blocks according to the cadastral survey. According to the Treasury Department, the parcelling study continues to be sub-ject to administration.
RETAIL SECTOR’S SALES TRENDIn the first two months of the year, total sales at our four largest re-gional retail hubs – Sickla, Farsta Centrum, Gränbystaden and Mo-bilia – fell by an overall 0.9 per cent compared to the same period of the previous year. ACCOUNTING PRINCIPLESAtrium Ljungberg’s consolidated accounts have been prepared in accordance with the International Financial Reporting Standards (IFRS). The Interim Report has been prepared in accordance with IAS 34 Interim Financial Reporting and the Swedish Annual Ac-counts Act. The Parent Company applies Swedish Financial Reporting Board's recommendation, RFR2 Accounting for Legal Entities, and the Swedish Annual Accounts Act. The accounting principles applied conform to those described in the 2017 Annual Report.

21Q1 2018 ATRIUM LJUNGBERG
New and revised standards from IFRS and interpretations from IFRIC to be applied by the Group as of 1 January 2017 have had no effect on the Group's results or financial position.
Valuation method for investment propertiesInvestment properties are valued at fair value in the Balance Sheet. The valuation took place in accordance with level 3 in the IFRS valua-tion hierarchy.
Valuation method for derivativesDerivatives (interest swap agreements) are valued at fair value in the Balance Sheet. Pursuant to the IFRS valuation hierarchy, the fair value of derivatives has been valued in accordance with level 2. This level means that the valuation is based on input data other than the listed prices, and which are observable for the asset or the liability, either directly or indirectly. The derivative agreements (IS-DA-agreements) include an option to net obligations in respect of the same counterparty.
Fair value interest-bearing liabilitiesAccording to the Balance Sheet, the Group's reported inter-est-bearing liabilities total SEK 17,437 million (16,896) and their fair value totals SEK 17,551 million (16,968). The fair value calcula-tion is based on discounted estimated future cash flows. The dis-counting is effected on the basis of current market rates plus the relevant borrowing margin. The valuation is hereby conducted with IFRS valuation hierarchy level 2. Atrium Ljungberg is of the opinion, with regard to other financial assets and liabilities reported at ac-crued acquisition value, that the differences between book values and fair values are insignificant.
NEW STANDARDS AND INTERPRETATIONS IFRS 9 Financial instrumentsThe Group has applied IFRS 9 Financial Instruments since 1 January 2018. The new standard replaces IAS 39 Financial Instruments: Rec-ognition and Measurement as of 1 January 2018. IFRS 9 mainly en-tails changes to how financial assets and liabilities are classified and measured. The new standard also contains changes to princi-ples for hedge accounting and introduces an impairment model which is based on expected credit losses instead of incurred losses.
The new standard has not entailed any significant change in the recognition of Atrium Ljungberg's financial assets other than trade receivables. The new impairment model for trade receivables means fundamental differences in how and when an impairment of a trade receivable is recognised. Nevertheless, the new principles have not had any substantial effect on the Group's financial position.
Recognition of the Group's financial liabilities, which consist mainly of interest-bearing liabilities, interest derivatives recognised at fair value via the income statement and other current liabilities, is not substantially affected by the new standard.
Since the Group has ceased to carry out hedge accounting, the Group's financial statements are not affected by the new standards for hedge accounting.
The introduction of IFRS 9 has not had any effect on equity.
IFRS 15 Revenue from Contracts with CustomersThe Group has applied IFRS 15 Revenue from contracts with cus-tomers since 1 January 2018. The new standard replaces IAS 18 Revenues and IAS 11 Construction agreements with associated statements on interpretation. Recognition of revenue starts in IFRS 15 when control of goods or services is transferred to the custom-er, which differs from the approach in IAS 18 and IAS 11 where con-trol starts when risks and benefits are transferred. Accordingly, the
introduction of IFRS 15 entails a new approach for how revenue is reported compared to now.
The new standard has an extremely limited effect on the moment when the revenue from the construction activity is recognised.
In advance of the introduction of the new standard, there was a discussion within the industry as to which parts of a rental contract must be considered to constitute rent, and should therefore be rec-ognised in accordance with IFRS 16 Leasing, and which parts con-stitute service, and should be recognised in accordance with IFRS 15. Since the service that Atrium Ljungberg provides to tenants is considered to take place under the rental contract, all payments are recognised as rent, as previously.
Revenue in Project development mainly refers to compensation for tenant-specific adaptations in conjunction with new lease agreements. Regardless of whether the Group invoices the tenant for expenses for conducted adaptations to premises on one occa-sion, or if equivalent revenue is obtained in the form of increased rent for all or parts of the lease period, the revenue comprises rent and must be reported in accordance with IFRS 16.
The recognition of construction income within the framework of TL Byggs' activities will not be affected by the new standard.
Property sales must be recognised at the date when control is transferred to the purchaser. Since a property sales contract nor-mally severely limits the seller's ability to adopt any management measures with regarding to existing or new tenants as well as re-constructions from the contract date, Atrium Ljungberg, as previ-ously, recognises property sales on the contract date unless there is any specific reason for it to do otherwise.
Atrium Ljungberg has decided to apply a cumulative, i.e. fu-ture-oriented, method when changing to IFRS 15. This means that the Group does not present any supplementary disclosures for pre-vious periods regarding any remaining performance obligations at the time of the transition. Furthermore, the transition has not had any effect on equity.
NEW STANDARDS AND AMENDED STANDARDS AND INTERPRETA-TIONS THAT HAVE NOT YET ENTERED INTO FORCE IFRS 16 LeasesIFRS 16 Leases will replace IAS 17 Leases with related interpreta-tions as of 1 January 2019. The new standard requires lessees to re-port assets and liabilities attributable to all lease agreements, with the exception of agreements which are shorter than twelve months and/or refer to small amounts. The reporting of these leases may change as a result of the new standard.
For lessees, the standard does not entail any immediate chang-es to reporting compared to current standards.
During 2017, Atrium Ljungberg analysed what effects the stand-ard is expected to have on accounting of the Group’s lease agree-ments. One aspect of the analysis involved identifying all of the Group’s lease agreements. In the analysis, Atrium Ljungberg has identified the lease agreements below as significant:
› Leasehold agreements, for which lease payments amounted to SEK 35 million in 2017
› Cars, for which lease payments amounted to SEK 4 million in 2017
In addition to the above, the Group has identified lease agreements that are not deemed as significant for the Group. These lease agreements pertain to software licences, office machinery, etc.
How to report leasehold agreements is currently being dis-cussed. The discussion primarily concerns calculation of lease lia-bility in light of future index and interest rate adjustments and rec-

22Q1 2018 ATRIUM LJUNGBERG
ognition of right-of-use assets as real value after the initial recognition of the asset. Since it has not yet been determined how these aspects are to be taken into account, Atrium Ljungberg can-not yet assess how the standard will impact Atrium Ljungberg’s re-porting. During the year Atrium Ljungberg will continue to monitor development in the area and update its assessment continuously.
EPRAAtrium Ljungberg reports EPRA EPS, EPRA Vancancy rate, EPRA NAV as well as EPRA NNNAV in accordance with the European Public Real Estate Association's definitions.
For calculation of EPRA NNNAV (the triple net asset value), an estimated deferred tax of 4.0 per cent has been used for properties. The calculation of the tax rate is based on a discount rate of three per cent (real) and the fact that the property portfolio is realised over 50 years, where ten per cent of the properties are sold through transfer of property with a nominal tax rate of 22 per cent, and that 90 per cent are sold indirectly through transfer of shares with a tax deduction for the buyer of six per cent.
ALTERNATIVE PERFORMANCE MEASURESAtrium Ljungberg applies the guidelines of the European Securities and Markets Authority (ESMA) on Alternative Performance Meas-ures (APMs). According to these guidelines, an APM is a financial measure of historical or future profit performance, financial posi-tion, financial results or cash flows which are not defined or stated in applicable rules for financial reporting; IFRS and the Swedish Annual Accounts Act.
Reconciliation of APMs is available on Atrium Ljungberg’s web-site, www.al.se.
ANNUAL GENERAL MEETING AND NOMINATION COMMITTEE The Annual General Meeting (AGM) of the company, held on 28 March 2018, resolved that the Board of Directors will consist of six ordinary members. Johan Ljungberg, Simon de Château, Sune Dahlqvist, Anna Hallberg and Erik Langby were re-elected for the period until the next AGM. Sara Laurell was elected as a new Board member. Johan Ljungberg was elected as the Chairman of the Board. Hanna Sleyman Graflund declined re-election. It was further resolved that a new Nomination Committee would, ahead of the 2019 Annual General Meeting, comprise representa-
tives of the company's five biggest shareholders on the last banking day of February 2018. The Nomination Committee therefore consists of Per-Erik Hasselberg representing the Holmström family, Lars Ericson representing the Stockholm Consumer Cooperative Society, Hans Hedström representing Carnegie Fonder, Johan Ljungberg representing the Ljungberg family and Ilkka Tomperi representing the mutual occupational pension insurance company Varma. A dividend payment of SEK 4.50 per share (SEK 3.95/share) was approved. The AGM also resolved to authorise the Board of Direc-tors to both decide on an issue in kind of maximum 13.3 million shares of class B and to decide on buy back of the company's own shares of class B provided that certain specified preconditions are met, during the period until the next AGM. At the constituent meet-ing of the Board of Directors after the Annual General Meeting, the Board of Directors of Atrium Ljungberg decided to make use of the authorisation for repurchase of shares granted at the Annual Gen-eral Meeting. The aim of the repurchase is to secure the supply of shares in accordance with the Group's stock option programme described below and to provide the Board of Directors with more flexibility in its work on the company's capital structure. The Annual General Meeting resolved, in accordance with the proposal by the Board of Directors, to introduce a stock option pro-gramme for all employees in the Group involving acquisition of a maximum of 1,000 shares per employee and to introduce a interest cost subsidy programme for purchase of shares for senior executives. Full minutes are available on Atrium Ljungberg's website at www.al.se.
OTHER INFORMATIONThe date previously notified for publication of the interim report for January – June 2018 has been changed. The new date is 10 July 2018 and the report is issued at 8.30.
The Interim Report has not been subject to review by the compa-ny's auditors.
Nacka, 20 April 2018
Annica ÅnäsCEO

23Q3 2017 ATRIUM LJUNGBERG
Atrium Ljungberg is one of Sweden’s biggest listed property companies. We own, develop and manage properties in growth markets in Stockholm, Gothenburg, Malmö and Uppsala. Our focus is to develop attractive urban environments for offices and retail, supplemented with residentials, culture, service and education.
Deciding to build attractive spaces for the future is every bit as obvious to us as deciding to create long-term value – for us, our customers and for society.
Atrium Ljungberg has been listed on the NASDAQ Stockholm Exchange since 1994.
ABOUT US
The Atrium Ljungberg share
50
75
125
100
150
175
200
225
250
Sales, million shares per monthindex
Traded shares on Nasdaq StockholmATRLJ BNasdaq Stockholm PI Nasdaq Stockholm Real Estate PI
Traded shares in other marketplaces
Sour
ce: N
asda
q an
d Fi
dess
a Fr
agul
ator
0
2
1
5
4
3
6
14
15
16
2013 2014 2015 2016 2017 2018
The Atrium Ljungberg share
1 A stable dividend yield – The dividend yield for the share over the past five years amounted to 3.0 per cent. The dividends paid by the company since its flotation in 1994 have never fallen in SEK per share.
2 Low financial risk – We are in a strong financial position, with solid key ratios such as a low gearing ratio and high interest coverage ratio, and an investment grade rating from Moody's of Baa2 with stable outlook.
3 Potential for good value growth – With a planned investment rate of SEK 1 billion per year and a goal of 20 per cent returns on new build and extension projects, the company - and hence the share – has excellent potential for good value growth over time.
4 Sustainable urban development – The sustainability work is integrated in the business model where we continuously develop our areas in a sustainable direction. We are a long-term player that takes responsibility for the impact of our business on human beings and the environment.
FOUR REASONS TO OWN SHARES IN ATRIUM LJUNGBERG
53NUMBER OF PROPERTIES
1,145TOTAL LETTING AREA, 1,000 M2
42PROPERTY VALUE, SEK BILLION
94LETTING RATE, %
2.4CONTRACTED ANNUAL RENT, SEK BILLION
295AVERAGE NUMBER OF EMPLOYEES
BUSINESS CONCEPTOur long-term approach to ownership, develop-ment and management enables us to offer our customers attractive urban environments for offices, retail and residentials in strong subsidi-ary markets. Our in-house expertise and holis-tic perspective enable us to generate added value for our customers and partners and to create value growth within the company.

24Q3 2017 ATRIUM LJUNGBERG
GOALSAtrium Ljungberg’s operations focus on growth in the op-erating surplus. This, together with a stable capital struc-ture, generates excellent conditions for good growth in value. Our goals are divided into three areas:
PROFITABILITY AND GROWTH The operating net will increase by 10 % per annum, we will invest SEK 1 billion each year in in-house projects, and the return on new build and extension projects will be 20 %. The dividend will correspond to a minimum of 50 % of the profit before changes in value, after nominal tax.
LONG-TERM STABILITYThe minimum equity/assets ratio must be a minimum of 30 % and the interest cover-age ratio must be a minimum 2.0 times.
CORPORATE SOCIAL RESPONSIBILITY100% of our properties will to be environmentally certified by 2021. Energy consumption per m2 is to decrease by 30 per cent between 2014 and 2021. By 2021, the proportion of green lease contracts is to be 50 % of the contracted annual rent. We will be one of Sweden’s best workplaces.
› We will focus on developing attractive urban environ-ments for offices and retail, supplemented with resi-dentials, culture, service and education.
› Develop and improve properties and development rights.
› Operate in strong subsidiary markets in large urban regions.
› Be a significant player with large, unified units in each subsidiary market.
› Focus on our customers in everything we do. Collabo-ration with customers, suppliers, municipalities and other stakeholders should be close, long-term, stable and committed.
› Conduct and manage the entire business process in-house using our in-house expertise.
› The sustainability work is integrated into the business strategy and constitutes an important component of our offering. We improve our own and our customers’ resource efficiency.
› To have committed employees who are passionate about what we do and who have well-established basic values.
STRATEGIES
Atrium Ljungberg's business model creates profitability and value growth, mostly through long-term property ownership, management and improvement, as well as through project development of properties. Our construction business also contributes to profitability, as do our property acquisitions and sales.
BUSINESS MODEL

25Q3 2017 ATRIUM LJUNGBERG
GRI INDEX
FINANCIAL DEFINITIONS
Share dividend yield, % The proposed share dividend as a percentage of the share price at the end of the previous year.
The share’s dividend yield is used to illustrate which current yield shareholders are expected to receive.
Share’s total yield, %The year’s change in the share price plus the distributed dividend during the year as a percentage of the share price at the end of the previous year.
The share’s total yield is used to illustrate the shareholders’ total yield on their ownership in Atrium Ljungberg.
EPRA NNNAV per share, SEKReported shareholders’ equity with reversal of goodwill adjusted with estimated actual deferred tax, divided by the number of outstanding shares at the end of the period.
EPRA NNNAV per share is used to provide stakeholders information on Atrium Ljungberg's long-term net worth per share calculated in a uniform manner for publicly listed real estate companies.
Number of outstanding shares Number of registered shares at the end of the period less bought-back shares, which do not provide entitlement to dividend or voting rights.
Return on shareholders’ equity, % Net profit/loss for the year as a percentage of average shareholders’ eq-uity.
Return on shareholders’ equity is used to illustrate Atrium Ljungberg’s capacity to generate profit on the owners’ capital in the Group.
Return on shareholders’ equity, excluding changes in value, % Net profit/loss for the year as a percentage of average shareholders’ eq-uity excluding changes in value.
Return on shareholders’ equity excluding changes in value is used to illustrate Atrium Ljungberg’s capacity to generate current cash flow on the owners’ capital in the Group.
Return on total assets, % Profit/loss before tax plus interest expenses as a percentage of the aver-age balance sheet total.
Return on total assets is used to illustrate Atrium Ljungberg’s capac-ity to generate profit on the Group’s assets uninfluenced by the Group’s financing.
Return on total assets excluding changes in value % Profit/loss before changes in value plus interest expenses as a percent-age of the average balance sheet total.
Return on total assets excluding changes in value is used to illustrate Atrium Ljungberg’s capacity to generate current cash flow on the Group’s assets uninfluenced by the Group’s financing.
Gearing ratio, % Interest-bearing liabilities as a percentage of the sum of the properties’ fair value at the end of the period.
The gearing ratio is used to illustrate Atrium Ljungberg’s financial risk.
Gross profit/loss property management Rental income less property management costs.
Gross profit/loss project and construction work Project and construction sales minus project and construction costs.
Equity per share, SEK Reported equity divided by the number of outstanding shares at the end of the period.
Equity per share is used to illustrate the owners’ share of the compa-ny’s total assets per share.
EPRA The European Public Real Estate Association is a trade organisation for
publicly listed real estate companies and investors in Europe which sets standards for the financial reporting.
Property costsTotal property management costs, which exclude central administration.
Management result less nominal tax (EPRA EPS) per share, SEKProfit/loss before changes in value, less calculated current tax excluding loss carry-forwards, divided by the average number of outstanding shares. The deducted tax has been calculated by taking into account tax deductible depreciation and investments.
Management result less nominal tax (EPRA EPS) is used to provide stakeholders information on Atrium Ljungberg’s management result per share calculated in a uniform manner for publicly listed real estate com-panies.
Average capital commitment, yearsAverage remaining term until final maturity of all credits in the liabilities portfolio.
The average capital commitment is used to illustrate Atrium Ljungberg’s financial risk.
Average interest rate for interest-bearing liabilities, %Weighted average contracted interest for all credits in the liabilities port-folio at the end of the period excluding unutilised credit facilities.
The average interest is used to illustrate Atrium Ljungberg’s financial risk.
Average fixed interest, yearsAverage remaining term until interest settlement date of all credits in the liabilities portfolio.
The average fixed interest is used to illustrate Atrium Ljungberg’s fi-nancial risk.
Adjusted gearing ratio, % Interest-bearing liabilities as a percentage of the sum of the properties’ fair values at the end of the period, less properties acquired but not pos-sessed and plus properties sold but not vacated.
The adjusted gearing ratio is used to illustrate Atrium Ljungberg’s fi-nancial risk.
Cash flow per share, SEK Cash flow from operating activities divided by the average number of outstanding shares.
Cash flow per share, SEK is used to illustrate Atrium Ljungberg’s cash flow, and particularly its dividend capacity.
EPRA NAV per share, SEKReported shareholders’ equity with reversal of goodwill, interest deriva-tives and deferred tax, divided by the number of outstanding shares at the end of the period.
EPRA NAV per share is used to provide stakeholders information on Atrium Ljungberg's current net worth per share calculated in a uniform manner for publicly listed real estate companies.
Average number of outstanding shares Weighted average number of outstanding shares calculated in accord-ance with IAS 33.
Earnings per share, SEK Net profit/loss for the period divided by the average number of outstand-ing shares after dilution.
Profit/loss before changes in value per share, SEK Profit/loss before changes in value, less current tax, divided by the aver-age number of outstanding shares.
Profit/loss before changes in value per share is used to illustrate the ongoing management operations.
Interest coverage ratio, multiple Profit/loss before changes in value, plus interest expenses divided by in-terest expenses.
The interest coverage ratio is used to illustrate how sensitive the company’s results are to interest rate changes.

26Q3 2017 ATRIUM LJUNGBERG
Equity/assets ratio, % Reported shareholders’ equity as a percentage of the balance sheet total at the end of the period.
The equity/assets ratio is used to illustrate Atrium Ljungberg’s inter-est rate sensitivity and financial stability.
Dividend pay-out ratio, % Dividend per share as a percentage of the profit/loss per share before changes in value, less applicable nominal tax.
Dividend pay-out ratio is used to illustrate how large share of the re-sults is shifted out to the Group's owners and reinvested in the opera-tions respectively.
PROPERTY-RELATED DEFINITIONS
BREEAMIs an environmental certification system developed in Europe for built environments. BREEAM takes a big picture approach to environmental performance. The areas addressed by BREEAM are energy and water consumption, health, transport, materials, waste, land usage, emis-sions, ecology and management.
GFA, m² GFA (Gross Floor Area) refers to the building’s total area, including outer walls.
Operating surplus Refers to Gross profit/loss in property management.
EPRA Vacancy rate, %The rental value of unlet premises divided by the rental value of the en-tire property portfolio. Project properties are excluded.
The EPRA Vacancy rate is reported in accordance with the EPRA’s definition of vacancy rate, which enables comparison between different companies.
Development propertiesDevelopment properties are properties that are built or unbuilt that the Group owns in order to develop and sell them as tenant-owned dwell-ings. These properties are recognised as current assets, even though some of the properties are managed and generate rental income while they are waiting to be developed.
They are recognised at the lowest of their accumulated acquisition value and their net realisable value.
Property typeThe premises type which comprises the predominant share of the rental value of a register property determines the property type.
The market value is reported per property type.
Rental value Contracted annual rents including rent surcharges (e.g. for property tax and electricity) and estimated market rents for vacant space in existing condition.
Rental value is used to illustrate the Group’s income potential.
Like-for-like portfolioComparable portfolio refers to the properties which were not classified as project properties and were owned throughout the period and entire comparison period.
Comparable portfolio is used to illustrate the trend of rental income excluding non-recurrent effects for premature vacating of premises and property costs uninfluenced by project properties as well as acquired and sold properties.
Premises typeThe operations managed in the individual premises determine the prem-ises type: retail, offices, residentials or other. Other includes, among other things, education, culture and service enterprises.
The letting rate and yield requirement are reported per premises type.
Environmental buildingEnvironmental Building is a certification system for buildings which are based on Swedish construction practice and covers energy, the indoor environment and material.
Net lettingTotal contracted annual rent for new lets less annual rents terminated due to clients vacating the premises for the period.
Net letting is used to illustrate the letting situation.
Project property An individual property or a clearly delimited part of a property with re-building or extension work in progress or planned that significantly af-fects the operating surplus of the property. The term, project property, also refers to buildings under construction and to undeveloped land and development rights. Reclassification from project property to completed property occurs on 1 January of the year after completion.
Project return, %Market value after completed project minus total investment as a per-centage of total investment.
Project return is used to illustrate value creation in the project opera-tions.
Letting area, m² Total area available for letting.
Letting rate, % Contracted annual rents as a percentage of the rental value in conjunc-tion with full letting. Reported figures are based on the immediately sub-sequent quarter.
The letting rate is used to illustrate the Group’s efficiency in the use of its investment properties.
Operating surplus margin, % Gross profit/loss from property management as a percentage of the re-ported rental income.
Operating surplus margin is used to illustrate how large share of the Group’s rental income remains after property costs. The operating sur-plus margin also forms the basis of valuation of the Group’s investment properties.
SUSTAINABILITY-RELATED DEFINITIONS
Economic value distributed, Suppliers Economic value distributed, Suppliers comprises the period’s total ex-penses and investments besides those reported below Economic value distributed, Lenders, Employees, Society and Owners.
Economic value distributed, Suppliers is used to describe Atrium Ljungberg’s total compensation to other companies during the period.
Economic value distributed, Lenders Economic value distributed, Lenders comprises the period’s reported in-terest expenses plus consolidated capitalised interest expenses.
Economic value distributed, Lenders is used to describe Atrium Ljungberg’s total compensation to lenders during the period.
Economic value distributed, Employees Economic value distributed, Employees comprise the period’s total pay-roll expenses and pension costs including benefits. Employees do not in-clude consultants or other temporary staff.
Economic value distributed, Employees is used to describe Atrium Ljungberg’s total compensation to its employees during the period.
Economic value distributed, SocietyEconomic value distributed, Society comprises the sum of the period’s leasehold fees and total taxes and charges to the State. Deferred tax has not been considered.
Economic value distributed. Society is used to describe Atrium Ljungberg’s total compensation to the State during the period.
Economic value distributed, OwnersEconomic value distributed, Owners comprises the period's paid divi-dend.
Energy intensityTotal energy consumption from Heating, Cooling, Tenant electricity and Property electricity divided by the average estimated total heated letting area, excluding garage.
Green lease contracts, %Contracted annual rent for commercial premises excluding the garage and storage for lease contracts with green rent supplement in per cent of contracted annual rent for commercial premises excluding the garage and storage. Green rent supplement is a supplement to the agreement from the Swedish Property Federation in which the tenant and landlord jointly undertake to reduce the environmental impact and covers, for ex-ample, energy, waste and transport. Reported figures are based on the immediately subsequent quarter.

INFORMATION FROM ATRIUM LJUNGBERG
THE INFORMATION we release to the market concerning Atrium Ljungberg’s operations must be transparent, clear and correct in order to build market confidence in our company and our brand.
AS A LISTED COMPANY Atrium Ljungberg is subject to the rules of the listing agreement with the Nasdaq Stockholm exchange. Signif-icant events, interim reports and preliminary financial statements are published immediately via press releases and the information is also available on the company's website: www.al.se.
REGULAR MEETINGS WITH analysts, investors, shareholders and financiers, and with our customers and partners, enable us to pro-vide ongoing information on our company, current events and oper-ational changes.
THE ANNUAL REPORT and interim reports are available on our website. The annual report is also distributed in printed format by post to shareholders who have actively requested it. Interim reports and preliminary financial statements are translated into English and all language versions are published simultaneously on our website. The annual reports are translated into English shortly af-ter the publication of the Swedish language version.
INTERESTED PARTIES can subscribe to both financial reports and press releases via our website: www.al.se. The site also provides updated information on our operations, our properties and pro-jects, financial key ratios, the share, and much more besides. The information on the website is also available in English.
Interim report Jan–June 2018 10/07/2018 at 8.30
Interim report Jan–Sep 2018 19/10/2018 at 8.30
2018 Preliminary Financial Statements Feb. 2019
2018 Annual Report Mar. 2019
PUBLICATION OF FINANCIAL INFORMATION

Box 4200, SE-131 04 Nacka. Street address: Smedjegatan 2 CTel: 08-615 89 00, [email protected] office: Nacka, Corporate ID no.: 556175-7047 www.al.se At
rium
Lju
ngbe
rg, A
pril
2018
. Im
ages
: Wal
k th
e R
oom
AB
, Sw
eco
and
Mar
tin K
elam
. Pro
duct
ion:
Bra
ndFa
ctor
y, St
ockh
olm
, 310
306.


![[XLS] · Web viewSK BERANGKOK 4159S603 SEK KEB JANANG 4159S604 SEK KEB KERUKAN 4159S605 SEK KEB KILUGUS 4159S606 SEK KEB PEKAN KUALA PENYU 4159S607 SEK KEB MANSUD 4159S608 SEK KEB](https://static.fdocuments.net/doc/165x107/5ad871107f8b9af9068d884d/xls-viewsk-berangkok-4159s603-sek-keb-janang-4159s604-sek-keb-kerukan-4159s605.jpg)


