JANUARY Ð MARCH 2018 - volkswagenag.com
64
JANUARY – MARCH 2018 Interim Report
Transcript of JANUARY Ð MARCH 2018 - volkswagenag.com

J A NUA RY – M A RCH 2018
Interim Report

1 U PDATED I N FORMATION 7 I NTERIM M ANAGEMENT REPORT
23 BRAN DS AN D BUSI N ESS FI ELDS
27 I NTERIM CONSOLI DATED FI NANCIAL STATEMENTS (CON DENSED)
1 Key Facts
2 Key Events 7 Volkswagen Shares
8 Business Development 16 Result of Operations, Finan- cial Position and Net Assets 22 Outlook
27 Income Statement 28 Statement of Comprehensive Income 29 Balance Sheet 30 Statement of Changes in Equity 31 Cash Flow Statement 32 Notes to the Interim Consolidated Financial Statements 60 Review Report
All figures shown in the Report are rounded, so minor discrepancies may arise from addition of these amounts. The figures from the previous fiscal year are shown in parentheses directly after the figures for the current reporting period.
VO L K SWA G E N G R O U P
Q1
2018 20171 %
Volume Data2 in thousands
Deliveries to customers (units) 2,680 2,495 +7.4
Vehicle sales (units) 2,769 2,610 +6.1
Production (units) 2,727 2,738 –0.4
Employees (on March 31, 2018/Dec. 31, 2017) 648.1 642.3 +0.9
Financial Data (IFRSs), € million
Sales revenue 58,228 56,197 +3.6
Operating result 4,211 4,367 –3.6
Operating return on sales (%) 7.2 7.8
Earnings before tax 4,477 4,592 –2.5
Return on sales before tax (%) 7.7 8.2
Earnings after tax 3,300 3,373 –2.2
Automotive Division3
Total research and development costs 3,356 3,370 –0.4
R&D ratio (%) 6.7 7.0
Cash flows from operating activities 5,455 835 x
Cash flows from investing activities attributable to operating activities4 3,018 3,418 –11.7
of which: capex 1,918 1,840 +4.2
capex/sales revenue (%) 3.9 3.8
Net cash flow 2,437 –2,583 x
Net liquidity at March 31 24,294 23,645 +2.7
1 Prior-year figures were adjusted due to changes of the International Financial Reporting Standards (IFRSs). 2 Volume data including the unconsolidated Chinese joint ventures. These companies are accounted for using the equity method. Prior-year deliveries updated to reflect
subsequent statistical trends. 3 Including allocation of consolidation adjustments between the Automotive and Financial Services divisions. 4 Excluding acquisition and disposal of equity investments: Q1 €3,080 (€3,161) million.
Key Figures

Updated Information 1Key Facts
> Volkswagen Group reports a good start to fiscal year 2018
> Volkswagen Group deliveries to customers rise to 2.7 (2.5) million vehicles; growth in Europe, North and South America as well as in the Asia-Pacific region
> Group sales revenue up by €2.0 billion to €58.2 billion due to volume-related factors; negative exchange rate effects as expected
> Operating profit of €4.2 (4.4) billion; since 2018, fair value measurement for derivatives to be recorded in this item has reduced operating profit by €0.3 billion; positive volume effects are partly offset by the lower capitalization ratio for development costs
> Profit before tax down slightly on the previous year at €4.5 (4.6) billion
> Automotive Division’s net cash flow up by €5.0 billion to €2.4 billion due to considerably lower cash outflows attributable to the diesel issue; capex ratio of 3.9 (3.8)%
> Net liquidity in the Automotive Division of €24.3 billion at a robust level
> Exciting products:
- Volkswagen Passenger Cars celebrates the world premiere of the new Touareg; I.D. VIZZION study reveals further potential of the all-electric I.D. family
- Audi presents the new generation of the A6 and gives a glimpse of the brand’s first all-electric premium SUV with the Audi e-tron prototype
- ŠKODA unveils the updated Fabia for the first time - SEAT showcases the dynamic Leon CUPRA R ST and the all-electric touring car, the
CUPRA e-Racer - Bentley’s Bentayga Hybrid is the world’s first luxury hybrid vehicle - Porsche debuts the 911 GT3 RS, a high-performance sports car, and the concept version
of the Mission E Cross Turismo - Lamborghini celebrates the trade fair premiere of the Urus, the world’s first super-SUV
Key Facts
2 Updated InformationKey Events
M OTO R S H O W S A N D E V E N T S
The Volkswagen Group brands presented impressive new products at numerous motor shows and events in the first quarter of 2018. North American International Auto Show in Detroit
At the North American International Auto Show in Detroit, the Volkswagen Passenger Cars brand celebrated the world premiere of the new Jetta. Among other things, the seventh generation of the bestseller features assistance systems such as Front Assist, which monitors the vehicle’s surroundings, and Blind Spot Sensor, which is a lane-change assistant. The coupé-shaped body is reminiscent of a sporty Gran Turismo. As one of the first vehicles in its class on the US market, Volkswagen also offers the Jetta with the digital Active Info Display, which is connected to the infotainment system. The efficient 1.4 TSI engine generates 110 kW (150 PS) of power. As an alternative to the standard six-gear manual, the Jetta is also available with a newly developed eight-speed automatic gearbox. Geneva International Motor Show
In a world premiere at the Geneva International Motor Show, the Volkswagen Passenger Cars brand showed off its I.D. VIZZION concept vehicle – the new flagship of the electric-powered I.D. family. With the I.D. VIZZION, Volkswagen is defining the saloon car of tomorrow and beyond: self-driving, effortless to operate thanks to augmented reality, and capable of learning through artificial intelligence. The vehicle takes comfort, safety and sustainability to a new dimension. With the I.D. VIZZION, Volkswagen is under-scoring the potential of the new technical basis it has devel-oped for the I.D. family – the Modular Electrification Toolkit (MEB). The spacious interior breaks the usual boundaries of premium vehicles in the five-meter category. The electric all-wheel drive with two electric motors has a system power output of 225 kW (306 PS) and a range of up to 665 km.
Audi presented the new A6, the eighth generation of its successful premium saloon. Together with the A8 and A7 Sportback, the A6 is a distinguished ambassador for the new Audi design language. With taut surfaces, sharp edges and striking lines, the A6 conveys sporty elegance, cutting-edge technology and sophistication. The interior features an all-digital control system and sets new trends for the segment. The MMI touch response system with haptic and acoustic feedback is quick and intuitive to use. The highlights of the driver assistance systems include the parking and garage pilot and the adaptive driving assistant, which keeps the vehicle in lane when driving through narrow lanes and
roadworks. The new dynamic all-wheel steering combines direct, sporty steering response with superior driving stability and reduces the saloon’s turning circle by up to 1.1 meters. For the European launch, Audi is offering the new A6 with two powerful and smooth-running engines: a 3.0 TFSI with 250 kW (340 PS) and a 3.0 TDI with 210 kW (286 PS). For greater comfort and efficiency, both engines are fitted with a mild hybrid system as standard. Audi also used the Geneva International Motor Show to present the concept version of its first all-electric model: the Audi e-tron. The sporty premium SUV accommodates five people and plenty of luggage – the available space and comfort are equivalent to a typical Audi premium model. With a range suitable for long journeys and comprehensive charging options, customers can drive on pure electric power without compromises. At fast-charging stations with up to 150 kW of charging capacity, the SUV is charged and ready for the next leg of a long-distance drive after just 30 minutes. The production version of the Audi e-tron will launch on the European market at the end of 2018.
ŠKODA also used Geneva to look to the future of motoring with the world premiere of the VISION X: As well as the Czech brand’s new design, the crossover concept vehicle showcases an innovatively configured hybrid system with combined natural gas, petrol and electric drive. Designed for especially high sustainability, the drive system provides spontaneous power delivery, greater agility and low emission levels. CO2 emissions are just 89 g/km. Drivers of the VISION X can select front-wheel, rear-wheel or all-wheel-drive modes. The VISION X is also the first ŠKODA all-wheel-drive vehicle to dispense with the cardan shaft, thereby reducing both weight and fuel consumption. The extensively revised ŠKODA Fabia was also on show in Geneva for the first time. A modified front and rear design creates an elegant yet modern and dynamic exterior. Inside, a newly designed instrument cluster and updated seating provide a fresh appearance. The range of driver assistance systems and ‘Simply Clever’ details has also been expanded once again. The exclusive top-of-the-range Kodiaq Laurin & Klement and new equipment options for the Superb and Octavia RS rounded off ŠKODA’s appearance at the motor show.
SEAT’s stand in Geneva focused especially on the new SEAT Leon CUPRA R ST with its 221 kW (300 PS) 2.0 TSI engine, 4Drive all-wheel-drive and DSG transmission. Painted in attractive magnetic gray, the model stands out with its exclusive 19-inch wheels and imposing front bumper with redesigned side air intakes. Carbon-fiber elements are featured on the front and rear ends, exterior mirror housings and side sills. The SEAT Ibiza with its efficient natural gas
Key Events
Updated Information 3Key Events
drive and the presentation of the digital SEAT cockpit were further highlights. The sporty CUPRA range made its world debut on a dedicated stand, presenting the world’s first all-electric touring car: the environmentally friendly CUPRA e-Racer. With CUPRA, SEAT underlines its commitment to motor sports and will take over responsibility for its motor sport and racing activities in the future. Another highlight was the CUPRA Ateca, which made its first public appearance in Geneva.
With the Mission E Cross Turismo, Porsche used the Geneva International Motor Show to present a concept version of an electric-powered crossover utility vehicle. The strengths of the four-door Cross Turismo include the emotive design with striking off-road elements and new display and control interfaces featuring touchscreens and eye-tracking control. The 4.95-meter-long concept vehicle with all-wheel drive has an 800-volt architecture and can make use of the fast-charging network. It can also charge via induction, at charging stations or using the Porsche home energy storage system. One of today’s most extreme high-performance sports cars also made its debut: the Porsche 911 GT3 RS. It generates 383 kW (520 PS) from its 4 l engine and accelerates from 0 to 100 km/h in 3.2 seconds. The top speed is an impressive 312 km/h.
Bentley showed off the world’s first luxury hybrid vehicle in Geneva: the Bentayga Hybrid sets Bentley on the path toward a fully electric vehicle and combines the serenity of silent motoring with exquisite comfort and effortless per-formance. At the heart of the plug-in hybrid model are two energy sources: a highly efficient electric motor and a new turbocharged 3.0 l V6 petrol engine. The electric motor, which also acts as a generator, offers a maximum range of 50 km in pure electric mode. With CO2 emissions of 75 g/km, the Bentayga Hybrid is the company’s most efficient model to date. It feels and rides like a true Bentley, providing the refinement, effortless performance and exquisite interior for which the British luxury brand is famed.
Lamborghini celebrated the motor show premiere of the new Urus series. With the world’s first super-SUV, Lamborghini is carving out a new niche in the luxury segment: with pio-neering performance and driving dynamics, unique design, luxury and, at the same time, everyday practicality in every situation. The Urus has a 4.0 l V8 twin-turbo with 478 kW (650 PS) of power, accelerating the vehicle from 0 to 100 km/h in 3.6 seconds. With a top speed of 305 km/h, it is the world’s fastest SUV. Lamborghini also presented the Huracán Performante Spyder, which combines technological inno-vation and performance in an impressive open-air driving experience. With its 470 kW (640 PS) 5.2 l V10 naturally aspirated engine, the all-wheel-drive Performante Spyder sprints from 0 to 100 km/h in 3.1 seconds.
Bugatti presented the world premiere of the Chiron Sport in Geneva, the distinguishing features of which include a firmer chassis, an even more dynamic appearance and a weight saving of 18 kg compared to the base version.
Audi, Italdesign and Airbus used the Geneva International Motor Show to showcase the “Pop.Up Next”: an all-electric, fully automated concept for horizontal and vertical mobility. Looking to the distant future, it aims to solve traffic problems by transporting people in major cities quickly and comfort-ably on the road and in the air. The ultra-lightweight, two-seater passenger cabin can be combined with a car or flight module. Audi is supporting the project with its expertise in battery technology and automation.
The Volkswagen Group also presented the latest version of its mobility concept for fully automated driving: the Sedric School Bus. With the vehicle reminiscent of a school bus design inside and out, the Group is underlining Sedric’s importance in incorporating ideas from across different brands for sustainable, safe and comfortable mobility, also for the latest generation.
Touareg World Premiere in Beijing
The Volkswagen Passenger Cars brand made a statement by staging the first world premiere of a new model in China, its largest market: the new Touareg marks a milestone in the brand’s model and technology initiative. With its expressive design, equipment and high-quality materials and craftsman-ship, it plays a leading role in the premium SUV segment. It is moderately longer and wider than its predecessor, and the new dimensions improve both the vehicle’s proportions and interior space. Boot capacity, for example, has been expanded from 697 to 810 liters. The new Touareg has an impressively large range of assistance, handling and convenience systems. They include technologies such as the Nightvision assistance system (detects people and animals in darkness using a thermal imaging camera), Traffic Jam and Roadwork Lane Assist (enables semi-automated driving up to 60 km/h), Front Cross Traffic Assist (reacts to traffic crossing in front of the vehicle), active all-wheel steering, new roll stabilization, IQ.Light – Matrix LED headlights (interactive, camera-based dipped and main-beam headlight control) and a head-up display projected directly onto the windscreen. Volkswagen is presenting the fully digitalized Innovision Cockpit for the first time in the new Touareg. Here the digital instrument cluster and a top infotainment system, ‘Discover Premium’, are merged to form a new digital control, information, communication and entertainment unit that needs hardly any conventional buttons or switches. In Europe, Volkswagen will initially offer two V6 diesel engines for the new Touareg in 2018 with outputs of 170 kW (231 PS) and 210 kW (286 PS). In some markets, this will also be followed by a V6 petrol

4 Updated InformationKey Events
engine with 250 kW (340 PS) and a V8 turbo diesel with 310 kW (421 PS) of power. A new plug-in hybrid drive with a system power output of 270 kW (367 PS) is also being planned. New York International Auto Show
The Volkswagen Passenger Cars brand continued its SUV campaign at the New York International Auto Show, pres-enting two concept cars that could expand the Atlas family in future: the Atlas Cross Sport and Atlas Tanoak. The Atlas Cross Sport is a five-seater version of the normally seven-seater Atlas. It has an impressively sporty, compact, coupé-style rear end and has a plug-in hybrid drive with a system power output of 265 kW (360 PS). The Atlas Tanoak is the brand’s first pick-up based on the Modular Transverse Toolkit (MQB). With a length of 5.44 meters, it is classed as a mid-size pick-up in the USA. The loading space of the five-seater, double-cab vehicle is over 1.60 meters long and 1.45 meters wide. Many functions in the Tanoak are operated digitally, with the infotainment system touchscreen and digital instru-ment cluster merging to form a digitalized cockpit landscape.
Audi presented the RS 5 Sportback for the first time in New York. The progressive five-door high-performance model combines emotional design and high practicality with superior driving performance. The 2.9 TFSI V6 Biturbo with 331 kW (450 PS) offers strength and efficiency. The Audi RS 5 Sportback will initially arrive at dealers in the second half of 2018 throughout the USA and Canada, followed by the market launch in Europe.
AWA R D S
The British magazine What Car? awarded accolades to a total of eight models by Volkswagen Group brands in early 2018. The Volkswagen Passenger Cars brand won an award for the Touran in the Best MPV category. The Audi brand impressed the jury with its Audi TT, A4 and Q7 models in the Best Coupé, Best Executive Car und Best Luxury SUV categories. ŠKODA won awards in the Best Estate Car and Best Family Car categories with the Superb Estate and Octavia. SEAT received awards for the Ibiza and Arona in the Best Small Car and Best Small SUV categories.
In the January 2018 magazine’s readers’ choice awards, “Best Cars 2018” by auto motor und sport magazine, three Volkswagen Passenger Cars models were at the forefront: up!, Polo and Golf triumphed in the categories minicars, small cars and compact cars. Audi secured first place in the medium-sized cars category with its A5 Sportback. The Multi-van of the Volkswagen Commercial Vehicles brand prevailed against the competition in the vans category. Porsche took the top spots in the luxury category with the Panamera and in the sports car as well as convertible categories with the 911. The SEAT Alhambra proved convincing in the imported vans category. ŠKODA’s Octavia and Karoq won the com- pact and compact SUV categories for imported vehicles.
Readers chose from a total of 385 models in 11 categories worldwide.
Also in January 2018, the US magazine Car and Driver crowned the Audi Q7 as the Best Mid-Size Luxury SUV for the second time in a row in the vote for the “10 Best Trucks & SUVs”. The jury was impressed by the practicality and driving dynamics as well as innovative technologies and the connectivity. The Porsche Macan’s S, GTS and Turbo variants successfully defended the model’s top place in the Best Compact Luxury SUV category, convincing the jury with its sportiness and driving dynamics.
In January 2018, Audi received prizes at the Edmunds CES Tech Driven Awards for the “Most Innovative Automaker” and “Most Innovative Infotainment system”. According to the expert jury, the Audi AI traffic jam pilot was decisive to Audi’s victory as the most innovative automotive manufacturer. Porsche won the “Most Innovative Driver Assist Feature” prize. Edmunds, the leading automotive sales website in the USA, and the Consumer Electronics Show (CES) use the awards to recognize innovative thinking and forward-looking tech-nologies in the automotive industry.
At the North American International Auto Show in Detroit in January 2018, the experts at Cars.com, a leading automotive website, chose the Atlas and Golf GTI from the Volkswagen Passenger Cars brand to receive the awards in the categories Best of 2018 and Most Fun-to-Drive Car of the Year. The Audi A4 was also victorious in the Luxury Car of the Year category.
In March 2018, the Multivan won the “Motor Klassik Award 2018” presented by Motor Klassik magazine. From six age categories and nine vehicle categories, readers were asked to choose their classic of the year, future classic, design and technology milestones and auction car of the year. The Multivan was chosen as the future classic.
In late March 2018, the Volkswagen Polo won the renowned “World Urban Car of the Year” prize at the New York International Auto Show. With the prize the jury highlights vehicles that are particularly suited to the challenges of dense traffic in major cities and metropolitan areas. Audi won in the World Luxury Car category with its A8. The “World Car Awards” are presented once a year, with more than 80 international motoring journalists from 24 countries voting for the best new cars on the world market.
The industry magazines VerkehrsRundschau and Trucker bestowed the “Green Truck Award” upon Scania for its R500 truck model at the end of the first quarter of 2018. With fuel consumption of less than 25 liters per 100 kilometers, the R500 was the most fuel-efficient vehicle in the benchmark test.
In March 2018, MAN Truck & Bus won the “XING New Work Award 2018” in the established companies category for its Future Lab project in Munich. The prize goes to companies that have initiated particularly innovative models for tomor- row’s world of work. This novel office concept pursues an

Updated Information 5Key Events
open-space approach and is divided into different zones that are individually tailored to the most diverse of work situ-ations. A N N I V E R S A R I E S
At Volkswagen Poznan's Antoninek plant in Poland, the two-millionth Caddy rolled off the production line in March 2018 – a fourth-generation Caddy Maxi in candy white. Approxi-mately 165,000 Caddys were built in the past year alone, a record since Volkswagen Poznan was established in 1993. PA RT N E R S H I P S
The Volkswagen Group and Aurora Innovation, a US company specializing in autonomous driving, announced their strate-gic partnership at the CES in Las Vegas, USA, in early January 2018. The aim of the collaboration is, among other things, to bring self-driving electric vehicles to cities in the form of mobility fleets – with the highest safety requirements, best user experience and digital intelligence.
Scania formed a partnership with Haylion Technologies in February 2018. The cooperation partners’ aim is to collec-tively promote the commercial use of applications for auton-omous driving. Scania and Haylion are focusing on China, where Haylion already currently belongs to the leading pro-viders for innovative solutions for public transportation.
Volkswagen's Gläserne Manufaktur in Dresden and start-up company Wandelbots announced a novel joint project on human-robot collaboration (HRC) in March 2018 at the South by Southwest technology festival in Austin, Texas, USA. The aim is to create an innovative testing station at the Gläserne Manufaktur. This will test new HRC applications and make them ready for production. The activities in Dresden will extend to assembly, logistics and maintenance for production of Volkswagen’s e-Golf.
MAN Truck & Bus AG and Solera Holdings Inc., a company offering digital technologies to protect and connect vehicles,
properties and identities entered a partnership in March 2018 to digitalize after-sales processes in the commercial vehicles business. In future, MAN will use Solera’s “Digital Garage” platform to further promote connectivity in after-sales. VO L K SWA G E N G R O U P R E O R G A N I Z E S E N E R GY S U P P LY
In March 2018, the Volkswagen Group announced it will com-pletely modernize the Company’s two large power plants in Wolfsburg and convert them from coal to gas operation. In the course of this modernization, several new gas and steam turbines will replace the existing coal-fired boilers. Approxi-mately €400 million is being invested, with the new plants expected to be online between 2021 and 2022. The new, highly efficient gas turbines for the power plants in Wolfsburg will sustainably reduce CO2 emissions from electricity and heat generation by approximately 1.5 million tonnes a year. VO L K SWA G E N R AT I N G O U T LO O K L I F T E D
In March 2018, the rating agency Moody’s confirmed Volks-wagen AG’s short- and long-term ratings of Prime-2 and A3, and lifted the outlook from negative to stable. This was due above all to the strong operating performance. A stable rating backed by sound financial figures is key to the Volkswagen Group’s financial flexibility when financing itself on the capital markets. S U P E R V I S O RY B O A R D M AT T E R S
Effective February 5, 2018, Ms. Annika Falkengren stepped down from her post as a member of the Volkswagen AG Super-visory Board. Effective February 14, 2018, the Braunschweig Registry Court temporarily appointed Ms. Marianne Heiß as a member of the Supervisory Board until the end of the Annual General Meeting on May 3, 2018. The Supervisory Board will propose electing Ms. Heiß as a member of the Supervisory Board at the Annual General Meeting on May 3, 2018.

6 Updated InformationKey Events
R E V I S I O N O F V O L K SWA G E N G R O U P M A N A G E M E N T ST R U C T U R E
The Board of Management and Supervisory Board of Volks-wagen AG have resolved to extensively revise the Group’s management structure. In order to sustainably implement the new structure, there have been a number of changes on the Board of Management. Mr. Matthias Müller stepped down from the Group Board of Management by mutual agreement, effective April 12, 2018. Mr. Herbert Diess has been appointed as his successor as chairman of the Board of Management. Mr. Diess will continue to manage the Volkswagen Passenger Cars brand with the assistance of a chief operating officer, who will be responsible for daily operations. In addition, Mr. Gunnar Kilian has taken over the responsibility for Human Resources and Organization from Mr. Karlheinz Blessing. Mr. Blessing has also left the Group Board of Management by mutual agreement. Mr. Francisco Javier Garcia Sanz, head of Procurement, has left the Company at his own request. Mr. Oliver Blume, Chairman of the Board of Management of Dr. Ing. h.c. F. Porsche AG, has been appointed as a new member of the Group Board of Management.
In the future, the Volkswagen Group will be divided into six operating units and the China region. These operating units will include the new “Volume”, “Premium” and “Super
Premium” brand groups, the “Truck & Bus” brand group and the Procurement/Components and Financial Services busi-ness fields.
The “Volume” brand group will comprise the Volkswagen Passenger Cars, SEAT, ŠKODA, Volkswagen Commercial Vehi-cles and MOIA brands. Audi will be in the “Premium” brand group. The “Super Premium” brand group will comprise the Porsche, Bentley and Bugatti brands. Volkswagen Truck & Bus will remain the umbrella company for Scania, MAN and RIO. The assignment of Lamborghini, Ducati and Power Engineer-ing is currently being reviewed. The new structure will lay the foundations for streamlining Group management, strength-ening the brands and giving them greater responsibility. This will enable synergies to be leveraged more systematically and will speed up decision-making and implementation.
Those responsible for the brand groups will be taking on additional Group management roles. Mr. Diess will be responsible for, among other things, Group Research and Development as well as Vehicle IT, Mr. Stadler for Group Sales, and Mr. Blume for Group Production. In addition, Mr. Witter will be in charge of Company IT. Procurement and Compo-nents are to be combined into one unit going forward.

Interim Management Report 7Volkswagen Shares
In the period from January to March 2018, predominantly declining prices were seen on the international equity mar-kets amid volatile trading.
The DAX recorded a drop compared with the end of 2017. Uncertainty regarding the strong euro, the economic policy of the US government and the monetary policy of the US Federal Reserve as well as the European Central Bank, had a lasting negative impact on share listings. The promising eco-nomic performance of important industrialized nations and the formation of a government in Germany had a positive impact.
In 2018, Volkswagen AG’s preferred and ordinary share prices followed the decreasing market trend amid high volatility. Share listings were negatively impacted, especially by uncertainty about future regulatory framework for diesel and electric vehicles.
Information and explanations on earnings per share can be found in the notes to the interim consolidated financial
statements. Additional Volkswagen share data, plus corporate news, reports and presentations can be downloaded from our website at www.volkswagenag.com/ir. VO L K SWA G E N K E Y S H A R E F I G U R E S A N D M A R K E T I N D I C E S F R O M
J A N UA RY 1 TO M A R C H 3 1 , 2 0 1 8
90
95
100
105
110
D J F M A M J J A S O N D
90
95
100
105
110
Volkswagen ordinary shares –3.6%Volkswagen preferred shares –3.0%
DAX –6.4%EURO STOXX Automobiles & Parts +1.0%
P R I C E D E V E L O P M E N T F R O M D E C E M B E R 2 0 1 7 T O M A R C H 2 0 1 8Index based on month-end prices: December 31, 2017 = 100
Volkswagen Shares
High Low Closing
Ordinary share Price (€) 188.00 155.60 162.60
Date Jan. 22 Mar. 23 Mar. 29
Preferred share Price (€) 188.50 153.54 161.38
Date Jan. 22 Mar. 5 Mar. 29
DAX Price 13,560 11,787 12,097
Date Jan. 23 Mar. 26 Mar. 29
ESTX Auto & Parts Price 656 578 599
Date Jan. 22 Mar. 26 Mar. 29

Business Development 8 Interim Management Report
G E N E R A L E CO N O M I C D E V E LO P M E N T
The global economy saw solid growth in the first three months of 2018. The average expansion rate of gross domes-tic product (GDP) was up year-on-year in both the advanced and the emerging market economies. Energy and commodity prices increased in most cases compared with the prior-year period amid a still comparatively low interest rate level.
Between January and March 2018, the economy of Western Europe recorded solid growth on the whole, though the rates of change were mixed in both Northern European and Southern European countries.
In Germany, the optimism among consumers and com-panies and the strong labor market situation allowed the economy to maintain the growth trend in the reporting period.
In the economies of Central Europe, growth rates remained relatively high in the first quarter of 2018. The year-on-year increase in energy prices fostered a healthy economy in Eastern Europe. Russia’s economy slowly continued its economic recovery.
South Africa saw its GDP growth rate rise in the first three months of 2018 in spite of ongoing structural deficits and political challenges.
The US economy maintained its growth trajectory in the reporting period, with considerable stimulus being provided by private domestic demand. Based on the stable situation in the labor market and the expected inflation trend, the US Federal Reserve decided once again to raise its key interest rate. While Canada achieved a slightly higher growth rate compared with the corresponding prior-year period, the momentum in Mexico slowed.
Brazil left behind the economic downswing and contin-ued the growth seen in the preceding quarters; the situation in South America’s largest economy nevertheless remained tense. Amid sustained high inflation, Argentina’s economic situation showed an improvement.
The high growth momentum in the Chinese economy remained virtually unchanged during the reporting period. India expanded strongly, outperforming most emerging mar-kets. Japan registered solid GDP growth, approximately on a level with fiscal year 2017.
D J F M A M J J A S O N D
90
95
100
105
110
115
90
95
100
105
110
115
EUR to GBPEUR to USDEUR to CNY
EUR to JPY
E X C H A N G E R A T E M O V E M E N T S F R O M D E C E M B E R 2 0 1 7 T O M A R C H 2 0 1 8Index based on month-end prices: as of December 31, 2017= 100
Business Development

Interim Management Report 9Business Development
T R E N D S I N T H E PA S S E N G E R C A R M A R K E T S
The global demand for passenger cars rose further (+2.4%) in the period from January to March 2018, thus exceeding the previous year’s first-quarter figure for the ninth year in a row. While Western Europe fell short of the prior-year level, the number of new vehicle registrations increased particularly in the Asia-Pacific, South America as well as Central and Eastern Europe regions.
In Western Europe, passenger car demand in the reporting period fell slightly short of the prior-year quarter’s level. New vehicle registrations were mixed in the largest single markets. Attractive incentive programs in particular led to a double-digit growth rate in the Spanish market. In France, the increase in passenger car sales was underpinned by the positive macroeconomic environment. By contrast, the slight decline in new registrations in Italy was mainly driven by the sharp drop in consumer demand. In the United Kingdom, new registrations were down considerably on the record level seen in the same quarter in the previous year – due among other things to the change in vehicle taxation as of April 1, 2017, as well as the uncertain outcome of the exit negotiations between the EU and United Kingdom. The share of new registrations for diesel vehicles (passenger cars) in Western Europe slipped to 38.5 (46.4)% in the reporting period.
In Germany, the demand for passenger cars in the first three months of this year was higher than in the prior-year period. In addition to the solid economic situation, sales incentives from dealers, particularly in the form of an environmental bonus, underpinned the best first quarter in 18 years. The above-average increase in private registrations further contributed to this positive result.
In the Central and Eastern Europe regions, the number of passenger cars sold rose further in the reporting period compared with the prior-year quarter. The EU markets in Central Europe mostly recorded positive rates of change. The demand for passenger cars also increased in Eastern Europe, especially on the back of double-digit growth of the Russian market, which was supported by government purchase incentive programs and improved consumer confidence.
In the passenger car market in South Africa, new passen-ger car registrations fell short of the comparable prior-year figure in the first quarter of 2018. The reason behind the lowest overall market level of the last eight years in the period from January to March was primarily due to weak consumer confidence resulting from political uncertainty.
In North America, sales of passenger cars and light commercial vehicles (up to 6.35 tonnes) in the first three months of 2018 were slightly up on the prior-year level. In the USA, market growth was driven by the favorable labor market and the higher purchasing power of American consumers. This was accompanied by the continued shift in demand from traditional passenger cars to light commercial vehicles such as SUV and pickup models in the reporting period. The upward trend in the Canadian automotive market continued.
The overall market recorded a new all-time high for the first quarter. Mexico by contrast registered a significant drop in sales compared with the record figure for the same prior-year period.
In South America, new registrations for passenger cars and light commercial vehicles in the first three months of 2018 witnessed a significant improvement on the previous year’s low level. The Brazilian market picked up the pace and saw the continuation of the recovery in the demand for automobiles that began during 2017. However, the number of new vehicle registrations was substantially lower than the record level achieved in the first quarter of 2013. Demand for passenger cars and light commercial vehicles in Argentina registered substantial growth. The highest-ever level of unit sales for the period from January to March was supported by positive parameters as well as favorable pricing conditions.
The Asia-Pacific region also recorded by far the highest absolute increase in demand in the first quarter of 2018. Once again, the growth driver was the Chinese passenger car mar-ket, which expanded above average, despite the conclusion of the tax break for vehicles with engine sizes of up to 1.6 liters at the end of 2017. The sustained high demand for SUV models was largely responsible for the positive impact on growth. Record passenger car sales were also recorded in India for the first quarter of 2018. The perceptible growth was particularly due to relief caused by the standardized goods and services tax introduced throughout the country on July 1, 2017, coupled with attractive price and financing options. By contrast, the Japanese passenger car market remained below the comparable prior-year volume in the reporting period. The decline was due, among other things, to the subsiding impact stemming from the introduction of new models.
T R E N D S I N T H E M A R K E T S F O R C O M M E R C I A L V E H I C L E S
Global demand for light commercial vehicles was on a level with the previous year in the period from January to March 2018.
Due to the uncertainty caused by the United Kingdom’s referendum on leaving the European Union in June 2016, new registrations in Western Europe were slightly lower than the prior-year level. In the reporting period, demand in Germany was also down slightly year-on-year.
Registrations of light commercial vehicles in Central and Eastern Europe recorded a noticeable increase compared with the previous year. Registrations in Russia between January and March 2018 were slightly higher than in the previous year.
In North and South America, the light vehicle market is reported as part of the passenger car market, which includes both passenger cars and light commercial vehicles.
In the Asia-Pacific region, demand for light commercial vehicles declined slightly compared with the previous year. Registration volumes in China, the region’s dominant market, were down moderately on the prior-year level. The number of new vehicle registrations in Australia, India and Thailand saw a significant increase compared with the previous year.

Business Development 10 Interim Management Report
In the markets that are relevant for the Volkswagen Group, global demand for mid-sized and heavy trucks with a gross weight of more than six tonnes was above the prior-year figure between January and March 2018.
Demand in Western Europe saw a slight increase over the 2017 level. New registrations in Germany, Western Europe’s largest market, were slightly lower year-on-year in the first quarter of 2018. While demand in the United Kingdom decreased perceptibly, it developed very significantly in Italy, the Netherlands and Spain.
In the Central and Eastern Europe region, the positive economic performance led to much higher registration vol-umes than in the previous year. Above all, demand in Russia recorded a strong increase on the back of the continued recov-ery of the economy and demand for replacement vehicles.
The volume of registrations in South America was sharply higher than in the first quarter of 2017. In Brazil, the region’s largest market, demand for trucks grew very sharply com-pared with the very low figure for the prior-year period as a consequence of the economic recovery. A substantial increase in registration volumes was also seen in Argentina thanks to the improvement in the economic situation.
Demand for buses in the markets that are relevant for the Volkswagen Group was above the prior-year level in the period from January to March 2018. The markets in South America as well as in Central and Eastern Europe contributed in par-ticular to this growth. T R E N D S I N T H E M A R K E T S F O R P O W E R E N G I N E E R I N G
The markets for power engineering are subject to differing regional and economic factors. Consequently, their business growth trends are generally independent of each other.
In the first quarter of 2018, the marine market saw a con-tinuation of the muted order activity and at a low level only improved slightly compared with the prior-year period. A slight recovery was noticeable in the transport sector, despite the excess market capacity which still exists in container shipping. Demand for cruise ships, passenger ferries, fishing vessels, dredgers and government vessels remained steady. In the offshore sector, the still low oil price in conjunction with the existing excess capacity curbed investment in offshore oil production. On account of low market volumes, all market segments are continuing to experience considerable compet-itive pressure and a sharp drop in prices as a result.
The market for power generation showed a slight recovery compared with the same period the previous year. Slightly higher demand was registered in all areas of application. Demand for energy solutions remains high, with a strong trend towards greater flexibility and decentralized avail-ability. The shift away from oil-fired power plants towards
dual-fuel and gas-fired power plants continued. Particularly on larger projects, order placement was delayed due to sustained muted economic growth in key emerging markets and to persistently difficult financing conditions for custom-ers. In addition, continued strong pressure from competition and pricing is discernible in all projects, and is having a negative impact on the earnings quality of orders.
The market for turbomachinery was somewhat higher than the low level seen in the previous year. Thereby, par-ticularly the key markets of the raw materials, oil, gas and processing industry experienced a slight increase in demand. In power generation, excess capacity continued to place immense pressure on competition and pricing.
The marine and power plant after-sales business for diesel engines performed positively overall and benefited from a continued increase in interest in long-term maintenance contracts. The after-sales market for turbomachinery came under pressure and was slightly down year-on-year.
T R E N D S I N T H E M A R K E T S F O R F I N A N C I A L S E R V I C E S
Automotive financial services remained in high demand in the first quarter of 2018, due primarily to the positive devel-opment of the overall market for passenger cars and the persistently low key interest rates in the main currency areas.
Higher vehicle sales gave a boost to the European market. Particularly in Western and Central Europe, more financial services products were sold. Financing and leasing were the options preferred by customers, especially for purchases of new vehicles. After-sales products such as inspection con-tracts, maintenance and spare parts agreements and auto-motive-related insurance also remained in high demand in the first three months of 2018.
In Germany, the share of loan-financed or leased new vehi-cles remained stable at a high level in the reporting period. There was greater demand for after-sales products, and demand for integrated mobility solutions in the business customer segment also continued to rise.
Demand for financing and insurance products in South Africa was steady.
In the US market and in Mexico, automotive financial services also remained in high demand in the first three months of 2018
The Brazilian market picked up the pace and saw a con-tinuation of the recovery in the demand for automobiles that began during 2017. However, the consumer credit business and sales of the country-specific financial services product Consorcio, a lottery-style savings plan, remained stable in the first quarter of 2018. The Argentinian market also built on last year’s positive development. In addition to traditional financing and leasing products, a new form of financing established itself that is tied to the index of inflation.

Interim Management Report 11Business Development
Demand for automotive financial services across the Asia-Pacific region was mixed. In China, the proportion of loan-financed vehicle purchases rose compared with the prior-year period. Despite increasing restrictions on registrations in metropolitan areas, there is considerable potential to acquire new customers for automotive-related financial services, par-ticularly in the interior of the country. A somewhat weaker demand for vehicle financing contracts was seen in Japan.
Demand for financial services in the commercial vehicles business area also varied from region to region. The positive trend from 2017 continued in China and particularly in Western Europe. The truck and bus business and the related financial services market have stabilized in Brazil.
VO L K SWA G E N G R O U P D E L I V E R I E S
In the first quarter of 2018, the Volkswagen Group delivered 2,679,775 vehicles to customers worldwide. This was 7.4% or 184,823 more units than in the prior-year period. In March, the Group recorded the highest number of unit sales in a single month. The chart on page 13 shows the trend in deliveries worldwide by month compared with the previous year. Separate details of deliveries of passenger cars and commercial vehicles are provided in the following. VO L K SWA G E N G R O U P D E L I V E R I E S
F R O M J A N UA RY 1 TO M A R C H 3 1 1
2018 2017 %
Passenger Cars 2,511,848 2,327,210 +7.9
Commercial Vehicles 167,927 167,742 +0.1
Total 2,679,775 2,494,952 +7.4
1 Prior-year deliveries have been updated to reflect subsequent statistical trends. The figures include the Chinese joint ventures.
PA S S E N G E R C A R D E L I V E R I E S WO R L D W I D E
From January to March 2018, global demand for passenger cars from the Volkswagen Group rose to 2,511,848 vehicles, an increase of 7.9% year-on-year. The passenger car market as a whole grew somewhat slower in the same period, at 2.4%. The Volkswagen Passenger Cars (+5.9%) and Audi (+9.8%) brands both recorded the best first quarter in their company’s history. Furthermore, the ŠKODA (+11.7%) and SEAT (+18.7%) brands in particular developed very encour-agingly. Porsche, Lamborghini and Bugatti also increased their delivery volumes. In the regions of Western Europe, Central and Eastern Europe, North America, South America and Asia-Pacific, demand for passenger cars from the Volks-wagen Group was significantly higher than the correspond-ing prior-year figure in some cases. We recorded the highest absolute increase in the Asia-Pacific region.
The table on the next page provides an overview of passenger car deliveries to customers by market in the reporting period. Sales trends in the individual markets are as follows. Deliveries in Europe/Other markets
In Western Europe, we delivered 852,530 Group models to customers in the reporting period in a slightly shrinking overall market, an increase of 4.2% – this in spite of the fact that customer confidence has not been fully restored follow-ing the diesel issue and the public discussion on driving bans for diesel vehicles has generated uncertainty among cus-tomers. The Golf saloon, Audi Q2, Audi Q5 and Porsche 911 models saw encouraging growth. In addition, the new Polo, T-Roc, Tiguan Allspace and Arteon models from the Volkswagen Passenger Cars brand, the ŠKODA Karoq and Kodiaq and the SEAT Arona and Ibiza were very popular. The Volkswagen Group’s share of the passenger car market in Western Europe rose to 21.7 (20.7)%.
In the German market, demand for passenger cars from the Volkswagen Group recovered in the first three months of 2018, rising by 4.5% year-on-year. The market as a whole grew by 4.0% in the same period. The Golf, Passat Estate and Audi Q2 models achieved the strongest growth in demand. Moreover, the new T-Roc, Tiguan Allspace and Arteon models from the Volkswagen Passenger Cars brand, the ŠKODA Karoq and Kodiaq and the SEAT Arona and Ibiza were highly sought after. Six Group models led the Kraftfahrt-Bundesamt (KBA – German Federal Motor Transport Authority) registration statistics in their respective segments: the up!, Polo, Golf, Tiguan, Touran and Passat. In the first quarter of 2018, the Golf was again the most popular passenger car in Germany in terms of registrations.
The Volkswagen Group handed over 11.6% more vehicles to customers in the still-expanding passenger car markets in the Central and Eastern Europe region between January and March of this year compared to the previous year. While Russia and Poland continued to see strong growth in demand for Group models in some cases, our sales figures in the Czech Republic tapered off slightly. Demand for the Polo, Tiguan, ŠKODA Fabia, ŠKODA Rapid and ŠKODA Octavia models was particularly encouraging. The new T-Roc, ŠKODA Kodiaq and SEAT Ateca models were also very popular. In Central and Eastern Europe, the Volkswagen Group’s share of the market was 21.8 (23.0)%.
In the declining passenger car market in South Africa, the number of Volkswagen Group vehicles sold in the reporting period was 8.1% lower than in the same period of the pre-vious year. The Polo remained the best-selling Group model in South Africa.
Deliveries in North America
Demand for Volkswagen Group models in North America in the first quarter of 2018 rose by 3.9% year-on-year in a slightly growing overall passenger car and light commercial vehicle
Business Development 12 Interim Management Report
market. The Group achieved a market share of 4.5 (4.4)% in this region. The Tiguan Allspace replaced the Jetta as the most sought-after Group model in North America.
Between January and March 2018, the Volkswagen Group delivered 9.9% more vehicles to customers in the USA than in the previous year. The market as a whole grew less strongly in this period. Demand remained highest for models in the SUV and pickup segments. The Audi Q3, Audi Q5 and Porsche Panamera models recorded the highest growth rates. In addition, the new Tiguan Allspace and Atlas SUVs from the Volkswagen Passenger Cars brand and the Audi A5 Sportback were particularly popular among customers.
In Canada, where the overall market is still growing, the number of deliveries to Volkswagen Group customers rose sharply in the first three months of 2018 compared with the previous year (+25.6%). The Golf saloon and Audi Q5 models as well as the new Tiguan Allspace and Atlas SUVs from the Volkswagen Passenger Cars brand witnessed especially strong demand.
In Mexico, demand for Volkswagen Group vehicles in the reporting period was down by as much as 17.9% on the prior-year figure. The market as a whole was also weaker. Sales figures of the Polo, Saveiro and Tiguan Allspace models developed encouragingly.
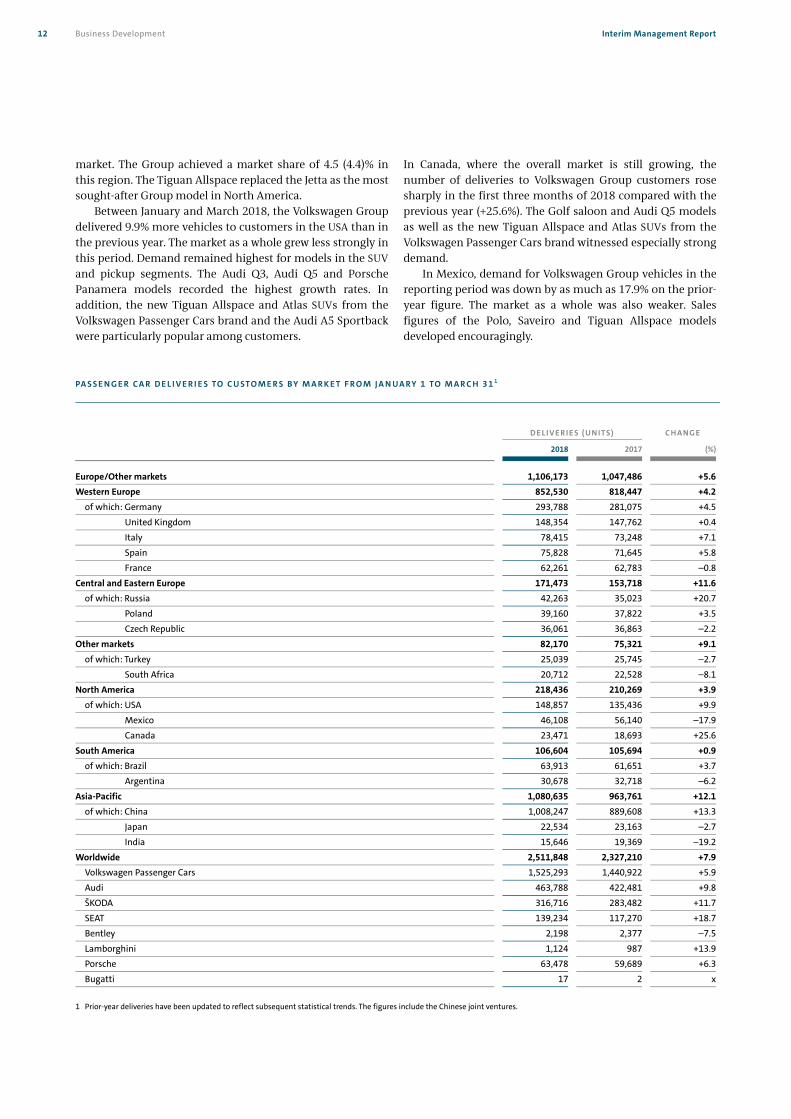
PA S S E N G E R C A R D E L I V E R I E S TO C U STO M E R S B Y M A R K E T F R O M J A N UA RY 1 TO M A R C H 3 1 1
D E LI V E R I E S ( UN I T S) C H A N G E
2018 2017 (%) Europe/Other markets 1,106,173 1,047,486 +5.6
Western Europe 852,530 818,447 +4.2
of which: Germany 293,788 281,075 +4.5
United Kingdom 148,354 147,762 +0.4
Italy 78,415 73,248 +7.1
Spain 75,828 71,645 +5.8
France 62,261 62,783 –0.8
Central and Eastern Europe 171,473 153,718 +11.6
of which: Russia 42,263 35,023 +20.7
Poland 39,160 37,822 +3.5
Czech Republic 36,061 36,863 –2.2
Other markets 82,170 75,321 +9.1
of which: Turkey 25,039 25,745 –2.7
South Africa 20,712 22,528 –8.1North America 218,436 210,269 +3.9
of which: USA 148,857 135,436 +9.9
Mexico 46,108 56,140 –17.9
Canada 23,471 18,693 +25.6
South America 106,604 105,694 +0.9
of which: Brazil 63,913 61,651 +3.7Argentina 30,678 32,718 –6.2
Asia-Pacific 1,080,635 963,761 +12.1
of which: China 1,008,247 889,608 +13.3
Japan 22,534 23,163 –2.7
India 15,646 19,369 –19.2
Worldwide 2,511,848 2,327,210 +7.9
Volkswagen Passenger Cars 1,525,293 1,440,922 +5.9
Audi 463,788 422,481 +9.8
ŠKODA 316,716 283,482 +11.7
SEAT 139,234 117,270 +18.7
Bentley 2,198 2,377 –7.5
Lamborghini 1,124 987 +13.9Porsche 63,478 59,689 +6.3
Bugatti 17 2 x
1 Prior-year deliveries have been updated to reflect subsequent statistical trends. The figures include the Chinese joint ventures.

Interim Management Report 13Business Development
Deliveries in South America
The South American markets for passenger cars and light commercial vehicles also continued their upward trend at the beginning of 2018. From January to March of this year, the Volkswagen Group delivered 0.9% more vehicles to customers there than in the prior year. The Group’s share of the market in South America was 10.8 (11.9)%.
The Brazilian market also continued its recovery. The Volkswagen Group benefited from this trend, delivering 3.7% more vehicles to customers there in the first quarter of this year than in the preceding year. The Suran and Amarok models saw the strongest growth. The new Polo and Virtus models were also highly sought after.
In Argentina, Group sales in the first three months of 2018 fell 6.2% short of the prior-year figure in an overall market showing marked growth. The Gol and the Amarok saw the highest demand of all Group models.
Deliveries in the Asia-Pacific region
In the Asia-Pacific region, the market as a whole continued to grow at a slightly weaker pace in the first quarter of 2018. Here, the Volkswagen Group delivered considerably more
vehicles to customers than in the previous year with an increase of 12.1%. The Group’s share of the market in this region amounted to 11.7 (10.9)%.
In the passenger car market in China, which is experi-encing above-average growth, the Group saw demand jump to 13.3% year-on-year in the reporting period. The Lamando, Santana, Audi A4, Audi A6, Audi Q3, Audi Q5 and Porsche Panamera models registered the highest growth rates. In addition, the new C-Trek, Tiguan Allspace, Phideon and ŠKODA Octavia Combi models and the new Teramont and ŠKODA Kodiaq SUVs were very popular. The ŠKODA Karoq was successfully rolled out.
The Indian passenger car market recorded a noticeable rise in demand in the first three months of 2018. Sales of Group models fell short of the prior-year figure by 19.2%. The Polo was the Group’s best-selling model in India.
In Japan, the number of passenger cars delivered to Group customers between January and March 2018 decreased less sharply year-on-year than overall market demand. Sales figures of the Golf and Tiguan models developed encour-agingly.
600
700
800
900
1,000
1,100
J F M A M J J A S O N D
600
700
800
900
1,000
1,100
2018201720182017
V O L K S W A G E N G R O U P D E L I V E R I E S B Y M O N T HVehicles in thousands

Business Development 14 Interim Management Report
CO M M E R C I A L V E H I C L E D E L I V E R I E S
The Volkswagen Group handed over a total of 167,927 com-mercial vehicles to customers worldwide in the first quarter of 2018 (+0.1%). Trucks accounted for 46,774 (+11.1%) units and buses for 5,112 (+35.6%) units. Deliveries of light commer-cial vehicles decreased by 4.8% year-on-year to 116,041 units.
In Western Europe, sales declined by 7.2% to a total of 101,883 units. Of this figure, 78,486 were light commercial vehicles, 22,178 were trucks and 1,219 were buses. The Caddy and Transporter were the most sought-after Group models in the Western European markets.
We delivered 17,458 vehicles to customers in the markets in Central and Eastern Europe in the period from January to March 2018 (+9.9%); of this figure, 9,064 were light commer-cial vehicles, 7,923 were trucks and 471 buses. The Caddy and Transporter were the Group models experiencing the highest demand. In Russia, the region’s largest market, sales climbed in the wake of economic recovery year-on-year by 42.4% to 3,873 units.
In Other markets, deliveries of Volkswagen Group com-mercial vehicles rose by 13.2% to a total of 14,323 units: 9,774 light commercial vehicles, 3,615 trucks and 934 buses.
Sales in North America fell to 2,612 units (–23.8%) and were handed over exclusively to customers in Mexico; of this figure, 1,819 were light commercial vehicles, 247 were trucks and 546 buses.
Deliveries in South America grew to a total of 22,060 units (+36.9%); this included 11,092 light commercial vehicles, 9,487 trucks and 1,481 buses. The Amarok was particularly popular. Following continued improvement in the difficult economic climate in Brazil, we were able to increase our sales by 54.8%. Of the units delivered, 2,415 were light commercial vehicles, 7,034 were trucks and 787 were buses.
In the Asia-Pacific region, the Volkswagen Group sold 9,591 vehicles in the reporting period; 5,806 light commercial vehicles, 3,324 trucks and 461 buses. This was 3.1% less than in the previous year. The Transporter and the Amarok were the most popular Group models. In China, sales were up 21.3% on the previous year at 2,354 vehicles. Of this total, 1,502 were light commercial vehicles, 744 were trucks and 108 were buses.
CO M M E R C I A L V E H I C L E D E L I V E R I E S TO C U STO M E R S B Y M A R K E T 1
D E LI V E R I E S ( UN I T S) C H A N G E
2018 2017 (%)
Europe/Other markets 133,664 138,302 – 3.4
Western Europe 101,883 109,766 – 7.2
Central and Eastern Europe 17,458 15,881 +9.9
Other markets 14,323 12,655 +13.2
North America 2,612 3,426 – 23.8
South America 22,060 16,113 +36.9
of which: Brazil 10,236 6,613 +54.8
Asia-Pacific 9,591 9,901 – 3.1
of which: China 2,354 1,941 +21.3
Worldwide 167,927 167,742 +0.1
Volkswagen Commercial Vehicles 114,706 121,871 – 5.9
Scania 22,640 20,656 +9.6
MAN 30,581 25,215 +21.3
1 Prior-year deliveries have been updated to reflect subsequent statistical trends.

Interim Management Report 15Business Development
D E L I V E R I E S I N T H E P O W E R E N G I N E E R I N G S E G M E N T
Orders in the Power Engineering segment are usually part of major investment projects. Lead times typically range from just under one year to several years, and partial deliveries as construction progresses are common. Accordingly, there is a time lag between incoming orders and sales revenue from the new construction business.
In the period from January to March 2018, sales revenue in the Power Engineering segment was largely driven by Engines & Marine Systems and Turbomachinery, which together generated more than two-thirds of overall sales revenue.
G R O U P F I N A N C I A L S E R V I C E S
The Financial Services Division includes the Volkswagen Group’s dealer and customer financing, leasing, banking and insurance activities, fleet management and mobility offer-ings. The division comprises Volkswagen Financial Services and the financial services activities of Scania, Porsche and Porsche Holding Salzburg.
The Financial Services Division’s products and services remained very popular in the first quarter of 2018. At 1.8 (1.7) million, the number of new financing, leasing, service and insurance contracts signed worldwide exceeded the prior-year figure. The ratio of leased or financed vehicles to Group deliveries (penetration rate) in the Financial Services Division’s markets amounted to 32.6 (32.7)% in the reporting period. On March 31, 2018, the total number of contracts was 19.1 million, up 3.7% compared with the end of 2017.
In the Europe/Other markets region, the number of new contracts signed in the first three months of 2018 rose by 8.8% to 1.4 million. The total number of contracts increased to 13.7 million as of March 31, 2018, up 2.3% compared with December 31, 2017; the Customer Financing/Leasing area accounted for 6.5 million contracts (+2.1%).
The number of contracts in North America amounted to 2.7 (2.7) million at the end of the reporting period, on a level with December 31, 2017. The Customer Financing/Leasing area recorded 1.8 (1.8) million contracts. The number of new contracts signed amounted to 213 thousand, an increase of 10.6% versus the prior-year period.
In South America, 50 (46) thousand new contracts were concluded in the period from January to March 2018. At the end of March, the total number of contracts was 504 thou-
sand, 6.3% lower than on December 31, 2017. The contracts mainly related to the Customer Financing/Leasing area.
The number of new contracts signed in the Asia-Pacific region was 212 thousand, thus exceeding the prior year by 21.9%. On March 31, 2018, the total number of contracts was 2.2 million, up 21.7% compared with the end of 2017. The Customer Financing/Leasing area accounted for 1.5 million contracts (+2.7%).
S A L E S TO T H E D E A L E R O R G A N I Z AT I O N
In the first three months of 2018, the Volkswagen Group’s unit sales to the dealer organization (including the Chinese joint ventures) rose by 6.1% to 2,768,945 vehicles, in partic-ular on the back of higher demand in China, Europe and South America. Unit sales outside Germany increased by 6.4% in the reporting period, while in the German market they exceeded the prior-year figure by 3.8%. Vehicles sold in Ger-many as a proportion of overall sales declined to 12.1 (12.4)%. P R O D U C T I O N
The Volkswagen Group produced a total of 2,726,609 vehicles in the period from January to March 2018, a decrease of 0.4% year-on-year. Production in Germany declined by 2.9% to 646,198 units. The proportion of vehicles produced in Ger-many decreased to 23.7 (24.3)%. I N V E N TO R I E S
Global inventories at Group companies and in the dealer organization were higher on March 31, 2018 than at year-end 2017, but lower than the corresponding prior-year figure. E M P L OY E E S
The Volkswagen Group had 622,662 active employees on March 31, 2018. A further 8,394 employees were in the passive phase of their partial retirement. An additional 17,048 young people were in vocational traineeships. At the end of the first three months of 2018, the Volkswagen Group had a total of 648,104 employees worldwide, up 0.9% on the number as of December 31, 2017. The main contributors to this were the volume-related expansion, the recruitment of specialists inside and outside Germany and the expansion of the workforce in our new plants in China. At 288,728, the number of employ-ees in Germany was up 0.4% on year-end 2017. The propor-tion of employees in Germany declined slightly to 44.5 (44.8)%.

Results of Operations, Financial Position and Net Assets 16 Interim Management Report
A P P L I C AT I O N O F N E W I N T E R N AT I O N A L F I N A N C I A L R E P O RT I N G
STA N DA R D S
The application of IFRS 9 “Financial Instruments” and IFRS 15 “Revenue from Contracts with Customers” became manda-tory as of January 1, 2018.
IFRS 9 changes the accounting requirements for classi-fying and measuring financial assets, for impairment of financial assets, and for hedge accounting. Some of the fair value measurement gains and losses on derivatives, which were previously reported under the financial result, are now reported directly in sales revenue and other operating income. This will have a more significant impact on operating profit.
IFRS 15 specifies new accounting rules for revenue recognition. In this context, the way income from the reversal of provisions and accrued liabilities is reported was also adjusted; these items were allocated to those functions in which they were originally recognized.
The situation described above has led to, among other things, adjustments to prior-year figures in the income statement. Cost of sales, distribution and administrative expenses and the net other operating result required adjust-ments in connection with the change in the way reversals of provisions are reported; sales revenue and operating profit were unchanged. The application of IFRS 9 led to minor adjustments to the financial result and consequently also to profit before tax, income tax expense and profit after tax.
R E S U LT S O F O P E R AT I O N S O F T H E G R O U P
In the first three months of 2018, the Volkswagen Group generated sales revenue of €58.2 billion, up 3.6% on the prior-year period. Volume improvements were offset by negative exchange rate effects. The effects of applying the new International Financial Reporting Standards largely offset each other. Sales revenue generated abroad accounted for a share of 80.1 (80.0)%.
Gross profit was €11.6 (11.4) billion, slightly up on the previous year. The gross margin amounted to 19.9 (20.3)%.
In the first quarter of 2018, the Volkswagen Group’s operating profit was €4.2 billion, down €0.2 billion on the prior-year level. The operating return on sales declined to 7.2 (7.8)%. The fair value measurement gains and losses on certain derivatives, which have had to be reported here since
the beginning of the year, reduced operating profit by €0.3 billion. In addition a lower capitalization ratio for development costs had a negative impact. The main positive effect resulted from the increase in volume. At €0.3 (0.2) billion, the financial result was on a level with the previous year. Lower interest expenses and the positive effects from the measurement of derivative financial instruments on the reporting date which are used to hedge financing transactions were largely offset by the negative effect of foreign currency measurement. The share of profits and losses of equity-accounted investments was lower than in the previous year, when the remeasurement of the interest in HERE following the acquisition of shares by additional investors had a positive impact. The share of profits and losses of equity-accounted investments in the Chinese joint ventures was slightly up on the previous year.
The Volkswagen Group’s profit before taxes decreased by €0.1 billion year-on-year, to €4.5 billion. Profit after tax was down by €0.1 billion to €3.3 billion.
R E S U LT S O F O P E R AT I O N S I N T H E PA S S E N G E R C A R S , CO M M E R C I A L
V E H I C L E S A N D P O W E R E N G I N E E R I N G B U S I N E S S A R E A S F R O M
J A N UA RY 1 TO M A R C H 3 1
€ million 2018 2017
Passenger Cars
Sales revenue 40,298 38,640
Operating result 3,077 3,299
Operating return on sales (%) 7.6 8.5
Commercial Vehicles
Sales revenue 8,679 8,402
Operating result 536 499
Operating return on sales (%) 6.2 5.9
Power Engineering
Sales revenue 766 783
Operating result –42 –30
Operating return on sales (%) –5.4 –3.8
Results of Operations, Financial Position and Net Assets

Interim Management Report 17Results of Operations, Financial Position and Net Assets
1 Before special items from the third quarter of 2017 onward.
Results of operations in the Automotive Division
Sales revenue in the Automotive Division amounted to €49.7 billion in the first quarter of 2018; the 4.0% year-on-year increase was primarily attributable to higher vehicle sales. Negative exchange rate effects had a reducing impact. Sales revenue in the Passenger Cars and Commercial Vehicles Business Areas was up on the prior-year quarter, while the Power Engineering Business Area was down. As our Chinese joint ventures are accounted for using the equity method, the Group’s performance in the Chinese passenger car market is mainly reflected in consolidated sales revenue only through deliveries of vehicles and vehicle parts.
Cost of sales as well as its ratio to sales revenue increased, mainly as a result of higher volumes and higher research and development costs recognized in profit or loss; product cost improvements had an offsetting effect. Total research and development costs as a percentage of the Automotive Divi-sion’s sales revenue (research and development ratio or R&D ratio) amounted to 6.7 (7.0)% in the first three months of 2018.
Distribution expenses as well as their ratio to sales revenue decreased in the period from January to March 2018 compared with the previous year. This was attributable to reclassifications of expenses to sales revenue required as a result of the new IFRS 15, the sale of the PGA Group in June 2017 as well as exchange rate effects. Administrative expenses rose in the first quarter of 2018, their ratio to sales revenue increased slightly. At €–0.3 (0.4) billion, the net other operating result was down markedly on the prior-year period, mainly due to exchange rate effects, as well as to the fair value measurement gains and losses on derivatives to which hedge accounting is not applied; these gains and losses have had to be reported here since the beginning of the year.
The Automotive Division’s operating result of €3.6 billion generated in the first quarter of 2018 was €0.2 billion lower than in the previous year. In particular, the rise in vehicle sales was offset by higher research and development costs recognized in profit or loss (due primarily to a decline in capitalized upfront expenditure). The fair value measurement gains and losses on certain derivatives, which have had to be reported here since the beginning of the year, also had a negative impact. The operating return on sales amounted to 7.2 (7.9)%. Since the profit recorded by joint ventures is accounted for in the financial result using the equity method, the business growth of our Chinese joint ventures is primarily reflected in the operating profit only through deliveries of vehicles and vehicle parts, and through license income. Results of operations in the Financial Services Division
In the period from January to March 2018, the Financial Services Division generated sales revenue of €8.5 billion. The 1.3% increase was mainly attributable to a rise in business volumes.
Cost of sales increased more slowly than sales revenue, rising by €0.1 billion to €6.9 billion. Distribution expenses and their ratio to sales revenue decreased slightly. Admin-istrative expenses rose slightly, while their ratio to sales revenue was virtually unchanged. The rise in expenses compared with the previous year was mainly attributable to higher volumes.
The operating profit of the Financial Services Division improved by 6.6% to €0.6 billion. The operating return on sales amounted to 7.5 (7.2)%.
Q1 Q2 Q3 Q4
0
1,000
2,000
3,000
4,000
20181
20171
0
1,000
2,000
3,000
4,000
20181
20171
O P E R A T I N G P R O F I T B Y Q U A R T E RVolkswagen Group in € million

Results of Operations, Financial Position and Net Assets 18 Interim Management Report
F I N A N C I A L P O S I T I O N O F T H E G R O U P
In the reporting period, the Volkswagen Group’s gross cash flow of €8.6 (9.8) billion was down on the first quarter of 2017. The €4.9 billion change in working capital to €–4.6 billion mainly reflects the significant year-on-year decrease in cash outflows attributable to the diesel issue. Cash flows from operating activities improved considerably compared with the previous year, to €4.0 (0.3) billion.
The Volkswagen Group’s investing activities attributable to operating activities declined year-on-year to €3.2 (3.5) bil-lion. The “Acquisition and disposal of equity investments” item had been impacted in particular by the acquisition of shares in Navistar in the prior-year period.
Cash inflows from financing activities amounted to €2.4 (9.7) billion.
At the end of March 2018, the Volkswagen Group’s cash and cash equivalents reported in the cash flow statement amounted to €21.5 (27.3) billion.
The Group’s net liquidity stood at €–117.7 billion on March 31, 2018, as against €–119.1 billion at the end of 2017.
Financial position of the Automotive Division
In the first quarter of 2018, the Automotive Division generated gross cash flow of €6.5 (7.3) billion. The decrease was primarily attributable to the fact that, in the previous year, the dividend receivable from the Chinese joint venture FAW-Volkswagen was already recognized in the first quarter. At €–1.1 billion, the negative impact on the change in working capital was €5.4 billion lower than in the previous year, mainly because of markedly lower cash outflows attributable to the diesel issue and the dividend receivable recognized in the previous year. Cash flows from operating activities consequently increased to €5.5 (0.8) billion.
At €3.0 billion, the Automotive Division’s investing activities attributable to operating activities were €0.4 billion lower than in the previous year. Investments in property, plant and equipment, investment property and intangible assets, excluding capitalized development costs (capex), increased slightly year-on-year to €1.9 (1.8) billion, while the ratio of capex to sales revenue was virtually unchanged, at 3.9 (3.8)%. We invested primarily in our production facilities and in models to be launched in 2018 and 2019, as well as in the ecological focus of the model range, drivetrain electrifi-cation and modular toolkits. Capitalized development costs decreased to €1.2 (1.4) billion. In the “Acquisition and dis-posal of equity investments” item, the investment in the newly established joint venture with Anhui Jianghuai Auto-mobile (JAC) was offset by the partial sale of shares in There Holding. The prior-year figure included the acquisition of the shares in Navistar.
F I N A N C I A L P O S I T I O N O F T H E PA S S E N G E R C A R S , CO M M E R C I A L
V E H I C L E S A N D P O W E R E N G I N E E R I N G B U S I N E S S A R E A S F R O M
J A N UA RY 1 TO M A R C H 3 1
€ million 2018 2017
Passenger Cars
Gross cash flow 5,406 6,319
Change in working capital –499 –6,211
Cash flows from operating activities 4,907 108
Cash flows from investing activities attributable to operating activities –2,591 –2,804
Net cash flow 2,316 –2,696
Commercial Vehicles
Gross cash flow 1,044 952
Change in working capital –499 –272
Cash flows from operating activities 546 680
Cash flows from investing activities attributable to operating activities –402 –582
Net cash flow 143 98
Power Engineering
Gross cash flow 87 42
Change in working capital –83 5
Cash flows from operating activities 3 47
Cash flows from investing activities attributable to operating activities –25 –32
Net cash flow –22 16
The Automotive Division’s net cash flow improved by €5.0 billion to €2.4 billion, mainly because of significantly lower cash outflows attributable to the diesel issue.
The Automotive Division’s financing activities include the issuance and redemption of bonds and other financial liabilities, and amounted to a total of €–3.1 (8.0) billion.
At the end of the first quarter of 2018, the Automotive Division’s net liquidity was €24.3 billion, €1.9 billion higher than at the end of 2017.
Financial position of the Financial Services Division
The Financial Services Division’s gross cash flow in the period from January to March 2018 was down on the previous year, declining to €2.0 (2.5) billion. Driven by the growth in business volumes, funds tied up in working capital increased by €0.5 billion to €3.5 billion. Cash flows from operating activities amounted to €–1.5 (–0.5) billion.
At €0.1 (0.1) billion, investing activities attributable to operating activities were unchanged on the prior-year figure.
The Financial Services Division’s financing activities resulted in cash inflows amounting to €5.5 (1.7) billion in the

Interim Management Report 19Results of Operations, Financial Position and Net Assets
first three months of 2018; the cash flows were attributable to the issuance and redemption of bonds and other financial liabilities.
At the end of March 2018, the Financial Services Divi-sion’s negative net liquidity, which is common in the indus-try, stood at €–142.0 billion, compared with €–141.5 billion on December 31, 2017.
CO N S O L I DAT E D B A L A N C E S H E E T ST R U C T U R E
At €432.1 billion, the Volkswagen Group’s total assets as of March 31, 2018 exceeded the prior-year figure by 2.3%. The Volkswagen Group’s equity rose by €1.6 billion to €110.7 billion. The equity ratio was 25.6 (25.8)%. The imple-mentation of the new International Financial Reporting Standards led to adjustments to the opening balance sheet of the Volkswagen Group as of January 1, 2018. The amounts as of December 31, 2017 were unchanged, apart from move-ments within equity. Automotive Division balance sheet structure
At the end of the first quarter of 2018, total noncurrent assets in the Automotive Division were on a level with December 31, 2017. Intangible assets remained unchanged, while property, plant and equipment declined slightly. Due to the positive performance of the Chinese joint ventures and the purchase of the shares in the joint venture with JAC, equity-accounted investments were higher than at the end of 2017.
Current assets rose by 5.7%; the inventories included in this figure increased, mainly for production-related reasons. Due to higher volumes, the trade receivables included in current other receivables and financial assets were up significantly. At €15.1 billion, cash and cash equivalents in the Automotive Division at the end of the first three months of 2018 exceeded the figure on December 31, 2017 by 9.1%.
The Automotive Division’s equity stood at €83.1 billion, €1.5 billion more than at the end of 2017. Healthy earnings growth was offset by negative currency translation effects, the non-recurring impact of the first-time application of the new International Financial Reporting Standards and higher actuarial losses from the measurement of pension pro-visions. The noncontrolling interests are mainly attributable to RENK AG and AUDI AG. As these were lower overall than the noncontrolling interests attributable to the Financial Services Division, the figure for the Automotive Division, where the deduction was recognized, was negative.
Noncurrent liabilities were in line with the figure at the previous balance sheet date, amounting to €70.6 (69.8) bil-lion. The noncurrent financial liabilities included in this item
B A L A N C E S H E E T ST R U C T U R E O F T H E PA S S E N G E R C A R S ,
CO M M E R C I A L V E H I C L E S A N D P O W E R E N G I N E E R I N G B U S I N E S S
A R E A S
€ million Mar. 31, 2018 Dec. 31, 2017
Passenger Cars
Noncurrent assets 110,446 111,277
Current assets 63,336 60,052
Total assets 173,782 171,329
Equity 67,340 66,449
Noncurrent liabilities 55,067 55,118
Current liabilities 51,375 49,762
Commercial Vehicles
Noncurrent assets 28,268 27,005
Current assets 18,033 16,908
Total assets 46,301 43,913
Equity 12,826 12,194
Noncurrent liabilities 14,792 13,975
Current liabilities 18,684 17,744
Power Engineering
Noncurrent assets 2,568 2,629
Current assets 3,382 3,250
Total assets 5,950 5,879
Equity 2,912 2,963
Noncurrent liabilities 721 711
Current liabilities 2,317 2,205
decreased, while pension provisions rose as a result of lower interest rates.
At the end of March 2018, current liabilities increased by 3.8% compared with December 31, 2017. Reclassifications from noncurrent to current liabilities due to shorter remaining maturities were among the factors driving the change in current financial liabilities to €–2.9 (–0.5) billion. The figures for the Automotive Division also contain the elimination of intragroup transactions between the Automotive and Financial Services divisions. As the current financial liabilities for the primary Automotive Division were lower than the loans granted to the Financial Services Division, a negative amount was disclosed. Trade payables increased for volume-related reasons. Current other liabilities were considerably higher. The item “put options and compensation rights granted to noncontrolling interest shareholders” primarily comprises the liability for the obligation to acquire the shares held by the remaining free float shareholders of MAN.
At the end of the reporting period, the Automotive Divi-sion’s total assets amounted to €226.0 billion, 2.2% more than on December 31, 2017.

Results of Operations, Financial Position and Net Assets 20 Interim Management Report
Financial Services Division balance sheet structure
The Financial Services Division’s total assets amounted to €206.0 billion at the end of the first quarter of 2018, 2.5% higher than at the end of 2017.
Within noncurrent assets, which at €122.4 (121.2) billion were slightly higher than on December 31, 2017, noncurrent receivables increased, driven mainly by the growth in business.
Current assets rose by 4.7%. Due particularly to the revised classification of financial instruments resulting from IFRS 9, other receivables and financial assets, which are included in this item, had to be reclassified from financial services receivables to trade receivables and were therefore higher than at the end of 2017; this led to a significant decrease in financial services receivables. Cash and cash equivalents also declined. At the end of the reporting period, the Financial Services Division accounted for approximately 47.7 (47.6)% of the Volkswagen Group’s assets.
On March 31, 2018, equity in the Financial Services Divi-sion amounted to €27.6 billion, 0.6% more than at the end of the last fiscal year. The equity ratio was 13.4 (13.7)%.
Noncurrent liabilities decreased by 3.8%, mainly due to lower noncurrent financial liabilities.
Total current liabilities grew by 8.8%, with a significant rise in current financial liabilities, which are included in this item; trade payables were also higher.
At €31.4 (31.4) billion, no change was recorded in deposits from the direct banking business at the end of the first quarter of 2018 compared to the end of 2017.
R E P O RT O N E X P E C T E D D E V E LO P M E N T S , R I S K S A N D
O P P O RT U N I T I E S
For certain T6 models (M1 class) with Euro 6 diesel engines registered as passenger cars, the inspection regarding the conformity of the current production of new vehicles with the approved type (conformity of production) identified that certain technical data could not be fully confirmed. To ensure this conformity of production for new vehicles, Volkswagen AG developed a software measure, which was approved by the Kraftfahrt-Bundesamt (KBA – German Federal Motor Trans-port Authority) at the end of February 2018, and was applied to the production of new vehicles as well as (a total of approximately 30,000) new vehicles that had not been delivered by then. Volkswagen AG is also conducting in-use tests to determine whether the around 200,000 T6 used vehicles already on the market conform to the technical data. The tests being carried out on the proposal of Volkswagen AG are taking place in close collaboration with the KBA, which included this process in a decision dated March 1, 2018. Results are expected to be available in summer 2018.
On March 2, 2018, the federal multi district litigation court in California dismissed in its entirety the first amended class action complaint alleging that these bonds were trading at artificially inflated prices and that the value of these bonds declined after the U.S. Environmental Protection Agency (EPA) issued its “Notices of Violation,” but granted leave to file a further amended complaint. On April 2, 2018, plaintiffs filed a second amended class action complaint.
On March 5, 2018, a Tennessee state court granted in part and denied in part a motion to dismiss the state environ-mental claims asserted against Volkswagen AG and certain affiliates by the Tennessee Attorney General. Volkswagen has moved for an interlocutory appeal of the decision.
On March 12, 2018, a Minnesota state court granted in part and denied in part a motion to dismiss the state environ-mental claims asserted against Volkswagen AG and certain affiliates by the Minnesota Attorney General. Volkswagen has appealed the decision.
On March 15, 2018, co-lead counsel for plaintiffs with regard to the: German Automotive Manufacturers Antitrust Litigation filed consolidated amended class action com-plaints against Volkswagen AG and certain affiliates as well as other manufacturers in the Northern District of California on behalf of putative classes of indirect and direct purchasers. The consolidated amended complaints claim that since the 1990s, defendants had engaged in a conspiracy to unlawfully increase the prices of German luxury vehicles by agreeing to share commercially sensitive information and to reach unlawful agreements regarding technology, costs, and suppliers. Moreover Plaintiffs, claim that defendants had agreed to limit the size of AdBlue tanks to ensure that U.S. emissions regulators did not scrutinize the emissions control systems in defendants’ vehicles, and that such agreement for Volkswagen was the impetus for the creation of the defeat device. The complaints further claim that defendants had coordinated to fix the price of steel used in their automobiles by agreeing with German steel manufacturers to apply a two component pricing formula to steel purchases and worked closely together to generate scientific studies aimed at promoting diesel vehicles.
Interim Management Report 21Results of Operations, Financial Position and Net Assets
On March 22, 2018, Volkswagen AG, certain affiliates and the Arizona Attorney General notified an Arizona state court that they have reached a settlement of Arizona’s consumer protection claims and unfair trade practices claims and expect to complete documentation of the settlement within approximately 30 days.
In South Korea, approval for the last vehicle clusters with engine type EA 189 was given on March 28, 2018.
The Ministry of Environment in South Korea qualified certain emissions strategies in the engine control software of various diesel vehicles with a V6 or V8 engine meeting the Euro 6 emission standard as an unlawful defeat device and ordered a recall on April 4, 2018; the same applied to the Dynamic Shift Program (DSP) in the transmission control of a number of Audi models.
On April 11, 2018, a Texas state court granted in part and denied in part a motion for summary judgment on the state environmental claims asserted against Volkswagen AG and certain affiliates by the Texas Attorney General. Volkswagen is pursuing reconsideration or interlocutory appeal of the decision.
On April 16, 2018, the federal multi district litigation court in California dismissed with prejudice state and local environmental claims asserted against certain Volkswagen AG affiliates by the Environmental Protection Commission of Hillsborough County, Florida and Salt Lake County, Florida, on the basis of the same federal preemption issue that is currently being litigated in the Tennessee, Minnesota, and Texas cases referenced above, as well as in several other state courts.
The public prosecutor’s office of Stuttgart has opened a criminal investigation.
On April 18, 2018, the EPA and California Air Resources Board approved the second phase of the emissions modifica-tion for affected 2.0 l TDI vehicles with Generation 3 engines.
Thereby the approval process for the technical measures for the relevant vehicles with engine type EA 189 has now been completed in all countries with the exception of Chile.
On April 19, 2018, the federal multi district litigation court in California approved the stipulation of the parties post-poning the hearing previously scheduled for May 11, 2018, regarding defendants’ motion to dismiss plaintiffs’ consoli-dated class action complaint alleging that defendants con-cealed the existence of defeat devices in Audi brand vehicles with automatic transmissions.
On April 25, 2018, Volkswagen AG, certain affiliates and the Maryland Department of the Environment announced an agreement to resolve the State of Maryland’s environmental and remaining consumer claims for restitution or injunctive relief. The Maryland settlement includes a Consent Decree, which requires approval by the Maryland state court.
In Germany, around 13,000 product-related individual actions brought by customers in connection with the diesel issue are pending against Volkswagen AG and other Volks-wagen Group companies.
Beyond this, there were no significant changes in the reporting period compared with the disclosures on the Volkswagen Group’s expected development in fiscal year 2018 in the “Report on Expected Developments” and “Report on Risks and Opportunities” chapters – including the “Risks from the diesel issue” and “Litigation/Diesel issue” sections and the underlying description of the issues in the chapter entitled “Diesel Issue” – of the combined management report in the 2017 Annual Report or in publications released by the reporting date, as well as the continuing investigations and interviews in connection with the diesel issue and additional important legal cases.
This report contains forward-looking statements on the business development of theVolkswagen Group. These statements are based on assumptions relating to thedevelopment of the economic and legal environment in individual countries and economicregions, and in particular for the automotive industry, which we have made on the basis ofthe information available to us and which we consider to be realistic at the time of goingto press. The estimates given entail a degree of risk, and actual developments may differfrom those forecast. Any changes in significant parameters relating to our key sales
markets, or any significant shifts in exchange rates relevant to the Volkswagen Group, willhave a corresponding effect on the development of our business. In addition, expectedbusiness development may vary if the assessments of the factors influencing sustainablevalue enhancement, as well as risks and opportunities presented in the 2017 AnnualReport develop in a way other than we are currently expecting, or additional risks andopportunities or other factors emerge that affect the development of our business.
Outlook 22 Interim Management Report
The Volkswagen Group’s Board of Management expects the global economy to record slightly weaker growth in 2018. We believe risks will arise from protectionist tendencies, turbulence in the financial markets and structural deficits in individual countries. In addition, growth prospects will continue to be hurt by geopolitical tensions and conflicts. We therefore expect somewhat weaker momentum than in 2017 in both the advanced economies and the emerging markets. We expect the strongest rates of expansion in Asia’s emerging economies.
We expect trends in the passenger car markets in the individual regions to be mixed in 2018. Overall, growth in global demand for new vehicles will probably be slower than in 2017. We anticipate that unit sales volumes in Western Europe will fall slightly short of those seen in the previous year. In the German passenger car market, we estimate that the market volume will be on a level with the previous year. Passenger car demand is expected to substantially exceed the prior-year figures in markets in Central and Eastern Europe. The volume of demand in the markets for passenger cars and light commercial vehicles (up to 6.35 tonnes) in North America is likely to be slightly lower than in the prior year. We expect demand in the South American markets for passenger cars and light commercial vehicles to grow perceptibly as a whole compared with the previous year. The passenger car markets in the Asia-Pacific region look set to continue their growth trajectory in 2018, albeit at a weaker pace.
We expect trends in the markets for light commercial vehicles in the individual regions to be mixed again in 2018. Overall, we envisage a slight dip in demand.
In the markets for mid-sized and heavy trucks that are relevant for the Volkswagen Group and in the relevant markets for buses, new registrations in 2018 are set to rise slightly above the prior-year level.
We believe that automotive financial services will continue to be very important for vehicle sales worldwide in 2018.
The Volkswagen Group is well prepared for the future chal-lenges in the mobility business and the mixed developments in regional automotive markets. Our unique brand portfolio, our presence in all major world markets, our broad, selectively expanded product range and pioneering tech-nologies and services place us in a good competitive position worldwide. In the course of transforming our core business, we will define the positioning of our Group brands more clearly and optimize the vehicle and drive portfolio with a view to the most attractive and fastest-growing market seg-ments. In addition, we are working to make even more focused use of the advantages of our multibrand group by continuously developing new technologies and our toolkits.
We expect that deliveries to customers of the Volkswagen Group in 2018 will moderately exceed the prior-year figure amid continuously challenging market conditions.
Challenges will arise particularly from the economic situation, the increasing intensity of competition, exchange rate volatility and the diesel issue. In the EU, there is also a new, more time-consuming test procedure for determining pollutant and CO2 emissions as well as fuel consumption in passenger cars and light commercial vehicles known as the Worldwide Harmonized Light-Duty Vehicles Test Procedure (WLTP).
We expect the sales revenues of the Volkswagen Group and its business areas to grow by as much as 5% year-on-year. In terms of the operating profit for the Group and the Passenger Cars Business Area, we forecast an operating return on sales in the range of 6.5–7.5% in 2018. For the Commercial Vehicles Business Area, we anticipate an operating return on sales of between 5.0–6.0%. In the Power Engineering Business Area, we expect a lower operating loss than in the previous year. For the Financial Services Division, we are forecasting an operating profit at the prior-year level.
Outlook

Brands and Business Fields 23
S A L E S R E V E N U E A N D O P E R AT I N G P R O F I T B Y B R A N D A N D B U S I N E S S F I E L D
The Volkswagen Group generated sales revenue of €58.2 (56.2) billion in the first quarter of 2018. At €4.2 (4.4) billion, operating profit fell slightly short of the prior-year level.
The Volkswagen Passenger Cars brand sold 912 (862) thou-sand vehicles in the reporting period. The Polo, Touran, Passat and Tiguan models were in high demand. Sales revenue increased by 5.6% to €20.1 billion. Operating profit improved to €879 (869) million. This was mainly attributable to higher volumes and lower product costs. Intense com-petition, exchange rate effects and upfront expenditures for new products, particularly as part of the implementation of the electric campaign, among other things, weighed on per-formance.
The Audi brand’s unit sales amounted to 394 (375) thou-sand vehicles worldwide in the first three months of 2018. Our Chinese joint venture FAW-Volkswagen sold a further 159 (121) thousand Audi vehicles. The Q2, Q5, A4 and A5 models were exceedingly popular. Sales revenue increased to €15.3 (14.4) billion. At €1.3 (1.2) billion, operating profit was higher than in the prior-year period, due mainly to volume improvements and efficiency gains. The financial key perfor-mance indicators for the Audi brand include the Lamborghini
and Ducati brands. Ducati sold 13,850 (14,130) motorcycles in the reporting period.
The ŠKODA brand sold 256 (252) thousand vehicles in the first quarter of this year. Demand grew for the Karoq and Kodiaq models. Sales revenue increased by 4.9% to €4.5 bil-lion. Due to volume and mix effects as well as to cost optimi-zation effects, operating profit rose by 5.3% to €437 million.
The SEAT brand’s unit sales increased by 12.6% to 167 thousand vehicles in the first three months of 2018. This figure includes the Q3 manufactured for Audi. Demand for the new Ibiza and Arona was particularly strong. At €2.8 bil-lion, sales revenue was 11.8% higher than in the same period of the previous year. Operating profit climbed 51.4% to €85 million; thereby, the effects of upfront expenditures for new products and exchange rates were more than compen-sated for by positive volume, price and mix effects.
The Bentley brand sold 2,086 (2,030) vehicles between Jan-uary and March of this year. Sales revenue was down slightly on the figure for the same period in 2017 at €351(361) mil-lion. Operating result amounted to €–44 (–30) million. Posi-tive volume and mix effects were unable to compensate for negative exchange rate effects and delays in the start-up of the new Continental GT.
Brands and Business Fields
V O L K S W A G E N G R O U P R E P O R T I N G S T R U C T U R E
A U T O M O T I V ED I V I S I O N
Passenger Cars Business AreaVolkswagen Passenger Cars
AudiŠKODA
SEATBentley
Porsche AutomotiveOthers
Commercial Vehicles Business AreaVolkswagen Commercial Vehicles
Scania Vehicles and ServicesMAN Commercial Vehicles
Power Engineering Business AreaMAN Power Engineering
F I N A N C I A L S E R V I C E S D I V I S I O N
Dealer and customer financingLeasing
Direct bankInsurance
Fleet managementMobility offerings

24 Brands and Business Fields
Porsche Automotive sold 61 (57) thousand vehicles world-wide in the reporting period. Demand for the Panamera as well as the 911 and 718 sports cars was strong. Sales revenue was higher than in the previous year, at €5.4 (5.0) billion. The operating profit of Porsche Automotive improved on the back of volume and mix effects to €939 (932) million, despite the increase in costs caused by growth as well as lower capitalized upfront expenditures.
Volkswagen Commercial Vehicles sold 117 (119) thousand vehicles worldwide in the first quarter of 2018. Production of the Amarok in South America has been managed by the Volkswagen Passenger Cars brand since the beginning of the year. The Crafter achieved a significant increase. Sales reve-nue increased by 2.4% to €2.9 billion. Operating profit rose by 9.1% to €224 million, due in particular to mix effects, improved price positioning and optimization regarding the cost of materials.
In the first three months of 2018, the Scania brand lifted its unit sales to 23 (21) thousand vehicles. At €3.1 (3.1) billion,
sales revenue was as high as in the same period in 2017. Operating profit improved to €331 (324) million due to vol-ume and exchange rate effects, the enhanced service business also had a positive effect.
MAN Commercial Vehicles sold 31 thousand units in the reporting period, 21.3% more than a year before. Sales reve-nue amounted to €2.8 (2.6) billion. Operating profit declined to €83 (93) million. The positive impact was primarily due to higher volumes, negative effects resulted from increasing competitive pressure and higher expenses, including for research and development.
MAN Power Engineering generated sales revenue of €766 (783) million in the first quarter of 2018. Operating profit consequently declined to €21 (26) million.
In the period from January to March 2018, the operating profit of Volkswagen Financial Services climbed 10.3% to €608 million, due in particular to business growth and improved margins.
K E Y F I G U R E S B Y B R A N D A N D B U S I N E S S F I E L D F R O M J A N UA RY 1 TO M A R C H 3 1 1
V E H I C LE SA LE S S A L E S R E V E N U E O P E R A T I N G R E S U LT
Thousand vehicles/€ million 2018 2017 2018 2017 2018 2017
Volkswagen Passenger Cars 912 862 20,115 19,040 879 869
Audi 394 375 15,320 14,378 1,300 1,244
ŠKODA 256 252 4,547 4,334 437 415
SEAT 167 148 2,782 2,487 85 56
Bentley 2 2 351 361 –44 –30
Porsche Automotive2 61 57 5,438 5,035 939 932
Volkswagen Commercial Vehicles 117 119 2,945 2,875 224 205Scania3 23 21 3,118 3,084 331 324
MAN Commercial Vehicles 31 25 2,771 2,572 83 93
MAN Power Engineering – – 766 783 21 26
VW China4 1,040 971 – – – –
Other5 –233 –223 –7,923 –6,628 –652 –319
Volkswagen Financial Services – – 7,999 7,876 608 551Volkswagen Group 2,769 2,610 58,228 56,197 4,211 4,367
Automotive Division6 2,769 2,610 49,743 47,825 3,572 3,768
of which: Passenger Cars Business Area 2,600 2,445 40,298 38,640 3,077 3,299
Commercial Vehicles Business Area 169 165 8,679 8,402 536 499
Power Engineering Business Area – – 766 783 –42 –30
Financial Services Division – – 8,485 8,372 639 600
1 All figures shown are rounded, so minor discrepancies may arise from addition of these amounts. 2 Porsche (Automotive and Financial Services): sales revenue €5,936 (5,489) million, operating profit €976 (967) million. 3 Including financial services. 4 The sales revenue and operating profits of the joint venture companies in China are not included in the figures for the Group.
These Chinese companies are accounted for using the equity method and recorded a proportionate operating profit of €1,163 (1,112) million. 5 In operating profit, mainly intragroup items recognized in profit or loss, in particular from the elimination of intercompany profits; the figure includes depreciation and amortization of
identifiable assets as part of purchase price allocation for Scania, Porsche Holding Salzburg, MAN and Porsche. 6 Including allocation of consolidation adjustments between the Automotive and Financial Services divisions.

25Brands and Business Fields
U N I T S A L E S A N D S A L E S R E V E N U E B Y M A R K E T
Unit sales of the Volkswagen Group in the Europe/Other mar-kets region rose by 5.0% year-on-year to 1.2 million vehicles in the period from January to March 2018. Sales revenue improved to €36.5 (36.1) billion due to improvements in volumes, while exchange rates had a negative impact.
In North America, the Volkswagen Group increased its unit sales in the reporting period to 216 thousand vehicles, 1.0% more than in the previous year. Volume and mix effects lifted sales revenue by 3.4% to €8.7 billion; exchange rate trends had a negative effect.
In the South American markets, the Volkswagen Group sold 143 (117) thousand vehicles in the first quarter of this year. Sales revenue improved to €2.6 (2.4) billion, mainly due to developments in volumes and the mix. An unfavorable exchange rate trend had a negative effect.
In the Asia-Pacific region – including the Chinese joint ven-tures – we sold a total of 1.2 (1.1) million vehicles in the first three months of 2018. At €9.9 billion, sales revenue was up 6.0% year-on-year; the increase was attributable in particular to a higher import volume as well as to an improved com-ponents business at our consolidated companies. This figure does not include the sales revenue of our equity-accounted Chinese joint ventures.
Since the new accounting standard IFRS 9 was applied on January 1, 2018, income and expenses realized from hedging transactions relating to sales revenue in foreign currency is allocated to sales revenue; in the period from January to March 2018, hedging transactions increased the sales revenue of the Volkswagen Group by €534 million.
K E Y F I G U R E S B Y M A R K E T F R O M J A N UA RY 1 TO M A R C H 3 1 1
V E H I C LE SA LE S S A L E S R E V E N U E
Thousand vehicles/€ million 2018 2017 2018 2017
Europe/Other markets 1,247 1,187 36,519 36,083
North America 216 214 8,735 8,450
South America 143 117 2,572 2,351
Asia-Pacific2 1,163 1,093 9,868 9,313
Hedges on sales revenue – – 534 –
Volkswagen Group2 2,769 2,610 58,228 56,197
1 All figures shown are rounded, so minor discrepancies may arise from addition of these amounts. 2 The sales revenue of the joint venture companies in China is not included in the figures for the Group and the Asia-Pacific market.

26 Brands and Business Fields
VO L K SWA G E N F I N A N C I A L S E R V I C E S
With its innovative products along the automotive value chain, Volkswagen Financial Services supported the Volks-wagen Group’s unit sales in the first quarter of 2018.
Volkswagen Financial Services is driving the further digitalization of its business and has concluded a three-year cooperation agreement with the University of Hildesheim. In addition to the promotion of knowledge transfer and devel-opment of joint research projects in the future field of big data analytics, the university and Europe’s largest automotive financial services provider also intend to strengthen contacts at graduate level. The parties to the agreement aim to imple-ment three joint research projects per year, focusing on applications from insurance and banking as well as digital services.
Furthermore, Volkswagen Financial Services is involved in a Lower Saxony-based founders’ initiative for smart cities, the Hafven Smart City Hub in Hanover. This was established two years ago as an organization for start-ups and young people wishing to share their ideas with others and advance them together in networks. The potential founders receive coaching and mentoring from the relevant partner in the corporate world on selected ideas in areas such as artificial intelligence, augmented and virtual reality or the Internet of things to give their idea the necessary conceptual basis. In the so-called partnering phase, the idea and its development are subse-quently made ready for the market.
Focus Business’s annual ranking once again put Volks-wagen Financial Services AG among Germany’s top employers in 2018. The company also received a special award in the Healthy & Fit category for offerings in the areas of health, work/life balance and nutrition.
According to a study commissioned by Focus Money, the TraviPay parking app developed by sunhill technologies, Volkswagen Financial Services’ smart parking service pro-vider, is one of the best smartphone apps in Germany. A total of 375 apps from 45 different industries were rated. TraviPay beat its competitors in the mobility category, subcategory finding a parking space.
The main refinancing sources for Volkswagen Financial Services are money and capital market instruments, asset-backed securities (ABS) transactions and customer deposits from the direct banking business.
In the first quarter of 2018, Volkswagen Bank GmbH suc-cessfully placed the ABS transaction Driver 14 on the market. It is secured with securitized financing contracts and has a volume of around €900 million.
In addition, Volkswagen Financial Services issued the ABS transaction VCL 26, which comprises securitized leasing con-tracts issued by Volkswagen Leasing GmbH, and has a volume of more than €1.5 billion.
The number of new financing, leasing, service and insur-ance contracts signed in the first three months of 2018 was above the previous year’s level at 1.7 (1.6) million. Based on unchanged credit eligibility criteria, the penetration rate, expressed as the ratio of leased or financed vehicles to relevant Group delivery volumes, amounted to 32.3 (32.4)%. At 17.4 million, the total number of contracts as of March 31, 2018 was 1.1% higher than the 2017 year-end figure. The number of contracts in the Customer Financing/Leasing area rose to 9.7 million, an increase of 1.6% as against Decem-ber 31, 2017. At 7.7 (7.6) million, the number of contracts in the Service/Insurance area was also up on the 2017 year-end level.
As of March 31, 2018, Volkswagen Bank managed around 1.5 (1.5) million deposit accounts.
At the end of the reporting period, Volkswagen Financial Services had a total of 13,920 (13,955) employees.

Interim Consolidated Financial Statements (Condensed) 27Income Statement
Income Statement for the Period January 1 to March 31
V O L K S W A G E N G R OU P D I V I S I ON S
A U T OM O T I V E ¹ F I N A N C I A L SE R V I C E S
€ million 2018 2017³ 2018 2017³ 2018 2017³
Sales revenue 58,228 56,197 49,743 47,825 8,485 8,372Cost of sales –46,657 –44,770 –39,783 –37,965 –6,874 –6,806Gross result 11,570 11,427 9,960 9,860 1,610 1,567Distribution expenses –4,759 –5,313 –4,445 –4,977 –314 –336Administrative expenses –2,125 –1,976 –1,677 –1,537 –448 –439Other operating income/expense –475 230 –267 422 –209 –192Operating result 4,211 4,367 3,572 3,768 639 600Share of the result of equity-accounted investments 829 936 812 941 17 –5Net interest income and other financial result –562 –712 –540 –707 –22 –4Financial result 266 224 272 233 –6 –9Earnings before tax 4,477 4,592 3,844 4,001 633 590Income tax expense –1,178 –1,218 –1,009 –1,090 –169 –128Earnings after tax 3,300 3,373 2,835 2,911 465 463of which attributable to
Noncontrolling interests 1 2 –12 –9 13 12Volkswagen AG hybrid capital investors 77 55 77 55 – –Volkswagen AG shareholders 3,221 3,316 2,769 2,865 452 451
Basic earnings per ordinary share (€)² 6.40 6.59 Diluted earnings per ordinary share (€)² 6.40 6.59 Basic earnings per preferred share (€)² 6.46 6.65 Diluted earnings per preferred share (€)² 6.46 6.65
1 Including allocation of consolidation adjustments between the Automotive and Financial Services divisions. 2 Explanatory information on earnings per share is presented in the “Earnings per share” section. 3 Prior-year figures adjusted (see disclosures on IFRS 9 and IFRS 15).
Interim Consolidated Financial Statements (Condensed)

Statement of Comprehensive Income 28 Interim Consolidated Financial Statements (Condensed)
Statement of Comprehensive Income for the Period January 1 to March 31
€ million 2018 2017¹
Earnings after tax 3,300 3,373
Pension plan remeasurements recognized in other comprehensive income Pension plan remeasurements recognized in other comprehensive income, before tax –845 662Deferred taxes relating to pension plan remeasurements recognized in other comprehensive income 255 –184
Pension plan remeasurements recognized in other comprehensive income, net of tax –590 478Fair Value Valuation of other participations and securities (equity instruments) that will not be reclassified to profit or loss, net of tax –21 57Share of other comprehensive income of equity-accounted investments that will not be reclassified to profit or loss, net of tax 12 –2Items that will not be reclassified to profit or loss –599 533
Exchange differences on translating foreign operations Unrealized currency translation gains/losses –596 214Transferred to profit or loss – 0Exchange differences on translating foreign operations, before tax –596 214Deferred taxes relating to exchange differences on translating foreign operations 4 –9
Exchange differences on translating foreign operations, net of tax –592 205Hedging Fair value changes recognized in other comprehensive income (OCI I) 806 –19Transferred to profit or loss (OCI I) –597 285Cash flow hedges (OCI I), before tax 209 266Deferred taxes relating to cash flow hedges (OCI I) –73 –70
Cash flow hedges (OCI I), net of tax 136 196Fair value changes recognized in other comprehensive income (OCI II) –136 42Transferred to profit or loss (OCI II) –2 –Cash flow hedges (OCI II), before tax –137 42Deferred taxes relating to cash flow hedges (OCI II) 42 –13
Cash flow hedges (OCI II), net of tax –96 29Fair Value Valuation of securities and receivables (liabilities instruments) that will not be reclassified to profit or loss Fair value changes recognized in other comprehensive income 20 –Transferred to profit or loss 0 –Fair Value Valuation of securities and receivables (liabilities instruments) that will not be reclassified to profit or loss, before tax 20 –Deferred taxes relating to pension Fair Value Valuation of securities and receivables (liabilities instruments) recognized in other comprehensive income –4 –
Fair Value Valuation of securities and receivables (liabilities instruments) that will not be reclassified to profit or loss, net of tax 16 –Share of other comprehensive income of equity-accounted investments that may be reclassified subsequently to profit or loss, net of tax 0 –47Items that may be reclassified subsequently to profit or loss –537 383
Other comprehensive income, before tax –1,358 1,191Deferred taxes relating to other comprehensive income 223 –276
Other comprehensive income, net of tax –1,135 916Total comprehensive income 2,165 4,289of which attributable to
Noncontrolling interests 1 4Volkswagen AG hybrid capital investors 77 55Volkswagen AG shareholders 2,086 4,230
1 Prior-year figures adjusted (see disclosures on IFRS 9 and IFRS 15).
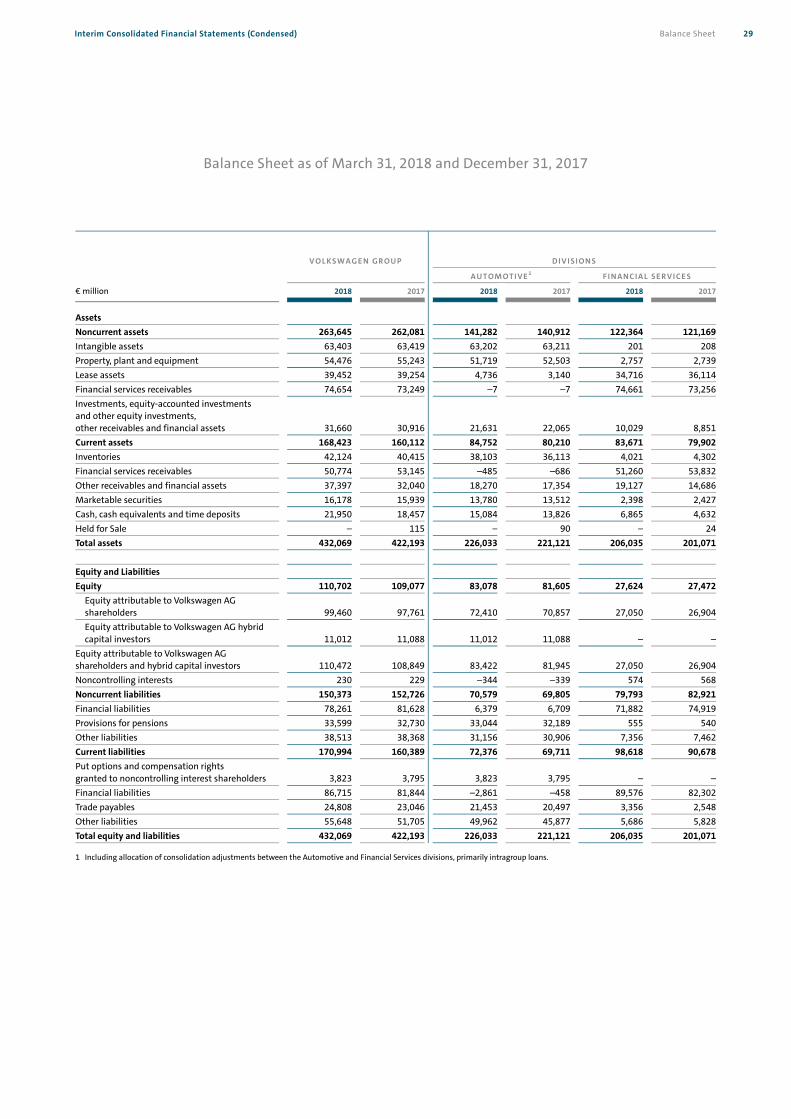
Interim Consolidated Financial Statements (Condensed) 29Balance Sheet
Balance Sheet as of March 31, 2018 and December 31, 2017
V O L K S W A G E N G R OU P D I V I S I ON S
A U T OM O T I V E 1 F I N A N C I A L SE R V I C E S
€ million 2018 2017 2018 2017 2018 2017
Assets Noncurrent assets 263,645 262,081 141,282 140,912 122,364 121,169Intangible assets 63,403 63,419 63,202 63,211 201 208Property, plant and equipment 54,476 55,243 51,719 52,503 2,757 2,739Lease assets 39,452 39,254 4,736 3,140 34,716 36,114Financial services receivables 74,654 73,249 –7 –7 74,661 73,256Investments, equity-accounted investments and other equity investments, other receivables and financial assets 31,660 30,916 21,631 22,065 10,029 8,851Current assets 168,423 160,112 84,752 80,210 83,671 79,902Inventories 42,124 40,415 38,103 36,113 4,021 4,302Financial services receivables 50,774 53,145 –485 –686 51,260 53,832Other receivables and financial assets 37,397 32,040 18,270 17,354 19,127 14,686Marketable securities 16,178 15,939 13,780 13,512 2,398 2,427Cash, cash equivalents and time deposits 21,950 18,457 15,084 13,826 6,865 4,632Held for Sale – 115 – 90 – 24Total assets 432,069 422,193 226,033 221,121 206,035 201,071 Equity and Liabilities Equity 110,702 109,077 83,078 81,605 27,624 27,472
Equity attributable to Volkswagen AG shareholders 99,460 97,761 72,410 70,857 27,050 26,904Equity attributable to Volkswagen AG hybrid capital investors 11,012 11,088 11,012 11,088 – –
Equity attributable to Volkswagen AG shareholders and hybrid capital investors 110,472 108,849 83,422 81,945 27,050 26,904Noncontrolling interests 230 229 –344 –339 574 568Noncurrent liabilities 150,373 152,726 70,579 69,805 79,793 82,921Financial liabilities 78,261 81,628 6,379 6,709 71,882 74,919Provisions for pensions 33,599 32,730 33,044 32,189 555 540Other liabilities 38,513 38,368 31,156 30,906 7,356 7,462Current liabilities 170,994 160,389 72,376 69,711 98,618 90,678Put options and compensation rights granted to noncontrolling interest shareholders 3,823 3,795 3,823 3,795 – –Financial liabilities 86,715 81,844 –2,861 –458 89,576 82,302Trade payables 24,808 23,046 21,453 20,497 3,356 2,548Other liabilities 55,648 51,705 49,962 45,877 5,686 5,828Total equity and liabilities 432,069 422,193 226,033 221,121 206,035 201,071
1 Including allocation of consolidation adjustments between the Automotive and Financial Services divisions, primarily intragroup loans.

Statement of Changes in Equity 30 Interim Consolidated Financial Statements (Condensed)
Statement of Changes in Equity
O T H E R R E S E R V E S
€ million Subscribed capital Capital reserves Retained earningsCurrency
translation reserve
Unadjusted balance at Jan. 1, 2017 1,283 14,551 70,446 –1,117Changes in accounting policy to reflect IFRS 9 – – 57 –Balance at Jan. 1, 2017 1,283 14,551 70,503 –1,117Earnings after tax – – 3,316 –Other comprehensive income, net of tax – – 477 204Total comprehensive income – – 3,793 204Offsetting of the result for investment hedging – – – –Disposal of equity instruments – – – –Capital increases – – – –Dividends payment – – – –Capital transactions involving a change in ownership interest – – – –Other changes – – 0 –Balance at Mar. 31, 2017 1,283 14,551 74,295 –913 Unadjusted balance at Jan. 1, 2018 1,283 14,551 81,367 –3,223Changes in accounting policy to reflect IFRS 9 and IFRS 15 – – –282 –Balance at Jan. 1, 2018 1,283 14,551 81,085 –3,223Earnings after tax – – 3,221 –Other comprehensive income, net of tax – – –589 –592Total comprehensive income – – 2,632 –592Offsetting of the result for investment hedging – – – –Disposal of equity instruments – – – –Capital increases – – – –Dividends payment – – – –Capital transactions involving a change in ownership interest – – – –Other changes – – 1 –Balance at Mar. 31, 2018 1,283 14,551 83,718 –3,815

Interim Consolidated Financial Statements (Condensed) 31Statement of Changes in Equity
H E D G I N G
Cash flowhedges (OCI I)
Costs of hedging (OCI II)
Available-for-salefinancial assets
(Equity and debtinstruments)
Equity-accounted
investments
Equityattributable to
Volkswagen AGhybrid capital
investors
Equityattributable to
Volkswagen AGshareholders and
hybrid capitalinvestors
Noncontrollinginterests Total equity
–457 – –2 417 7,567 92,689 221 92,910– –57 – – – – – –
–457 –57 –2 417 7,567 92,689 221 92,910– – – – 55 3,371 2 3,373
196 29 57 –49 – 914 1 916196 29 57 –49 55 4,285 4 4,289
– – – – – – – –– – – – – – – –– – – – – – – –– – – – –204 –204 – –204– – – – – – – –– – – – 51 51 0 51
–261 –28 55 368 7,469 96,821 225 97,046
3,525 – 91 166 11,088 108,849 229 109,07756 63 –225 – – –388 1 –387
3,581 63 –133 166 11,088 108,461 229 108,690– – – – 77 3,299 1 3,300
136 –96 –5 12 – –1,135 0 –1,135136 –96 –5 12 77 2,164 1 2,165
– – – – – – – –– – – – – – – –– – – – – – – –– – – – –204 –204 – –204– – – – – – – –– – – – 51 52 0 52
3,717 –33 –138 178 11,012 110,472 230 110,702

Cash flow statement 32 Interim Consolidated Financial Statements (Condensed)
Cash flow statement for the Period January 1 to March 31
VOLKSWAGEN GROUP DIVISIONS
AUTOMOTIVE¹ F INANCIAL SERVICES
€ million 2018 20177 2018 20177 2018 20177
Cash and cash equivalents at beginning of period 18,038 18,833 13,428 14,125 4,609 4,709Earnings before tax 4,477 4,592 3,844 4,001 633 590Income taxes paid –743 –821 –455 –969 –288 148Depreciation and amortization expense² 5,362 5,281 3,687 3,513 1,675 1,768Change in pension provisions 44 55 41 53 3 3Share of the result of equity-accounted investments –828 578 –811 573 –17 5Other noncash income/expense and reclassifications³ 271 97 231 143 40 –45Gross cash flow 8,584 9,783 6,537 7,314 2,047 2,469Change in working capital –4,585 –9,483 –1,082 –6,479 –3,503 –3,004
Change in inventories –1,995 –4,098 –2,332 –4,210 337 112Change in receivables –5,676 –3,723 –2,814 –3,364 –2,862 –359Change in liabilities 4,897 3,945 3,666 3,243 1,232 702Change in other provisions 959 –1,909 917 –1,944 42 34Change in lease assets (excluding depreciation) –2,950 –2,749 –317 –174 –2,633 –2,575Change in financial services receivables 179 –949 –201 –31 380 –918
Cash flows from operating activities 3,999 299 5,455 835 –1,457 –535Cash flows from investing activities attributable to operating activities –3,157 –3,512 –3,018 –3,418 –139 –94of which: Investments in intangible assets (excluding capitalized development costs), property, plant and equipment, and investment property –1,978 –1,903 –1,918 –1,840 –60 –63
capitalized development costs –1,203 –1,446 –1,203 –1,446 – –acquisition and disposal of equity investments –48 –297 62 –257 –110 –40
Net cash flow4 841 –3,213 2,437 –2,583 –1,596 –630 Change in investments in securities, loans and time deposits 308 1,904 1,920 1,576 –1,612 328
Cash flows from investing activities –2,849 –1,608 –1,098 –1,842 –1,751 234Cash flows from financing activities 2,401 9,728 –3,058 7,981 5,458 1,747
of which: capital contributions/capital redemptions – – –24 –1,015 24 1,015Effect of exchange rate changes on cash and cash equivalents –77 49 –61 29 –16 19Change of loss allowance within cash and cash equivalents 0 – 0 – 0 –Net change in cash and cash equivalents 3,473 8,468 1,238 7,004 2,235 1,465 Cash and cash equivalents at Mar. 315 21,511 27,302 14,666 21,128 6,844 6,173Securities, loans and time deposits 25,798 26,240 13,146 16,271 12,652 9,969Gross liquidity 47,309 53,541 27,812 37,400 19,496 16,142Total third-party borrowings –164,976 –164,954 –3,518 –13,755 –161,458 –151,199Net liquidity at March 316 –117,668 –111,412 24,294 23,645 –141,962 –135,057
For information purposes: at Jan. 1 –119,143 –107,950 22,378 27,180 –141,522 –135,130
1 Including allocation of consolidation adjustments between the Automotive and Financial Services divisions. 2 Net of impairment reversals. 3 These relate mainly to the fair value measurement of financial instruments, the reclassification of gains/losses on disposal of noncurrent assets and equity investments to investing
activities. 4 Net cash flow: cash flows from operating activities, net of cash flows from investing activities attributable to operating activities (investing activities excluding change in
investments in securities, loans and time deposits). 5 Cash and cash equivalents comprise cash at banks, checks, cash-in-hand and call deposits. 6 The total of cash, cash equivalents, securities, loans to affiliates and joint ventures as well as time deposits net of third-party borrowings (noncurrent and current financial liabilities). 7 Prior-year figures adjusted (see disclosures on IFRS 9 and IFRS 15).
Explanatory notes on the cash flow statement are presented in the section relating to the cash flow statement.

Notes to the Interim Consolidated StatementsInterim Consolidated Financial Statements (Condensed) 33
Accounting in accordance with International Financial Reporting Standards (IFRSs)
In accordance with Regulation No. 1606/2002 of the European Parliament and of the Council, Volkswagen AG prepared its consolidated financial statements for 2017 in compliance with the International Financial Reporting Standards (IFRSs), as adopted by the European Union. These interim consolidated financial state-ments for the period ended March 31, 2018 were therefore also prepared in accordance with IAS 34 (Interim Financial Reporting) and are condensed in scope compared with the consolidated financial statements.
All figures shown are rounded, so minor discrepancies may arise from addition of these amounts. In addition to the reportable segments, the Automotive and Financial Services divisions are presented in
the condensed interim group financial report for explanatory purposes alongside the income statement, balance sheet and cash flow statement for the Volkswagen Group. This supplemental presentation is not required by IFRSs. Eliminations of intragroup transactions between the Automotive and Financial Services divisions are allocated to the Automotive Division.
The accompanying interim consolidated financial statements were reviewed by auditors in accordance with section 115 of the Wertpapierhandelsgesetz (WpHG – German Securities Trading Act).
Accounting policies
Volkswagen AG has applied all accounting pronouncements adopted by the EU and effective for periods beginning on or after January 1, 2018. I F R S 9 – F I N A N C I A L I N ST R U M E N T S
IFRS 9 changes the accounting requirements for classifying and measuring financial assets, for impairment of financial assets, and for hedge accounting.
Financial assets are classified and measured on the basis of the entity’s business model and the character-istics of the financial asset’s cash flows. A financial asset is initially measured either “at amortized cost”, “at fair value through other comprehensive income”, or “at fair value through profit or loss”. The classification and measurement of financial liabilities under IFRS 9 are largely unchanged compared with the current accounting requirements of IAS 39.
The basis for measuring impairment losses and recognizing loss allowances switched from an incurred credit loss model to an expected credit loss model. The change in measurement method leads to an increase in the loss allowance. The increase in the loss allowance results firstly from the requirement to recognize a loss allowance even for financial assets not classified as non-performing and whose credit risk has not increased significantly since initial recognition. Secondly, the increase results from the requirement to recognize loss allowances on the basis of the entire expected remaining life of the contractual asset for financial assets for which there has been a significant increase in credit risk since initial recognition.
In the case of hedge accounting, IFRS 9 contains both extended designation options and the need to imple-ment more complex recognition and measurement methods. In addition, IFRS 9 also eliminates the quantitative limits for effectiveness testing.
In addition, IFRS 9 has an impact on the entity’s reclassification practice. Depending on market trends, there is an expectation that operating profit or loss will be affected by hedging transactions to a greater extent. Due to the retrospective application of the guidance on designating options, the prior-year figures were adjusted. This resulted in an effect of €–29 million on earnings after tax in the first quarter of 2017.
This will also result in far more extensive disclosures in the notes.
Notes to the Consolidated Financial Statements

Notes to the Interim Consolidated Statements 34 Interim Consolidated Financial Statements (Condensed)
The tables below show the main effects of the new accounting rules under IFRS 9 on the classification and measurement of financial assets, the impairment of financial assets and hedge accounting.
For the class of derivatives in hedge accounting, IFRS 9 did not result in any reclassifications from or to other classes.
A D J U STM E N T S TO B A L A N C E S H E E T A M O U N T S A S O F J A N UA RY 1 , 2 0 1 8 A S A R E S U LT O F I F R S 9
D E C . 3 1 , 2 0 1 7 J A N . 1 , 2 0 1 8
€ million Before adjustments Adjustments After adjustments
Assets Noncurrent assets Financial services receivables 73,249 –173 73,076Investments, equity-accounted investments and other equity investments, other receivables and financial assets 30,916 52 30,967 Current assets Financial services receivables 53,145 –122 53,023Other receivables and financial assets 32,040 –206 31,834Marketable securities 15,939 2 15,941Cash, cash equivalents and time deposits 18,457 –2 18,456 Equity and liabilities Equity Total Equity 109,077 –391 108,687 Noncurrent liabilities Other liabilities 38,368 –67 38,302 Current liabilities Other liabilities 51,705 7 51,712
In addition to the changes described above, the new rules on the recognition of loss allowances had an impact on the mesurement of lease assets. This resulted in an adjustment of €43 million (of which €35 million recognized in lease assets and €7 million in inventories). This transition effect, net of deferred taxes, was recognized directly in equity.

Notes to the Interim Consolidated StatementsInterim Consolidated Financial Statements (Condensed) 35
R E CO N C I L I AT I O N O F T H E C L A S S E S O F F I N A N C I A L A S S E T S A N D F I N A N C I A L L I A B I L I T I E S M E A S U R E D AT F A I R VA L U E
F R O M I A S 3 9 TO I F R S 9 A S O F J A N UA RY 1 , 2 0 1 8
T R A N S F E R S
MEASURED AT FAIR VALUE IAS 39
FROM MEASURED AT AMORTIZED COST
TO MEASURED AT AMORTIZED COST
MEASURED AT FAIR VALUE IFRS 9
€ million Carrying amount
Dec. 31, 2017 Fair value
Dec. 31, 2017Fair value
Dec. 31, 2017Carrying amount
Jan. 1, 2018
Noncurrent assets
Equity-accounted investments – – – –
Other equity investments 243 – – 243
Financial services receivables – 533 – 533
Other financial assets 776 – – 776
Current assets
Trade receivables – 44 – 44
Financial services receivables – 0 – 0
Other financial assets 936 5 – 941
Marketable securities 15,939 – –79 15,861
Cash, cash equivalents and time deposits – – – –
Noncurrent liabilities
Noncurrent financial liabilities – – – –
Other noncurrent financial liabilities 774 – – 774
Current liabilities
Put options and compensation rights granted to noncontrolling interest shareholders – – – –
Current financial liabilities – – – –
Trade payables – – – –
Other current financial liabilities 766 – – 766

Notes to the Interim Consolidated Statements 36 Interim Consolidated Financial Statements (Condensed)
R E CO N C I L I AT I O N O F T H E C L A S S E S O F F I N A N C I A L A S S E T S A N D F I N A N C I A L L I A B I L I T I E S M E A S U R E D AT A M O R T I Z E D CO ST
F R O M I A S 3 9 TO I F R S 9 A S O F J A N UA RY 1 , 2 0 1 8
T R A N S F E R S
MEASURED AT AMORTIZED COST
IAS 39 MEASURED AT FAIR VALUE
MEASURED AT
FAIR VALUE
MEASURED AT AMORTIZED COST
IFRS 9
€ million
Carrying amount Dec. 31,
2017
Fair valueDec. 31,
2017
Fair value Dec. 31,
2017
Carryingamount
adjustedJan. 1,
2018
Provisionfor creditrisks ad-
justmentJan. 1,
2018
Carryingamount
Jan. 1,2018
Carrying amount Dec. 31,
2017
Fair valueDec. 31,
2017
Carrying amount
Jan. 1, 2018
Fair valueJan. 1,
2018
Noncurrent assets Equity-accounted investments – – – – – – – – – –Other equity investments – – – – – – – – – –Financial services receivables 73,249 75,049 – – – – 533 533 72,716 74,516Other financial assets 4,364 4,391 – – – – – – 4,364 4,391 Current assets Trade receivables 13,357 13,357 – – – – 44 44 13,313 13,313Financial services receivables 53,145 53,145 – – – – 0 0 53,145 53,145Other financial assets 9,153 9,153 – – – – 5 5 9,148 9,148Marketable securities – – 79 – 0 78 – – 78 78Cash, cash equivalents and time deposits 18,457 18,457 – – – – – – 18,457 18,457 Noncurrent liabilities Noncurrent financial liabilities 81,628 82,567 – – – – – – 81,628 82,567Other noncurrent financial liabilities 1,630 1,633 – – – – – – 1,630 1,633 Current liabilities Put options and compensation rights granted to noncontrolling interest shareholders 3,795 3,811 – – – – – – 3,795 3,811Current financial liabilities 81,844 81,844 – – – – – – 81,844 81,844Trade payables 23,046 23,046 – – – – – – 23,046 23,046Other current financial liabilities 7,358 7,358 – – – – – – 7,358 7,358

Notes to the Interim Consolidated StatementsInterim Consolidated Financial Statements (Condensed) 37
R E CO N C I L I AT I O N O F T H E P R OV I S I O N F O R C R E D I T R I S K S I N R E S P E C T O F F I N A N C I A L A S S E T S
F R O M I A S 3 9 TO I F R S 9 A S O F J A N UA RY 1 , 2 0 1 8
€ million
From financial assets measured at fair
value through profit or loss IAS 39
From financial assets measured at
amortized cost IAS 39
No measurement category under
IAS 39 Total
To financial assets measured at fair value through profit or loss IFRS 9 Dec. 31, 2017 63 – – 63Adjustments –63 – – –63Jan. 1, 2018 – – – –To financial assets measured at fair value through other comprehensive income IFRS 9 (equity instruments) Dec. 31, 2017 396 – – 396Adjustments 2 – – 2Jan. 1, 2018 397 – – 397To financial assets measured at fair value through other comprehensive income IFRS 9 (debt instruments) Dec. 31, 2017 – – – –Adjustments – – – –Jan. 1, 2018 – – – –To financial assets measured at amortized cost IFRS 9 Dec. 31, 2017 – 3,046 – 3,046Adjustments – 318 – 318Jan. 1, 2018 – 3,364 – 3,364To lease receivables Dec. 31, 2017 – – 982 982Adjustments – – 238 238Jan. 1, 2018 – – 1,221 1,221To assets IFRS 15 Dec. 31, 2017 – – 25 25Adjustments – – 3 3Jan. 1, 2018 – – 29 29To credit commitments Dec. 31, 2017 – – – –Adjustments – – 11 11Jan. 1, 2018 – – 11 11To financial guarantees Dec. 31, 2017 – – – –Adjustments – – 5 5Jan. 1, 2018 – – 5 5Total Jan. 1, 2018 397 3,364 1,266 5,027

Notes to the Interim Consolidated Statements 38 Interim Consolidated Financial Statements (Condensed)
R E CO N C I L I AT I O N O F T H E C A R R Y I N G A M O U N T S O F F I N A N C I A L A S S E T S M E A S U R E D AT F A I R VA L U E T H R O U G H P R O F I T O R
LO S S F R O M I A S 3 9 TO I F R S 9
€ million
Carrying amount IAS 39 Dec. 31, 2017 Reclassifications
Adjustments IFRS 9
Carrying amount IFRS 9
Jan. 1, 2018
Change in retained earnings
Jan. 1, 2018
Financial assets measured at fair value through profit or loss IAS 39 1,712
Additions Available for sale financial assets IAS 39 13,124 –230 12,894 230
Financial assets measured at amortized cost IAS 39 580 –9 571 9 Deductions Financial assets measured at amortized cost IFRS 9 – – – – Financial assets measured at fair value through other comprehensive income IFRS 9
– – – –
Total financial assets measured at fair value through profit or loss IFRS 9 15,177
R E CO N C I L I AT I O N O F T H E C A R R Y I N G A M O U N T S O F F I N A N C I A L A S S E T S M E A S U R E D AT F A I R VA L U E T H R O U G H OT H E R
CO M P R E H E N S I V E I N CO M E F R O M I A S 3 9 TO I F R S 9
€ million
Carrying amount IAS 39 Dec. 31, 2017 Reclassifications
Adjustments IFRS 9
Carrying amount IFRS 9
Jan. 1, 2018
Change in retained earnings
Jan. 1, 2018
Available for sale financial assets IAS 39 16,182 Additions
Financial assets measured at amortized cost IAS 39 5 – 5 –Deductions Financial assets measured at amortized cost IFRS 9 79 – 79 –
Financial assets measured at fair value through profit or loss IFRS 9
13,124 – 13,124 –
Total financial assets measured at fair value through other comprehensive income IFRS 9 2,984

Notes to the Interim Consolidated StatementsInterim Consolidated Financial Statements (Condensed) 39
R E CO N C I L I AT I O N O F T H E C A R R Y I N G A M O U N T S O F F I N A N C I A L A S S E T S M E A S U R E D AT A M O RT I Z E D CO ST F R O M
I A S 3 9 TO I F R S 9
€ million
Carrying amount IAS 39
Dec. 31, 2017 Reclassifications Adjustments
IFRS 9
Carrying amount IFRS 9
Jan. 1, 2018
Change in retained earnings
Jan. 1, 2018
Financial assets measured at amortized cost IAS 39 125,550
Additions Available for sale financial assets IAS 39 79 0 78 0
Deductions Financial assets measured at fair value through other comprehensive income IFRS 9
5 – 5 –
Financial assets measured at fair value through profit or loss IFRS 9
580 – 580 –
Financial assets measured at amortized cost IFRS 9 125,044
I F R S 1 5 – R E V E N U E F RO M CO NT RAC T S W I T H C U STO M E R S
IFRS 15 specifies new accounting rules for revenue recognition. The Volkswagen Group applies the modified retrospective transition method. This did not result in material transition effects for the Volkswagen Group as of January 1, 2018, because the existing approach used by the Volkswagen Group is already largely in line with the new guidance.
In the MAN subgroup, sales revenue for certain types of contract will be recognized at a later point in time than under the previous accounting treatment. Other provisions and other liabilities will be adjusted accordingly. The recognition of prepayments due but not yet transferred by the customer in the form of cash has inflated the balance sheet by €0.2 billion compared with the previous year.
Starting in fiscal year 2018, certain items previously recognized in distribution expenses (in particular financing cost subsidies granted to third parties) are allocated to sales allowances. In addition, from 2018 onward, the reversal of sales allowances is no longer presented under other operating income, but under sales revenue. As a result, an amount of €0.1 billion has been moved between other operating income and sales revenue.
To make the presentation more consistent and easier to compare, the way other income from the reversal of provisions and accrued liabilities is reported was also adjusted in this context; these items were allocated to those functions in which they were originally recognized. Prior-year figures were adjusted accordingly, resulting in a €0.4 billion decline in other operating income. This had a corresponding positive effect on cost of sales (€0.2 billion) as well as distribution (€0.1 billion) and administrative expenses (€19 million). OT H E R ACCO U N T I N G P O L I C I E S
A discount rate of 1.8% (December 31, 2017: 1.9%) was applied to German pension provisions in the accom-panying interim consolidated financial statements. The reduction in the discount rate increased pension provisions and deferred taxes attributable to pension provisions as well as the actuarial losses for pension provisions that are recognized in retained earnings.
The income tax expense for the interim consolidated financial statements was calculated on the basis of the average annual tax rate that is expected for the entire fiscal year, in accordance with IAS 34 (Interim Financial Reporting).

Notes to the Interim Consolidated Statements 40 Interim Consolidated Financial Statements (Condensed)
In other respects, the same accounting policies and consolidation methods that were used for the 2017 consolidated financial statements are generally applied to the preparation of the interim consolidated financial statements and the measurement of the prior-year comparatives. A detailed description of the policies and methods applied is published in the “Accounting policies” section of the notes to the 2017 consolidated financial statements. In addition, details of the effects of new standards can be found in the “New and amended IFRSs not applied” section. The 2017 consolidated financial statements can also be accessed on the Internet at www.volkswagenag.com/ir.
Key events
On September 18, 2015, the US Environmental Protection Agency (EPA) publicly announced in a “Notice of Violation” that irregularities in relation to nitrogen oxide (NOX) emissions had been discovered in emissions tests on certain vehicles of Volkswagen Group with type 2.0 l diesel engines in the USA. This was followed by further reports on the scope of the diesel issue. Detailed information can be found in the “Key events” section of the 2017 consolidated financial statements.
Also, the publications released by the reporting date, as well as the investigations and interviews in connection with the diesel issue, did not provide the Group Board of Management with any new reliable findings or assessments regarding the underlying facts and the assessment of the associated risks (e.g. investor lawsuits) and did not reveal any material effects on the interim consolidated financial statements in the first quarter of fiscal year 2018.
Further information on the litigation in connection with the diesel issue can be found in the “Litigation” section.
Basis of consolidation
In addition to Volkswagen AG, which is domiciled in Wolfsburg and entered in the commercial register at the Braunschweig Local Court under No. HRB 100484, the consolidated financial statements comprise all signifi-cant German and non-German subsidiaries, including structured entities, that are controlled directly or indirectly by Volkswagen AG. This is the case if Volkswagen AG obtains power over the potential subsidiaries directly or indirectly from voting rights or similar rights, is exposed, or has rights to, positive or negative variable returns from its involvement with the subsidiaries, and is able to influence those returns. CO N S O L I DAT E D S U B S I D I A R I E S
The disposal of part of PGA Group SAS, Paris, France, by POFIN Financial Services Verwaltungs GmbH, Freilassing, to the Emil Frey Group was implemented on June 1, 2017. The sale is in connection with the strategic development of Porsche Holding Salzburg’s dealer network and the corresponding focus on dealerships exclusively selling Volkswagen Group brand vehicles.
The transaction encompasses dealerships in Poland, the Netherlands, Belgium and in some cases also in France. In the previous year, this had a positive effect of €0.8 billion on net liquidity and, taking into account the disposal of the assets and liabilities, resulted in an insignificant income amount for the Volkswagen Group, which was reported in other operating income.
Overall, the transaction led to the disposal of assets in the amount of €2.5 billion and liabilities in the amount of €2.1 billion. The assets mainly consist of noncurrent leased assets (€0.6 billion) and inventories (€1.0 billion). The liabilities principally comprise noncurrent and current other liabilities (€0.9 billion) and trade payables (€0.7 billion).
I N V E STM E N T S I N A S S O C I AT E S
In 2015, the Audi Subgroup, the BMW Group and Daimler AG established There Holding B.V., Rijswijk, the Netherlands, each with an interest of 33.3%. In December 2016, There Holding B.V. signed a contract with Intel Holdings B.V., Schiphol-Rijk, the Netherlands, for the sale of 15% of the shares in HERE International B.V., Rijswijk, the Netherlands. The transaction with Intel Holdings B.V. was completed on January 31, 2017. This resulted in a loss of control within the meaning of IFRS 10 at the There Holding B.V. level. The deconsolidation

Notes to the Interim Consolidated StatementsInterim Consolidated Financial Statements (Condensed) 41
gave rise to a proportionate effect for the Volkswagen Group of €183 million, which is shown in the share of the result of equity-accounted investments in the previous year. Since a significant influence continues to exist, HERE International B.V. is included in the financial statement of There Holding B.V. as an associate using the equity method. There was no change in the Volkswagen Group’s participating interest in There Holding B.V. as a result of the sale. A capital decrease was implemented at There Holding B.V. in February 2018. The share attributable to the Volkswagen Group amounted to €95.7 million.
In December 2017, agreements for the sale of shares in There Holding B.V. were signed with Robert Bosch Investment Nederland B.V., Boxtel, the Netherlands, and Continental Automotive Holding Netherlands B.V., Maastricht, the Netherlands. In this process, Robert Bosch Investment Nederland B.V. and Continental Automotive Holding Netherlands B.V. acquired an interest of 5.9% each in There Holding B.V. The transactions were completed on February 28, 2018. Audi, BMW and Daimler sold their shareholdings in equal amounts. As a result, the Volkswagen Group’s ownership interest declined to 29.4%. There was no material effect on the financial position and results of operations.
At the beginning of September 2016, Volkswagen Truck & Bus GmbH, a wholly owned subsidiary of Volks-wagen AG, and the US-based commercial vehicle manufacturer Navistar International Corporation, Lisle, USA (Navistar), announced that they had signed an agreement to forge a wide-ranging alliance. The cooperation primarily involves working together on technical components and in procurement. The transaction closed on February 28, 2017. Within the framework of a capital increase, Volkswagen Truck & Bus acquired 16.6% of the shares in Navistar, paying USD 15.76 per share. The purchase price came to €0.3 billion. Due to Volkswagen’s representation on the Board of Directors of Navistar and the agreed cooperation, the investment in Navistar is reported as an equity-accounted investment in the consolidated financial statements.

Notes to the Interim Consolidated Statements 42 Interim Consolidated Financial Statements (Condensed)
Disclosures on the interim consolidated financial statements
1. Sales revenue
ST R U C T U R E O F G R O U P S A L E S R E V E N U E Q 1 2 0 1 7
€ million Passenger
CarsCommercial
VehiclesPower
EngineeringFinancialServices
Total Segments Reconciliation
Volkswagen Group
Vehicles 33,078 6,030 – – 39,107 –4,669 34,438Genuine parts 3,140 799 – – 3,939 –25 3,914Used vehicles and third-party products 3,769 493 – – 4,261 –136 4,126Engines, powertrains and parts deliveries 2,952 174 – – 3,125 –297 2,828Power Engineering – – 783 – 783 –1 782Motorcycles 143 – – – 143 – 143Leasing business 190 427 – 6,502 7,119 –992 6,127Interest and similar income 61 1 – 1,716 1,777 –38 1,739Hedges sales revenue – – – – – – –Other sales revenue 2,519 479 – 154 3,152 –1,052 2,100 45,850 8,402 783 8,372 63,407 –7,210 56,197
ST R U C T U R E O F G R O U P S A L E S R E V E N U E Q 1 2 0 1 8
€ million Passenger
CarsCommercial
VehiclesPower
EngineeringFinancialServices
Total Segments Reconciliation
Volkswagen Group
Vehicles 34,105 6,078 – – 40,183 –3,968 36,215Genuine parts 3,149 838 – – 3,987 –25 3,962Used vehicles and third-party products 2,929 508 – – 3,437 –131 3,306Engines, powertrains and parts deliveries 3,275 284 – – 3,559 –438 3,122Power Engineering – – 766 – 766 –1 766Motorcycles 150 – – – 150 – 150Leasing business 174 396 – 6,517 7,087 –970 6,117Interest and similar income 62 1 – 1,773 1,837 –42 1,795Hedges sales revenue 572 23 – – 594 –60 534Other sales revenue 2,653 552 – 194 3,399 –1,137 2,262 47,069 8,679 766 8,485 65,000 –6,772 58,228
Other sales revenue comprises revenue from workshop services and license revenue, among other things.

Notes to the Interim Consolidated StatementsInterim Consolidated Financial Statements (Condensed) 43
2. Cost of sales
Cost of sales includes interest expenses of €518 million (previous year: €491 million) attributable to the financial services business.
In addition to depreciation and amortization expenses, cost of sales also includes impairment losses on intangible assets, items of property, plant and equipment, and lease assets. The impairment losses identified on the basis of updated impairment tests amount to a total of €164 million (previous year: €175 million). The value in use is used as the basis for calculating impairment losses.
3. Research and development costs
Q 1
€ million 2018 2017 %
Total research and development costs 3,356 3,370 –0.4of which: capitalized development costs 1,203 1,446 –16.8
Capitalization ratio in % 35.9 42.9 Amortization of capitalized development costs 934 851 9.8Research and development costs recognized in profit or loss 3,087 2,774 11.3
4. Earnings per share
Basic earnings per share are calculated by dividing earnings attributable to Volkswagen AG shareholders by the weighted average number of ordinary and preferred shares outstanding during the reporting period.
Since the basic and diluted number of shares is identical, basic earnings per share also correspond to diluted earnings per share. In accordance with Article 27 of the Articles of Association of Volkswagen AG, preferred shares are entitled to a €0.06 higher dividend than ordinary shares.
Q 1
2018 2017¹
Weighted average number of shares outstanding Ordinary shares: basic million 295.1 295.1
diluted million 295.1 295.1Preferred shares: basic million 206.2 206.2
diluted million 206.2 206.2
Earnings after tax € million 3,300 3,373Noncontrolling interests € million 1 2Earnings attributable to Volkswagen AG hybrid capital investors € million 77 55Earnings attributable to Volkswagen AG shareholders € million 3,221 3,316
Earnings per share Ordinary shares: basic € 6.40 6.59
diluted € 6.40 6.59Preferred shares: basic € 6.46 6.65
diluted € 6.46 6.65
1 Prior-year figures adjusted (see disclosures on IFRS 9).
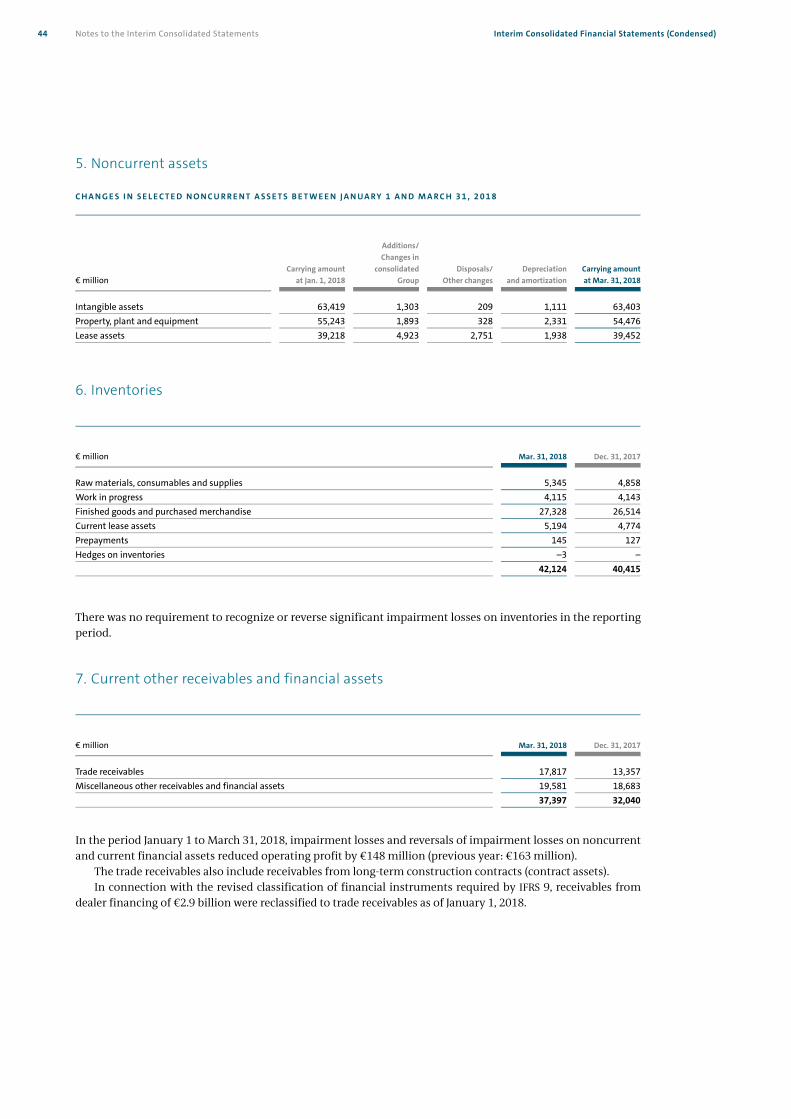
Notes to the Interim Consolidated Statements 44 Interim Consolidated Financial Statements (Condensed)
5. Noncurrent assets
C H A N G E S I N S E L E C T E D N O N C U R R E N T A S S E T S B E T W E E N J A N UA RY 1 A N D M A R C H 3 1 , 2 0 1 8
€ million Carrying amount
at Jan. 1, 2018
Additions/Changes in
consolidatedGroup
Disposals/Other changes
Depreciationand amortization
Carrying amountat Mar. 31, 2018
Intangible assets 63,419 1,303 209 1,111 63,403Property, plant and equipment 55,243 1,893 328 2,331 54,476Lease assets 39,218 4,923 2,751 1,938 39,452
6. Inventories
€ million Mar. 31, 2018 Dec. 31, 2017
Raw materials, consumables and supplies 5,345 4,858Work in progress 4,115 4,143Finished goods and purchased merchandise 27,328 26,514Current lease assets 5,194 4,774Prepayments 145 127Hedges on inventories –3 – 42,124 40,415
There was no requirement to recognize or reverse significant impairment losses on inventories in the reporting period.
7. Current other receivables and financial assets
€ million Mar. 31, 2018 Dec. 31, 2017
Trade receivables 17,817 13,357Miscellaneous other receivables and financial assets 19,581 18,683 37,397 32,040
In the period January 1 to March 31, 2018, impairment losses and reversals of impairment losses on noncurrent and current financial assets reduced operating profit by €148 million (previous year: €163 million).
The trade receivables also include receivables from long-term construction contracts (contract assets). In connection with the revised classification of financial instruments required by IFRS 9, receivables from
dealer financing of €2.9 billion were reclassified to trade receivables as of January 1, 2018.

Notes to the Interim Consolidated StatementsInterim Consolidated Financial Statements (Condensed) 45
8. Equity
The subscribed capital of Volkswagen AG is composed of 295,089,818 no-par value ordinary shares and 206,205,445 no-par-value preferred shares, and amounts to €1,283 million (December 2017: €1,283 million).
The noncontrolling interests are largely attributable to shareholders of RENK AG and AUDI AG.
9. Noncurrent financial liabilities
€ million Mar. 31, 2018 Dec. 31, 2017
Bonds, commercial paper and notes 59,689 62,371Liabilities to banks 14,847 15,357Deposit business 1,288 2,114Other financial liabilities 2,437 1,786 78,261 81,628
10. Current financial liabilities
€ million Mar. 31, 2018 Dec. 31, 2017
Bonds, commercial paper and notes 41,081 36,652Liabilities to banks 14,310 14,487Deposit business 30,179 29,291Other financial liabilities 1,145 1,414 86,715 81,844

Notes to the Interim Consolidated Statements 46 Interim Consolidated Financial Statements (Condensed)
11. Fair value disclosures
The principles and techniques used for fair value measurement remained unchanged year-on-year. Detailed explanations of the measurement principles and techniques can be found in the “Accounting policies” section of the 2017 consolidated financial statements.
Fair value generally corresponds to the market or quoted market price. If no active market exists, fair value is determined using valuation techniques, such as by discounting the future cash flows at the market interest rate, or by using recognized option pricing models.
Assets and liabilities measured at fair value through profit or loss consist of derivatives to which hedge accounting is not applied. They include primarily commodity futures, currency forwards relating to com-modity futures as well as, in certain cases, interest rate swaps, currency swaps and cross-currency interest rate swaps. Moreover, other equity investments (shares representing an ownership interest of less than 20% as a rule) in partnerships (debt instruments) and financial assets held in special funds controlled by the Volkswagen Group are measured at fair value through profit or loss. Derivatives in hedge accounting are likewise measured at fair value through profit or loss.
Financial assets measured at fair value through other comprehensive income include equity investments (shares representing an ownership interest of less than 20% as a rule) in corporations (equity instruments) and shares for which the Volkswagen Group normally exercises the option of fair value measurement through other comprehensive income, as well as securities (debt instruments) whose cash flows comprise solely payments of interest and principal and that are held under a business model aimed at both collecting contractual cash flows and selling financial assets. For instruments measured through other comprehensive income, changes in fair value are recognized directly in equity, taking deferred taxes into account. Impairment losses on securities (debt instruments) are recognized through profit or loss.
Uniform valuation techniques and inputs are used to measure fair value. The fair value of Level 2 and 3 financial instruments is measured in the individual divisions on the basis of Group-wide specifications. The fair value of put options and compensation rights granted to noncontrolling interest shareholders is calcu-lated using a present value model based on the contractually agreed cash settlement, including cash com-pensation, as well as the minimum statutory interest rate and a risk-adjusted discount rate for a matching maturity.
Reconciliation of balance sheet items to classes of financial instruments
The following table shows the reconciliation of the balance sheet items to the relevant classes of financial instruments, broken down by the carrying amount and fair value of the financial instruments.
The fair value of financial instruments measured at amortized cost, such as receivables and liabilities, is calculated by discounting using a market rate of interest for a similar risk and matching maturity. For reasons of materiality, the fair value of current balance sheet items is generally deemed to be their carrying amount.
As a result of the initial application of IFRS 9 and IFRS 15, the carrying amounts of contract assets and receivables from insurance policies are allocated to the “not within the scope of IFRS 7” category, starting in fiscal year 2018.

Notes to the Interim Consolidated StatementsInterim Consolidated Financial Statements (Condensed) 47
R E CO N C I L I AT I O N O F B A L A N C E S H E E T I T E M S TO C L A S S E S O F F I N A N C I A L I N ST R U M E N T S
A S O F D E C E M B E R 3 1 , 2 0 1 7
M E A S UR E D A T F A I R V A L UE
M E A S UR E D A T
A M O R T I Z E D C O ST
DERIVATIVE FINANCIAL
INSTRUMENTS WITHIN HEDGE
ACCOUNTING
N O T W I T H I N S C O P E O F
I F R S 7
B A LA N C E S H E E T I T E M
A T D E C . 3 1 , 2 0 1 7
€ million Carrying amount Carrying amount Fair value Carrying amount Carrying amount
Noncurrent assets Equity-accounted investments – – – – 8,205 8,205Other equity investments 243 – – – 1,075 1,318Financial services receivables – 73,249 75,049 – – 73,249Other financial assets 776 4,364 4,391 3,315 – 8,455 Current assets Trade receivables – 13,357 13,357 – – 13,357Financial services receivables – 53,145 53,145 – – 53,145Other financial assets 936 9,153 9,153 1,909 – 11,998Marketable securities 15,939 – – – – 15,939Cash, cash equivalents and time deposits – 18,457 18,457 – – 18,457Assets held for Sale – – – – 90 90 Noncurrent liabilities Noncurrent financial liabilities – 81,628 82,567 – – 81,628Other noncurrent financial liabilities 774 1,630 1,633 261 – 2,665 Current liabilities Put options and compensation rights granted to noncontrolling interest shareholders – 3,795 3,811 – – 3,795Current financial liabilities – 81,844 81,844 – – 81,844Trade payables – 23,046 23,046 – – 23,046Other current financial liabilities 766 7,358 7,358 446 – 8,570
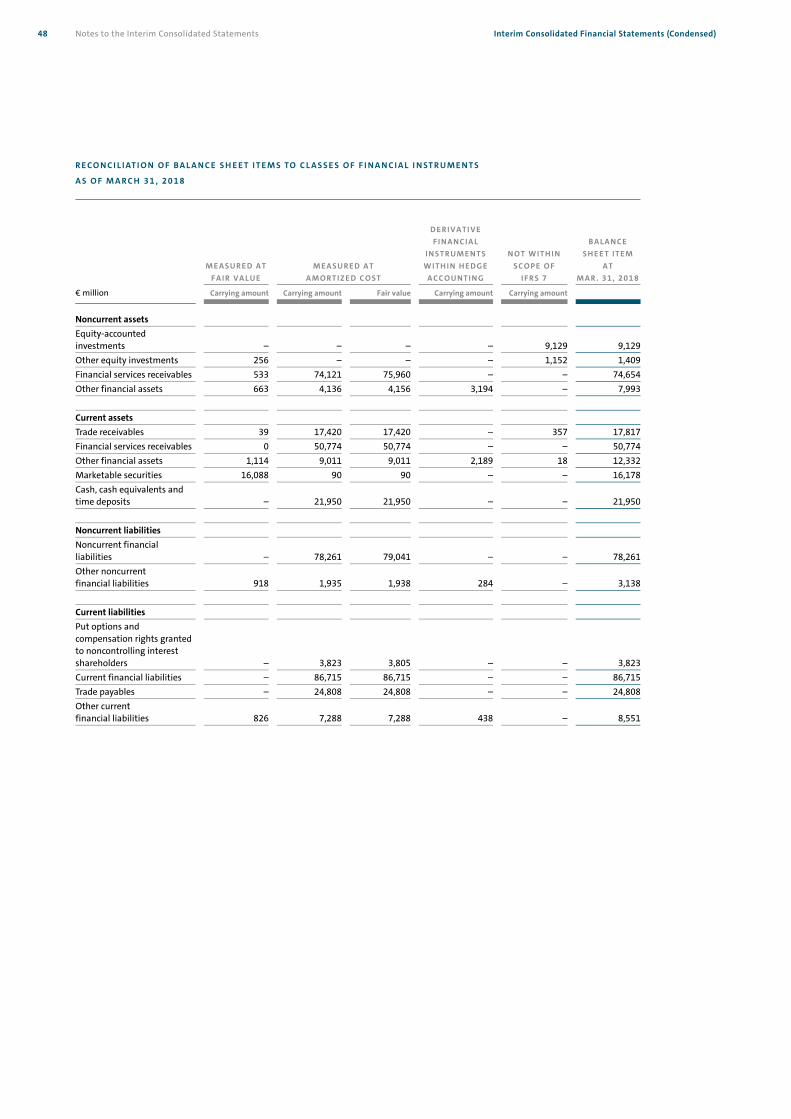
Notes to the Interim Consolidated Statements 48 Interim Consolidated Financial Statements (Condensed)
R E CO N C I L I AT I O N O F B A L A N C E S H E E T I T E M S TO C L A S S E S O F F I N A N C I A L I N ST R U M E N T S
A S O F M A R C H 3 1 , 2 0 1 8
M E A S UR E D A T F A I R V A L UE
M E A S UR E D A T
A M O R T I Z E D C O ST
D E R I V A T I V E F I N A N C I A L
I N S T R UM E N T S W I T H I N H E D G E
A C C O UN T I N G
N O T W I T H I N S C O P E O F
I F R S 7
B A LA N C E S H E E T I T E M
A T M A R . 3 1 , 2 0 1 8
€ million Carrying amount Carrying amount Fair value Carrying amount Carrying amount
Noncurrent assets Equity-accounted investments – – – – 9,129 9,129Other equity investments 256 – – – 1,152 1,409Financial services receivables 533 74,121 75,960 – – 74,654Other financial assets 663 4,136 4,156 3,194 – 7,993 Current assets Trade receivables 39 17,420 17,420 – 357 17,817Financial services receivables 0 50,774 50,774 – – 50,774Other financial assets 1,114 9,011 9,011 2,189 18 12,332Marketable securities 16,088 90 90 – – 16,178Cash, cash equivalents and time deposits – 21,950 21,950 – – 21,950 Noncurrent liabilities Noncurrent financial liabilities – 78,261 79,041 – – 78,261Other noncurrent financial liabilities 918 1,935 1,938 284 – 3,138 Current liabilities Put options and compensation rights granted to noncontrolling interest shareholders – 3,823 3,805 – – 3,823Current financial liabilities – 86,715 86,715 – – 86,715Trade payables – 24,808 24,808 – – 24,808Other current financial liabilities 826 7,288 7,288 438 – 8,551
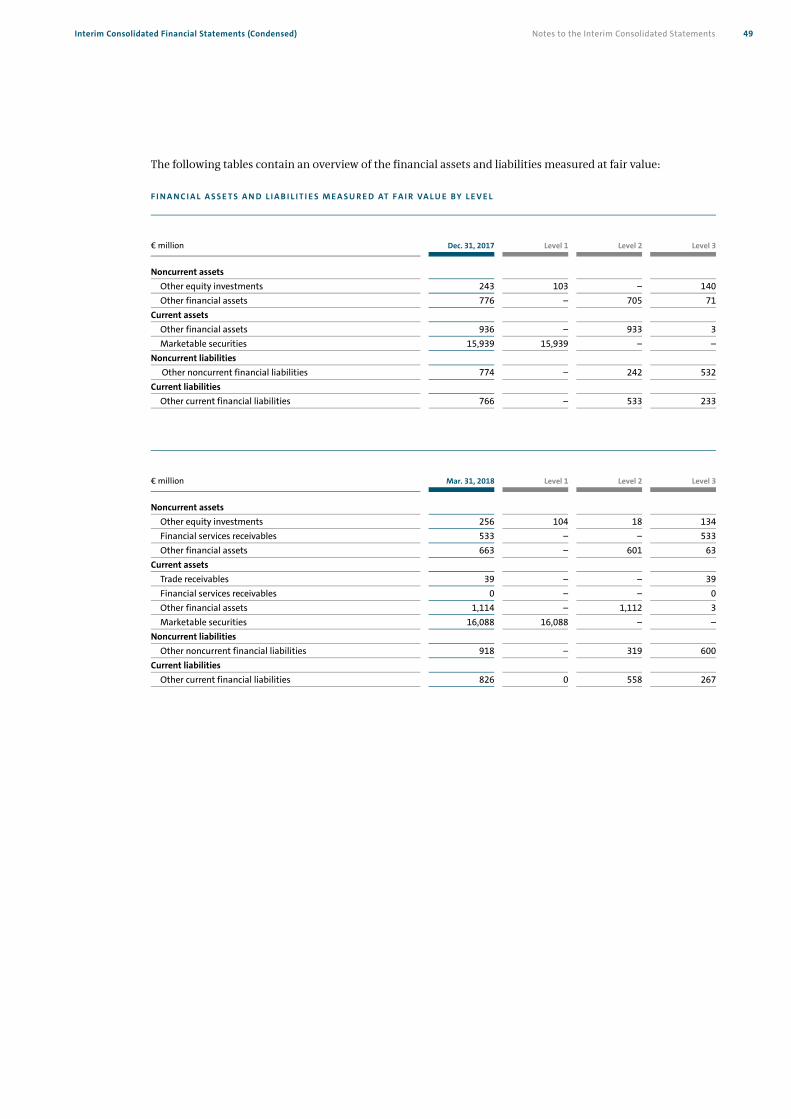
Notes to the Interim Consolidated StatementsInterim Consolidated Financial Statements (Condensed) 49
The following tables contain an overview of the financial assets and liabilities measured at fair value:
F I N A N C I A L A S S E T S A N D L I A B I L I T I E S M E A S U R E D AT F A I R VA L U E B Y L E V E L
€ million Dec. 31, 2017 Level 1 Level 2 Level 3
Noncurrent assets Other equity investments 243 103 – 140Other financial assets 776 – 705 71
Current assets Other financial assets 936 – 933 3Marketable securities 15,939 15,939 – –
Noncurrent liabilities Other noncurrent financial liabilities 774 – 242 532
Current liabilities Other current financial liabilities 766 – 533 233
€ million Mar. 31, 2018 Level 1 Level 2 Level 3
Noncurrent assets Other equity investments 256 104 18 134Financial services receivables 533 – – 533Other financial assets 663 – 601 63
Current assets Trade receivables 39 – – 39Financial services receivables 0 – – 0Other financial assets 1,114 – 1,112 3Marketable securities 16,088 16,088 – –
Noncurrent liabilities Other noncurrent financial liabilities 918 – 319 600
Current liabilities Other current financial liabilities 826 0 558 267

Notes to the Interim Consolidated Statements 50 Interim Consolidated Financial Statements (Condensed)
D E R I VAT I V E F I N A N C I A L I N ST R U M E N T S W I T H I N H E D G E A CC O U N T I N G B Y L E V E L
€ million Dec. 31, 2017 Level 1 Level 2 Level 3
Noncurrent assets Other financial assets 3,315 – 3,315 –
Current assets Other financial assets 1,909 – 1,909 –
Noncurrent liabilities Other noncurrent financial liabilities 261 – 261 –
Current liabilities Other current financial liabilities 446 – 445 0
€ million Mar. 31, 2018 Level 1 Level 2 Level 3
Noncurrent assets Other financial assets 3,194 – 3,194 –
Current assets Other financial assets 2,189 – 2,189 –
Noncurrent liabilities Other noncurrent financial liabilities 284 – 284 –
Current liabilities Other current financial liabilities 438 – 438 –
The allocation of fair values to the three levels in the fair value hierarchy is based on the availability of observable market prices. Level 1 is used to report the fair value of financial instruments for which a price is directly available in an active market. Examples include marketable securities and other equity investments measured at fair value. Fair values in Level 2, for example of derivatives, are measured on the basis of market inputs using market-based valuation techniques. In particular, the inputs used include exchange rates, yield curves and commodity prices that are observable in the relevant markets and obtained through pricing services. Fair Values in Level 3 are calculated using valuation techniques that incorporate inputs that are not directly observable in active markets. In the Volkswagen Group, long-term commodity futures are allocated to Level 3 because the prices available on the market must be extrapolated for measurement purposes. This is done on the basis of observable inputs obtained for the different commodities through pricing services. Options on equity instruments and residual value protection models are also reported in Level 3. Equity instruments are measured primarily using the relevant business plans and entity-specific discount rates. The significant inputs used to measure fair value for the residual value protection models include forecasts and estimates of used vehicle residual values for the appropriate models.
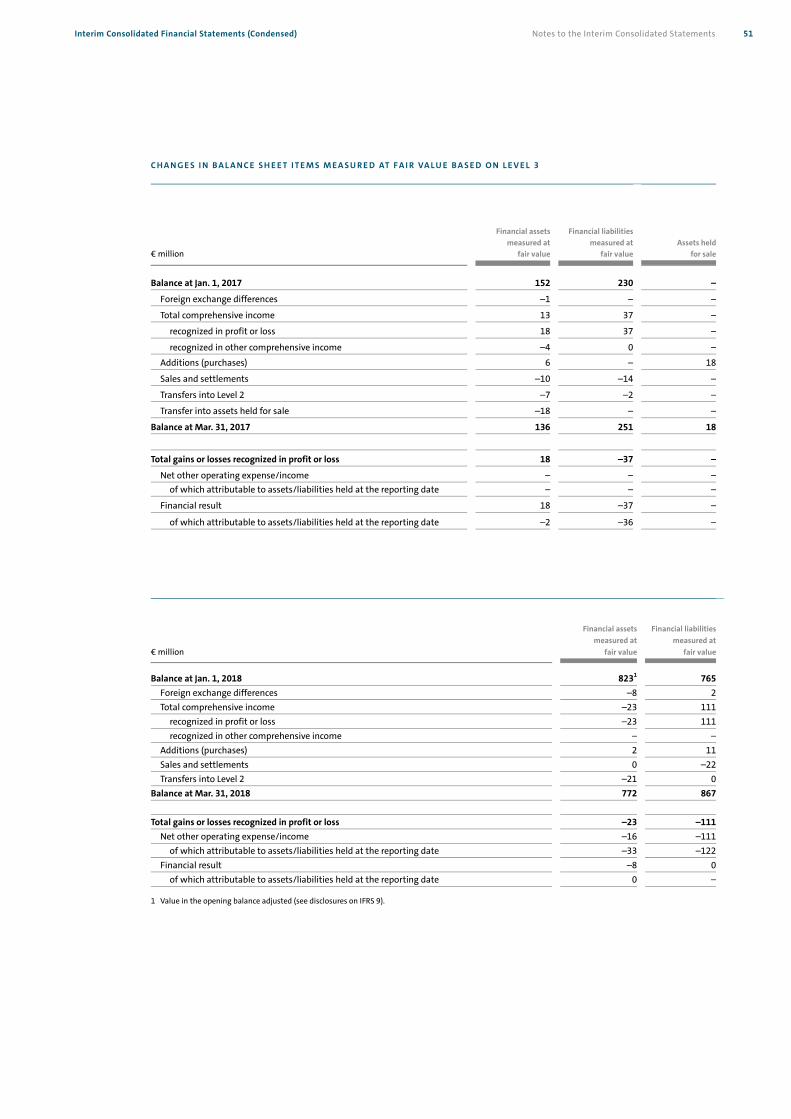
Notes to the Interim Consolidated StatementsInterim Consolidated Financial Statements (Condensed) 51
C H A N G E S I N B A L A N C E S H E E T I T E M S M E A S U R E D AT F A I R VA L U E B A S E D O N L E V E L 3
€ million
Financial assetsmeasured at
fair value
Financial liabilitiesmeasured at
fair valueAssets held
for sale
Balance at Jan. 1, 2017 152 230 –
Foreign exchange differences –1 – –
Total comprehensive income 13 37 –
recognized in profit or loss 18 37 –
recognized in other comprehensive income –4 0 –
Additions (purchases) 6 – 18
Sales and settlements –10 –14 –
Transfers into Level 2 –7 –2 –
Transfer into assets held for sale –18 – –
Balance at Mar. 31, 2017 136 251 18
Total gains or losses recognized in profit or loss 18 –37 –
Net other operating expense/income – – –of which attributable to assets/liabilities held at the reporting date – – –
Financial result 18 –37 –
of which attributable to assets/liabilities held at the reporting date –2 –36 –
€ million
Financial assetsmeasured at
fair value
Financial liabilitiesmeasured at
fair value
Balance at Jan. 1, 2018 8231 765Foreign exchange differences –8 2Total comprehensive income –23 111
recognized in profit or loss –23 111recognized in other comprehensive income – –
Additions (purchases) 2 11Sales and settlements 0 –22Transfers into Level 2 –21 0
Balance at Mar. 31, 2018 772 867 Total gains or losses recognized in profit or loss –23 –111
Net other operating expense/income –16 –111of which attributable to assets/liabilities held at the reporting date –33 –122
Financial result –8 0of which attributable to assets/liabilities held at the reporting date 0 –
1 Value in the opening balance adjusted (see disclosures on IFRS 9).

Notes to the Interim Consolidated Statements 52 Interim Consolidated Financial Statements (Condensed)
The transfers between the levels of the fair value hierarchy are reported at the respective reporting dates. The transfers out of Level 3 into Level 2 comprise commodity futures for which observable quoted prices are now available for measurement purposes due to the decline in their remaining maturities; consequently, no further extrapolation is required. There were no transfers between other levels of the fair value hierarchy.
Commodity prices are the key risk variable for the fair value of commodity futures. Sensitivity analyses are used to present the effect of changes in commodity prices on earnings after tax and equity.
If commodity prices for commodity futures classified as Level 3 had been 10% higher (lower) as of March 31, 2018, profit after tax would have been €39 million (previous year: €7 million) higher (lower). The equity is not affected.
The key risk variable for measuring options on equity instruments held by the Company is the relevant enterprise value. Sensitivity analyses are used to present the effect of changes in risk variables on earnings after tax.
If the assumed enterprise values at March 31, 2018 had been 10% higher, earnings after tax would have been €3 million (previous year: €1 million) higher. If the assumed enterprise values at March 31, 2018 had been 10% lower, earnings after tax would have been €3 million (previous year: €1 million) lower.
Residual value risks result from hedging agreements with dealers under which earnings effects caused by market-related fluctuations in residual values that arise from buy-back obligations under leases are borne in part by the Volkswagen Group.
The key risk variable influencing the fair value of the options relating to residual value risks is used car prices. Sensitivity analyses are used to quantify the effects of changes in used car prices on earnings after tax.
If the prices for the used cars covered by the residual value protection model had been 10% higher as of March 31, 2018, earnings after tax would have been €325 million (previous year: €252 million) higher. If the prices for the used cars covered by the residual value protection model had been 10% lower as of March 31, 2018, earnings after tax would have been €339 million (previous year: €252 million) lower.
12. Cash flow statement
The cash flow statement presents the cash inflows and outflows in the Volkswagen Group and in the Automotive and Financial Services divisions. Cash and cash equivalents comprise cash at banks, checks, cash-in-hand and call deposits.
€ million Mar. 31, 2018 Mar. 31, 2017
Cash, cash equivalents and time deposits as reported in the balance sheet 21,950 27,704Time deposits –439 –402Cash and cash equivalents as reported in the cash flow statement 21,511 27,302
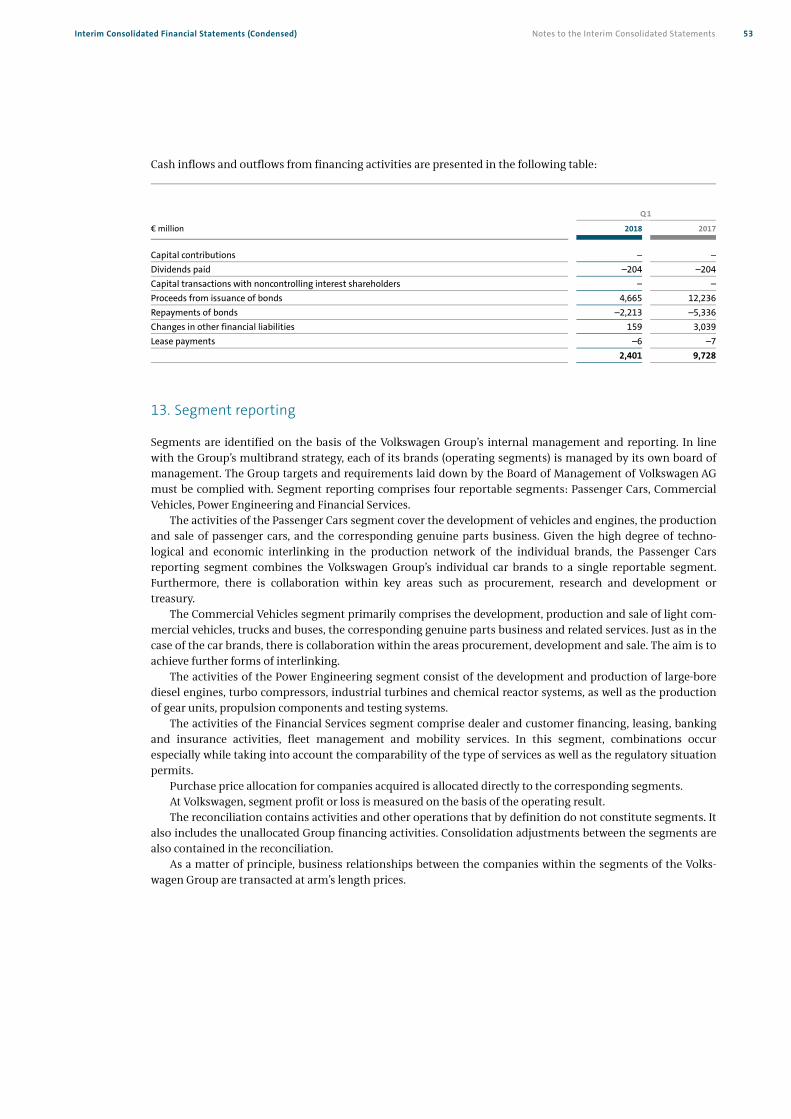
Notes to the Interim Consolidated StatementsInterim Consolidated Financial Statements (Condensed) 53
Cash inflows and outflows from financing activities are presented in the following table:
Q 1
€ million 2018 2017
Capital contributions – –Dividends paid –204 –204Capital transactions with noncontrolling interest shareholders – –Proceeds from issuance of bonds 4,665 12,236Repayments of bonds –2,213 –5,336Changes in other financial liabilities 159 3,039Lease payments –6 –7 2,401 9,728
13. Segment reporting
Segments are identified on the basis of the Volkswagen Group’s internal management and reporting. In line with the Group’s multibrand strategy, each of its brands (operating segments) is managed by its own board of management. The Group targets and requirements laid down by the Board of Management of Volkswagen AG must be complied with. Segment reporting comprises four reportable segments: Passenger Cars, Commercial Vehicles, Power Engineering and Financial Services.
The activities of the Passenger Cars segment cover the development of vehicles and engines, the production and sale of passenger cars, and the corresponding genuine parts business. Given the high degree of techno-logical and economic interlinking in the production network of the individual brands, the Passenger Cars reporting segment combines the Volkswagen Group’s individual car brands to a single reportable segment. Furthermore, there is collaboration within key areas such as procurement, research and development or treasury.
The Commercial Vehicles segment primarily comprises the development, production and sale of light com-mercial vehicles, trucks and buses, the corresponding genuine parts business and related services. Just as in the case of the car brands, there is collaboration within the areas procurement, development and sale. The aim is to achieve further forms of interlinking.
The activities of the Power Engineering segment consist of the development and production of large-bore diesel engines, turbo compressors, industrial turbines and chemical reactor systems, as well as the production of gear units, propulsion components and testing systems.
The activities of the Financial Services segment comprise dealer and customer financing, leasing, banking and insurance activities, fleet management and mobility services. In this segment, combinations occur especially while taking into account the comparability of the type of services as well as the regulatory situation permits.
Purchase price allocation for companies acquired is allocated directly to the corresponding segments. At Volkswagen, segment profit or loss is measured on the basis of the operating result. The reconciliation contains activities and other operations that by definition do not constitute segments. It
also includes the unallocated Group financing activities. Consolidation adjustments between the segments are also contained in the reconciliation.
As a matter of principle, business relationships between the companies within the segments of the Volks-wagen Group are transacted at arm’s length prices.

Notes to the Interim Consolidated Statements 54 Interim Consolidated Financial Statements (Condensed)
R E P O RT I N G S E G M E N T S : Q 1 2 0 1 7
€ million Passenger
CarsCommercial
VehiclesPower
Engineering FinancialServices
Totalsegments
Reconciliation
VolkswagenGroup
Sales revenue from external customers 41,222 6,619 782 7,540 56,164 33 56,197Intersegment sales revenue 4,628 1,782 1 832 7,243 –7,243 –Total sales revenue 45,850 8,402 783 8,372 63,407 –7,210 56,197Segment result (operating result) 3,839 499 –30 600 4,907 –540 4,367
R E P O RT I N G S E G M E N T S : Q 1 2 0 1 8
€ million Passenger
CarsCommercial
VehiclesPower
Engineering FinancialServices
Totalsegments
Reconciliation
VolkswagenGroup
Sales revenue from external customers 42,793 6,925 766 7,758 58,243 –15 58,228Intersegment sales revenue 4,276 1,754 1 726 6,757 –6,757 –Total sales revenue 47,069 8,679 766 8,485 65,000 –6,772 58,228Segment result (operating result) 3,985 536 –42 639 5,119 –908 4,211
R E CO N C I L I AT I O N
Q 1
€ million 2018 2017¹
Segment result (operating result) 5,119 4,907Unallocated activities 14 26Group financing –7 0Consolidation –914 –565
Operating result 4,211 4,367Financial result 266 224Consolidated earnings before tax 4,477 4,592
1 Prior-year figures adjusted (see disclosures on IFRS 9).

Notes to the Interim Consolidated StatementsInterim Consolidated Financial Statements (Condensed) 55
14. Related party disclosures
At 52.2%, Porsche SE held the majority of the voting rights in Volkswagen AG as of March 31, 2018. The creation of rights of appointment for the State of Lower Saxony was resolved at the Extraordinary
General Meeting of Volkswagen AG on December 3, 2009. As a result, Porsche SE cannot appoint the majority of the members of Volkswagen AG’s Supervisory Board for as long as the State of Lower Saxony holds at least 15% of Volkswagen AG’s ordinary shares. However, Porsche SE has the power to participate in the operating policy decisions of the Volkswagen Group and is therefore classified as a related party as defined by IAS 24.
S U P P L I E S A N D SE R V IC E S
R E N D E R E D S U P P L I E S A N D SE R V IC E S
R E C E I V E D
Q 1 Q 1
€ million 2018 2017 2018 2017
Porsche SE and its majority interests 0 3 0 0Supervisory Board members 1 0 0 2Unconsolidated subsidiaries 303 257 391 194Joint ventures and their majority interests 3,959 3,829 117 215Associates and their majority interests 33 41 131 165State of Lower Saxony, its majority interests and joint ventures 1 1 1 1
R E C E I V A B L E S F R O M L I A BI L I T I E S ( I N C L UD I N G
O B L I G A T I ON S ) T O
€ million Mar. 31, 2018 Dec. 31, 2017 Mar. 31, 2018 Dec. 31, 2017
Porsche SE and its majority interests 8 13 67 0Supervisory Board members 0 0 247 254Unconsolidated subsidiaries 1,072 1,480 1,373 1,773Joint ventures and their majority interests 9,861 9,889 2,329 2,168Associates and their majority interests 53 76 502 572State of Lower Saxony, its majority interests and joint ventures 2 2 0 1
The supplies and services received from joint ventures and associates that are presented in the above tables do not include resolved dividend distributions amounting to €29 million (previous year: €1,515 million).
Notes to the Interim Consolidated Statements 56 Interim Consolidated Financial Statements (Condensed)
Receivables from joint ventures are primarily attributable to loans granted in an amount of €6,146 million (previous year: €6,277 million) as well as trade receivables in an amount of €3,425 million (previous year: €3,354 million). Receivables from non-consolidated subsidiaries also result mainly from loans granted in an amount of €696 million (previous year: €1,038 million) and from trade receivables in an amount of €218 mil-lion (previous year: €224 million).
Transactions with related parties are conducted on an arm’s length basis. Some of these transactions also include reservation of title clauses.
The liabilities to Porsche SE consist mainly of term deposits. Obligations to members of the Supervisory Board relate primarily to interest-bearing bank balances of
Supervisory Board members that were invested at standard market terms and conditions at Volkswagen Group companies.
In addition, the Volkswagen Group has furnished guarantees to external banks on behalf of related parties in the amount of €211 million (previous year: €220 million).
The outstanding related party receivables were impaired in the amount of €20 million. This incurred expenses of €3 million in the first quarter of 2018.
In the first three months, the Volkswagen Group made capital contributions of €86 million (previous year: €203 million) to related parties.

Notes to the Interim Consolidated StatementsInterim Consolidated Financial Statements (Condensed) 57
15. Litigation
For certain T6 models (M1 class) with Euro 6 diesel engines registered as passenger cars, the inspection regarding the conformity of the current production of new vehicles with the approved type (conformity of production) identified that certain technical data could not be fully confirmed. To ensure this conformity of production for new vehicles, Volkswagen AG developed a software measure, which was approved by the Kraftfahrt-Bundesamt (KBA – German Federal Motor Transport Authority) at the end of February 2018, and was applied to the production of new vehicles as well as (a total of approximately 30,000) new vehicles that had not been delivered by then. Volkswagen AG is also conducting in-use tests to determine whether the around 200,000 T6 used vehicles already on the market conform to the technical data. The tests being carried out on the proposal of Volkswagen AG are taking place in close collaboration with the KBA, which included this process in a decision dated March 1, 2018. Results are expected to be available in summer 2018.
On March 2, 2018, the federal multi district litigation court in California dismissed in its entirety the first amended class action complaint alleging that these bonds were trading at artificially inflated prices and that the value of these bonds declined after the U.S. Environmental Protection Agency (EPA) issued its “Notices of Violation,” but granted leave to file a further amended complaint. On April 2, 2018, plaintiffs filed a second amended class action complaint.
On March 5, 2018, a Tennessee state court granted in part and denied in part a motion to dismiss the state environmental claims asserted against Volkswagen AG and certain affiliates by the Tennessee Attorney General. Volkswagen has moved for an interlocutory appeal of the decision.
On March 12, 2018, a Minnesota state court granted in part and denied in part a motion to dismiss the state environmental claims asserted against Volkswagen AG and certain affiliates by the Minnesota Attorney General. Volkswagen has appealed the decision.
On March 15, 2018, co-lead counsel for plaintiffs with regard to the: German Automotive Manufacturers Antitrust Litigation filed consolidated amended class action complaints against Volkswagen AG and certain affiliates as well as other manufacturers in the Northern District of California on behalf of putative classes of indirect and direct purchasers. The consolidated amended complaints claim that since the 1990s, defendants had engaged in a conspiracy to unlawfully increase the prices of German luxury vehicles by agreeing to share commercially sensitive information and to reach unlawful agreements regarding technology, costs, and suppliers. Moreover Plaintiffs, claim that defendants had agreed to limit the size of AdBlue tanks to ensure that U.S. emissions regulators did not scrutinize the emissions control systems in defendants’ vehicles, and that such agreement for Volkswagen was the impetus for the creation of the defeat device. The complaints further claim that defendants had coordinated to fix the price of steel used in their automobiles by agreeing with German steel manufacturers to apply a two component pricing formula to steel purchases and worked closely together to generate scientific studies aimed at promoting diesel vehicles.
On March 22, 2018, Volkswagen AG, certain affiliates and the Arizona Attorney General notified an Arizona state court that they have reached a settlement of Arizona’s consumer protection claims and unfair trade practices claims and expect to complete documentation of the settlement within approximately 30 days.
In South Korea, approval for the last vehicle clusters with engine type EA 189 was given on March 28, 2018. The Ministry of Environment in South Korea qualified certain emissions strategies in the engine control
software of various diesel vehicles with a V6 or V8 engine meeting the Euro 6 emission standard as an unlawful defeat device and ordered a recall on April 4, 2018; the same applied to the Dynamic Shift Program (DSP) in the transmission control of a number of Audi models.
On April 11, 2018, a Texas state court granted in part and denied in part a motion for summary judgment on the state environmental claims asserted against Volkswagen AG and certain affiliates by the Texas Attorney General. Volkswagen is pursuing reconsideration or interlocutory appeal of the decision.

Notes to the Interim Consolidated Statements 58 Interim Consolidated Financial Statements (Condensed)
On April 16, 2018, the federal multi district litigation court in California dismissed with prejudice state and local environmental claims asserted against certain Volkswagen AG affiliates by the Environmental Protection Commission of Hillsborough County, Florida and Salt Lake County, Florida, on the basis of the same federal preemption issue that is currently being litigated in the Tennessee, Minnesota, and Texas cases referenced above, as well as in several other state courts.
The public prosecutor’s office of Stuttgart has opened a criminal investigation. On April 18, 2018, the EPA and California Air Resources Board approved the second phase of the emissions
modification for affected 2.0 l TDI vehicles with Generation 3 engines. Thereby the approval process for the technical measures for the relevant vehicles with engine type EA 189
has now been completed in all countries with the exception of Chile. On April 19, 2018, the federal multi district litigation court in California approved the stipulation of the
parties postponing the hearing previously scheduled for May 11, 2018, regarding defendants’ motion to dismiss plaintiffs’ consolidated class action complaint alleging that defendants concealed the existence of defeat devices in Audi brand vehicles with automatic transmissions.
On April 25, 2018, Volkswagen AG, certain affiliates and the Maryland Department of the Environment announced an agreement to resolve the State of Maryland’s environmental and remaining consumer claims for restitution or injunctive relief. The Maryland settlement includes a Consent Decree, which requires approval by the Maryland state court.
In Germany, around 13,000 product-related individual actions brought by customers in connection with the diesel issue are pending against Volkswagen AG and other Volkswagen Group companies.
Beyond this, there were no significant changes in the reporting period compared with the disclosures on the Volkswagen Group’s expected development in fiscal year 2018 in the “Report on Expected Developments” and “Report on Risks and Opportunities” chapters – including the “Risks from the diesel issue” and “Litigation/ Diesel issue” sections and the underlying description of the issues in the chapter entitled “Diesel Issue” – of the combined management report in the 2017 Annual Report or in publications released by the reporting date, as well as the continuing investigations and interviews in connection with the diesel issue and additional important legal cases.
16. Contingent liabilities
As of March 31, 2018, there were no major changes to the contingent liabilities compared with the disclosures in the 2017 annual report.
17. Other financial obligations
Other financial liabilities rose by €2.0 billion compared with the 2017 consolidated financial statements to reach €26.5 billion. The higher figure is mainly attributable to the increase in the purchase order commitment for property, plant and equipment in the amount of €1.3 billion as well as to obligations under irrevocable credit commitments in the amount of €0.5 billion.

Notes to the Interim Consolidated StatementsInterim Consolidated Financial Statements (Condensed) 59
German Corporate Governance Code
The current declarations in accordance with section 161 of the Aktiengesetz (AktG – German Stock Corporation Act) on the German Corporate Governance Code by the Board of Management and Supervisory Board of Volkswagen AG, AUDI AG, MAN SE and RENK AG are permanently available on the Internet at www.volkswagenag.com/ir, www.audi.com/cgk-declaration, www.corporate.man.eu/en and www.renk.biz/ corporated-governance.html respectively.
Significant events after the balance sheet date
There were no significant events after the end of the first three months of 2018. Wolfsburg, April 26, 2018 Volkswagen Aktiengesellschaft The Board of Management

Review Report 60 Interim Consolidated Financial Statements (Condensed)
On completion of our review, we issued the following unqualified review report dated April 26, 2018. This report was originally prepared in German. In case of ambiguities the German version takes precedence: To VOLKSWAGEN AKTIENGESELLSCHAFT, Wolfsburg We have reviewed the condensed consolidated interim financial statements – comprising the condensed income statement and condensed statement of comprehensive income, condensed balance sheet, condensed statement of changes in equity, condensed statement of cash flows and selected explanatory notes – and the interim group management report of VOLKSWAGEN AKTIENGESELLSCHAFT, Wolfsburg, for the period from January 1 to March 31, 2018, which are part of the quarterly financial report pursuant to § (Article) 115 WpHG ("Wertpapierhandelsgesetz": German Securities Trading Act). The preparation of the condensed consolidated interim financial statements in accordance with the IFRS applicable to interim financial reporting as adopted by the EU and of the interim group management report in accordance with the provisions of the German Securities Trading Act applicable to interim group management reports is the responsibility of the parent Company's Board of Managing Directors. Our responsibility is to issue a review report on the condensed consolidated interim financial statements and on the interim group management report based on our review.
We conducted our review of the condensed consolidated interim financial statements and the interim group management report in accordance with German generally accepted standards for the review of financial statements promulgated by the Institut der Wirtschaftsprüfer (Institute of Public Auditors in Germany) (IDW). Those standards require that we plan and perform the review so that we can preclude through critical evaluation, with moderate assurance, that the condensed consolidated interim financial statements have not been prepared, in all material respects, in accordance with the IFRS applicable to interim financial reporting as adopted by the EU and that the interim group management report has not been prepared, in all material respects, in accordance with the provisions of the German Securities Trading Act applicable to interim group management reports. A review is limited primarily to inquiries of company personnel and analytical procedures and therefore does not provide the assurance attainable in a financial statement audit. Since, in accordance with our engagement, we have not performed a financial statement audit, we cannot express an audit opinion.
Review Report

Review ReportInterim Consolidated Financial Statements (Condensed) 61
Based on our review, no matters have come to our attention that cause us to presume that the condensed consolidated interim financial statements have not been prepared, in all material respects, in accordance with the IFRS applicable to interim financial reporting as adopted by the EU nor that the interim group management report has not been prepared, in all material respects, in accordance with the provisions of the German Securities Trading Act applicable to interim group management reports.
We draw attention to the updated information provided in section “Key events” of the notes to the condensed consolidated interim financial statements and in chapter “Report on Expected Developments, Risks and Opportunities” of the interim group management report with regard to the Diesel Issue, which essentially refer to the information provided and statements made in the 2017 consolidated financial statements and in the group management report as at December 31, 2017.
Based on the results of the various measures taken to investigate the issue presented so far, which underlie these consolidated interim financial statements and interim group management report, there is still no evidence that members of the Company’s Board of Managing Directors were aware of the deliberate manipulation of engine management software before summer 2015. Nevertheless, should as a result of the ongoing investigation new knowledge be obtained showing that members of the Board of Managing Directors were informed earlier about the Diesel Issue, this could eventually have an impact on the condensed interim financial statements and interim group management report as well as on the annual and consolidated financial statements and on the group management report for the financial year 2017 and prior years.
The provisions for warranties and legal risks recorded so far are based on the presented state of knowledge. Due to the inevitable uncertainties associated with the current and expected litigation it cannot be excluded that a future assessment of the risks may be different.
Our opinions on the condensed consolidated interim financial statements and on the interim group management report are not modified in respect of this matter.
Hanover, April 26, 2018 PricewaterhouseCoopers GmbH Wirtschaftsprüfungsgesellschaft Harald Kayser Frank Hübner Wirtschaftsprüfer Wirtschaftsprüfer (German Public Auditor) (German Public Auditor)

www.volkswagenag.com
P U B L I S H E D B Y
Volkswagen AG Financial Publications Letterbox 1848-2 38436 Wolfsburg Germany Phone +49 (0) 5361 9-0 Fax +49 (0) 5361 9-28282
I N V E STO R R E L AT I O N S
Volkswagen AG Investor Relations Letterbox 1849 38436 Wolfsburg Germany Phone +49 (0) 5361 9-0 Fax E-Mail
+49 (0) 5361 9-30411 [email protected]
Internet www.volkswagenag.com/ir
F I N A N C I A L C A L E N DA R
May 3, 2018 Volkswagen AG Annual General Meeting
August 1, 2018 Half-Yearly Financial Report 2018
October 30, 2018 Interim Report January – September 2018
This Interim Report is also available on the Internet, in German and English, at: www.volkswagenag.com/ir
This version of the Interim Report is a translation of the German original. The German takes precedence.
Printed in Germany 858.809.582.20
Contact Information