January 30, 2008 Preliminary questions Get your i-clickers ready.
38
January 30, 2008 Preliminary questions Get your i-clickers ready
-
Upload
gilbert-hart -
Category
Documents
-
view
217 -
download
1
Transcript of January 30, 2008 Preliminary questions Get your i-clickers ready.

January 30, 2008
Preliminary questions
Get your i-clickers ready

Questions about Last Class?

Introduction to TANF
Presentation 6
January 30, 2008

Sources
• Sharon Parrott and Arloc Sherman, TANF AT 10Program Results are More Mixed Than Often Understood, http://www.cbpp.org/8-17-06tanf.htm. Surf around, making sure to examine the Guide to TANF Reauthorization Issues
• Martha Coven, An Introduction to TANF, Center for Budget and Policy Priorities, November 22, 2005 http://www.cbpp.org/1-22-02tanf2.htm

Temporary Assistance for Needy Families (TANF)
• Created by the Personal Responsibility and Work Opportunity Reconciliation Act of 1996
• Replaced AFDC as part of President Clinton’s drive to “end welfare as we know it.”
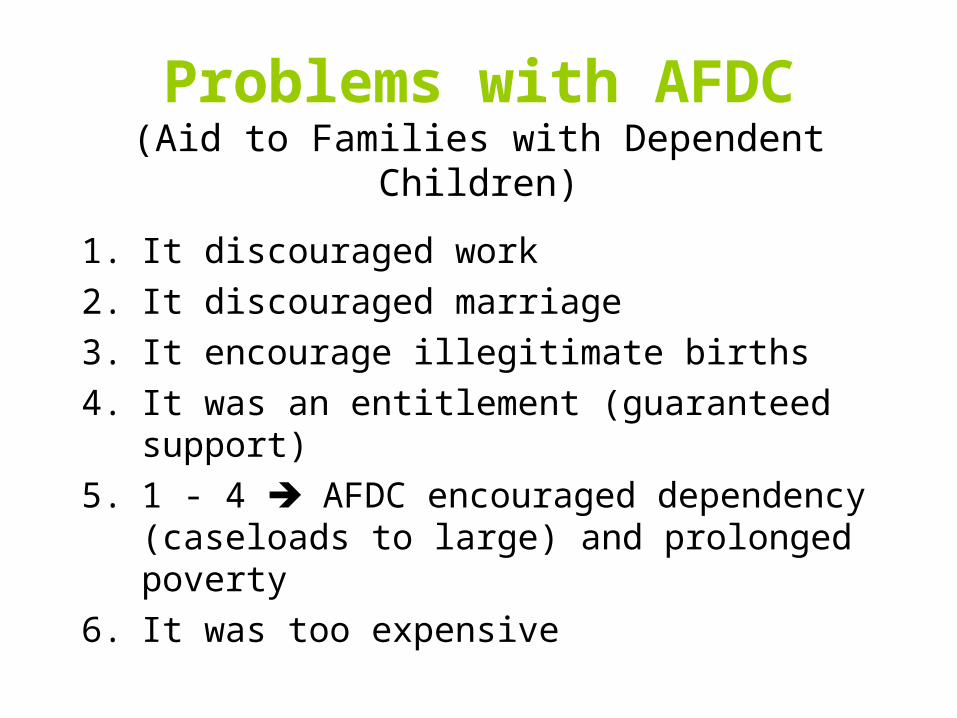
Problems with AFDC(Aid to Families with Dependent Children)
1. It discouraged work
2. It discouraged marriage
3. It encourage illegitimate births
4. It was an entitlement (guaranteed support)
5. 1 - 4 AFDC encouraged dependency (caseloads to large) and prolonged poverty
6. It was too expensive

Goals of TANF
• Restored the American family? – Decrease divorce and cohabitation and increase
marriage
• Reduced illegitimacy? – reduce the number of children born to unmarried
mothers
• Controlled welfare spending? – Reduce the amount of money spent on welfare
• Reduced welfare dependency?– Decrease caseloads

Missing Goals?

Alternative criteria
• Does TANF reduce poverty? (adequacy)• Does the program encourage personal
responsibility? (work incentives)• Does the reform treat participants and non-
participants fairly?– Does it treat persons in similar situations similarly?
(horizontal equity)– Does it treat people in different situations
differently? (vertical equity)
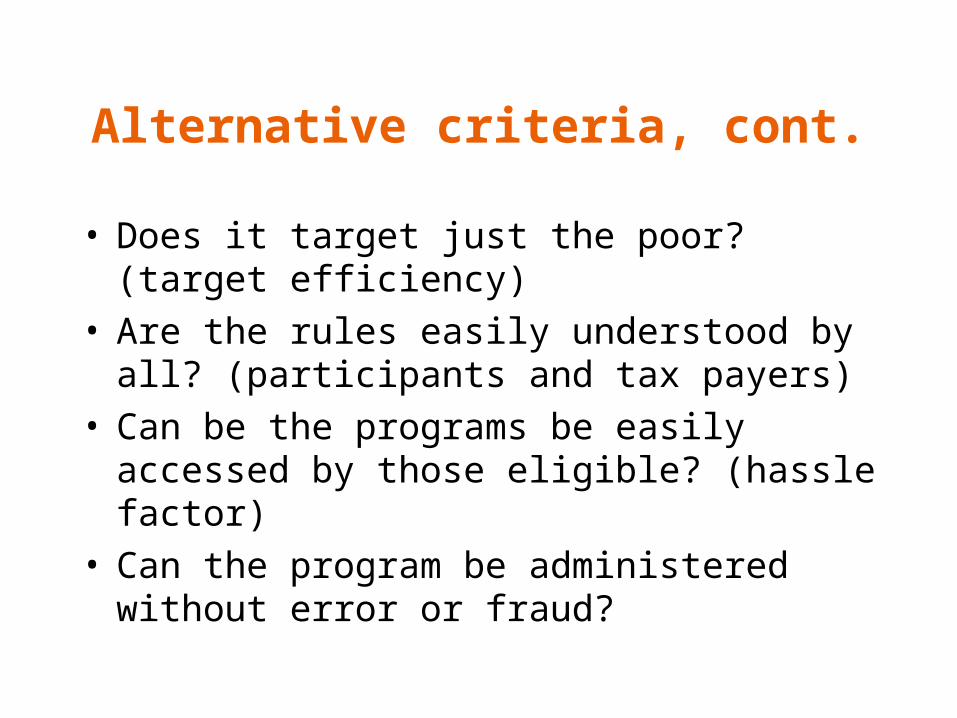
Alternative criteria, cont.
• Does it target just the poor? (target efficiency) • Are the rules easily understood by all?
(participants and tax payers) • Can be the programs be easily accessed by
those eligible? (hassle factor)• Can the program be administered without
error or fraud?
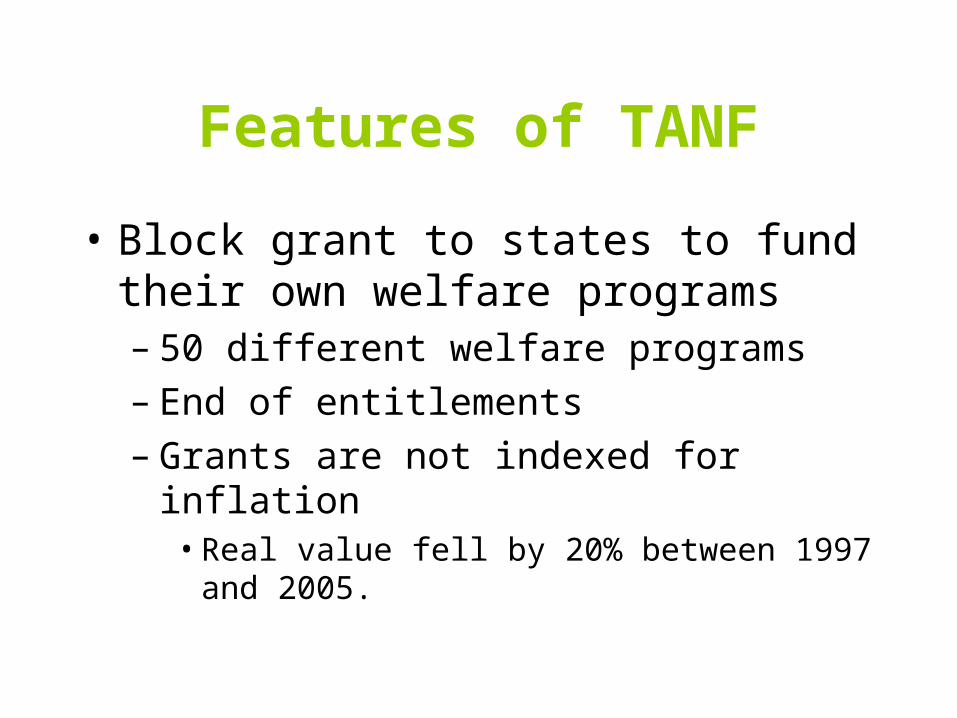
Features of TANF
• Block grant to states to fund their own welfare programs– 50 different welfare programs– End of entitlements– Grants are not indexed for inflation
• Real value fell by 20% between 1997 and 2005.
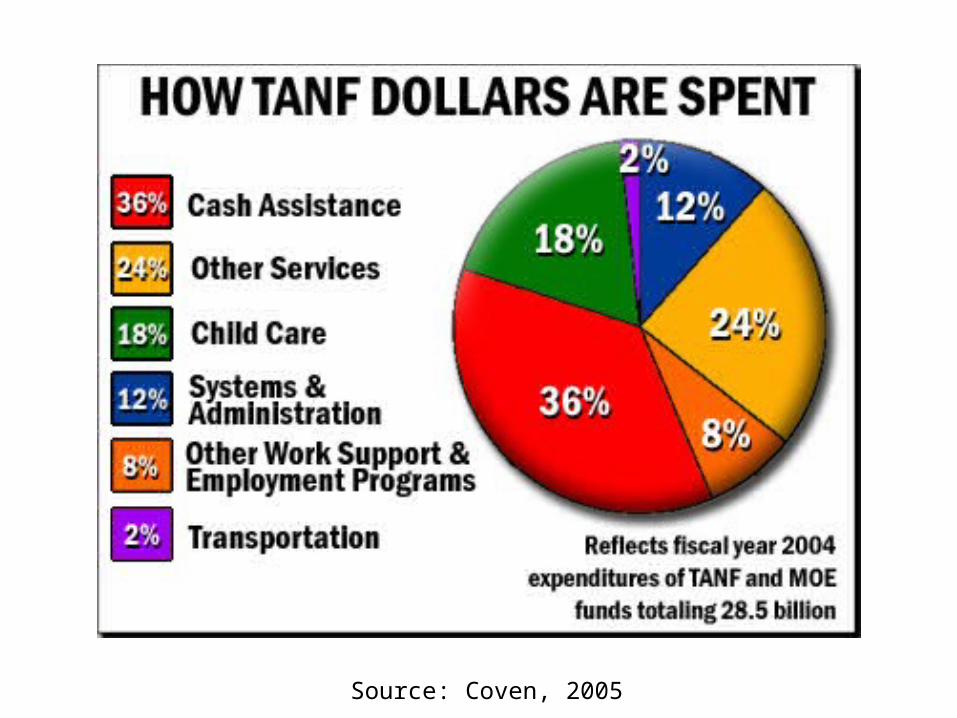
Source: Coven, 2005

Features of TANF, cont.• Citizenship
– Legal immigrants are ineligible until they have been in the US for 5 years
• Work requirements– Must be engaged in work or a work-related activity for 30 hours
per week
• Time limits– No family may receive federally-funded assistance for longer
than five years.
• Family caps– States have an option to refuse to increase benefits if new
children come into the family

How are conclusions drawn?
• Federally funded demonstration projects– State experimental programs authorized by the Family
Support Act of 1988
• Spotty privately sponsored analyses• Evaluating Trends in:
– national data bases (CPS) – State/National administrative data
• Limitations– Cross-sectional data--snap shots– Data do not reflect what happened to families when they left
welfare

Did TANFRestore the American Family ?
National Healthy Marriage Resource Centerhttp://www.healthymarriageinfo.org/
(Go to Research and Trends)
• Marriage rates
• Attitudes toward Marriage
• Attitudes toward Cohabitation
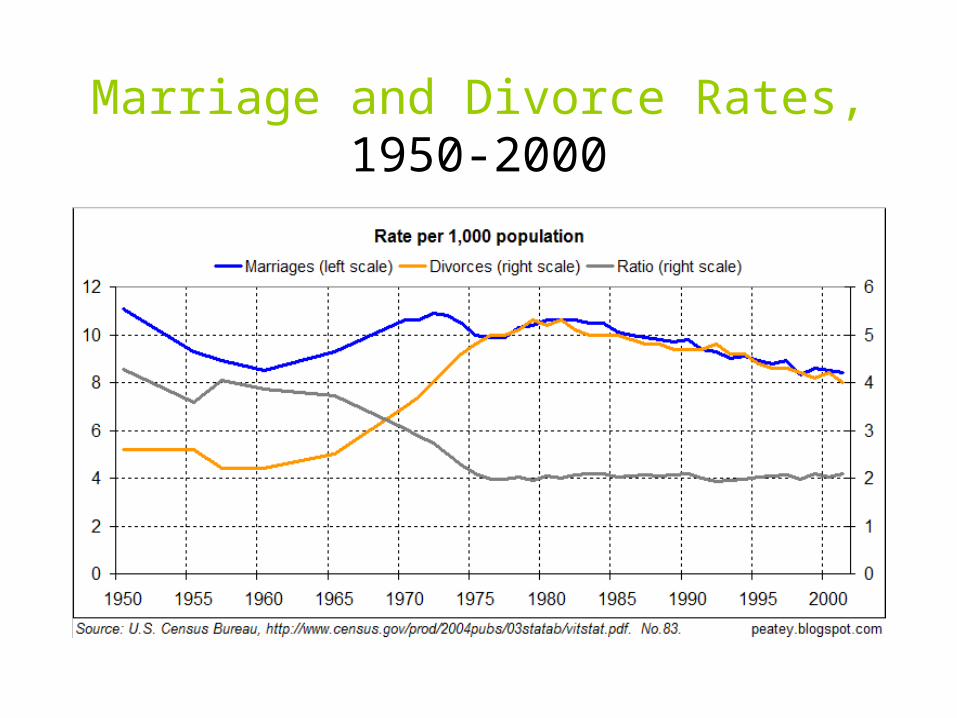
Marriage and Divorce Rates, 1950-2000
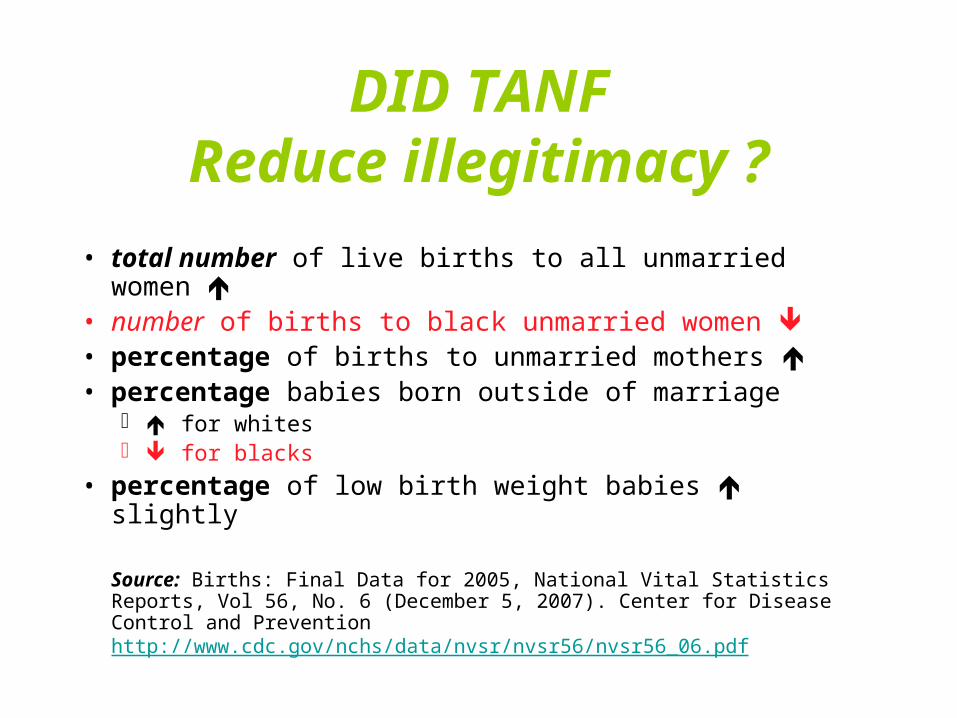
DID TANFReduce illegitimacy ?
• total number of live births to all unmarried women • number of births to black unmarried women • percentage of births to unmarried mothers • percentage babies born outside of marriage
for whites for blacks
• percentage of low birth weight babies slightly
Source: Births: Final Data for 2005, National Vital Statistics Reports, Vol 56, No. 6 (December 5, 2007). Center for Disease Control and Prevention http://www.cdc.gov/nchs/data/nvsr/nvsr56/nvsr56_06.pdf
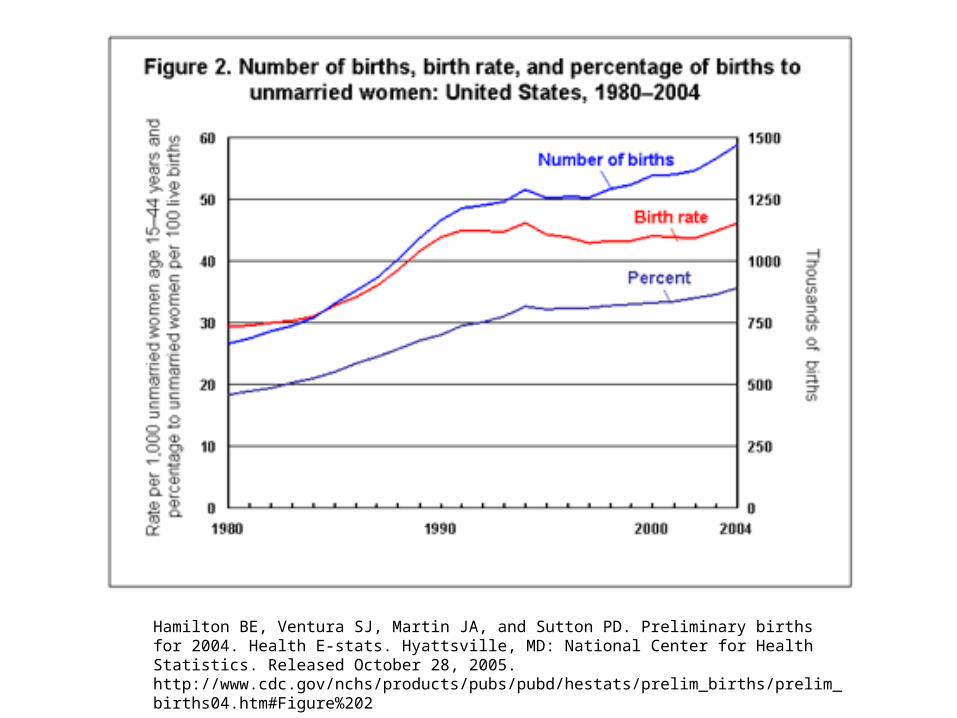
Hamilton BE, Ventura SJ, Martin JA, and Sutton PD. Preliminary births for 2004. Health E-stats. Hyattsville, MD: National Center for Health Statistics. Released October 28, 2005. http://www.cdc.gov/nchs/products/pubs/pubd/hestats/prelim_births/prelim_births04.htm#Figure%202

Did TANF Reduce illegitimacy ?
• Also see: National Healthy Marriage Resource Center
• http://www.healthymarriageinfo.org/research_stats/index.cfm

Did PRWORA Control Welfare Spending?
Yes, and No
See: Spending on Social Welfare Programsin Rich and Poor States, Key Findings, U.S. Department of Health and Human Services Office of the Assistant Secretary for Planning and Evaluation, August 2004
http://aspe.hhs.gov/hsp/social-welfare-spending04/summary.htm
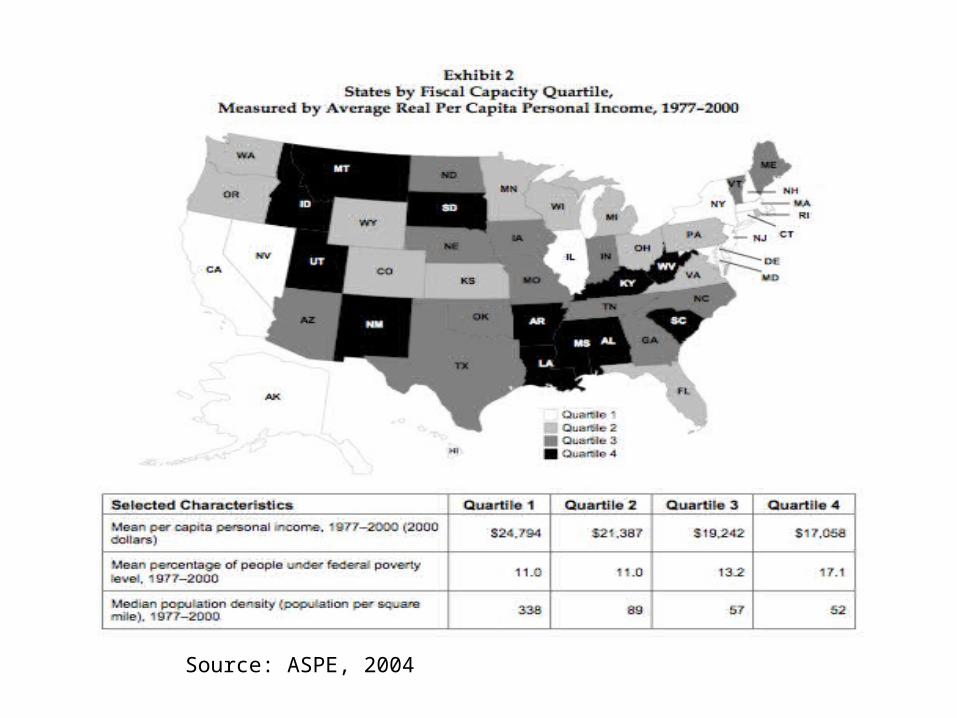
Source: ASPE, 2004

Did PRWORA Control Welfare Spending?Per Capita Spending on AFDC/TANF, FY1977-200
Source: ASPE, 2004
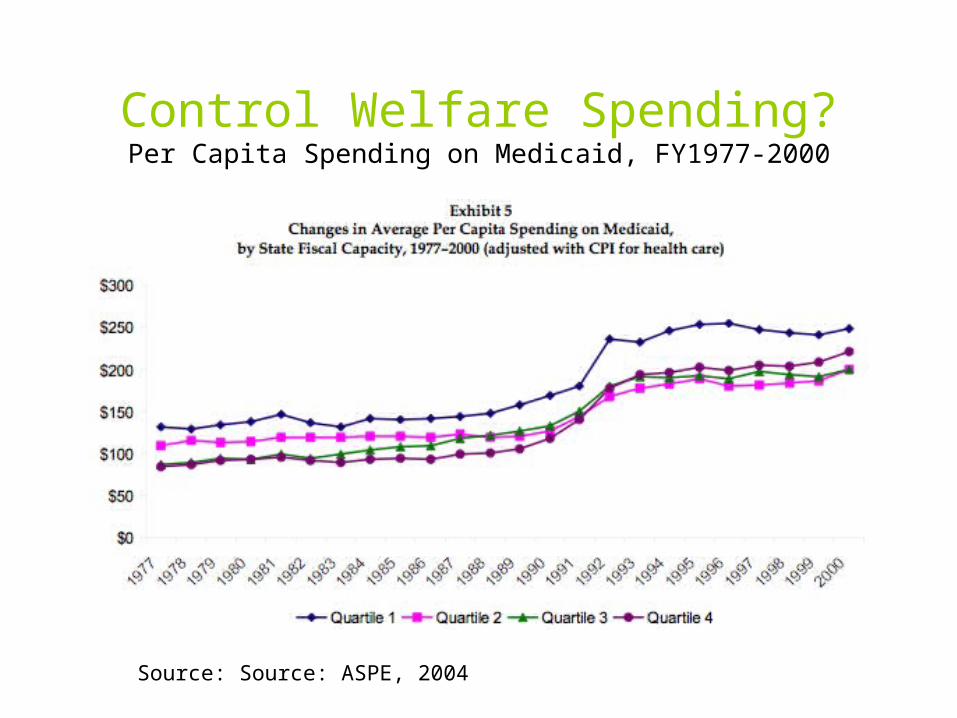
Control Welfare Spending?Per Capita Spending on Medicaid, FY1977-2000
Source: Source: ASPE, 2004

Control Welfare Spending?Per Capita Spending on Other Services, FY1977-
2000
Source: ASPE, 2004

Did TANFDecrease Dependency ?
• Welfare rolls fell by around 60 percent between 1996 and 2000.
• Caseloads continued to fall after 2000 as poverty began to rise. – Caseloads did not increase with recession
• Personal responsibility – Employment rates for single mothers rose from 62% in 1995
to 73% in 2000. In 2005 they had fallen to 69%.Source: TANF AT 10Program Results are More Mixed Than Often Understood,
Sharon Parrott and Arloc Sherman http://www.cbpp.org/8-17-06tanf.htm.
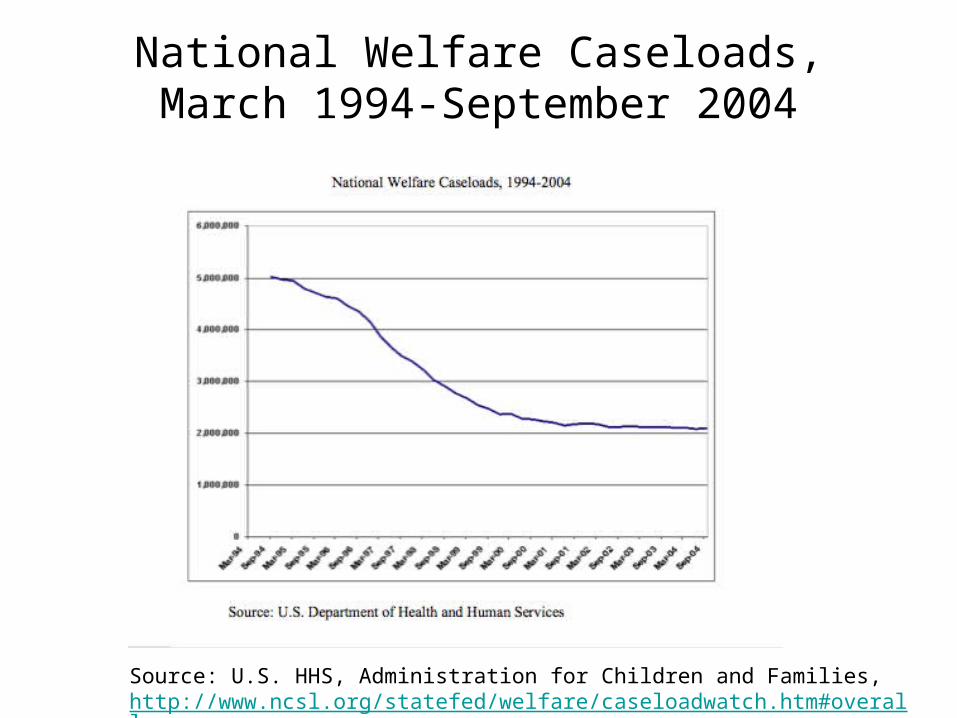
National Welfare Caseloads, March 1994-September 2004
Source: U.S. HHS, Administration for Children and Families, http://www.ncsl.org/statefed/welfare/caseloadwatch.htm#overall

Alternative Criteria: Work and Income,
aka Personal Responsibility
• LFPR for single mothers rose from 44 to 66 percent between 1994 and 2001 (Source: Blank, 2006)
• Employment rates– Rose from 62 to 73 percent, 1995-2000– Fell to 69 percent in 2005(Source: Parrot and Sherman, 2006)

Alternative Criteria: Work and Income, cont.
• Adequacy– Average incomes rose by about $5,000– Earnings increases were larger than
welfare benefits declines– Income is not adjusted for costs of working– Modest income growth over time
(Source: Blank, 2006)

Work and Income, cont.
• Hardship? (Adequacy) – More single-mothers report not being on welfare
and not working– Fewer poor children receiving cash assistance– Women involuntarily terminated have lower
incomes and worse outcomes--how are they surviving?
Source: Parrott and Arloc Sherman, 2006
http://www.cbpp.org/8-17-06tanf.htm.


Poverty Reduction
Poverty fell initially•Poverty rates for single-mother households fell
to historically low levels by late 1990s
Slight increase in past 4 years• Increases in employment greater than declines
in poverty•Share of the working poor rose and is higher
than in early 1990s•Share of the poor living in extreme poverty
reached a historic high, 43 percent in 2005.

Poverty rates
1994 2000 2004All agesAll races 14.5 11.3 12.7Blacks 30.6 22.5 24.7Hispanics 30.7 21.5 21.9Under 18All races 21.8 16.2 17.8Blacks 43.8 31.2 33.6Hispanics 41.5 28.4 28.9
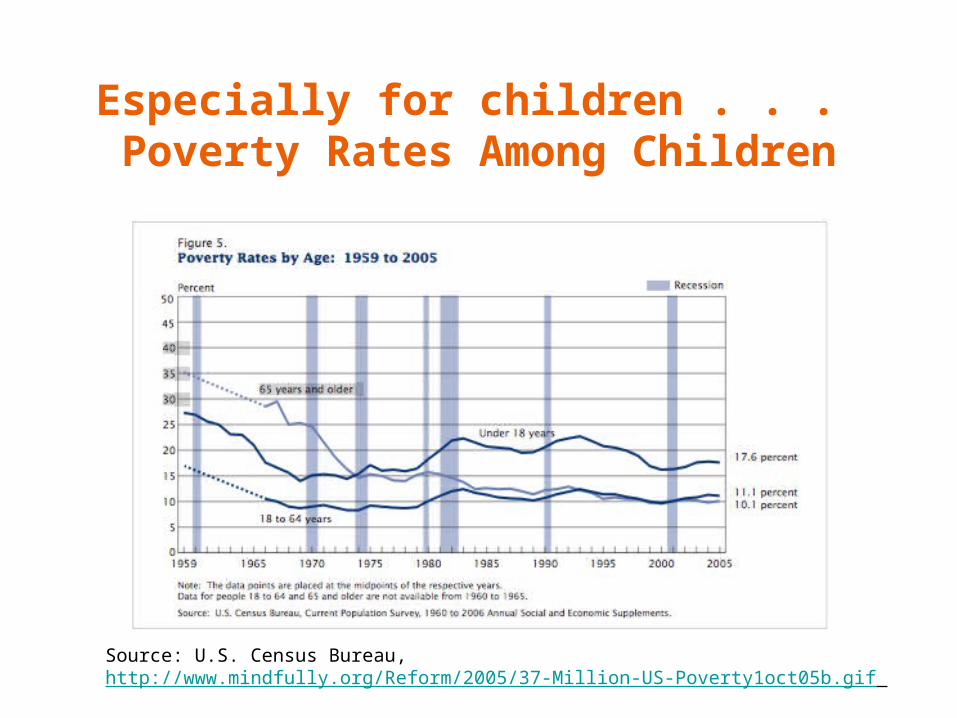
Especially for children . . . Poverty Rates Among Children
Source: U.S. Census Bureau, http://www.mindfully.org/Reform/2005/37-Million-US-Poverty1oct05b.gif

Poverty Rates Among Black Children, cont.
Melissa G. Pardue, “Sharp Reduction in Black Child Poverty Due to Welfare Reform,” The Heritage Foundation Backgrounder #1661, June 12,2003 http://www.heritage.org/Research/Welfare/bg1661.cfm?renderforprint=1
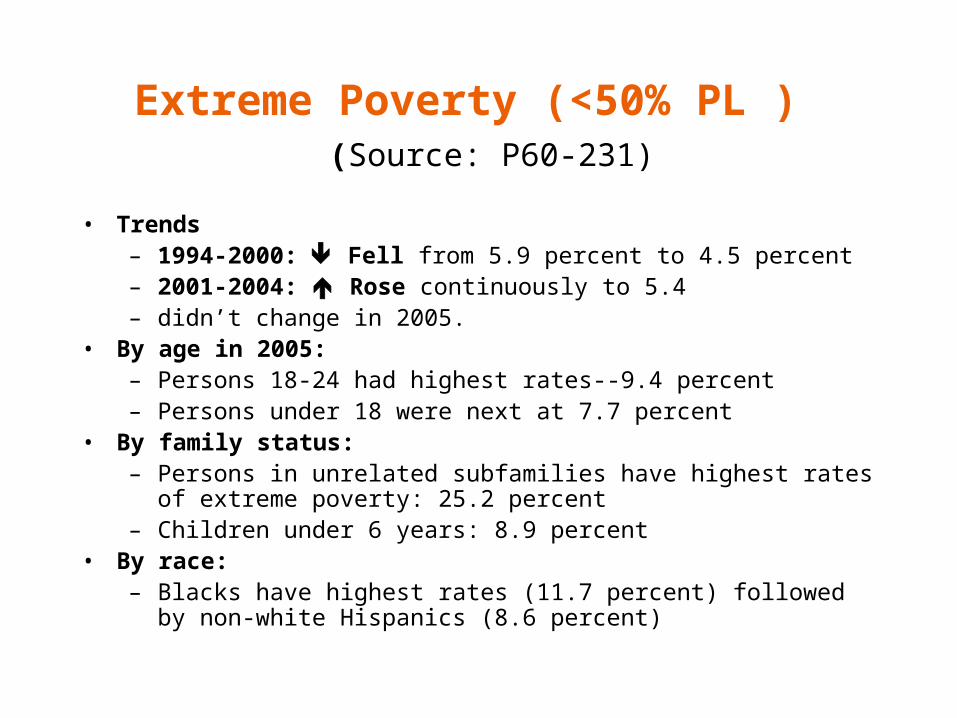
Extreme Poverty (<50% PL ) (Source: P60-231)
• Trends– 1994-2000: Fell from 5.9 percent to 4.5 percent – 2001-2004: Rose continuously to 5.4 – didn’t change in 2005.
• By age in 2005:– Persons 18-24 had highest rates--9.4 percent– Persons under 18 were next at 7.7 percent
• By family status:– Persons in unrelated subfamilies have highest rates of extreme
poverty: 25.2 percent– Children under 6 years: 8.9 percent
• By race:– Blacks have highest rates (11.7 percent) followed by non-white
Hispanics (8.6 percent)

Extreme Poverty Rates Among Children by Race
Source: U.S. Census Bureau, http://www.jointcenter.org/DB/printer/chilpovt.htm
Alternative Criteria: Other effects
• Effects on Children– child abuse—down since early 1990s– Some positive achievement and behavioral
effects on young children associated with use of center-based child care
– Some small negative effects on adolescents associated with lack of parental supervision

What really caused the changes in work and income?• TANF Work enforcement
– Diversion effects.– Sanctions, time limits, messages??
• Good economy– Many jobs, even for the unskilled.– Rising real wages.
• New benefits– Especially EITC – a higher minimum wage (Sept. 1997)
• Relative role of these factors is disputed.