
January 21, 2009 Investment Outlook 2009: How to position your Portfolio Robert J. Tilden, CFA, CMA,...
27
January 21, 2009 Investment Outlook 2009: How to position your Portfolio Robert J. Tilden, CFA, CMA, ICD.D Partner
-
Upload
scarlett-wilkerson -
Category
Documents
-
view
217 -
download
1
Transcript of January 21, 2009 Investment Outlook 2009: How to position your Portfolio Robert J. Tilden, CFA, CMA,...

January 21, 2009
Investment Outlook 2009: How to position
your Portfolio
Robert J. Tilden, CFA, CMA, ICD.D
Partner

2
Agenda
• Review of 2008 – How bad was it?
• Outlook for 2009
• Positioning your portfolio for 2009
• Jarislowsky Fraser Limited

3
Oil Versus the Canadian Dollar (1994 – 2008)
Source: Bloomberg
Oil Price vs. the Canadian Dollar (1994-2008)
$0.60
$0.70
$0.80
$0.90
$1.00
$1.10
$1.20
Oct-94 Jul-96 Apr-98 Jan-00 Oct-01 Aug-03 May-05 Feb-07 Nov-08
US$
/C$
$10
$25
$40
$55
$70
$85
$100
$115
$130
$145
US$
per
Bar
rel
C$
Oil (US$)

4
Market Returns - Periods ending December 31, 2008
(%) Q4 6 Mths 1 Yr 5 Yrs 10 Yrs
S&P/TSX -22.7 -36.8 -33.0 4.2 5.3
S&P 500 (C$) -9.8 -14.0 -21.9 -3.2 -3.6
S&P 500 (US$) -21.9 -28.5 -37.0 -2.2 -1.4
DJIA (C$) -6.6 -7.0 -18.0 -4.5 -2.7
DJIA (US$) -19.1 -22.7 -33.8 -3.4 -0.5
MSCI EAFE (C$) -7.5 -23.5 -29.4 1.0 -1.1
MSCI EAFE (US$) -19.9 -36.3 -43.1 2.1 1.2
Shenzhen (US$) China -9.6 -29.7 -58.7 13.8 6.9
BSE Sensex (US$) India -27.2 -36.1 -61.0 10.8 10.7
EAFE Emerging Mkts (US$) -27.6 -47.0 -53.2 8.0 4.3
Dex Bond Universe 4.5 4.1 6.4 5.5 6.0
91 Day T-Bills 0.7 1.5 3.3 3.3 3.7
C$/US$ -13.5 -16.8 -19.3 1.1 2.3
Converted to Canadian funds using Bank of Canada noon rates.
Returns are annualized for periods greather than 1 year.

55
Market Return Comparison
27.4
13.3
8.5
11.6
0.0
5.0
10.0
15.0
20.0
25.0
30.0
35.0
S&P/TSX S&P 500 MSCI EAFE MSCI World
Market Performance
(Periods Ending December 31, 2008)
GICS Energy Sector Weights by Market
as at December 31, 2008
S&P/TSX C$ S&P 500 C$ MSCI EAFE C$RUSSELL 2000 C$SCM BOND UNIVERSE C$
S&P 500 U.S.$MSCI EAFE U.S.$RUSSELL 2000 U.S.$
1 Year 4 Year
(%
)

66
S&P/TSX Sector Returns
Index IndexWeightings 1 Year Weightings 3 Months
(%) (%) (%) (%)
Consumer Staples 3.4 -6.1 Consumer Staples 3.4 3.3Utilities 1.9 -20.5 Utilities 1.9 -6.6
Telecommunication Services 6.0 -24.9 Health Care 0.4 -10.7
Industrials 6.1 -25.1 Consumer Discretionary 4.7 -12.2Materials 17.6 -26.5 Materials 17.6 -12.3
Health Care 0.4 -30.2 Telecommunication Services 6.0 -12.7
Industrials 6.1 -15.3S&P/TSX -33.0
S&P/TSX -22.7
Energy 27.4 -33.9Consumer Discretionary 4.7 -35.4 Energy 27.4 -27.2Financial Services 29.2 -36.5 Information Technology 3.3 -27.2
Information Technology 3.3 -54.2 Financial Services 29.2 -29.9
Bold type indicates sectors where JF was overweighted
Cyclical Sectors: 37.7 of index
For the periods ended December 31, 2008

7
S&P 500 Sector Returns
Index Index
Weightings 1 Year Weightings 3 Months
(%) (%) (%) (%)
Consumer Staples 12.9 5.8 Telecommunication Services 3.8 14.3
Health Care 14.8 -3.5 Utilities 4.2 3.3
Utilities 4.2 -11.2 Health Care 14.8 1.9Telecommunication Services 3.8 -13.1 Consumer Staples 12.9 1.0Consumer Discretionary 8.4 -16.8 Energy 13.3 -8.0
Energy 13.3 -18.5
S&P 500 -9.5S&P 500 -21.2
Consumer Discretionary 8.4 -10.6
Industrials 11.1 -24.9 Industrials 11.1 -11.8
Information Technology 15.3 -28.9 Information Technology 15.3 -13.9
Materials 2.9 -32.0 Materials 2.9 -19.8
Financial Services 13.3 -44.1 Financial Services 13.3 -26.9
Bold type indicates sectors where JF was overweighted
Canadian dollar sector returns have been calculated using the London 4pm rate.
Cyclical sectors: 41.5% of index
For the periods ended December 31, 2008 ($C)

8
MSCI EAFE Sector Returns
Index Index
Weightings 1 Year Weightings 3 Months(%) (%) (%) (%)
Health Care 9.8 1.9 Telecommunication Services 7.0 12.3Utilities 7.7 -9.8 Health Care 9.8 6.8Consumer Staples 10.3 -13.6 Utilities 7.7 6.1
Telecommunication Services 7.0 -15.0 Consumer Staples 10.3 0.5
Energy 8.5 -22.2 Energy 8.5 -1.3Industrials 11.5 -4.9
MSCI EAFE -28.8 Information Technology 5.1 -6.1
Industrials 11.5 -30.3 MSCI EAFE -7.0Information Technology 5.1 -30.8Consumer Discretionary 9.6 -31.4 Consumer Discretionary 9.6 -8.3
Materials 7.8 -40.9 Materials 7.8 -14.7
Financial Services 22.6 -43.5 Financial Services 22.6 -21.4
Bold type indicates sectors where JF was overweighted
Canadian dollar sector returns have been calcualted using the London 4pm rate.
Cyclical Sectors: 41.1% of index
For the periods ended December 31, 2008 ($C)

9
Bond Portfolio
• Continued turmoil in financial markets sparked a crisis of confidence in credit markets, effectively freezing them.
• Credit spreads widened to historic highs
• As liquidity and rationality return to credit markets, spreads should narrow, leading the portfolio to outperform
Q4/08 1 Year
(%) (%)
Universe 4.5 6.4
Federal Bonds 7.4 11.5
Provincial Bonds 5.1 5.3
Corporate Bonds -0.3 0.2
DEX Bond Universe Returns to December 31, 2008

10
Bond Portfolio Analysis - Performance
For the Quarter Ended December 31, 2008
4.3 4.3
5.2
4.5
0.0
1.0
2.0
3.0
4.0
5.0
6.0
(%)
Short
Term
Mid-Term Long Term DEX
Universe
8.6
7.0
2.7
6.4
0.0
1.0
2.0
3.0
4.0
5.0
6.0
7.0
8.0
9.0
(%)
Short Term Mid-Term Long Term DEX
Universe
For the Year Ended December 31, 2008

11
Mid Corporate Spread Widening
Source: PC Bond

12
Equity Valuations
Source: Bloomberg (as of January 12, 2009)
One Year Forward Price/Earnings Ratios One Year Forward Earnings Yield as a % of 10 Year Gov’t Yields
Russia
FranceGermany UKCanada India Mexico US
Japan
AustraliaChina
0
2
4
6
8
10
12
14
16
18
Nominal versus Real Yield on 10 Year Government Bonds
CanadaChinaFrance GermanyUS
JapanMexicoAustraliaUKIndia
Russia-6
-4
-2
0
2
4
6
8
10
Nom Yield Real Yield
JapanUS
ChinaGermanyCanada
UKFrance
RussiaAustralia
MexicoIndia
0
100
200
300
400
500
S&P 500 One Year Forward Operating Earnings Yield from IBES as a % of 10 Year Treasury Bond Yields
The 'Fed Model' JAN 2009
400
350
300
250
200
150
100
5082 84 86 88 90 92 94 96 98 00 02 04 06 08 10
Average
+1 Dev
-1 Dev
331.9

13
Equities Relative to Bonds
• The stock market declines of 2008 have created extremely attractive buying opportunities
• Monetary inflation remains a problem for the long term
• Major credit markets are quite disrupted and a return to more fluid credit markets will take time to orchestrate

14
Factors Affecting 2008 Performance
• Global economy moves from growth to slower growth/recession
• Growth constrained by liquidity crisis – bank lending constrained
• Negative returns in all equity categoriesBest Worst
Non Cyclical Sectors Emerging MarketsConsumer Cyclical
SectorsHealthcare Resources
• Spread widening continues in bond market
• Outstanding Issues• Recession – How long? How deep?• Consequences of massive liquidity injection for inflation – currencies• New Rules and Regulations
Portfolio holds no sub prime mortgage or asset backed securities

15
Investment Outlook … 2009
Economic Review
Investment Outlook
• The global economies are entrenched in a recession brought on by an over levered economy.
• A liquidity crisis (lack of lending) is exacerbating an already difficult recession.
• Unprecedented fiscal and monetary policy stimuli are being applied.
• Yields on government bonds are very low. Shorter term, high quality corporate bonds are preferred.
• Stocks are attractively valued and provide the best return potential in the coming years.
• Lower risk, higher dividend paying stocks in non-cyclical areas such as Health Care and Consumer Staples are preferred given uncertainty with regard to the length of the recession.

16
Consumer Credit and Mortgage DebtAs Percent of Disposable Income
Shaded Areas Represent U.S. Economic Recessions
130 130
120 120
110 110
100 100
90 90
80 80
70 70
60 60
50 501970 1975 1980 1985 1990 1995 2000 2005 2010
CanadaU.S. 126.3
123.1
Consumer Savings RateCanada( ) and U.S. ( )
Shaded Areas Represent Canadian Economic Recessions
NOV 2008
25 25
20 20
15 15
10 10
5 5
0 0
-5 -51970 1975 1980 1985 1990 1995 2000 2005
2.13.0
Economic Charts
Source: TD Securities

17
U.S. Single Family Housing StartsPer 1000 Population
Shaded Areas Represent U.S. Housing RecessionsM884 NOV 2008
7 7
6 6
5 5
4 4
3 3
2 2
1 11965 1970 1975 1980 1985 1990 1995 2000 2005 2010
1.44
Economic Charts
Source: TD Securities

18
U.S. Single-Family Housing StartsThousands
Shaded Areas Represent U.S. Economic RecessionsM10 NOV 2008
2000 2000
1800 1800
1600 1600
1400 1400
1200 1200
1000 1000
800 800
600 600
400 40082 84 86 88 90 92 94 96 98 00 02 04 06 08 10 12
12 Month Average
-46.0% Yr/Yr
Economic Charts
Source: TD Securities

19
Economic Charts
Source: TD Securities
Twelve Month Forward Real GDP GrowthConsensus Economics Survey
GDP aggregated using current exchange ratesM154 OCT 2008
6 6
5 5
4 4
3 3
2 2
1 1
0 0
-1 -193 94 95 96 97 98 99 00 01 02 03 04 05 06 07 08 09 10
North AmericaWestern EuropeAsia PacificLatin AmericaWorld
-0.200.02
3.57
2.98
1.35

20
Economic Charts
Source: TD Securities
Global InflationYear over Year %Change in CPI
M627 NOV 2008
6 6
5 5
4 4
3 3
2 2
1 1
0 0
-1 -1
-2 -297 98 99 00 01 02 03 04 05 06 07 08 09 10
Canada
U.S.
JapanGermany
U.K.

21
Economic Charts
U.S. Consumer In Global Perspective(percent share of Global GDP: 2007)
Source: Bureau of Economic Statistics, IMF, Merrill Lynch
2.6
3.9
4.7
5.2
6.1
6.1
8.1
18.2
0 5 10 15 20
Canada
Italy
France
U.K.
Germany
China
Japan
U.S. Consumer

22
Price-Earnings MultiplesBased On Trailing Operating Earnings
M968 JAN 2009
35 35
30 30
25 25
20 20
15 15
10 10
5 582 84 86 88 90 92 94 96 98 00 02 04 06 08 10
TSXS&P 500
9.8
12.8
Source: Citigroup
Note: Valuations reflecte the MSCI All Country World Index going back to 1995 and Citigroup estimates prior to that date
5
10
15
20
25
30
35
40
70 72 74 78 80 82 84 86 88 90 92 94 96 98 00 02 04 06 08
Global PE
Long Term Average
2000s Avg
1980s Avg1970s Avg
1990s Avg
5
10
15
20
25
30
35
40
Shaded Areas Represent Periods of Earnings Slumps
Price-Earnings MultiplesBased On Trailing Earnings
Source: TD Securities, Russell
Economic Charts

23
Portfolio Positioning for 2009
• Confirm your risk tolerance
• Ensure cash levels are sufficient to cover expenses for the next 2-3 years
• For fixed income (i.e. bonds) focus on short term, high quality corporate bonds as the yields on government bonds are very low.
• Stocks are attractively valued and should provide the best return potential in the coming years
• Ensure that your portfolio is properly diversified
• Three oil and two gas companies doesn’t count!
• Lower risk, higher dividend paying stocks in non-cyclical areas such as Health Care and Consumer Staples are preferred given uncertainty with regard to the length of the recession.

24
JFL Corporate Overview
• Jarislowsky Fraser Limited is a registered investment counseling firm, managing portfolios for clients in North America and Europe.
• The company was founded in 1955 as an investment research firm. In the 1960’s, the firm began to use this research material to counsel private investors and institutions.
• Our primary goal is growing capital for our clients in a low risk manner. Our firm is known for advocating shareholder rights and ensuring good corporate governance.
• Jarislowsky Fraser Limited is totally independent, with no corporate affiliations. The firm is owned by the partners.
25
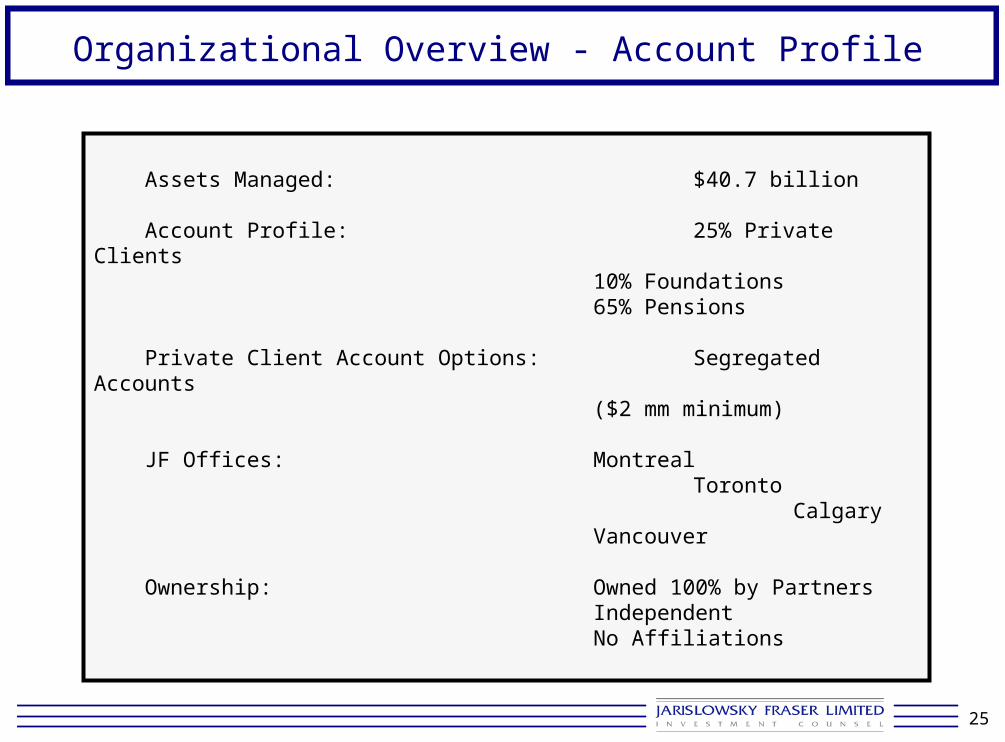
Assets Managed: $40.7 billion
Account Profile: 25% Private Clients 10% Foundations 65% Pensions
Private Client Account Options: Segregated Accounts ($2 mm minimum)
JF Offices: Montreal
Toronto Calgary
Vancouver
Ownership: Owned 100% by PartnersIndependent No Affiliations
Organizational Overview - Account Profile

26
Fee Schedule
First $ 5 Million .50 of 1%
Next $ 5 Million .35 of 1%
Next $ 15 Million .25 of 1%
Next $ 25 Million .20 of 1%
Next $ 50 Million .15 of 1%
Over $ 100 Million .10 of 1%
1. Excludes custodian fees and brokerage commissions2. JF fees are invoiced quarterly in advance, based on the ending
market value at the latest quarter end.
AmountFee Charged(Per Annum)

27
Contact Information
Calgary Office
Robert J. Tilden
Partner
Jarislowsky Fraser Limited
140 4th Avenue S.W.
Suite 1640
Calgary, Alberta
T2P 3N3
Telephone: (403) 233-9117
Fax: (403) 233-9144
Email: [email protected]


