January 2014 - Fresno Council of Governments · The Fresno Council of Governments (Fresno COG)...
35
January 2014
Transcript of January 2014 - Fresno Council of Governments · The Fresno Council of Governments (Fresno COG)...
January 2014
TABLE OF CONTENTS
Section I ......................................................................................................................................1
Introduction.....................................................................................................................1
Overview of the Transit System .......................................................................................1 Section II .....................................................................................................................................5
Operator Compliance Requirements ................................................................................5
Section III .................................................................................................................................. 10
Prior Triennial Performance Recommendations ............................................................. 10
Section IV .................................................................................................................................. 13
TDA Performance Indicators .......................................................................................... 13
Section V ................................................................................................................................... 24
Review of Operator Functions ........................................................................................ 24
Operations ................................................................................................................ 24
Maintenance ............................................................................................................. 27
Marketing ................................................................................................................. 28
General Administration and Management ................................................................. 28
Section VI .................................................................................................................................. 30
Findings ......................................................................................................................... 30
Recommendations ......................................................................................................... 32
December 2012
Triennial Performance Audit of Fresno Economic Opportunities Commission – FY’s 2010-2012
PMC - 1 1
Section I
Introduction California’s Transportation Development Act (TDA) requires that a triennial performance audit be conducted of public transit entities that receive TDA revenues. The performance audit serves to ensure accountability in the use of public transportation revenue.
The Fresno Council of Governments (Fresno COG) engaged PMC to conduct the Transportation Development Act (TDA) triennial performance audit of the public transit operators under its jurisdiction in Fresno County. This performance audit is conducted for the Fresno Economic Opportunities Commission (FEOC) (formerly known as the Fresno County Economic Opportunities Commission) covering the most recent triennial period, fiscal years 2009-10 through 2011-12.
The purpose of the performance audit is to evaluate FEOC’s effectiveness and efficiency in its use of TDA funds to provide public transportation in its service area. This evaluation is required as a condition for continued receipt of these funds for public transportation purposes. In addition, the audit evaluates the FEOC’s compliance with the conditions specified in the California Public Utilities Code (PUC). This task involves ascertaining whether FEOC is meeting the PUC’s reporting requirements. Moreover, the audit includes calculations of transit service performance indicators and a detailed review of the transit administrative functions. From the analysis that has been undertaken, a set of recommendations has been made which is intended to improve the performance of transit operations.
In summary, this TDA audit affords the opportunity for an independent, constructive and objective evaluation of the organization and its operations that otherwise might not be available. The methodology for the audit included in-person interviews with management, collection and review of agency documents, data analysis, and on-site observations. The Performance Audit Guidebook for Transit Operators and Regional Transportation Planning Entities published by the California Department of Transportation (Caltrans) was used to guide in the development and conduct of the audit.
Overview of the Transit System
The FEOC is a non-profit corporation incorporated in the State of California on August 30, 1965. The agency’s purpose is to develop, conduct and administer programs established under the provisions of the Economic Opportunity Act of 1964. To this end, FEOC is a locally based community action agency which provides an array of services and programs that assist low income families and individuals with developing skills and knowledge toward self-sufficiency. The agency is supported primarily through government grants, donor contributions and fees for services. The Board of Commissioners of FEOC includes 24 members representing target areas, community organizations and institutions, and locally elected officials. The transit program is administered and managed by the Director of Food Services and Transit Systems, and the Transit Operations Coordinator/Senior Accountant. The transit program reports
Triennial Performance Audit of Fresno Economic Opportunities Commission – FY’s 2010-2012
PMC - 2 2
to an Assistant Executive Director, who in turn reports to the Executive Director. As each program under FEOC is a self sustaining entity, the transit system operates as a standalone service. FEOC Transit Systems is one of over 25 programs provided under the umbrella agency. FEOC operates a specialized transit service for social service clients throughout Fresno County acting as the co-designated Consolidated Transportation Services Agency (CTSA) for both the urban and rural regions of the county. The agency is co-designated with Fresno Area Express (FAX) for the Fresno-Clovis Metropolitan Area, and with the Fresno County Rural Transit Agency (FCRTA) for the non-urbanized areas of the county. From this designation, FEOC has responsibility for working toward improved social service transportation through coordination and consolidation of transportation services. In its effort to further coordinate social service transportation, FEOC also markets vehicle maintenance services for social service agencies. Many clients for whom FEOC provides trips are provided vehicle maintenance as well as dispatching and driver training services. Other clients have contracted with FEOC for maintenance only.
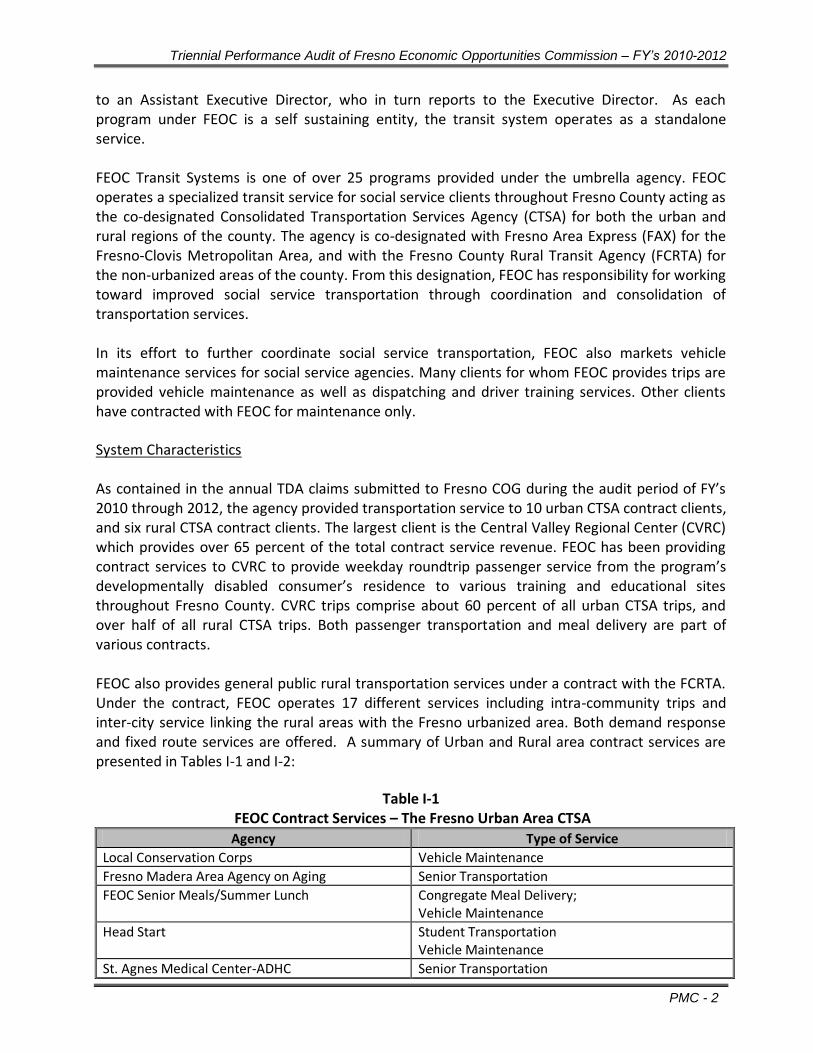
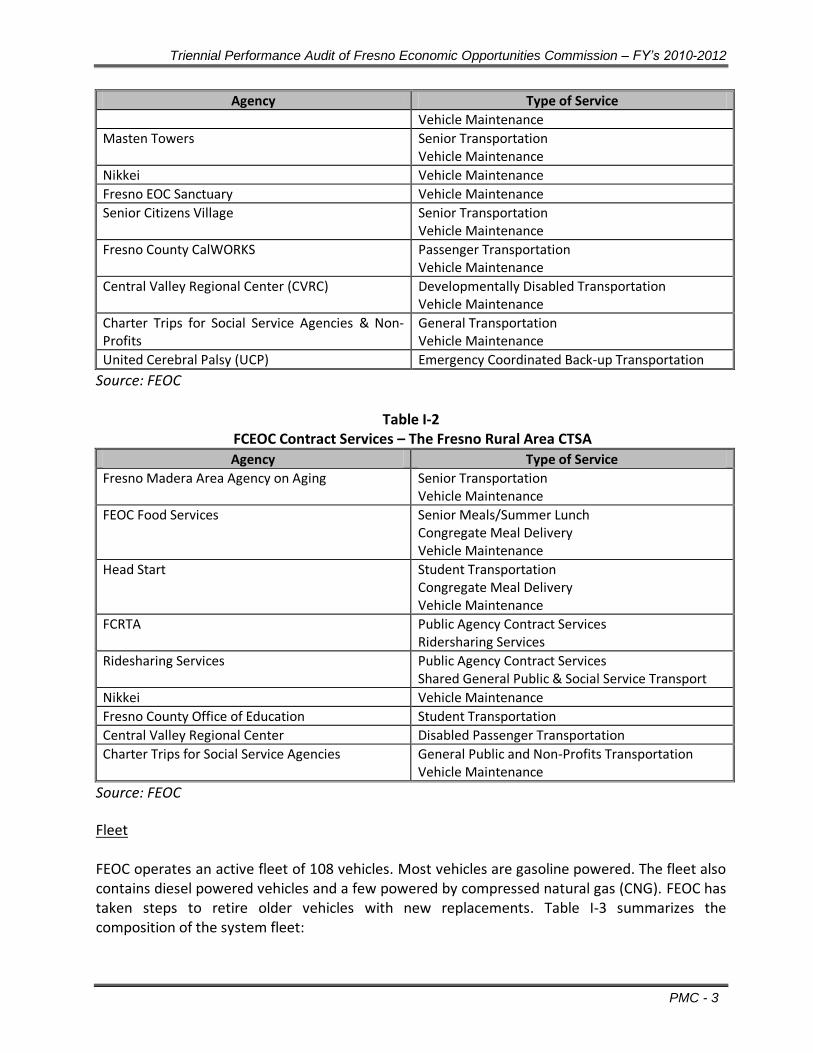
System Characteristics As contained in the annual TDA claims submitted to Fresno COG during the audit period of FY’s 2010 through 2012, the agency provided transportation service to 10 urban CTSA contract clients, and six rural CTSA contract clients. The largest client is the Central Valley Regional Center (CVRC) which provides over 65 percent of the total contract service revenue. FEOC has been providing contract services to CVRC to provide weekday roundtrip passenger service from the program’s developmentally disabled consumer’s residence to various training and educational sites throughout Fresno County. CVRC trips comprise about 60 percent of all urban CTSA trips, and over half of all rural CTSA trips. Both passenger transportation and meal delivery are part of various contracts. FEOC also provides general public rural transportation services under a contract with the FCRTA. Under the contract, FEOC operates 17 different services including intra-community trips and inter-city service linking the rural areas with the Fresno urbanized area. Both demand response and fixed route services are offered. A summary of Urban and Rural area contract services are presented in Tables I-1 and I-2:
Table I-1 FEOC Contract Services – The Fresno Urban Area CTSA
Agency Type of Service
Local Conservation Corps Vehicle Maintenance
Fresno Madera Area Agency on Aging Senior Transportation
FEOC Senior Meals/Summer Lunch Congregate Meal Delivery; Vehicle Maintenance
Head Start Student Transportation Vehicle Maintenance
St. Agnes Medical Center-ADHC Senior Transportation
Triennial Performance Audit of Fresno Economic Opportunities Commission – FY’s 2010-2012
PMC - 3 3
Agency Type of Service
Vehicle Maintenance
Masten Towers Senior Transportation Vehicle Maintenance
Nikkei Vehicle Maintenance
Fresno EOC Sanctuary Vehicle Maintenance
Senior Citizens Village Senior Transportation Vehicle Maintenance
Fresno County CalWORKS Passenger Transportation Vehicle Maintenance
Central Valley Regional Center (CVRC) Developmentally Disabled Transportation Vehicle Maintenance
Charter Trips for Social Service Agencies & Non-Profits
General Transportation Vehicle Maintenance
United Cerebral Palsy (UCP) Emergency Coordinated Back-up Transportation
Source: FEOC
Table I-2 FCEOC Contract Services – The Fresno Rural Area CTSA
Agency Type of Service
Fresno Madera Area Agency on Aging Senior Transportation Vehicle Maintenance
FEOC Food Services Senior Meals/Summer Lunch Congregate Meal Delivery Vehicle Maintenance
Head Start Student Transportation Congregate Meal Delivery Vehicle Maintenance
FCRTA Public Agency Contract Services Ridersharing Services
Ridesharing Services Public Agency Contract Services Shared General Public & Social Service Transport
Nikkei Vehicle Maintenance
Fresno County Office of Education Student Transportation
Central Valley Regional Center Disabled Passenger Transportation
Charter Trips for Social Service Agencies General Public and Non-Profits Transportation Vehicle Maintenance
Source: FEOC
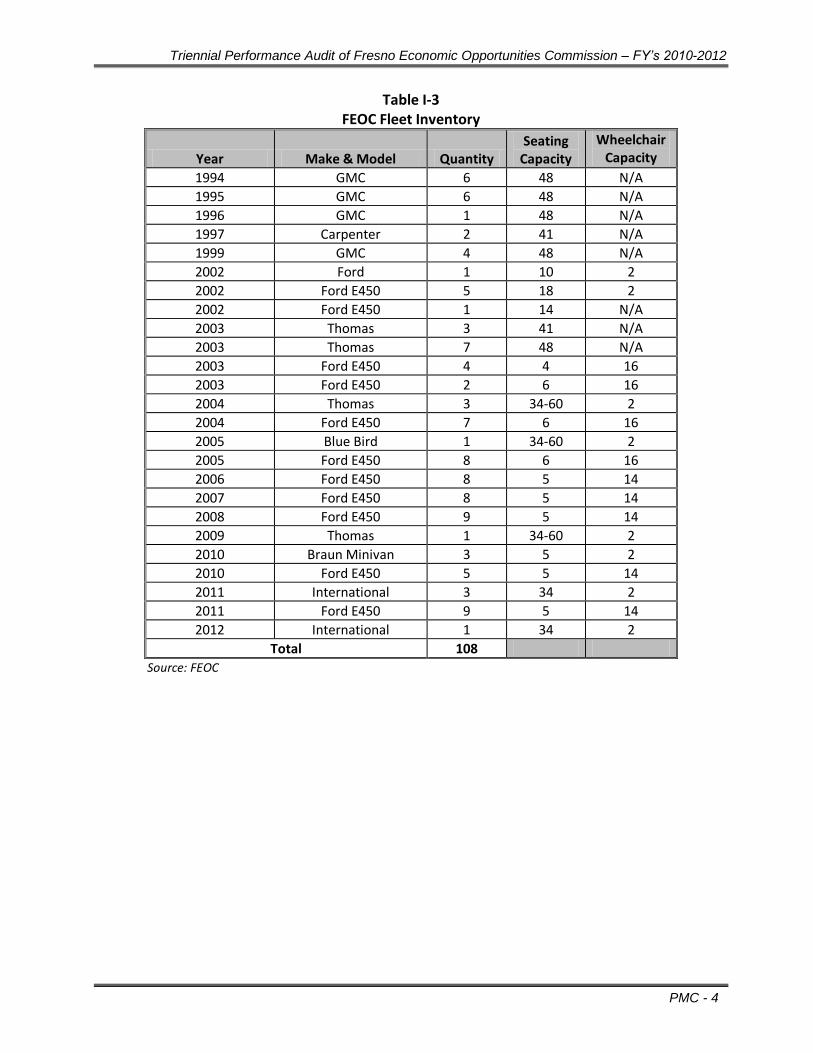
Fleet FEOC operates an active fleet of 108 vehicles. Most vehicles are gasoline powered. The fleet also contains diesel powered vehicles and a few powered by compressed natural gas (CNG). FEOC has taken steps to retire older vehicles with new replacements. Table I-3 summarizes the composition of the system fleet:
Triennial Performance Audit of Fresno Economic Opportunities Commission – FY’s 2010-2012
PMC - 4 4
Table I-3 FEOC Fleet Inventory
Year Make & Model Quantity Seating
Capacity
Wheelchair Capacity
1994 GMC 6 48 N/A
1995 GMC 6 48 N/A
1996 GMC 1 48 N/A
1997 Carpenter 2 41 N/A
1999 GMC 4 48 N/A
2002 Ford 1 10 2
2002 Ford E450 5 18 2
2002 Ford E450 1 14 N/A
2003 Thomas 3 41 N/A
2003 Thomas 7 48 N/A
2003 Ford E450 4 4 16
2003 Ford E450 2 6 16
2004 Thomas 3 34-60 2
2004 Ford E450 7 6 16
2005 Blue Bird 1 34-60 2
2005 Ford E450 8 6 16
2006 Ford E450 8 5 14
2007 Ford E450 8 5 14
2008 Ford E450 9 5 14
2009 Thomas 1 34-60 2
2010 Braun Minivan 3 5 2
2010 Ford E450 5 5 14
2011 International 3 34 2
2011 Ford E450 9 5 14
2012 International 1 34 2
Total 108
Source: FEOC
Triennial Performance Audit of Fresno Economic Opportunities Commission – FY’s 2010-2012
PMC - 5 5
Section II
Operator Compliance Requirements
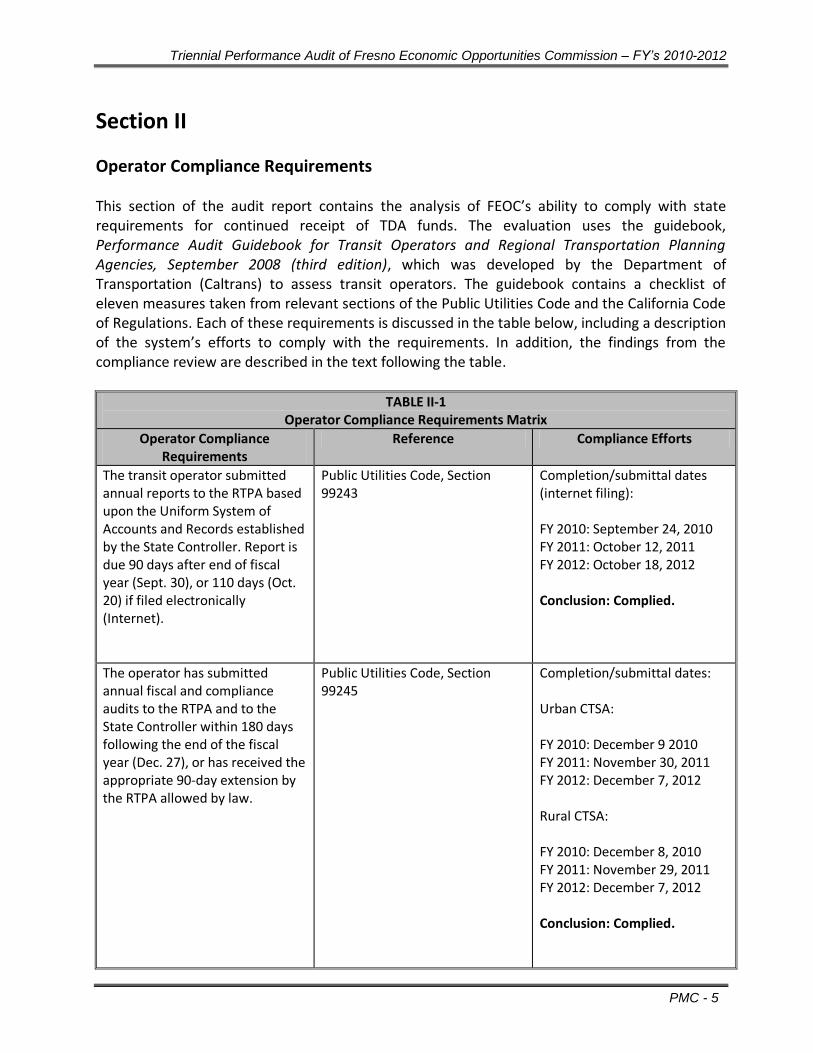
This section of the audit report contains the analysis of FEOC’s ability to comply with state requirements for continued receipt of TDA funds. The evaluation uses the guidebook, Performance Audit Guidebook for Transit Operators and Regional Transportation Planning Agencies, September 2008 (third edition), which was developed by the Department of Transportation (Caltrans) to assess transit operators. The guidebook contains a checklist of eleven measures taken from relevant sections of the Public Utilities Code and the California Code of Regulations. Each of these requirements is discussed in the table below, including a description of the system’s efforts to comply with the requirements. In addition, the findings from the compliance review are described in the text following the table.
TABLE II-1 Operator Compliance Requirements Matrix
Operator Compliance Requirements
Reference Compliance Efforts
The transit operator submitted annual reports to the RTPA based upon the Uniform System of Accounts and Records established by the State Controller. Report is due 90 days after end of fiscal year (Sept. 30), or 110 days (Oct. 20) if filed electronically (Internet).
Public Utilities Code, Section 99243
Completion/submittal dates (internet filing): FY 2010: September 24, 2010 FY 2011: October 12, 2011 FY 2012: October 18, 2012 Conclusion: Complied.
The operator has submitted annual fiscal and compliance audits to the RTPA and to the State Controller within 180 days following the end of the fiscal year (Dec. 27), or has received the appropriate 90-day extension by the RTPA allowed by law.
Public Utilities Code, Section 99245
Completion/submittal dates: Urban CTSA: FY 2010: December 9 2010 FY 2011: November 30, 2011 FY 2012: December 7, 2012 Rural CTSA: FY 2010: December 8, 2010 FY 2011: November 29, 2011 FY 2012: December 7, 2012 Conclusion: Complied.
Triennial Performance Audit of Fresno Economic Opportunities Commission – FY’s 2010-2012
PMC - 6 6
TABLE II-1 Operator Compliance Requirements Matrix
Operator Compliance Requirements
Reference Compliance Efforts
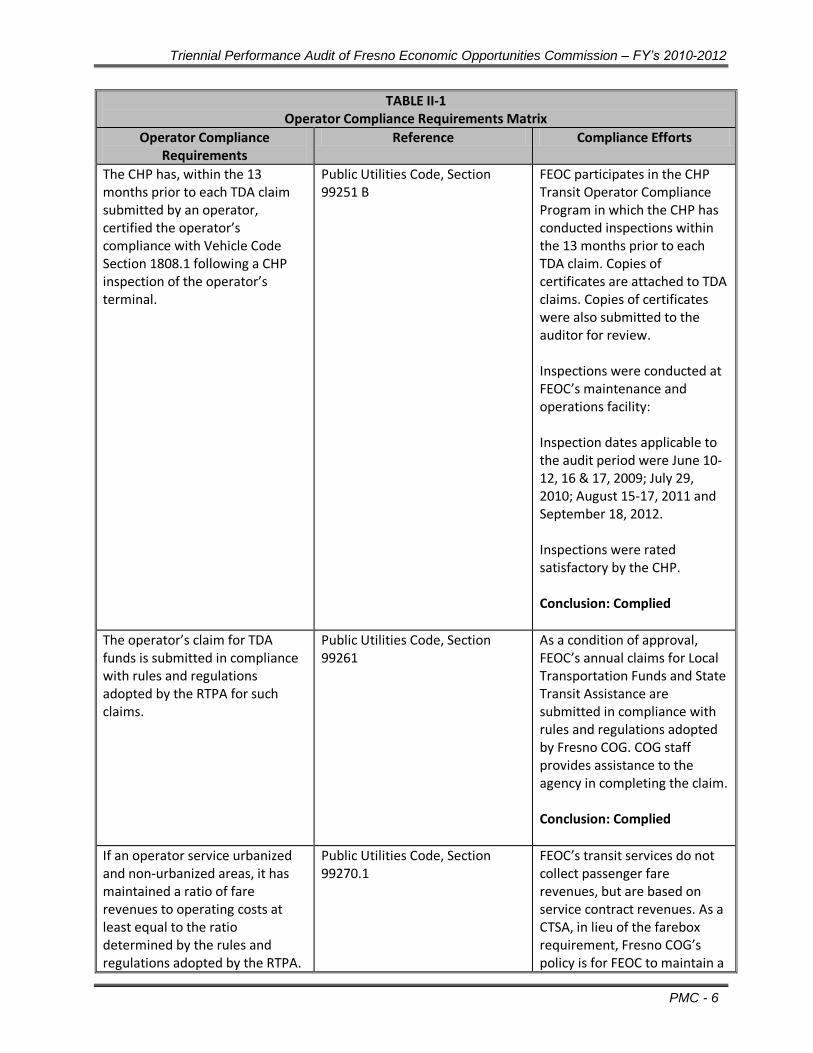
The CHP has, within the 13 months prior to each TDA claim submitted by an operator, certified the operator’s compliance with Vehicle Code Section 1808.1 following a CHP inspection of the operator’s terminal.
Public Utilities Code, Section 99251 B
FEOC participates in the CHP Transit Operator Compliance Program in which the CHP has conducted inspections within the 13 months prior to each TDA claim. Copies of certificates are attached to TDA claims. Copies of certificates were also submitted to the auditor for review. Inspections were conducted at FEOC’s maintenance and operations facility: Inspection dates applicable to the audit period were June 10-12, 16 & 17, 2009; July 29, 2010; August 15-17, 2011 and September 18, 2012. Inspections were rated satisfactory by the CHP. Conclusion: Complied
The operator’s claim for TDA funds is submitted in compliance with rules and regulations adopted by the RTPA for such claims.
Public Utilities Code, Section 99261
As a condition of approval, FEOC’s annual claims for Local Transportation Funds and State Transit Assistance are submitted in compliance with rules and regulations adopted by Fresno COG. COG staff provides assistance to the agency in completing the claim. Conclusion: Complied
If an operator service urbanized and non-urbanized areas, it has maintained a ratio of fare revenues to operating costs at least equal to the ratio determined by the rules and regulations adopted by the RTPA.
Public Utilities Code, Section 99270.1
FEOC’s transit services do not collect passenger fare revenues, but are based on service contract revenues. As a CTSA, in lieu of the farebox requirement, Fresno COG’s policy is for FEOC to maintain a
Triennial Performance Audit of Fresno Economic Opportunities Commission – FY’s 2010-2012
PMC - 7 7
TABLE II-1 Operator Compliance Requirements Matrix
Operator Compliance Requirements
Reference Compliance Efforts
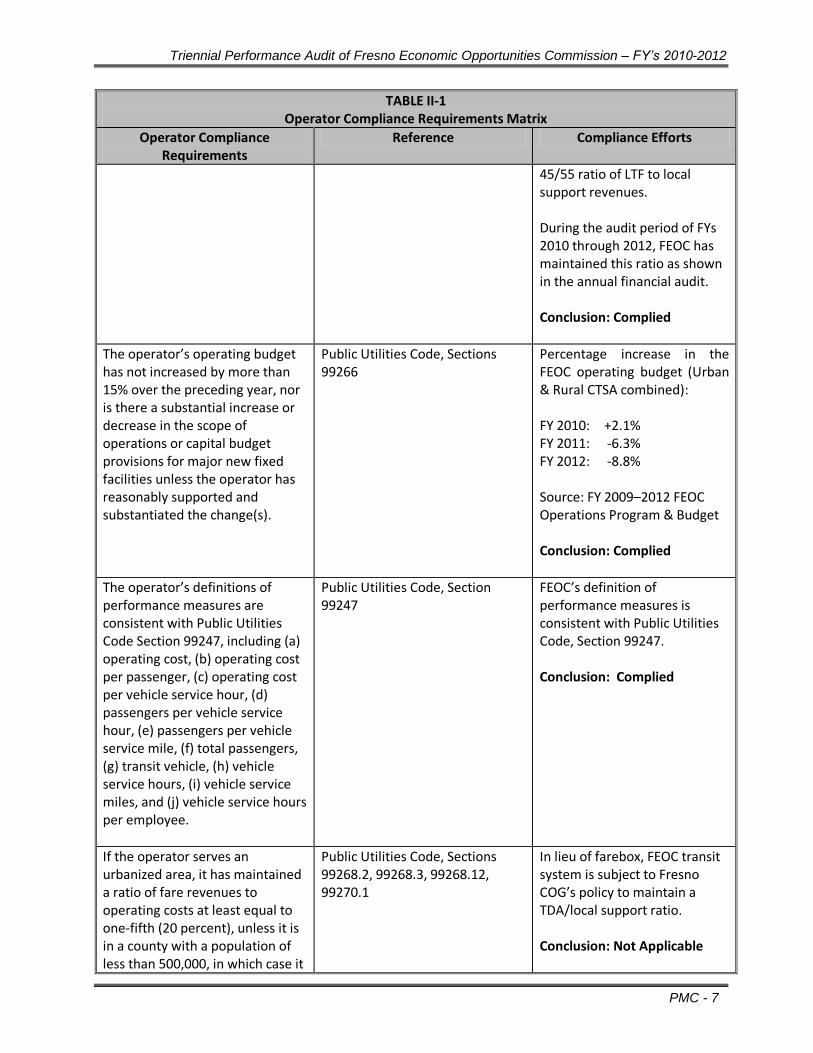
45/55 ratio of LTF to local support revenues. During the audit period of FYs 2010 through 2012, FEOC has maintained this ratio as shown in the annual financial audit. Conclusion: Complied
The operator’s operating budget has not increased by more than 15% over the preceding year, nor is there a substantial increase or decrease in the scope of operations or capital budget provisions for major new fixed facilities unless the operator has reasonably supported and substantiated the change(s).
Public Utilities Code, Sections 99266
Percentage increase in the FEOC operating budget (Urban & Rural CTSA combined): FY 2010: +2.1% FY 2011: -6.3% FY 2012: -8.8% Source: FY 2009–2012 FEOC Operations Program & Budget Conclusion: Complied
The operator’s definitions of performance measures are consistent with Public Utilities Code Section 99247, including (a) operating cost, (b) operating cost per passenger, (c) operating cost per vehicle service hour, (d) passengers per vehicle service hour, (e) passengers per vehicle service mile, (f) total passengers, (g) transit vehicle, (h) vehicle service hours, (i) vehicle service miles, and (j) vehicle service hours per employee.
Public Utilities Code, Section 99247
FEOC’s definition of performance measures is consistent with Public Utilities Code, Section 99247. Conclusion: Complied
If the operator serves an urbanized area, it has maintained a ratio of fare revenues to operating costs at least equal to one-fifth (20 percent), unless it is in a county with a population of less than 500,000, in which case it
Public Utilities Code, Sections 99268.2, 99268.3, 99268.12, 99270.1
In lieu of farebox, FEOC transit system is subject to Fresno COG’s policy to maintain a TDA/local support ratio. Conclusion: Not Applicable
Triennial Performance Audit of Fresno Economic Opportunities Commission – FY’s 2010-2012
PMC - 8 8
TABLE II-1 Operator Compliance Requirements Matrix
Operator Compliance Requirements
Reference Compliance Efforts
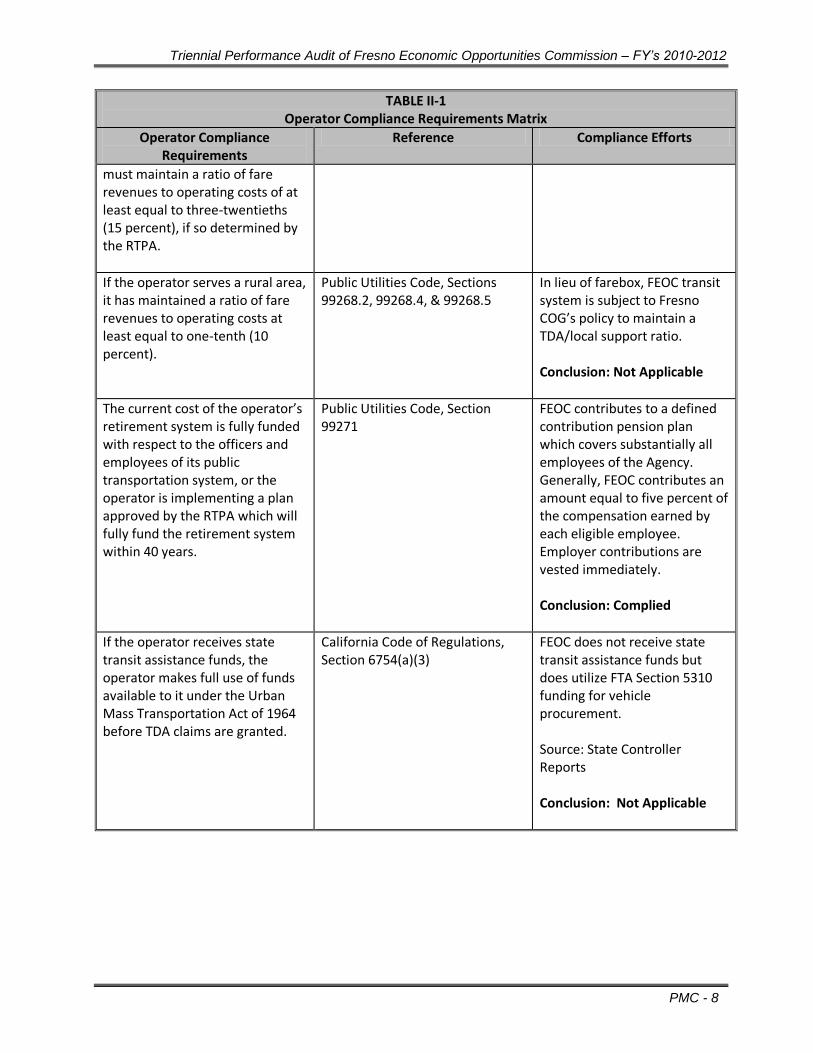
must maintain a ratio of fare revenues to operating costs of at least equal to three-twentieths (15 percent), if so determined by the RTPA.
If the operator serves a rural area, it has maintained a ratio of fare revenues to operating costs at least equal to one-tenth (10 percent).
Public Utilities Code, Sections 99268.2, 99268.4, & 99268.5
In lieu of farebox, FEOC transit system is subject to Fresno COG’s policy to maintain a TDA/local support ratio. Conclusion: Not Applicable
The current cost of the operator’s retirement system is fully funded with respect to the officers and employees of its public transportation system, or the operator is implementing a plan approved by the RTPA which will fully fund the retirement system within 40 years.
Public Utilities Code, Section 99271
FEOC contributes to a defined contribution pension plan which covers substantially all employees of the Agency. Generally, FEOC contributes an amount equal to five percent of the compensation earned by each eligible employee. Employer contributions are vested immediately. Conclusion: Complied
If the operator receives state transit assistance funds, the operator makes full use of funds available to it under the Urban Mass Transportation Act of 1964 before TDA claims are granted.
California Code of Regulations, Section 6754(a)(3)
FEOC does not receive state transit assistance funds but does utilize FTA Section 5310 funding for vehicle procurement. Source: State Controller Reports Conclusion: Not Applicable
Triennial Performance Audit of Fresno Economic Opportunities Commission – FY’s 2010-2012
PMC - 9 9
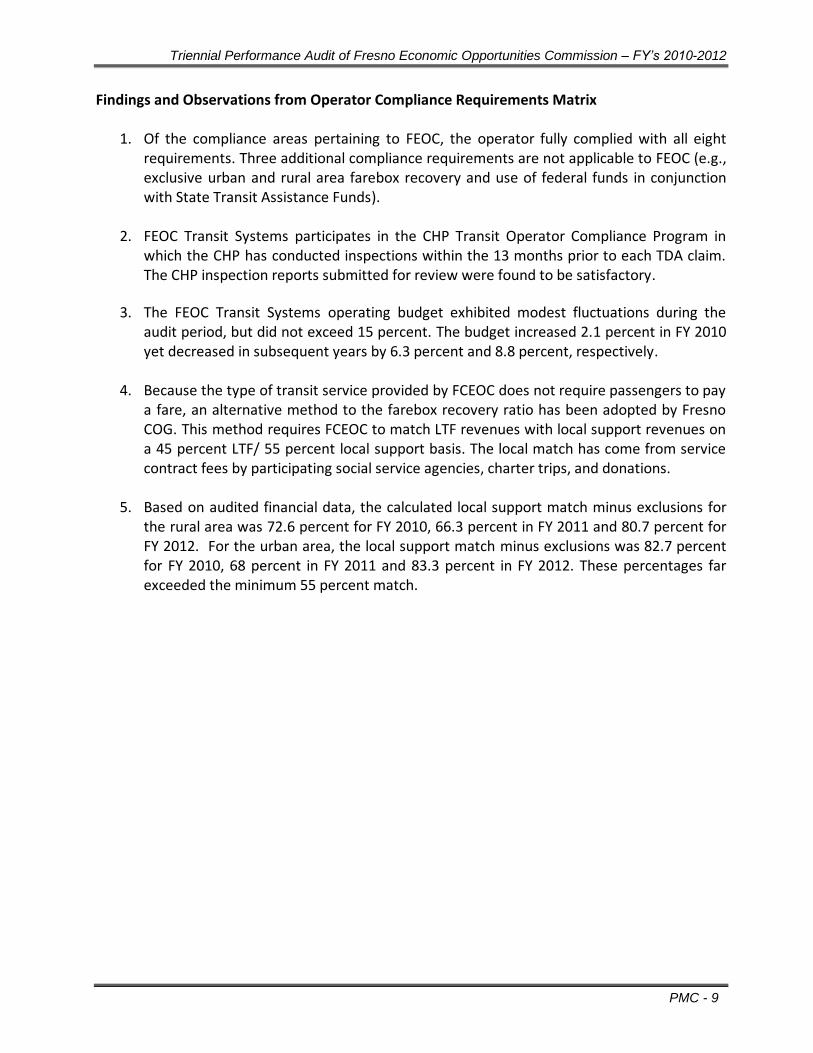
Findings and Observations from Operator Compliance Requirements Matrix
1. Of the compliance areas pertaining to FEOC, the operator fully complied with all eight requirements. Three additional compliance requirements are not applicable to FEOC (e.g., exclusive urban and rural area farebox recovery and use of federal funds in conjunction with State Transit Assistance Funds).
2. FEOC Transit Systems participates in the CHP Transit Operator Compliance Program in
which the CHP has conducted inspections within the 13 months prior to each TDA claim. The CHP inspection reports submitted for review were found to be satisfactory.
3. The FEOC Transit Systems operating budget exhibited modest fluctuations during the audit period, but did not exceed 15 percent. The budget increased 2.1 percent in FY 2010 yet decreased in subsequent years by 6.3 percent and 8.8 percent, respectively.
4. Because the type of transit service provided by FCEOC does not require passengers to pay
a fare, an alternative method to the farebox recovery ratio has been adopted by Fresno COG. This method requires FCEOC to match LTF revenues with local support revenues on a 45 percent LTF/ 55 percent local support basis. The local match has come from service contract fees by participating social service agencies, charter trips, and donations.
5. Based on audited financial data, the calculated local support match minus exclusions for
the rural area was 72.6 percent for FY 2010, 66.3 percent in FY 2011 and 80.7 percent for FY 2012. For the urban area, the local support match minus exclusions was 82.7 percent for FY 2010, 68 percent in FY 2011 and 83.3 percent in FY 2012. These percentages far exceeded the minimum 55 percent match.
Triennial Performance Audit of Fresno Economic Opportunities Commission – FY’s 2010-2012
PMC - 10 10
Section III
Prior Triennial Performance Recommendations
FEOC’s efforts to implement the recommendations made in the prior triennial audit are examined in this section of the report. For this purpose, each prior recommendation for the agency is described, followed by a discussion of the agency’s efforts to implement the recommendation. Conclusions concerning the extent to which the recommendations have been adopted by the agency are then presented. Prior Recommendation 1 Coordinate with other public transit and social service agencies in funding and offering consolidated travel training and ambassador services. Actions taken by FEOC: Consolidated travel training was identified as a short-range strategy and priority by the Fresno County Coordinated Human Services Transportation Plan as a means to empower seniors, persons with disabilities, and non-English speaking persons to use fixed-route public transit services. Travel training services are currently available through FAX (through an outside agency), FCRTA and Clovis Transit. However, the establishment of a volunteer travel ambassador program still has yet to be realized. Nevertheless, the CTSA trainer has been to several senior sites to discuss mobility options with participating seniors. The Fresno County Transportation guide, which includes route and fare information for the City of Fresno, the City of Clovis, Rural Transit service, and the CTSA, has been reviewed with seniors. FEOC drivers carried and distributed the Fresno County Transportation Guide in vehicles and passed them out. Many cases of these Guide books have been distributed. The Program Director and a CTSA Supervisor made a travel training presentation to the case worker of the Central Valley Regional Center (CVRC). The Fresno County Transportation Guide was discussed as well as all the services the CTSA conducts. The Fresno EOC Business Manager also has done presentations to the Fresno County CalWORKs staff regarding transportation services for their nighttime CalWORKs participants. This service is provided due to lack of public transportation in the late night and early morning period of 6 p.m. to 6 a.m. seven days per week. The discussion and research of consolidated travel training and an ambassador program are still a work in progress. In addition, the FEOC will work with members of the Social Service Transportation Advisory Committee (SSTAC) to identify resources and continue to seek such funding opportunities to implement further travel training and ambassador services.
Triennial Performance Audit of Fresno Economic Opportunities Commission – FY’s 2010-2012
PMC - 11 11
Conclusion: This recommendation has been partially implemented and has been carried forward for full implementation. Prior Recommendation 2 Work with FAX and Clovis Transit to determine the cost effectiveness of coordinating a countywide ADA-certification process. Actions taken by FEOC: The prior audit noted that FAX and Clovis Transit both offer demand responsive transit services to ADA-certified passengers and use their own protocol to determine eligibility. FEOC noted that FAX and Clovis Transit have different ADA certification protocols due to their funding source requirements. It was recommended that in light of potential inconsistencies in certification procedures between the two transit operators, the FEOC could offer a cost-effective and consolidated alternative by contracting with these agencies to conduct consistent ADA certifications. FAX evaluates an average of 120 ADA applicants per month and Clovis evaluates 12 ADA applicants per month. The Fresno EOC supervisor did attend the Mobility Training as mentioned in the previous recommendation. The CTSA explored using an existing CTSA building as a possible location where the ADA certifications could be held. The volume of applicant applying for certification in Clovis is low and because of distance and travel time is too great to make it financially feasible. The City of Fresno completes it certification at its Handy Ride office and upon observation appears to be efficient with our staff. Yet to be completed is the work with the City of Fresno and the City of Clovis to have a discussion regarding streamlining procedures. The CTSA building has hence been used as a detailing shop. The CTSA Director visited Orange County Transit to see the State-of-the-Art ADA certification facility. This facility is very large and serves several hundred applicants weekly. The CTSA did come away with ideas of future training from this visit. Coordination of the ADA-certification process continues to be studied. Conclusion: This recommendation has been partially implemented. Prior Recommendation 3 Continue to implement automatic vehicle locator (AVL) and video technology when financial feasible.
Triennial Performance Audit of Fresno Economic Opportunities Commission – FY’s 2010-2012
PMC - 12 12
Actions taken by FEOC: As the CTSA, FEOC has worked closely with the FCRTA on the procurement and implementation of dispatching software that would include AVL and video technologies. During the audit period, FEOC acquired Mobilitat Easy Rides software, which includes AVL and GIS technologies. The software will be integrated with the existing Versatrans routing and scheduling software program. The Mobilitat software also features a video feed. Local County Measure C funds received by the FCRTA and FTA Section 5310 funds were used for technology upgrades. Conclusion: This recommendation has been implemented. Prior Recommendation 4 Investigate the potential to translate CTSA knowledge expertise into additional training opportunities. Actions taken by FEOC: The FEOC has made considerable strides in diversifying into a number of enterprises that offer training opportunities. During the audit period, FEOC completed a state-of-the-art training facility, which has allowed for the Commission to further its outreach to the community. For example, FEOC offers First Aid and CPR training for commercial and certified drivers for both public and private agencies including school districts, private schools, churches, child/adult day care facilities and other entities that require personnel to have First Aid/CPR certification. FEOC also offers Commercial Driver and Mobility Aid training. CTSA trainers are able to provide classroom and behind-the-wheel training. FEOC continues to develop other training opportunities in the areas of accounting and budgeting practices for transit systems and non-profit agencies. Conclusion:
This recommendation has been implemented.
Triennial Performance Audit of Fresno Economic Opportunities Commission – FY’s 2010-2012
PMC - 13 13
Section IV
TDA Performance Indicators
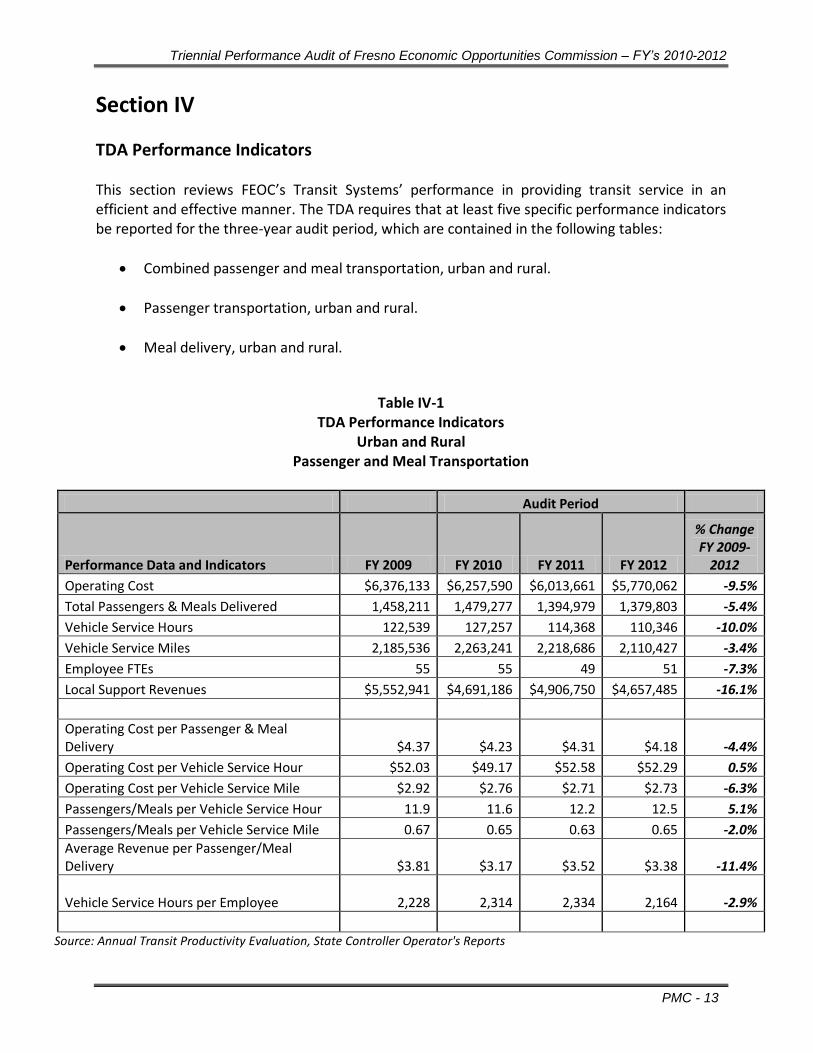
This section reviews FEOC’s Transit Systems’ performance in providing transit service in an efficient and effective manner. The TDA requires that at least five specific performance indicators be reported for the three-year audit period, which are contained in the following tables:
Combined passenger and meal transportation, urban and rural.
Passenger transportation, urban and rural.
Meal delivery, urban and rural.
Table IV-1 TDA Performance Indicators
Urban and Rural Passenger and Meal Transportation
Audit Period
Performance Data and Indicators FY 2009 FY 2010 FY 2011 FY 2012
% Change FY 2009-
2012
Operating Cost $6,376,133 $6,257,590 $6,013,661 $5,770,062 -9.5%
Total Passengers & Meals Delivered 1,458,211 1,479,277 1,394,979 1,379,803 -5.4%
Vehicle Service Hours 122,539 127,257 114,368 110,346 -10.0%
Vehicle Service Miles 2,185,536 2,263,241 2,218,686 2,110,427 -3.4%
Employee FTEs 55 55 49 51 -7.3%
Local Support Revenues $5,552,941 $4,691,186 $4,906,750 $4,657,485 -16.1%
Operating Cost per Passenger & Meal Delivery $4.37 $4.23 $4.31 $4.18 -4.4%
Operating Cost per Vehicle Service Hour $52.03 $49.17 $52.58 $52.29 0.5%
Operating Cost per Vehicle Service Mile $2.92 $2.76 $2.71 $2.73 -6.3%
Passengers/Meals per Vehicle Service Hour 11.9 11.6 12.2 12.5 5.1%
Passengers/Meals per Vehicle Service Mile 0.67 0.65 0.63 0.65 -2.0%
Average Revenue per Passenger/Meal Delivery $3.81 $3.17 $3.52 $3.38 -11.4%
Vehicle Service Hours per Employee
2,228
2,314
2,334
2,164 -2.9%
Source: Annual Transit Productivity Evaluation, State Controller Operator's Reports
Triennial Performance Audit of Fresno Economic Opportunities Commission – FY’s 2010-2012
PMC - 14 14
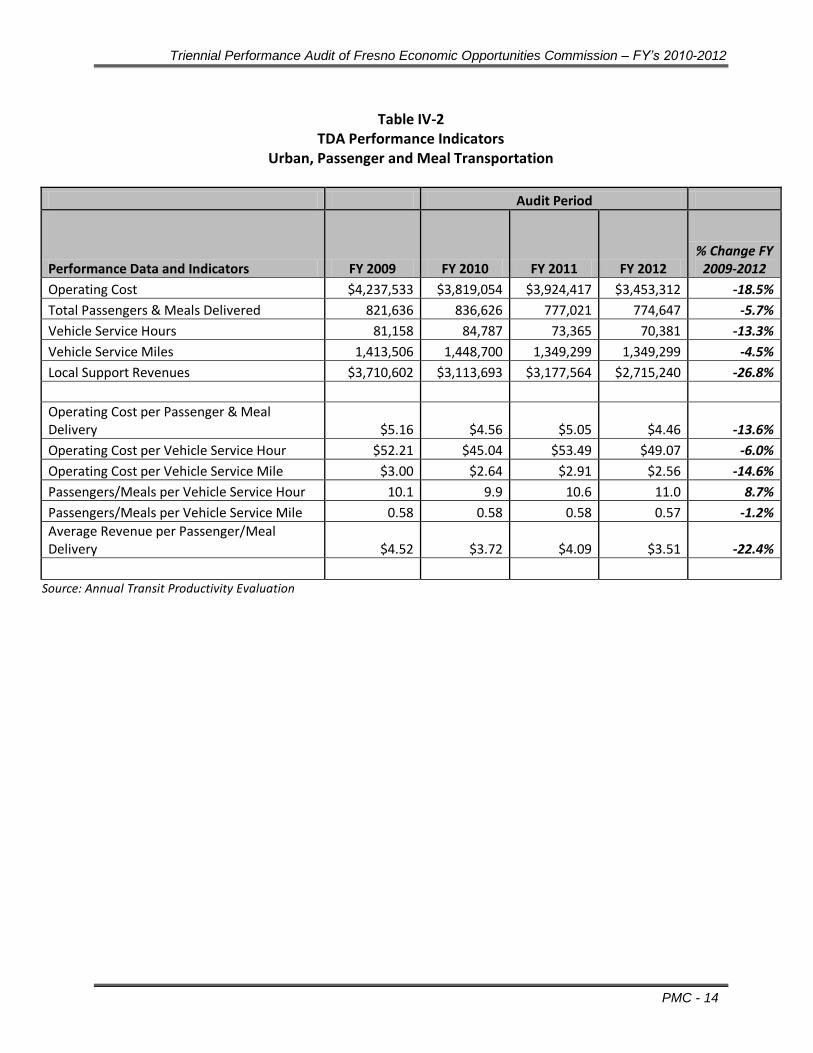
Table IV-2
TDA Performance Indicators Urban, Passenger and Meal Transportation
Audit Period
Performance Data and Indicators FY 2009 FY 2010 FY 2011 FY 2012 % Change FY
2009-2012
Operating Cost $4,237,533 $3,819,054 $3,924,417 $3,453,312 -18.5%
Total Passengers & Meals Delivered 821,636 836,626 777,021 774,647 -5.7%
Vehicle Service Hours 81,158 84,787 73,365 70,381 -13.3%
Vehicle Service Miles 1,413,506 1,448,700 1,349,299 1,349,299 -4.5%
Local Support Revenues $3,710,602 $3,113,693 $3,177,564 $2,715,240 -26.8%
Operating Cost per Passenger & Meal Delivery $5.16 $4.56 $5.05 $4.46 -13.6%
Operating Cost per Vehicle Service Hour $52.21 $45.04 $53.49 $49.07 -6.0%
Operating Cost per Vehicle Service Mile $3.00 $2.64 $2.91 $2.56 -14.6%
Passengers/Meals per Vehicle Service Hour 10.1 9.9 10.6 11.0 8.7%
Passengers/Meals per Vehicle Service Mile 0.58 0.58 0.58 0.57 -1.2%
Average Revenue per Passenger/Meal Delivery $4.52 $3.72 $4.09 $3.51 -22.4%
Source: Annual Transit Productivity Evaluation
Triennial Performance Audit of Fresno Economic Opportunities Commission – FY’s 2010-2012
PMC - 15 15
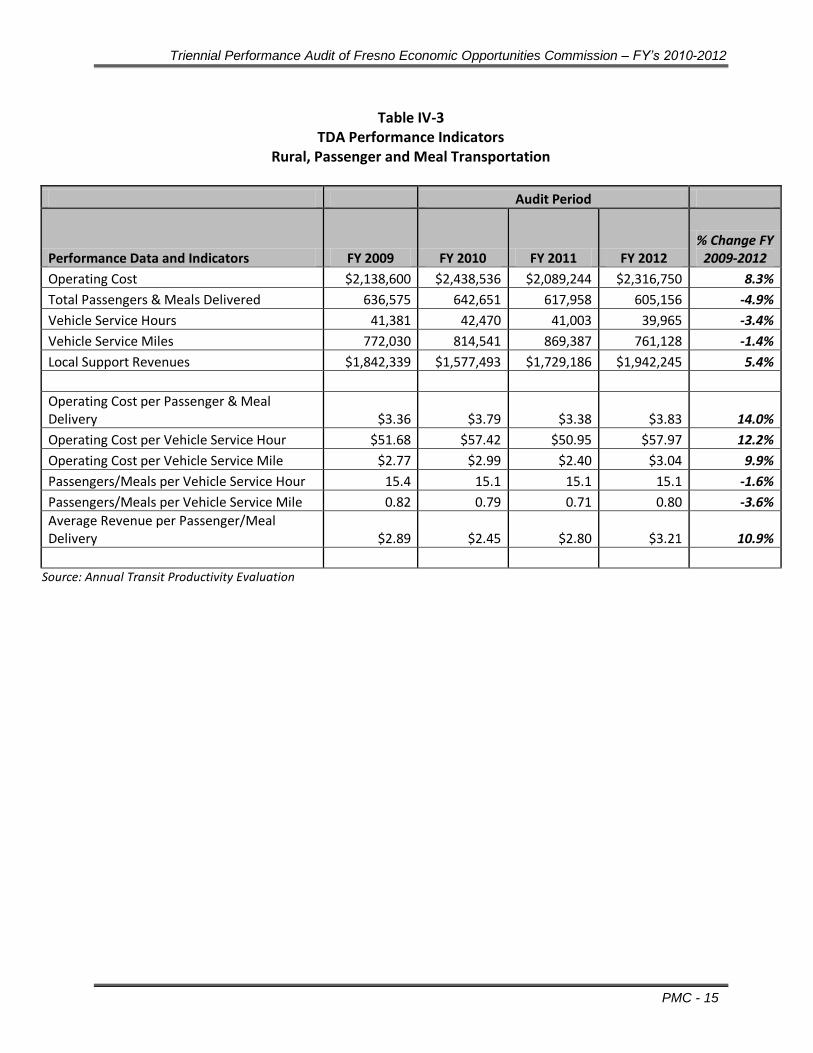
Table IV-3 TDA Performance Indicators
Rural, Passenger and Meal Transportation
Audit Period
Performance Data and Indicators FY 2009 FY 2010 FY 2011 FY 2012 % Change FY
2009-2012
Operating Cost $2,138,600 $2,438,536 $2,089,244 $2,316,750 8.3%
Total Passengers & Meals Delivered 636,575 642,651 617,958 605,156 -4.9%
Vehicle Service Hours 41,381 42,470 41,003 39,965 -3.4%
Vehicle Service Miles 772,030 814,541 869,387 761,128 -1.4%
Local Support Revenues $1,842,339 $1,577,493 $1,729,186 $1,942,245 5.4%
Operating Cost per Passenger & Meal Delivery $3.36 $3.79 $3.38 $3.83 14.0%
Operating Cost per Vehicle Service Hour $51.68 $57.42 $50.95 $57.97 12.2%
Operating Cost per Vehicle Service Mile $2.77 $2.99 $2.40 $3.04 9.9%
Passengers/Meals per Vehicle Service Hour 15.4 15.1 15.1 15.1 -1.6%
Passengers/Meals per Vehicle Service Mile 0.82 0.79 0.71 0.80 -3.6%
Average Revenue per Passenger/Meal Delivery $2.89 $2.45 $2.80 $3.21 10.9%
Source: Annual Transit Productivity Evaluation
Triennial Performance Audit of Fresno Economic Opportunities Commission – FY’s 2010-2012
PMC - 16 16
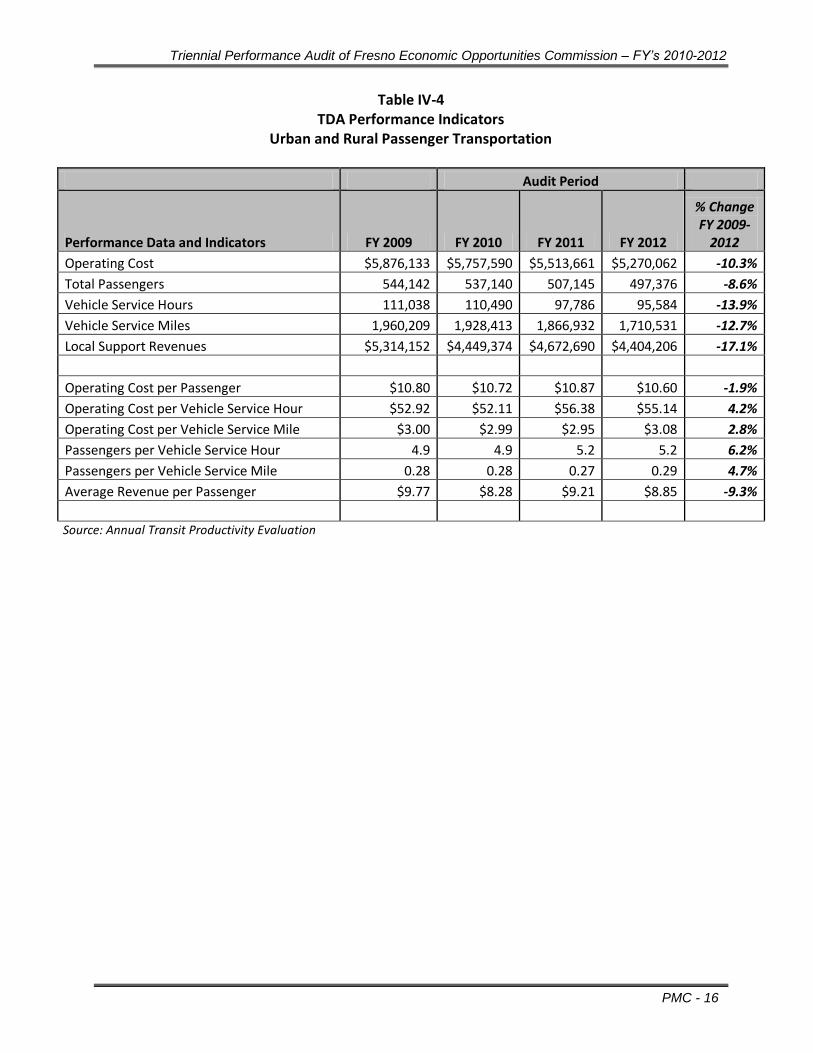
Table IV-4 TDA Performance Indicators
Urban and Rural Passenger Transportation
Audit Period
Performance Data and Indicators FY 2009 FY 2010 FY 2011 FY 2012
% Change FY 2009-
2012
Operating Cost $5,876,133 $5,757,590 $5,513,661 $5,270,062 -10.3%
Total Passengers 544,142 537,140 507,145 497,376 -8.6%
Vehicle Service Hours 111,038 110,490 97,786 95,584 -13.9%
Vehicle Service Miles 1,960,209 1,928,413 1,866,932 1,710,531 -12.7%
Local Support Revenues $5,314,152 $4,449,374 $4,672,690 $4,404,206 -17.1%
Operating Cost per Passenger $10.80 $10.72 $10.87 $10.60 -1.9%
Operating Cost per Vehicle Service Hour $52.92 $52.11 $56.38 $55.14 4.2%
Operating Cost per Vehicle Service Mile $3.00 $2.99 $2.95 $3.08 2.8%
Passengers per Vehicle Service Hour 4.9 4.9 5.2 5.2 6.2%
Passengers per Vehicle Service Mile 0.28 0.28 0.27 0.29 4.7%
Average Revenue per Passenger $9.77 $8.28 $9.21 $8.85 -9.3%
Source: Annual Transit Productivity Evaluation
Triennial Performance Audit of Fresno Economic Opportunities Commission – FY’s 2010-2012
PMC - 17 17
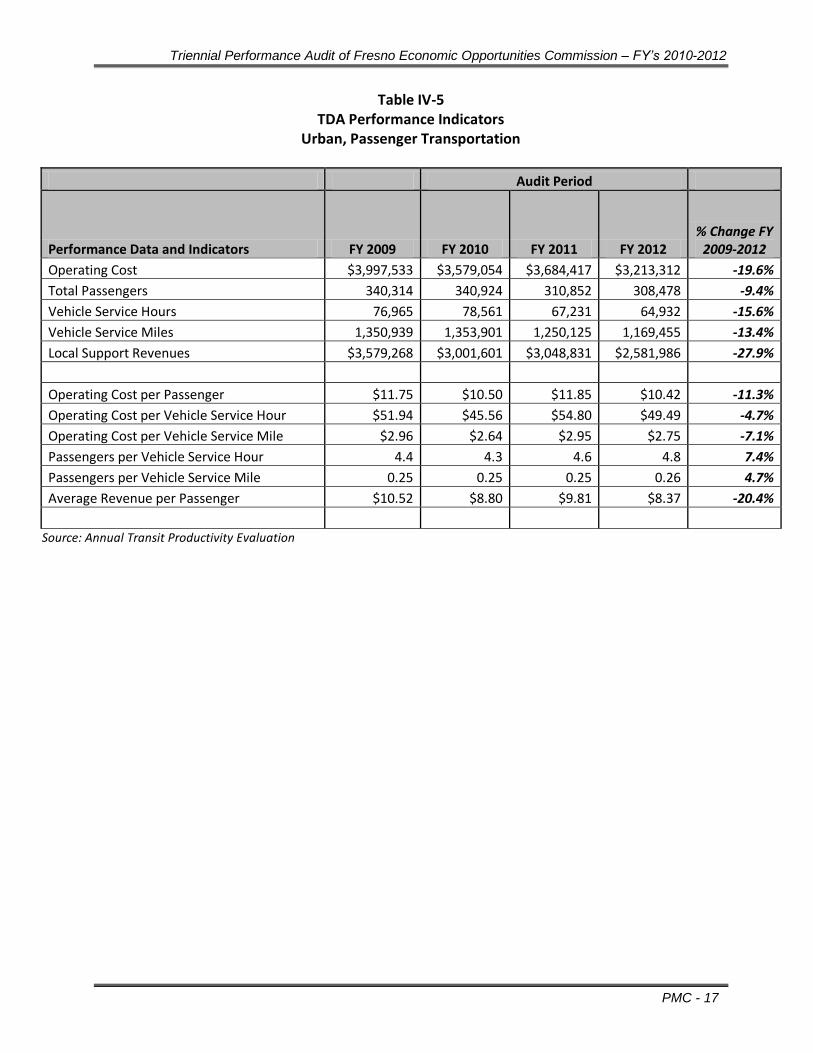
Table IV-5 TDA Performance Indicators
Urban, Passenger Transportation
Audit Period
Performance Data and Indicators FY 2009 FY 2010 FY 2011 FY 2012 % Change FY
2009-2012
Operating Cost $3,997,533 $3,579,054 $3,684,417 $3,213,312 -19.6%
Total Passengers 340,314 340,924 310,852 308,478 -9.4%
Vehicle Service Hours 76,965 78,561 67,231 64,932 -15.6%
Vehicle Service Miles 1,350,939 1,353,901 1,250,125 1,169,455 -13.4%
Local Support Revenues $3,579,268 $3,001,601 $3,048,831 $2,581,986 -27.9%
Operating Cost per Passenger $11.75 $10.50 $11.85 $10.42 -11.3%
Operating Cost per Vehicle Service Hour $51.94 $45.56 $54.80 $49.49 -4.7%
Operating Cost per Vehicle Service Mile $2.96 $2.64 $2.95 $2.75 -7.1%
Passengers per Vehicle Service Hour 4.4 4.3 4.6 4.8 7.4%
Passengers per Vehicle Service Mile 0.25 0.25 0.25 0.26 4.7%
Average Revenue per Passenger $10.52 $8.80 $9.81 $8.37 -20.4%
Source: Annual Transit Productivity Evaluation
Triennial Performance Audit of Fresno Economic Opportunities Commission – FY’s 2010-2012
PMC - 18 18
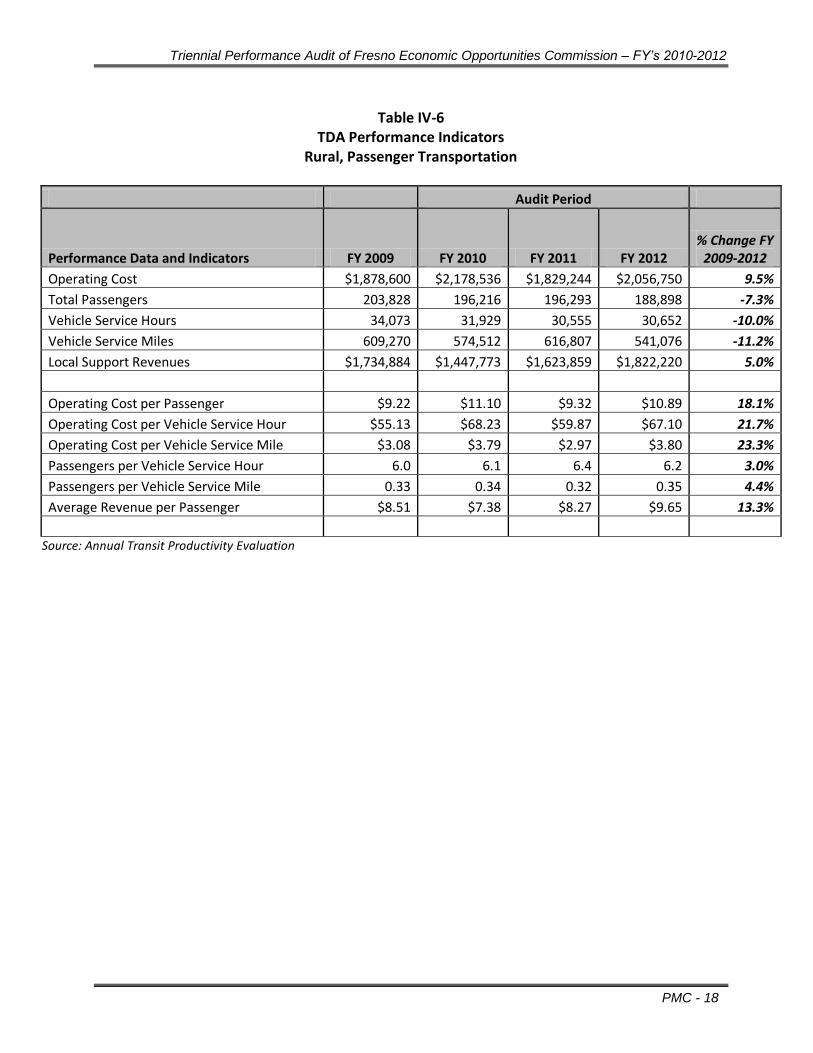
Table IV-6 TDA Performance Indicators
Rural, Passenger Transportation
Audit Period
Performance Data and Indicators FY 2009 FY 2010 FY 2011 FY 2012 % Change FY
2009-2012
Operating Cost $1,878,600 $2,178,536 $1,829,244 $2,056,750 9.5%
Total Passengers 203,828 196,216 196,293 188,898 -7.3%
Vehicle Service Hours 34,073 31,929 30,555 30,652 -10.0%
Vehicle Service Miles 609,270 574,512 616,807 541,076 -11.2%
Local Support Revenues $1,734,884 $1,447,773 $1,623,859 $1,822,220 5.0%
Operating Cost per Passenger $9.22 $11.10 $9.32 $10.89 18.1%
Operating Cost per Vehicle Service Hour $55.13 $68.23 $59.87 $67.10 21.7%
Operating Cost per Vehicle Service Mile $3.08 $3.79 $2.97 $3.80 23.3%
Passengers per Vehicle Service Hour 6.0 6.1 6.4 6.2 3.0%
Passengers per Vehicle Service Mile 0.33 0.34 0.32 0.35 4.4%
Average Revenue per Passenger $8.51 $7.38 $8.27 $9.65 13.3%
Source: Annual Transit Productivity Evaluation
Triennial Performance Audit of Fresno Economic Opportunities Commission – FY’s 2010-2012
PMC - 19 19
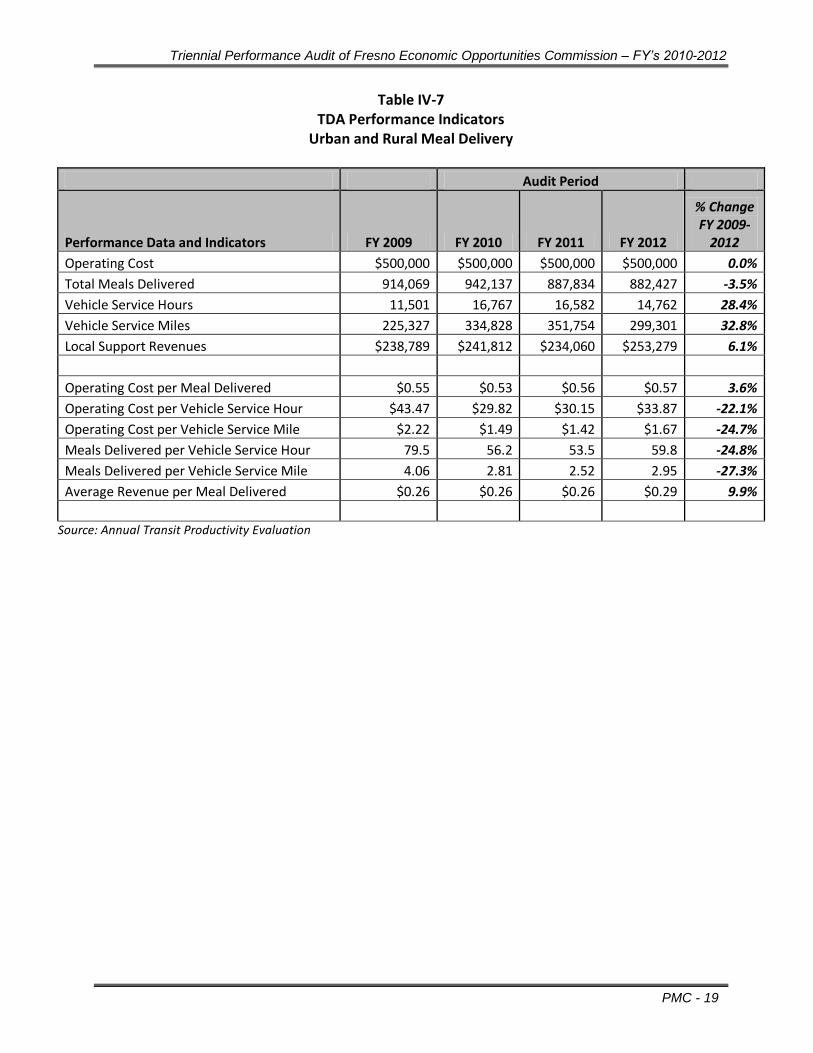
Table IV-7 TDA Performance Indicators
Urban and Rural Meal Delivery
Audit Period
Performance Data and Indicators FY 2009 FY 2010 FY 2011 FY 2012
% Change FY 2009-
2012
Operating Cost $500,000 $500,000 $500,000 $500,000 0.0%
Total Meals Delivered 914,069 942,137 887,834 882,427 -3.5%
Vehicle Service Hours 11,501 16,767 16,582 14,762 28.4%
Vehicle Service Miles 225,327 334,828 351,754 299,301 32.8%
Local Support Revenues $238,789 $241,812 $234,060 $253,279 6.1%
Operating Cost per Meal Delivered $0.55 $0.53 $0.56 $0.57 3.6%
Operating Cost per Vehicle Service Hour $43.47 $29.82 $30.15 $33.87 -22.1%
Operating Cost per Vehicle Service Mile $2.22 $1.49 $1.42 $1.67 -24.7%
Meals Delivered per Vehicle Service Hour 79.5 56.2 53.5 59.8 -24.8%
Meals Delivered per Vehicle Service Mile 4.06 2.81 2.52 2.95 -27.3%
Average Revenue per Meal Delivered $0.26 $0.26 $0.26 $0.29 9.9%
Source: Annual Transit Productivity Evaluation
Triennial Performance Audit of Fresno Economic Opportunities Commission – FY’s 2010-2012
PMC - 20 20
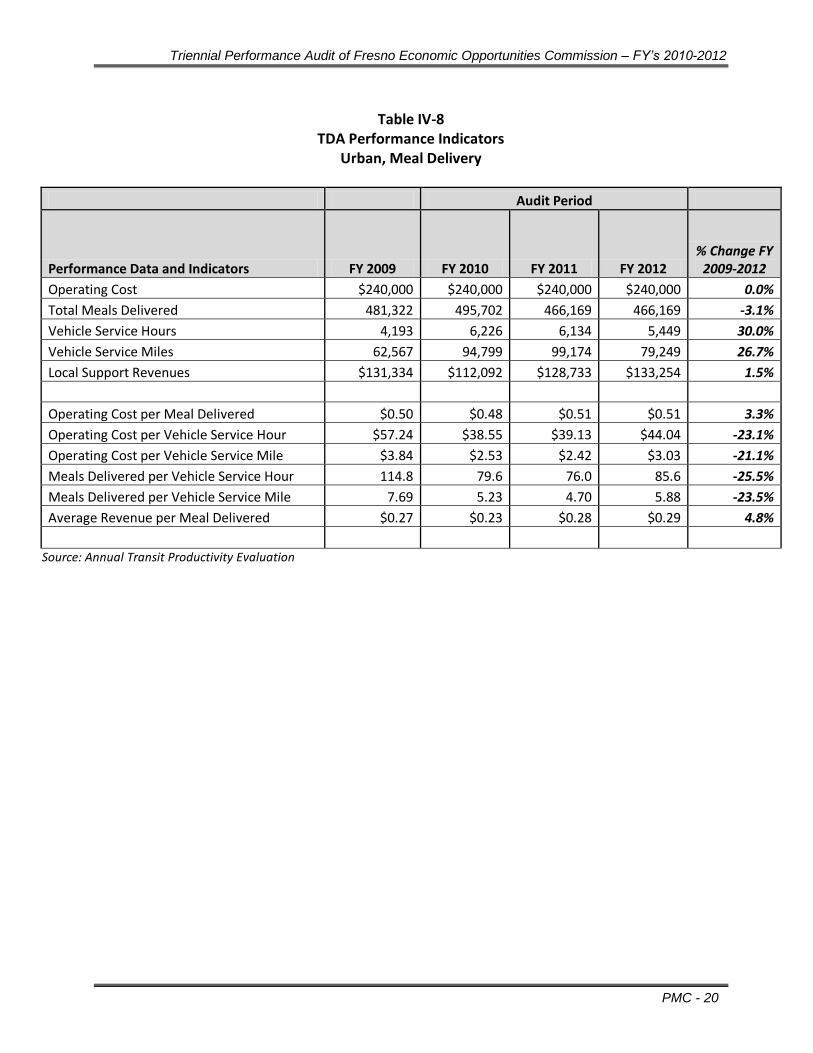
Table IV-8
TDA Performance Indicators Urban, Meal Delivery
Audit Period
Performance Data and Indicators FY 2009 FY 2010 FY 2011 FY 2012 % Change FY
2009-2012
Operating Cost $240,000 $240,000 $240,000 $240,000 0.0%
Total Meals Delivered 481,322 495,702 466,169 466,169 -3.1%
Vehicle Service Hours 4,193 6,226 6,134 5,449 30.0%
Vehicle Service Miles 62,567 94,799 99,174 79,249 26.7%
Local Support Revenues $131,334 $112,092 $128,733 $133,254 1.5%
Operating Cost per Meal Delivered $0.50 $0.48 $0.51 $0.51 3.3%
Operating Cost per Vehicle Service Hour $57.24 $38.55 $39.13 $44.04 -23.1%
Operating Cost per Vehicle Service Mile $3.84 $2.53 $2.42 $3.03 -21.1%
Meals Delivered per Vehicle Service Hour 114.8 79.6 76.0 85.6 -25.5%
Meals Delivered per Vehicle Service Mile 7.69 5.23 4.70 5.88 -23.5%
Average Revenue per Meal Delivered $0.27 $0.23 $0.28 $0.29 4.8%
Source: Annual Transit Productivity Evaluation
Triennial Performance Audit of Fresno Economic Opportunities Commission – FY’s 2010-2012
PMC - 21 21
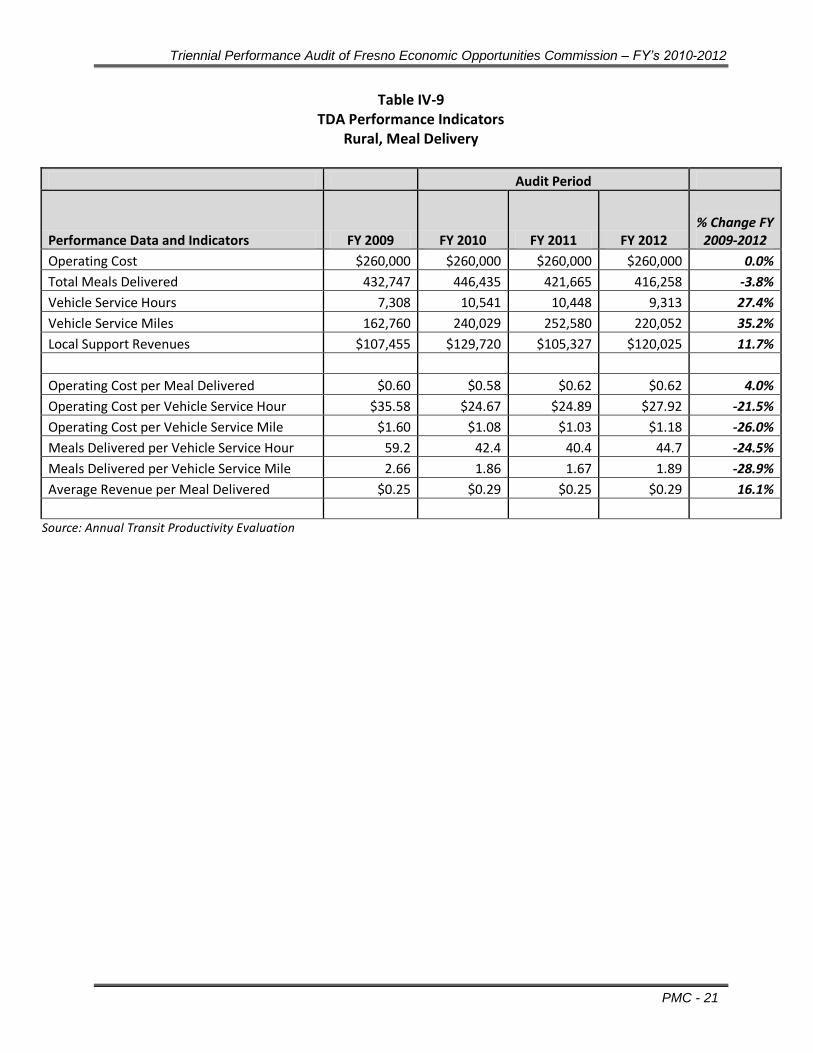
Table IV-9 TDA Performance Indicators
Rural, Meal Delivery
Audit Period
Performance Data and Indicators FY 2009 FY 2010 FY 2011 FY 2012 % Change FY
2009-2012
Operating Cost $260,000 $260,000 $260,000 $260,000 0.0%
Total Meals Delivered 432,747 446,435 421,665 416,258 -3.8%
Vehicle Service Hours 7,308 10,541 10,448 9,313 27.4%
Vehicle Service Miles 162,760 240,029 252,580 220,052 35.2%
Local Support Revenues $107,455 $129,720 $105,327 $120,025 11.7%
Operating Cost per Meal Delivered $0.60 $0.58 $0.62 $0.62 4.0%
Operating Cost per Vehicle Service Hour $35.58 $24.67 $24.89 $27.92 -21.5%
Operating Cost per Vehicle Service Mile $1.60 $1.08 $1.03 $1.18 -26.0%
Meals Delivered per Vehicle Service Hour 59.2 42.4 40.4 44.7 -24.5%
Meals Delivered per Vehicle Service Mile 2.66 1.86 1.67 1.89 -28.9%
Average Revenue per Meal Delivered $0.25 $0.29 $0.25 $0.29 16.1%
Source: Annual Transit Productivity Evaluation
Triennial Performance Audit of Fresno Economic Opportunities Commission – FY’s 2010-2012
PMC - 22 22
Findings from Verification of TDA Performance Indicators 1. Operating costs for the combined Urban and Rural CTSA services (meal delivery and
passengers) decreased 9.5 percent from the FY 2009 base year through FY 2012. Combined Urban CTSA operating costs decreased 18.5 percent during the audit period whereas the Rural CTSA operating costs increased 8.3 percent. For passenger services, operating costs for both the Urban and Rural CTSAs decreased 10.3 percent. Urban CTSA passenger operating costs decreased 19.6 percent and Rural CTSA passenger costs increased 9.5 percent. Operating costs for meal deliveries remained unchanged for both services.
2. The provision of revenue hours and miles for the combined Urban and Rural CTSA services
decreased 10 and 3.4 percent, respectively. Combined Urban CTSA revenue hours and miles decreased 13.3 and 4.5 percent, respectively while combined Rural CTSA revenue hours and miles decreased 3.4 and 1.4 percent, respectively. For combined passenger services, vehicle service hours decreased 13.9 percent and vehicle service miles decreased 12.7 percent. In contrast, combined meal delivery hours and miles increased 28.4 percent and 32.8 percent, respectively.
3. Operating cost per passenger and meal delivered, an indicator of cost effectiveness, decreased 4.4 percent systemwide from $4.37 in FY 2009 to $4.18 in FY 2012. Urban CTSA passenger and meal delivery exhibited a decrease of 13.6 percent while rural CTSA passenger and meal delivery exhibited an increase of 14.0 percent. Passenger services exhibited a 1.9 percent decrease in cost per passenger. In contrast, meal delivery saw its cost per meal delivered increase by 3.6 percent over the same the period. Ridership systemwide decreased 8.6 percent during the period from 544,142 passengers in FY 2009 to 497,376 passengers in FY 2012. Meals delivered systemwide decreased 3.5 percent from 914,069 in FY 2009 to 882,427 in FY 2012.
4. Operating cost per hour, an indicator of cost efficiency, marginally increased by 0.5 percent systemwide from $52.03 in FY 2009 to $52.29 in FY 2012. The Urban CTSA combined passenger and meal delivery services saw its cost per vehicle service hour decline 6 percent during the period from $52.21 to $49.07. The Rural CTSA combined passenger and meal delivery services exhibited an increase of 12.2 percent from $51.68 to $57.97.
5. Systemwide passengers and meals delivered per vehicle service hour, which measures the effectiveness of the service delivered, increased 5.1 percent systemwide between FY 2009 and FY 2012 from 11.9 passengers and meals per hour to 12.59 passengers and meals per hour. Urban CTSA passenger and meal delivery exhibited a comparable increase of 8.7 percent over the same period from 10.1 to 11 passengers and meals per hour. Rural passengers and meals delivered per hour for rural CTSA operations remained decreased slightly by 1.6 percent from 15.4 to 15.1 passengers and meals per hour. Urban
Triennial Performance Audit of Fresno Economic Opportunities Commission – FY’s 2010-2012
PMC - 23 23
and rural passengers per hour increased 6.2 percent, while urban and rural meal delivery per hour exhibited a decrease of 24.8 percent.
6. Systemwide passengers and meals per vehicle service mile, another indicator of service effectiveness, decreased 2 percent between FY 2009 and FY 2012, from 0.67 passengers and meals per service mile to 0.65 passengers and meals per service mile. For urban CTSA operations, the number of passengers and meals per service mile remained relatively unchanged at 0.58 passengers and meals per service mile. In contrast, Rural CTSA operations exhibited a decrease of 3.6 percent from 0.82 to 0.80 passengers and meals per mile. Urban and rural passengers per mile exhibited a 4.7 percent increase. However, meals delivered per service miles decreased 27.3 percent from 4.06 to 2.95 meals delivered.
Conclusion from the Verification of TDA Performance Indicators Systemwide cost indicators exhibited positive trends indicating improved efficiencies. However, this overall trend is not reflective across service modes. FEOC should continue to closely monitor its performance indicators, as some indicators are showing trends that might cause concern in the provision of overall service. Examples include the sharp growth in vehicle service hours and miles for rural and urban meal delivery services relative to actual meals delivered. Total vehicle hours for meal delivery increased by more 28.4 percent whereas total vehicle service miles increased 32.8 percent. This is in contrast to the number of measures delivered which declined by 3.5 percent. As a result, performance indicators for these measures showed negative trends for service effectiveness. It is understood that the FEOC transit system differs from public transit operators in that social service agency programs can fluctuate from year to year, and that FEOC provides its clients with transportation under annual service contracts with participating social service agencies. The number of client trips and the negotiated hours and miles for each client are individually tailored to meet the needs of each client. However, from an overall performance standpoint, the service should be monitored closely for potential declines in performance trends as the data are used for future improvements to the service including future negotiations of hours and miles of service relative to client trips. While FEOC is not required to meet a specific fare recovery ratio, as it does not collect fares from its riders, the agency is required to meet the annual ratio of 45 percent TDA revenues to 55 percent local support revenues to continue receiving TDA funds. Local support revenues include grant funds, service contract revenues and donations. FEOC has been able to meet this ratio requirement in each year of the triennial audit. In spite of the 16.1 percent decrease in local support revenues, revenues have continued to outpace the growth in operating costs.
Triennial Performance Audit of Fresno Economic Opportunities Commission – FY’s 2010-2012
PMC - 24 24
Section V
Review of Operator Functions This section provides an in-depth review of various functions within FEOC Transit Systems. The review highlights accomplishments, issues, and/or challenges that were determined during the audit period. The following departments and functions were reviewed at FEOC’s operations facility:
Operations
Maintenance
Marketing
General Administration and Management Within some departments are sub-functions that require review as well, such as Grants Administration that falls under General Administration. Operations During the audit period, Fresno County Economic Opportunities Commission (FCEOC) modified its name to Fresno Economic Opportunities Commission (FEOC). In concert with the name change, the FEOC also adopted new branding and has become one of the largest community action agencies in the United States. A new Chief Executive Officer (CEO) joined FEOC in August 2010 and bringing 40 years experience in human resources, financial administration, planning and program development with other community action agencies. FEOC completed a new administrative building that features a 125 person capacity training room with state-of-the-art audio-visual technology. The main kitchen used in conjunction with the meal delivery program also underwent expansion and renovation. The FEOC has also taken steps to implement green/eco-friendly initiatives across all departments. These initiatives include the installation of solar panels in the parking lot and using compact florescent light bulbs. The FEOC training room is utilized for a variety of trainings such as First Aid/CPR and mobility training. A concession fee is charged for the use of the training facility. FEOC also opened a vehicle detail facility and marketed the service to the Cities of Clovis and Fresno. The detailing enterprise employs two employees and averages two vehicles daily. FEOC is also looking into a possible healthy foods initiative that would address the problem of “food deserts” in low-income communities. Options could be the establishment of small grocery stores or food cooperatives. With the opening of the new veterans center located at 1320 East Shaw Avenue in Fresno, U.S. Representative Jim Costa has sought out collaboration with the FEOC to provide transportation to
Triennial Performance Audit of Fresno Economic Opportunities Commission – FY’s 2010-2012
PMC - 25 25
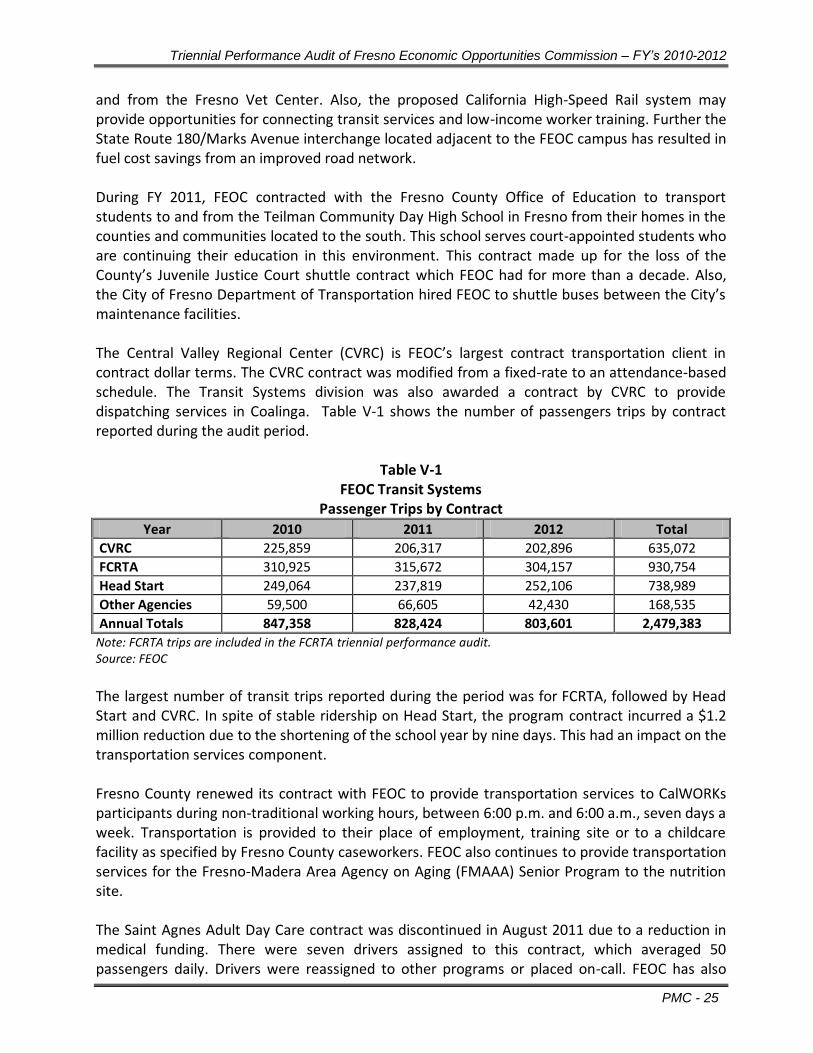
and from the Fresno Vet Center. Also, the proposed California High-Speed Rail system may provide opportunities for connecting transit services and low-income worker training. Further the State Route 180/Marks Avenue interchange located adjacent to the FEOC campus has resulted in fuel cost savings from an improved road network. During FY 2011, FEOC contracted with the Fresno County Office of Education to transport students to and from the Teilman Community Day High School in Fresno from their homes in the counties and communities located to the south. This school serves court-appointed students who are continuing their education in this environment. This contract made up for the loss of the County’s Juvenile Justice Court shuttle contract which FEOC had for more than a decade. Also, the City of Fresno Department of Transportation hired FEOC to shuttle buses between the City’s maintenance facilities. The Central Valley Regional Center (CVRC) is FEOC’s largest contract transportation client in contract dollar terms. The CVRC contract was modified from a fixed-rate to an attendance-based schedule. The Transit Systems division was also awarded a contract by CVRC to provide dispatching services in Coalinga. Table V-1 shows the number of passengers trips by contract reported during the audit period.
Table V-1
FEOC Transit Systems Passenger Trips by Contract
Year 2010 2011 2012 Total
CVRC 225,859 206,317 202,896 635,072
FCRTA 310,925 315,672 304,157 930,754
Head Start 249,064 237,819 252,106 738,989
Other Agencies 59,500 66,605 42,430 168,535
Annual Totals 847,358 828,424 803,601 2,479,383
Note: FCRTA trips are included in the FCRTA triennial performance audit. Source: FEOC
The largest number of transit trips reported during the period was for FCRTA, followed by Head Start and CVRC. In spite of stable ridership on Head Start, the program contract incurred a $1.2 million reduction due to the shortening of the school year by nine days. This had an impact on the transportation services component. Fresno County renewed its contract with FEOC to provide transportation services to CalWORKs participants during non-traditional working hours, between 6:00 p.m. and 6:00 a.m., seven days a week. Transportation is provided to their place of employment, training site or to a childcare facility as specified by Fresno County caseworkers. FEOC also continues to provide transportation services for the Fresno-Madera Area Agency on Aging (FMAAA) Senior Program to the nutrition site. The Saint Agnes Adult Day Care contract was discontinued in August 2011 due to a reduction in medical funding. There were seven drivers assigned to this contract, which averaged 50 passengers daily. Drivers were reassigned to other programs or placed on-call. FEOC has also
Triennial Performance Audit of Fresno Economic Opportunities Commission – FY’s 2010-2012
PMC - 26 26
reached out to ARC-Fresno to provide transportation services to its clientele. ARC-Fresno has a fleet ranging between 30 to 40 vehicles. FEOC has also continued to provide meal delivery services to the adjacent counties of Kings, Madera and Tulare. FEOC implemented, Mobilitat, a new software program on its CVRC routes that will be integrated with its Versatrans scheduling software. Global Positioning System (GPS) units were installed on select FEOC-owned vehicles under the dashboard. In combination with a new radio system equipped with caller-identification, the units were configured to transmit Internet reports into dispatch about the vehicle’s performance such as speed and location. After a period of testing, FEOC determined that the system was not fully functional. A route planner was hired to optimize the Versatrans system. FEOC utilizes bilingual dispatchers due the high number of Spanish-speaking clients. Approximately 70 percent of calls received for service are in Spanish. Personnel The Food Services/Transit Systems Division employs 120 drivers and another 35 administrative employees. Drivers are required to have a valid Class B License with Passenger Endorsement, plus Medical Examiner’s certificate. Drivers are also required to hold a General Public Paratransit Vehicle (GPPV) certificate to operate a bus vehicle. Each driver undergoes a 40-hour classroom training session. There are three lead driver trainers and one dedicated behind-the-wheel trainer. FEOC holds six 2-hour driver in-service training sessions annually. Supervisors and guest speakers provide awareness training on topics such as operation procedures, security and defensive driving, ergonomics, accidents, system problems and personnel issues. The agency’s insurance carrier, Non-Profits Insurance Alliance of California, also provides training on emergency techniques, laws and regulations to staff and drivers. During the audit period, FEOC has taken measures to prepare for the effects of federal budgetary cuts enacted by Congress. Such contingencies have included compensation reductions such as a five percent pay reduction for officers, a three percent reduction for non-exempt employees, and a two percent reduction for exempt employees. Similarly, there have been no pay raises over the last few years. Other measures such as staff reclassification have been considered. For example, an account clerk position may be reclassified due to the computerization of tasks that have been performed manually. Basic employee benefits are available to all regular full-time and part-time employees hired to work a minimum of 30 hours weekly. Group health, dental and vision coverage are offered through Anthem Blue Cross and Delta Dental. Retirement benefits consist of a pension plan whereby FEOC contributes five percent of the employee’s salary. In addition, employees may also contribute a portion of their salary into the plan not to exceed ten percent of their compensation. Another retirement savings option is a voluntary, self-directed Section 403(b) tax annuity program.
Triennial Performance Audit of Fresno Economic Opportunities Commission – FY’s 2010-2012
PMC - 27 27
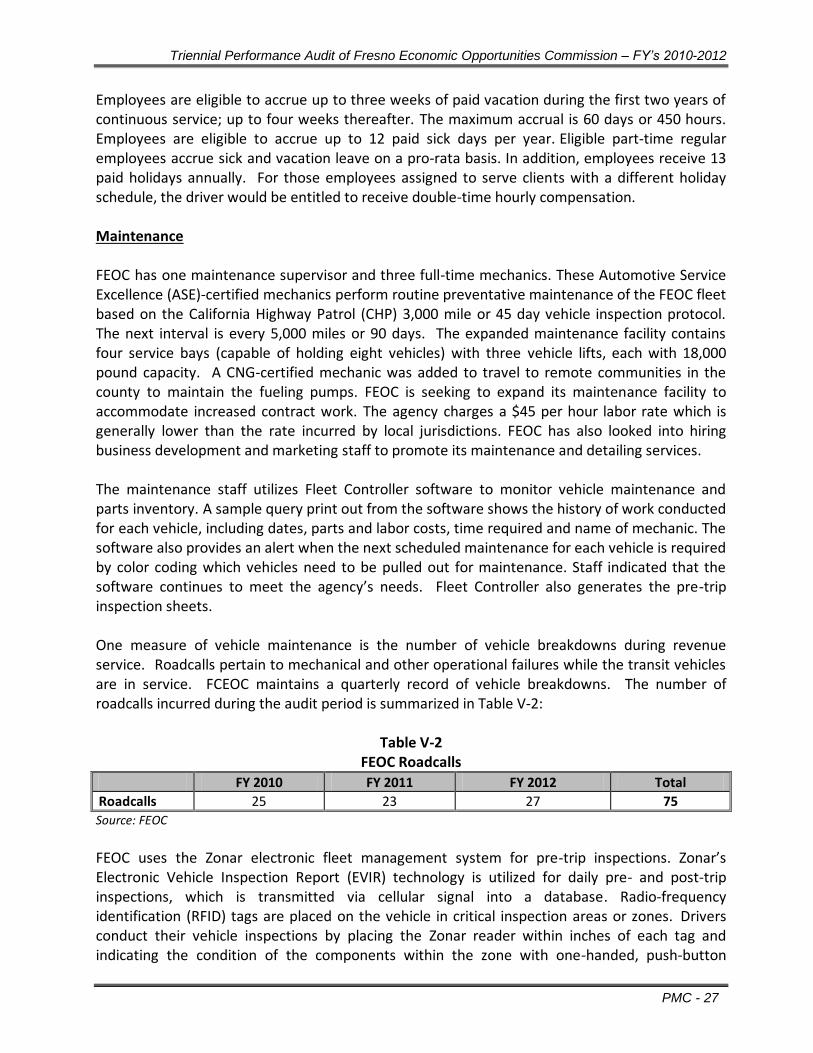
Employees are eligible to accrue up to three weeks of paid vacation during the first two years of continuous service; up to four weeks thereafter. The maximum accrual is 60 days or 450 hours. Employees are eligible to accrue up to 12 paid sick days per year. Eligible part-time regular employees accrue sick and vacation leave on a pro-rata basis. In addition, employees receive 13 paid holidays annually. For those employees assigned to serve clients with a different holiday schedule, the driver would be entitled to receive double-time hourly compensation. Maintenance FEOC has one maintenance supervisor and three full-time mechanics. These Automotive Service Excellence (ASE)-certified mechanics perform routine preventative maintenance of the FEOC fleet based on the California Highway Patrol (CHP) 3,000 mile or 45 day vehicle inspection protocol. The next interval is every 5,000 miles or 90 days. The expanded maintenance facility contains four service bays (capable of holding eight vehicles) with three vehicle lifts, each with 18,000 pound capacity. A CNG-certified mechanic was added to travel to remote communities in the county to maintain the fueling pumps. FEOC is seeking to expand its maintenance facility to accommodate increased contract work. The agency charges a $45 per hour labor rate which is generally lower than the rate incurred by local jurisdictions. FEOC has also looked into hiring business development and marketing staff to promote its maintenance and detailing services. The maintenance staff utilizes Fleet Controller software to monitor vehicle maintenance and parts inventory. A sample query print out from the software shows the history of work conducted for each vehicle, including dates, parts and labor costs, time required and name of mechanic. The software also provides an alert when the next scheduled maintenance for each vehicle is required by color coding which vehicles need to be pulled out for maintenance. Staff indicated that the software continues to meet the agency’s needs. Fleet Controller also generates the pre-trip inspection sheets. One measure of vehicle maintenance is the number of vehicle breakdowns during revenue service. Roadcalls pertain to mechanical and other operational failures while the transit vehicles are in service. FCEOC maintains a quarterly record of vehicle breakdowns. The number of roadcalls incurred during the audit period is summarized in Table V-2:
Table V-2 FEOC Roadcalls
FY 2010 FY 2011 FY 2012 Total
Roadcalls 25 23 27 75
Source: FEOC
FEOC uses the Zonar electronic fleet management system for pre-trip inspections. Zonar’s Electronic Vehicle Inspection Report (EVIR) technology is utilized for daily pre- and post-trip inspections, which is transmitted via cellular signal into a database. Radio-frequency identification (RFID) tags are placed on the vehicle in critical inspection areas or zones. Drivers conduct their vehicle inspections by placing the Zonar reader within inches of each tag and indicating the condition of the components within the zone with one-handed, push-button
Triennial Performance Audit of Fresno Economic Opportunities Commission – FY’s 2010-2012
PMC - 28 28
responses. When a defect is discovered, the driver selects a description from a pre-defined list and indicates if the vehicle is safe to operate. Fault codes are transmitted to the lead mechanic and the reports generated by the EVIR are CHP-compliant. Marketing FEOC utilizes several methods for marketing its transit services. The agency maintains its home website at http://www.fresnoeoc.org/. A brief description of the transit system is provided under the listing of programs offered by the agency. A brochure on the transit system is also available that provides a colorful and attractive layout describing the benefits of the system. The brochure is used at trade fairs, by human resources to recruit new employees and as a medium for explaining the system to potential clients and the general public. In addition, FEOC has maintained a social marketing presence on Facebook (http://www.facebook.com/fresnoeoc?v=info) and Twitter (@FresnoEOC). The Facebook page contains timely information about the activities of the EOC including a list of programs and services offered. Additional marketing is provided by the clients that FEOC serves. Each participating social service agency is responsible for advertising the transit service to its own clients. FEOC has assisted the FMAAA in marketing transportation services. In addition, FEOC works with Fresno County case workers to increase ridership on the CalWORKS systems to maintain productivity. Further, FEOC participates in community service events to market its services and utilizes its agency network to expand its roster of contacts that may have use for transportation services. Annual passenger surveys are conducted to help FEOC understand the service being offered. The surveys, comprised of seven multiple choice questions, are either mailed back or are given to drivers. Passengers are queried on how frequently they use the service, driver courtesy, vehicle comfort, and on-time performance. General Administration and Management FCEOC is governed by a 24-member tripartite Board of Commissioners comprised of eight elected representatives from low-income target areas throughout Fresno County, eight community sector representatives and eight representatives who are publicly-elected officials. The Board appoints the CEO who is the FEOC’s chief administrator. The current CEO was hired in August 2010 as serves as FEOC’s third CEO/Director since its inception. Executive management also includes a Chief Financial Officer, Chief Programs Officer, Internal Audit Director, Strategy and Communications Officer, Planning and Resource Development Officer and the Food Services/Transit Systems Director. The management structure of the Food Services/Transit Systems Division is comprised of the Food Services/Transit Systems Director, Business Manager and five supervisors. Board retreats are held annually. During the most recent retreat, five strategic goals were established, which included financial independence. The Board has also considered strategies to create and expand social enterprise opportunities. FEOC’s Planning and Development Committee
Triennial Performance Audit of Fresno Economic Opportunities Commission – FY’s 2010-2012
PMC - 29 29
developed a business concept white paper, which is a two page document that analyzes viable strategies and sustainable approaches in meeting the social and employment needs of the community. Grants Management
As the co-CTSA for metropolitan Fresno and rural Fresno County, FEOC is eligible to receive TDA Article 4.5 funds, which are budgeted to assist with operational costs. According to the annual TDA claims submitted by FEOC for FYs 2010 through 2012, TDA Article 4.5 funding comprised between 16.7 and 17.3 percent of FEOC operational costs in the urban area, and between 19.3 and 33.7 percent in the rural area. Contract revenue from its various social service contracts comprises the remainder of its operational revenue. These TDA to local funding ratios help the agency to meet its TDA farebox requirements. FEOC has explored and will continue to research the listing of additional capital and operating funding sources available to public and private agencies. Use of Federal grants such as FTA Section 5310 (Elderly Individuals and Individuals with Disabilities Program), 5316 (Jobs Access and Reverse Commute Program) and 5317 (New Freedom Program) require consistency with the Fresno COG Coordinated Public Transit-Human Services Transportation Plan. FEOC has supplemented revenues from its CVRC contract with approximately $440,000 in FTA Section 5316 funds toward employment transportation. As the CTSA, FEOC has been awarded capital grants to purchase vehicles and equipment under FTA Section 5310. In accordance with FTA’s instructions, the required local match is deposited into a special account prior to any purchases. When the equipment has been purchased with the grant dollars, all remaining local match funds in the account, including interest earned, are returned to the grantee. In addition, FEOC has leveraged FTA Section 5310 funds with Local Measure C funds toward the procurement of technology upgrades.
Triennial Performance Audit of Fresno Economic Opportunities Commission – FY’s 2010-2012
PMC - 30 30
Section VI
Findings
The following summarizes the major findings obtained from this Triennial Audit covering fiscal years 2010 through 2012. A set of recommendations is then provided.
Triennial Audit Findings
1. Of the compliance areas pertaining to FEOC, the operator fully complied with all eight
requirements. Three additional compliance requirements are not applicable to FEOC (e.g., exclusive urban and rural area farebox recovery and use of federal funds in conjunction with State Transit Assistance Funds).
2. FEOC Transit Systems participates in the CHP Transit Operator Compliance Program in which
the CHP has conducted inspections within the 13 months prior to each TDA claim. The CHP inspection reports submitted for review were found to be satisfactory.
3. The FEOC Transit Systems operating budget exhibited modest fluctuations during the audit period, but did not exceed 15 percent. The budget increased 2.1 percent in FY 2010 yet decreased in subsequent years by 6.3 percent and 8.8 percent, respectively.
4. Because the type of transit service provided by FCEOC does not require passengers to pay a
fare, an alternative method to the farebox recovery ratio has been adopted by Fresno COG. This method requires FCEOC to match LTF revenues with local support revenues on a 45 percent LTF/ 55 percent local support basis. The local match has come from service contract fees by participating social service agencies, charter trips, and donations.
5. The calculated local support match for the rural area was 72.6 percent for FY 2010, 66.3
percent in FY 2011 and 80.7 percent for FY 2012. For the urban area, the local support match was 82.7 percent for FY 2010, 68 percent in FY 2011 and 83.3 percent in FY 2012. These percentages far exceeded the minimum 55 percent match.
6. FEOC satisfactorily implemented two of the four the prior triennial audit recommendations.
The two recommendations not fully implemented pertain to the coordination of consolidated travel training and ambassador services, and coordination of ADA-certification.
7. Operating costs for the combined Urban and Rural CTSA services (meal delivery and
passengers) decreased 9.5 percent from the FY 2009 base year through FY 2012. Combined Urban CTSA operating costs decreased 18.5 percent during the audit period whereas the Rural CTSA operating costs increased 8.3 percent.
Triennial Performance Audit of Fresno Economic Opportunities Commission – FY’s 2010-2012
PMC - 31 31
8. The Fresno County Economic Opportunities Commission (FCEOC) modified its name to Fresno Economic Opportunities Commission (FEOC). In concert with the name change, the FEOC also adopted new branding and expansion of service offering.
9. During the audit period, several significant actions occurred including the hiring of a new
agency CEO as well as completion of a new administrative building that features a 125 person capacity training room with state-of-the-art audio-visual technology. The main kitchen used in conjunction with the meal delivery program also underwent expansion and renovation.
10. FEOC opened a vehicle detail facility and marketed the service to the Cities of Clovis and
Fresno. The detailing enterprise employs two employees and averages two vehicles daily. FEOC is also looking into a possible healthy foods initiative that would address the problem of “food deserts” in low-income communities.
11. The largest number of transit trips reported during the period was for FCRTA, followed by
Head Start and CVRC. In spite of stable ridership on Head Start, the program contract incurred a $1.2 million reduction due to the shortening of the school year by nine days. This had an impact on the transportation services component.
12. FEOC is seeking to expand its maintenance facility to accommodate increased contract work.
The agency charges a lower hourly labor rate compared to that incurred by the local jurisdictions. FEOC has also looked into hiring business development and marketing staff to promote its maintenance and detailing services.
13. FEOC uses the Zonar electronic fleet management system for pre-trip inspections. Zonar’s
Electronic Vehicle Inspection Report (EVIR) technology is utilized for daily pre- and post-trip inspections, which is transmitted via cellular signal into a database.
Triennial Performance Audit of Fresno Economic Opportunities Commission – FY’s 2010-2012
PMC - 32 32
Recommendations
1. Closely monitor performance indicator trends identified from the performance audit. FEOC should continue to closely monitor its performance indicators, as some indicators are showing trends that might cause concern in the provision of overall service. Examples include the sharp growth in vehicle service hours and miles for rural and urban meal delivery services relative to actual meals delivered. Total vehicle hours for meal delivery increased by more 28.4 percent whereas total vehicle service miles increased 32.8 percent. This is in contrast to the number of meals delivered which declined by 3.5 percent. As a result, performance indicators for these measures showed negative trends for service effectiveness.
It is understood that the FEOC transit system differs from public transit operators in that social service agency programs can fluctuate from year to year, and that FEOC provides its clients with transportation under annual service contracts with participating social service agencies. The number of client trips and the negotiated hours and miles for each client are individually tailored to meet the needs of each client. However, from an overall performance standpoint, the service should be monitored closely for potential declines in performance trends as the data are used for future improvements to the service including future negotiations of hours and miles of service relative to client trips.
2. Continue coordination efforts with other public transit and social service agencies in funding and offering consolidated travel training and ambassador services. This recommendation is carried forward from the prior triennial audit. The auditor acknowledges FEOC’s efforts to facilitate discussion and research of consolidated travel training and an ambassador program amongst other social service and transit providers. Identified as a short-range strategy and priority contained in the Fresno County Coordinated Human Services Transportation Plan, a travel training program is designed to empower senior citizens, persons with disabilities, and non-English speaking persons to use fixed-route public transit services independent of family, friends or demand responsive transit. As a co-CTSA designee in Fresno County, it is suggested that the FEOC continue working with service providers and stakeholders such as the Social Service Transportation Advisory Committee (SSTAC) to identify resources and implement consolidated travel training and an ambassador program.
3. Advance the role of the CTSA into furthering new business and social enterprise initiatives.
As one of the largest community action agency in the United States, FEOC has been adept at identifying opportunities that address the socio-economic needs of the community. Enterprises such as meal preparation and delivery, vehicle detailing and maintenance, social service transportation and training services contribute to generating local support
Triennial Performance Audit of Fresno Economic Opportunities Commission – FY’s 2010-2012
PMC - 33 33
revenues. The FEOC Board developed five strategic goals during one of its retreat, which included financial sustainability. The Board has also considered strategies to create and expand social enterprise opportunities. FEOC’s Planning and Development Committee developed a business concept white paper that analyzed viable strategies and sustainable approaches in meeting the social and employment needs of the community. Initiatives such as the establishment of nutritious food outlets and travel training services have been considered. It is suggested that the FEOC as a co-CTSA designee further its role in social enterprise in order to foster financial independence.