January 2007 Economic Review and Revenue Forecast Update State of Vermont Emergency Board and...
30
January 2007 Economic Review and Revenue Forecast Update State of Vermont Emergency Board and Legislative Committees January 16, 2007 Montpelier, Vermont Prepared By: Economic & Policy Resources, Inc. and Kavet, Rockler & Associates P o licy R e so u rce s, In c. EPR E conom ic & Kavet, Rockler & Associates, LLC Economic and Public Policy Consulting
-
Upload
tobias-brown -
Category
Documents
-
view
215 -
download
0
Transcript of January 2007 Economic Review and Revenue Forecast Update State of Vermont Emergency Board and...
January 2007 Economic Review and Revenue Forecast Update
State of Vermont Emergency Board and Legislative Committees
January 16, 2007Montpelier, Vermont
Prepared By: Economic & Policy Resources, Inc. and Kavet, Rockler & Associates
Policy Resources, Inc.EPR Economic & Kavet, Rockler & Associates, LLCEconomic and Public Policy Consulting

Revenue Forecast Summary• Revenue receipts are running virtually “on target” through
December of FY 2007, within one-tenth of one percent of July 2006 projections…
Policy Resources, Inc.EPR Economic &
Revenue Collections Through the 1st Half of FY 2007,Diff. From Target Through December
$0.4
$(1.4)
$(0.1)
$(1.0)
$(5.0)$(4.0)$(3.0)$(2.0)$(1.0)
$-$1.0$2.0$3.0$4.0$5.0
G-Fund T-Fund E-Fund Combined
Mil
lio
ns
of
Do
llar
s
Kavet, Rockler & Associates, LLCEconomic and Public Policy Consulting
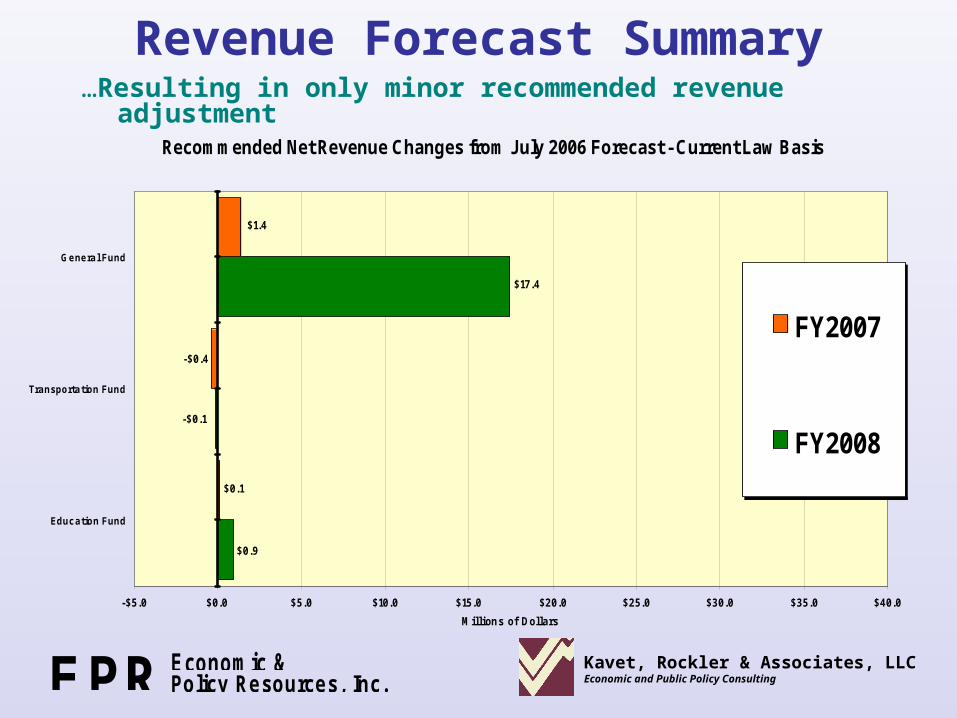
Revenue Forecast Summary
Policy Resources, Inc.EPR Economic & Kavet, Rockler & Associates, LLCEconomic and Public Policy Consulting
Recommended Net Revenue Changes from July 2006 Forecast - Current Law Basis
$0.9
$17.4
-$0.1
$0.1
$1.4
-$0.4
-$5.0 $0.0 $5.0 $10.0 $15.0 $20.0 $25.0 $30.0 $35.0 $40.0
Education Fund
Transportation Fund
General Fund
Millions of Dollars
FY2007
FY2008
…Resulting in only minor recommended revenue adjustment

U.S. Economic Situation/Outlook
Policy Resources, Inc.EPR Economic &
• Businesses are in stellar financial shape… Corporate Profits Soar as Rising Productivity Drops to the Bottom Line
(U.S. corporate profits with inventory valuation and capital consumption adjustment; Source: US BEA)
100
200
300
400
500
600
700
800
900
1000
1100
1200
1300
1400
1500
1600
1700
1980Q
1
1980Q
4
1981Q
3
1982Q
2
1983Q
1
1983Q
4
1984Q
3
1985Q
2
1986Q
1
1986Q
4
1987Q
3
1988Q
2
1989Q
1
1989Q
4
1990Q
3
1991Q
2
1992Q
1
1992Q
4
1993Q
3
1994Q
2
1995Q
1
1995Q
4
1996Q
3
1997Q
2
1998Q
1
1998Q
4
1999Q
3
2000Q
2
2001Q
1
2001Q
4
2002Q
3
2003Q
2
2004Q
1
2004Q
4
2005Q
3
2006Q
2
Bil
lio
ns o
f U
.S.
Do
llars
Kavet, Rockler & Associates, LLCEconomic and Public Policy Consulting

U.S. Situation/Outlook
Policy Resources, Inc.EPR Economic &
• Growth will rebound after a transition…
Real GDP is Expected to Decelerate Further Before Resuming Growth at About 3%(Percent Change vs. Year Ago, Sources: U.S. Bureau of Economic Analysis and Economy.com)
-1.0%
0.0%
1.0%
2.0%
3.0%
4.0%
5.0%
6.0%
1988Q
1
1988Q
4
1989Q
3
1990Q
2
1991Q
1
1991Q
4
1992Q
3
1993Q
2
1994Q
1
1994Q
4
1995Q
3
1996Q
2
1997Q
1
1997Q
4
1998Q
3
1999Q
2
2000Q
1
2000Q
4
2001Q
3
2002Q
2
2003Q
1
2003Q
4
2004Q
3
2005Q
2
2006Q
1
2006Q
4
2007Q
3
2008Q
2
2009Q
1
2009Q
4
Perc
en
t C
han
ge V
s.
Year
Ag
o Q
uart
er
FORECAST
Kavet, Rockler & Associates, LLCEconomic and Public Policy Consulting

U.S. Economic Situation/Outlook• But the risk of recession is now rising….
Policy Resources, Inc.EPR Economic & Kavet, Rockler & Associates, LLCEconomic and Public Policy Consulting
Wall Street Journal Survey of 55 Economists' Expectations for Recession in 2007
0%
10%
20%
30%
40%
50%
60%
70%
80%
90%
100%
Fe
b-0
6
Ma
r-06
Ap
ril-06
Ma
y-0
6
Ju
ne
-06
Ju
ly-0
6
Se
pt-0
6
Oct-0
6
No
v-0
6
De
c-0
6
Pro
ba
bilit
y o
f R
ec
es
sio
n A
mo
ng
Ec
on
om
ists
Po
lle
d
High
Low
Average

U.S. Economic Situation• Oil Prices have declined since the July peak…but for how long?
Policy Resources, Inc.EPR Economic &
Price of West Texas Intermediate Crude, January 1996-January 2007
$0$10$20$30$40$50$60$70$80
1996:1
1997:1
1998:1
1999:1
2000:1
2001:1
2002:1
2003:01
2004:01
2005:01
2006:1
2007:1
Month/Year
Pri
ce ($
Per
Bbl
.)
Kavet, Rockler & Associates, LLCEconomic and Public Policy Consulting

U.S. Economic Situation• Gasoline prices have followed suit, but remain over $2.30/gallon…
Policy Resources, Inc.EPR Economic &
Price of Regular Gasoline, January 1996-January 2007 (U.S. Average)
$0.00
$0.50$1.00
$1.50
$2.00
$2.50$3.00
$3.50
1996:1
1997:1
1998:1
1999:1
2000:1
2001:1
2002:1
2003:01
2004:01
2005:01
2006:1
2007:1
Month/Year
Pri
ce ($
Per
Gal
lon)
Kavet, Rockler & Associates, LLCEconomic and Public Policy Consulting

U.S. Economic Situation• Job growth is slowing but still remains positive as
employers slow the rate of hiring (but do not cut jobs)…
Policy Resources, Inc.EPR Economic &
U.S. Quarterly Average Payroll Job Change,2003:Q1-2006:4
-88.7
-26.3
18.0
134.3
174.3199.0
115.3
210.3
160.3 166.7 154.7178.7 176.3
115.3
185.3
135.7
-100.0
-50.0
0.0
50.0
100.0
150.0
200.0
250.0
Q1 2003
Q2 2003
Q3 2003
Q4 2003
Q1 2004
Q2 2004
Q3 2004
Q4 2004
Q1 2005
Q2 2005
Q3 2005
Q4 2005
Q1 2006
Q2 2006
Q3 2006
Q4 2006
Quarter/Year
Pay
roll
Jobs
(T
hous
ands
)
Kavet, Rockler & Associates, LLCEconomic and Public Policy Consulting

U.S. Economic Situation• The Fed’s “tightening” campaign has curbed housing starts…
Policy Resources, Inc.EPR Economic &
Federal Funds Target Rate vs. Housing Starts
(Sources: Federal Reserve Board of Governors, U.S. Census Bureau)
1
2
3
4
5
6
7
8
9
Jul-9
0
Jul-9
1
Jul-9
2
Jul-9
3
Jul-9
4
Jul-9
5
Jul-9
6
Jul-9
7
Jul-9
8
Jul-9
9
Jul-0
0
Jul-0
1
Jul-0
2
Jul-0
3
Jul-0
4
Jul-0
5
Jul-0
6
Fed
era
l F
un
ds
Ta
rge
t R
ate
%
700
900
1100
1300
1500
1700
1900
2100
2300
Ho
us
ing
Sta
rts
SA
AR
(00
0)
Federal Funds Target Rate - Left Axis
Housing Starts - Right Axis
Kavet, Rockler & Associates, LLCEconomic and Public Policy Consulting

U.S/VT Economic Situation• The housing market correction is now well-underway…
Policy Resources, Inc.EPR Economic &
Residential Construction Wanes as Interest Rates Rise
1.00
1.50
2.00
2.50
3.00
3.50
Jan-9
6
May-9
6
Sep-9
6
Jan-9
7
May-9
7
Sep-9
7
Jan-9
8
May-9
8
Sep-9
8
Jan-9
9
May-9
9
Sep-9
9
Jan-0
0
May-0
0
Sep-0
0
Jan-0
1
May-0
1
Sep-0
1
Jan-0
2
May-0
2
Sep-0
2
Jan-0
3
May-0
3
Sep-0
3
Jan-0
4
May-0
4
Sep-0
4
Jan-0
5
May-0
5
Sep-0
5
Jan-0
6
May-0
6
Sep-0
6
Source: F.W. Dodge, McGraw-Hill
Ind
exed
to
Jan
uary
1996 =
1.0
0 U.S.
Vermont
Kavet, Rockler & Associates, LLCEconomic and Public Policy Consulting

U.S. / VT Economic Situation
Policy Resources, Inc.EPR Economic &
What Goes Up, Must Come Down (and it's started)...
(Residential Construction Starts Peak in Vermont at More Than $700M in March - 12 month moving total basis)
0.0
50.0
100.0
150.0
200.0
250.0
300.0
350.0
400.0
450.0
500.0
550.0
600.0
650.0
700.0
750.0
Dec-6
9
Dec-7
1
Dec-7
3
Dec-7
5
Dec-7
7
Dec-7
9
Dec-8
1
Dec-8
3
Dec-8
5
Dec-8
7
Dec-8
9
Dec-9
1
Dec-9
3
Dec-9
5
Dec-9
7
Dec-9
9
Dec-0
1
Dec-0
3
Dec-0
5
Source: F.W. Dodge/McGraw-Hill
Mil
lio
ns o
f D
oll
ars
Kavet, Rockler & Associates, LLCEconomic and Public Policy Consulting

VT Economic Situation• And housing prices are also moderating and will likely decline
before the real estate market correction is over...
Policy Resources, Inc.EPR Economic &
OFHEO Vermont Housing Price Index Percent Change Vs. Year Ago
-4.0%
-2.0%
0.0%
2.0%
4.0%
6.0%
8.0%
10.0%
12.0%
14.0%
16.0%
18.0%
1984Q
1
1984Q
3
1985Q
1
1985Q
3
1986Q
1
1986Q
3
1987Q
1
1987Q
3
1988Q
1
1988Q
3
1989Q
1
1989Q
3
1990Q
1
1990Q
3
1991Q
1
1991Q
3
1992Q
1
1992Q
3
1993Q
1
1993Q
3
1994Q
1
1994Q
3
1995Q
1
1995Q
3
1996Q
1
1996Q
3
1997Q
1
1997Q
3
1998Q
1
1998Q
3
1999Q
1
1999Q
3
2000Q
1
2000Q
3
2001Q
1
2001Q
3
2002Q
1
2002Q
3
2003Q
1
2003Q
3
2004Q
1
2004Q
3
2005Q
1
2005Q
3
2006Q
1
2006Q
3
2007Q
1
2007Q
3
2008Q
1
2008Q
3
2009Q
1
2009Q
3
2010Q
1
2010Q
3
2011Q
1
Kavet, Rockler & Associates, LLCEconomic and Public Policy Consulting

VT Economic Situation• Jobs in VT have surpassed pre-recession levels in all major job
sectors except 3 (of 11 major sectors)...
Policy Resources, Inc.EPR Economic &
Job Growth in Vermont Since Last Cyclical Peak (July 2001) and Trough (April 2003)
-10.0 -5.0 0.0 5.0 10.0 15.0
Total - All Industries
Construction
Manufacturing
Trade, Transportation & Utilities
Retail Trade
Financial Activities
Professional & Business Services
Private Education Services
Health Care & Social Assistance
Leisure & Hospitality
Other Services
Total Government
Change in Employment (000) Source: Vermont Department of Labor
Since Last Peak - July 2001
Since Last Trough - April 2003
Kavet, Rockler & Associates, LLCEconomic and Public Policy Consulting

VT Economic Situation• Vermont’s factory sector has been in a long-term job decline, but
this has been the case regionally and nation-wide…
Policy Resources, Inc.EPR Economic &
Structural Change: Manufacturing Employment in Vermont, N.E. and the U.S.
(seasonally adjusted data, indexed, January 1990 = 1.00)
0.60
0.65
0.70
0.75
0.80
0.85
0.90
0.95
1.00
1.05
1.10
Source: U.S. Bureau of Labor Statistics
Ind
exed
to
Jan
uary
1990 =
1.0
0
Vermont
U.S.
NewEngland
Kavet, Rockler & Associates, LLCEconomic and Public Policy Consulting

VT Economic Situation• VT’s unemployment rate has been lower than the U.S. average…
Policy Resources, Inc.EPR Economic &
Vermont Unemployment Rate Relative to U.S. Unemployment Rate
0.40
0.50
0.60
0.70
0.80
0.90
1.00
1.10
1.20
1.30
1.40
Jan
-69
Jan
-71
Jan
-73
Jan
-75
Jan
-77
Jan
-79
Jan
-81
Jan
-83
Jan
-85
Jan
-87
Jan
-89
Jan
-91
Jan
-93
Jan
-95
Jan
-97
Jan
-99
Jan
-01
Jan
-03
Jan
-05
Verm
on
t R
ate
/U.S
. R
ate
Kavet, Rockler & Associates, LLCEconomic and Public Policy Consulting

• But Vermont’s position among the 50 states has slipped from 2nd to 15th since last May... Unemployment Rate by State - November 2006
Seasonally Adjusted Data, Source: U.S. Bureau of Labor Statistics
7.5%6.9%
6.6%6.4%
6.0%5.5%
5.4%5.3%
5.2%5.2%
5.1%5.1%
5.0%5.0%5.0%
4.9%4.8%
4.7%4.7%4.7%
4.6%4.6%
4.5%4.5%4.5%
4.4%4.3%4.3%
4.2%4.2%
4.1%4.1%4.1%
3.9%3.9%3.9%
3.7%3.6%
3.5%3.4%
3.3%3.3%3.3%
3.2%3.2%
3.1%3.0%3.0%
2.8%2.6%
2.3%
0.0% 2.0% 4.0% 6.0% 8.0%
MississippiMichigan
South CarolinaAlaska
District of ColumbiaKentucky
OhioOregon
ArkansasRhode Island
MissouriWest Virginia
MassachusettsTennesseeWashington
North CarolinaIndianaMaineTexas
WisconsinCaliforniaGeorgia
LouisianaNew J ersey
PennsylvaniaConnecticut
KansasNew Mexico
NevadaNew York
ArizonaColorado
IllinoisMaryland
MinnesotaOklahoma
VermontDelaware
New HampshireIowa
FloridaIdaho
North DakotaAlabama
South DakotaNebraska
VirginiaWyomingMontana
UtahHawaii
Policy Resources, Inc.EPR Economic & Kavet, Rockler & Associates, LLCEconomic and Public Policy Consulting
VT Economic Situation

VT Economic Situation• VT’s labor market recovery remains historically restrained…
Policy Resources, Inc.EPR Economic &
A Tale of Four Employment Cycles in Vermont - Redux
(Total Vermont Nonagricultural Employment Relative to Prior Cyclical Peak, Source: US Bureau of Labor Statistics)
0.95
1.00
1.05
1.10
1.15
1.20
1.25
1 2 3 4 5 6 7 8 9 10
11
12
13
14
15
16
17
18
19
20
21
22
23
24
25
26
27
28
29
30
31
32
33
34
35
36
37
38
39
40
41
42
43
44
45
46
47
48
49
50
51
52
53
54
55
56
57
58
59
60
61
62
63
64
65
Months After Prior Cyclical Peak
Em
plo
ym
en
t L
ev
el
Ind
ex
ed
to
Pri
or
Cycli
cal
Pe
ak (
Pri
or
Peak =
1.0
0)
Aug-74
Jul-81
May-90
Jul-01
15 Months
25 Months
34 Months
46 Months
Month of Cyclical Peak
Kavet, Rockler & Associates, LLCEconomic and Public Policy Consulting

VT Economic Situation• And will likely continue to remain so…
Policy Resources, Inc.EPR Economic &
Calendar Year Forecast Comparison: United States, New England, and Vermont (November 2006 NEEP Forecast)
2001 2002 2003 2004 2005 2006 [1] 2007 2008 2009 2010Real Output (% Change)U.S. Gross Domestic Product 0.8 1.6 2.5 3.9 3.2 3.5 2.9 3.2 3.2 3.0N.E. Gross Domestic Product 0.8 -0.3 2.3 4.1 3.3 1.7 2.1 2.5 2.6 2.6Vermont Gross State Product 4.3 2.0 3.7 4.5 3.0 0.9 1.9 2.4 2.4 2.1
Non-Farm Payroll Jobs (% Change)U.S. 0.0 -1.1 -0.3 1.1 1.5 1.9 1.2 1.0 1.4 1.3New England 0.1 -1.1 -0.3 1.1 1.5 1.4 1.0 1.1 1.4 1.4Vermont 1.1 -0.9 -0.1 1.3 0.8 0.8 0.7 0.7 0.8 0.8
Personal Income%Change (2000 Dollars)
U.S. 1.4 0.4 1.2 3.5 2.3 3.9 3.1 3.4 3.3 3.2New England 1.9 -0.7 0.6 3.5 2.3 1.9 2.5 2.8 2.7 2.5Vermont 2.9 0.3 1.4 3.1 2.3 2.0 2.4 3.0 2.8 2.4
Unemployment (Percent)U.S. 4.7 5.8 6.0 5.5 5.1 4.7 4.8 4.8 4.6 4.5New England 3.6 4.8 5.4 4.9 4.7 4.6 4.8 4.7 4.6 4.5Vermont 3.3 4.0 4.4 3.7 3.5 3.3 3.4 3.4 3.2 3.2
----------------------------Actual-------------------------- --------------------------Forecast-------------------------
Kavet, Rockler & Associates, LLCEconomic and Public Policy Consulting

VT Situation/Outlook• At a level somewhat below the U.S. average...
U.S. And Vermont Employment% Change Year Over Year
0.00.20.40.60.81.01.21.41.61.8
2005 2006 2007 2008 2009 2010
Year
Ann
ual P
erce
nt C
hang
e
Vermont
U.S.
Policy Resources, Inc.EPR Economic & Kavet, Rockler & Associates, LLCEconomic and Public Policy Consulting

VT Personal Income Tax Base• Tax year 2005 income disparities persisted...
Policy Resources, Inc.EPR Economic & Kavet, Rockler & Associates, LLCEconomic and Public Policy Consulting
Percent Change in Adjusted Gross Income in Vermont, 2005 vs. 2004 by Income Class
-10.0% 0.0% 10.0% 20.0% 30.0% 40.0% 50.0%
$0-$5
$10-$15
$20-$25
$30-$35
$40-$45
$50-$60
$75-$100
$125-$150
$200-$300
$500-$1,000
Percent Change Source: Vermont Department of Taxes
Average Percent Change for All Vermont Residents = 8.3%

VT Personal Income Tax Base• Though were less pronounced than in tax year 2004...
Policy Resources, Inc.EPR Economic & Kavet, Rockler & Associates, LLCEconomic and Public Policy Consulting
Percent Change in Adjusted Gross Income in Vermont, 2004 vs. 2003 by Income Class
-10.0% 0.0% 10.0% 20.0% 30.0% 40.0% 50.0% 60.0% 70.0%
$0-$5
$10-$15
$20-$25
$30-$35
$40-$45
$50-$60
$75-$100
$125-$150
$200-$300
$500-$1,000
Percent Change Source: Vermont Department of Taxes
Average Percent Change for All Vermont Residents = 9.5%

VT Personal Income Tax Base• But will likely support somewhat higher personal income receipts in both
FY07 and FY08, despite the risks of heightened income volatility
Policy Resources, Inc.EPR Economic & Kavet, Rockler & Associates, LLCEconomic and Public Policy Consulting
Percent Change in Net Vermont Income Tax Paid, 2005 vs. 2004 by Income Class
-10.0% -5.0% 0.0% 5.0% 10.0% 15.0% 20.0% 25.0% 30.0% 35.0% 40.0%
$0-$5
$10-$15
$20-$25
$30-$35
$40-$45
$50-$60
$75-$100
$125-$150
$200-$300
$500-$1,000
Percent Change Source: Vermont Department of Taxes
Average Percent Change for All Vermont Residents = 9.3%

VT Meals and Rooms Tax Base• Despite strong Fall tourism visitation, poor start to winter recreation
season could cost State more than $2 million in FY07 tax revenues
Policy Resources, Inc.EPR Economic & Kavet, Rockler & Associates, LLCEconomic and Public Policy Consulting

Forecast Risks• Most forecast risk remains on the downside for fiscal 2007-09, with a
more rapid decline in housing and real estate as the primary risk…
Policy Resources, Inc.EPR Economic & Kavet, Rockler & Associates, LLCEconomic and Public Policy Consulting
Vermont vs. U.S. OFHEO Housing Price Index Percent Change Vs. Year Ago(Sources: Office of Federal Housing Enterprise Oversight, Economy.com, Vermont J oint Fiscal Office)
-4.0%
-2.0%
0.0%
2.0%
4.0%
6.0%
8.0%
10.0%
12.0%
14.0%
16.0%
18.0%
Vermont
U.S.FORECAST
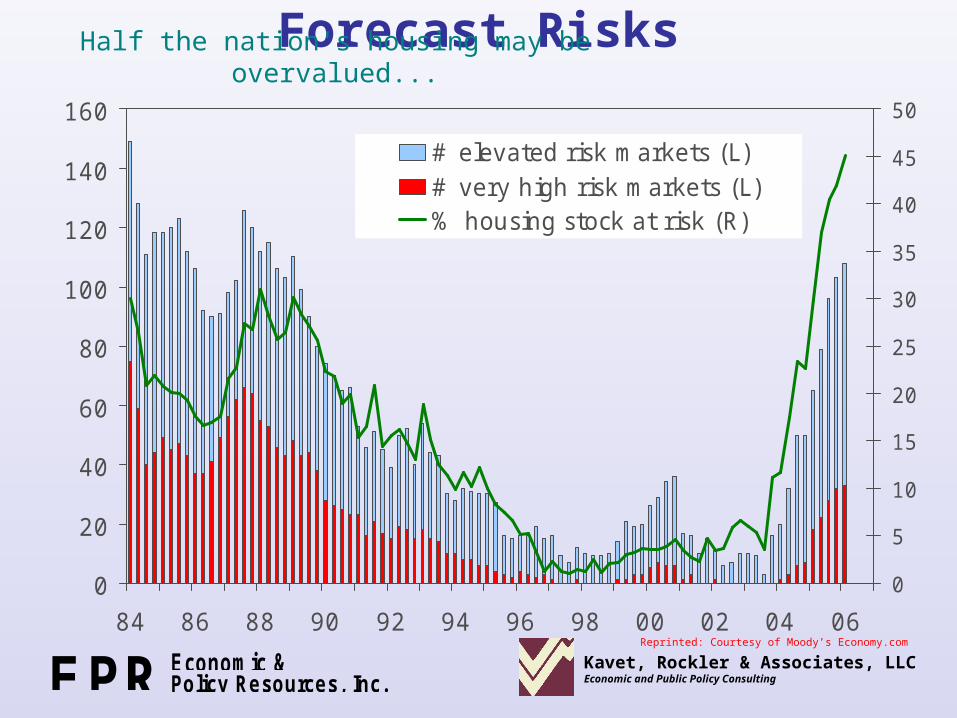
Forecast Risks
Policy Resources, Inc.EPR Economic &
0
20
40
60
80
100
120
140
160
84 86 88 90 92 94 96 98 00 02 04 06
0
5
10
15
20
25
30
35
40
45
50
# elevated risk markets (L)# very high risk markets (L)% housing stock at risk (R)
Reprinted: Courtesy of Moody’s Economy.com
Kavet, Rockler & Associates, LLCEconomic and Public Policy Consulting
Half the nation's housing may be overvalued...
• Which could impact both consumer spending, through wealth effects and financial markets – both domestic and international…
Policy Resources, Inc.EPR Economic & Reprinted: Courtesy of Moody’s Economy.com
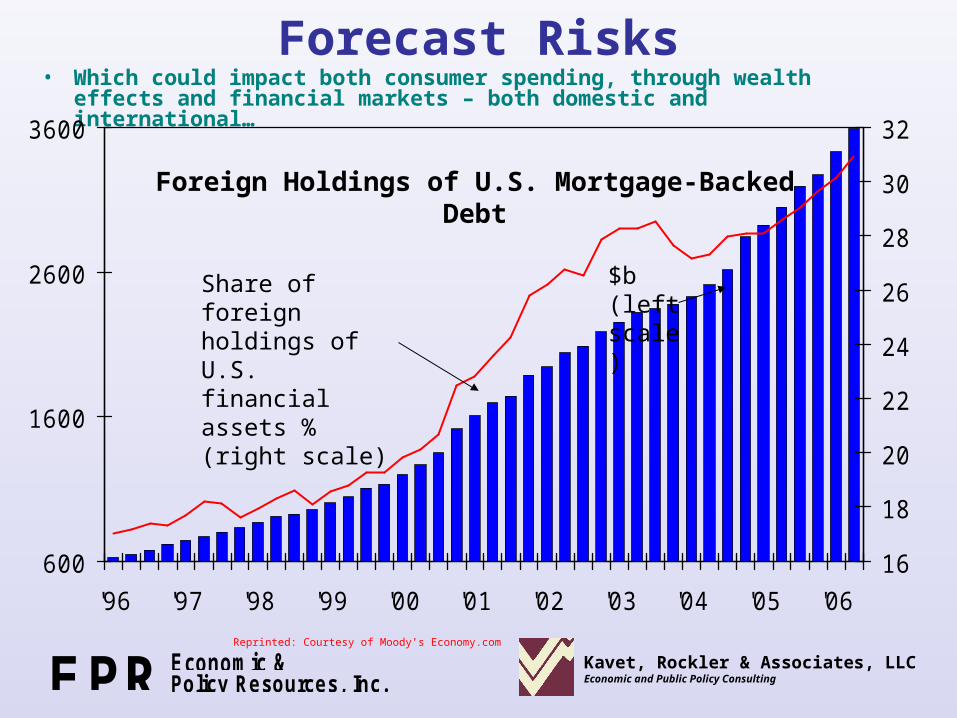
Forecast Risks
Kavet, Rockler & Associates, LLCEconomic and Public Policy Consulting
Share of foreign holdings of U.S. financial assets % (right scale)
600
1600
2600
3600
'96 '97 '98 '99 '00 '01 '02 '03 '04 '05 '06
16
18
20
22
24
26
28
30
32
$b (left scale)
Foreign Holdings of U.S. Mortgage-Backed Debt

Forecast Risks• The deteriorating Federal budget situation and U.S. current account
deficit are also significant risks…
Policy Resources, Inc.EPR Economic & Kavet, Rockler & Associates, LLCEconomic and Public Policy Consulting
0
1
2
3
4
5
6
Current law Plus: I raq Plus: Taxcuts
permanent
Plus:Discretionary
spending
Plus: AMT
$ trilShare of GDP
Sources: CBO, Moody’s Economy.com
Ten Year Cumulative Budget Deficit, FY2006-2015
Reprinted: Courtesy of Moody’s Economy.com

Forecast RisksThe U.S. "Imbalance" of Trade Reaches Unprecedented Proportions
Balance on Current Account, Seasonally Adjusted Data, Source: U.S. Bureau of Economic Analysis
-250000
-200000
-150000
-100000
-50000
0
50000
1960Q1
1961Q2
1962Q3
1963Q4
1965Q1
1966Q2
1967Q3
1968Q4
1970Q1
1971Q2
1972Q3
1973Q4
1975Q1
1976Q2
1977Q3
1978Q4
1980Q1
1981Q2
1982Q3
1983Q4
1985Q1
1986Q2
1987Q3
1988Q4
1990Q1
1991Q2
1992Q3
1993Q4
1995Q1
1996Q2
1997Q3
1998Q4
2000Q1
2001Q2
2002Q3
2003Q4
2005Q1
2006Q2
Mill
ions
of D
olla
rs
• Which could reignite inflationary pressures and limit Fed policy options…
Policy Resources, Inc.EPR Economic & Kavet, Rockler & Associates, LLCEconomic and Public Policy Consulting

For Further Information Contact
- Vermont Legislative Joint Fiscal Office (828-2295)
- Office of Budget and Management of the State of Vermont (828-2376)
Jeffrey B. CarrConsulting Economist to the Vermont State Agency of AdministrationEconomic and Policy Resources, Inc.(802) 878-0346 Ext. [email protected]
Thomas E. KavetConsulting Economist to the Vermont State LegislatureKavet, Rockler & Associates, LLC(802) [email protected]
Policy Resources, Inc.EPR Economic & Kavet, Rockler & Associates, LLCEconomic and Public Policy Consulting