
Jan-Mar'19 Quarterly Preview
104
www.plindia.com Walking on a RAZOR’S EDGE January to March 2019 Quarterly Preview Demonetisation GST
Transcript of Jan-Mar'19 Quarterly Preview

www.plindia.com
Walking on a RAZOR’S EDGE
January to March 2019Quarterly Preview
Demonetisation GST

Jan-Mar’19 Earnings Preview
April 5, 2019 2
THIS PAGE IS INTENTIONALLY LEFT BLANK

Jan-Mar’19 Earnings Preview
April 5, 2019 3
Contents
Page No.
Strategy & Quarterly Preview ................................................................................ 4
Agri Chemicals .................................................................................................... 28
Automobiles ......................................................................................................... 31
Aviation ................................................................................................................ 35
Banks ................................................................................................................... 37
Capital Goods ...................................................................................................... 48
Cement ................................................................................................................ 53
Consumer Durables ............................................................................................. 57
Consumer Staples ............................................................................................... 59
Education ............................................................................................................. 67
Financial Services................................................................................................ 69
Information Tech. ................................................................................................. 77
Media ................................................................................................................... 82
Metals .................................................................................................................. 84
Oil & Gas ............................................................................................................. 90
Pharma ................................................................................................................ 94
Others .................................................................................................................. 99
(All prices as on April 5, 2019)

Jan-Mar’19 Earnings Preview
April 5, 2019 4
Walking on a RAZOR’S EDGE
4Q FY19E Adj. PAT to increase 76.2%: We estimate 8.6% sales growth, 13.8%
EBIDTA growth and 76.2% Adj. PAT growth. Excluding BFSI sales, EBIDTA and
PAT growth is estimated at 7.9%, 19.9% and 9.6%. Sales growth will be led by Agri,
Aviation, Banks, IT and Consumer Staples. Aggregate margins will expand by
163bps. We expect muted performance from Autos and Pharma. Oil and Gas will
show impact of inventory gains while Banks will gain due to lower provisions and
write backs in 4Q19. IT, Cap Goods, Staples and Metals will have a steady quarter.
PL Universe – Q4FY19E
Growth Revenue (%) PAT (%) EBITDA Margin (bps)
YoY QoQ YoY QoQ YoY QoQ
Agri Chemicals 45.1 55.4 30.7 62.2 27 253
Automobiles (4.9) 4.9 (37.6) (9.0) (245) 49
Aviation 36.0 2.4 188.0 91.8 432 311
Banks 20.4 1.5 (186.5) 47.2
Capital Goods 4.8 18.5 23.2 45.8 (28) (91)
Cement 14.5 14.3 15.2 47.1 5 221
Consumer Durables 9.8 38.2 10.2 42.8 (79) 278
Consumer Staples 14.2 (1.0) 22.2 0.4 (4) 106
Education 5.6 165.7 (0.5) (4,909.8) 64 3,566
Financial Services 3.1 3.4 14.0 16.9
Information Tech. 16.5 0.7 28.6 13.4 217 161
Media 15.9 (0.4) 19.3 0.4 170 38
Metals 12.0 10.7 21.1 7.5 302 (102)
Oil & Gas 7.9 (9.8) 5.5 26.4 100 392
Pharma 9.5 (3.5) (11.6) (14.6) 21 (210)
Others 21.9 2.8 (27.7) 6.3 (598) 21
PL Universe 8.6 (0.0) 76.2 19.5 95 215
PL Universe (Excl. Oil & Gas) 9.0 6.3 120.9 17.5 88 27
PL Universe (Excl. BFSI) 7.9 (0.2) 9.6 15.1
Source: Company, PL
High FII Flows and NDA win positives; Poor Demand, farm distress and lack of capex cycle visibility a drag
Headwinds Tailwinds
Poor Demand for core Industries like Auto, slowdown in Consumption High Probability of NDA coming back to Power
Tight Money supply, higher Govt borrowing program in 1H20 NPA’s have peaked out, 50BPS cut in Interest rates
Capex Cycle is yet to pick up, Govt spending might slowdown post May2019 Higher flows to EM due to slowdown in US and EU economies
Farm Distress given low food prices Inflation at 2.6% and Brent of USD60-70
Uncertainty on Monsoons NBFC crisis – worst is over
Source: PL
Markets factoring in NDA victory: We had cautious view on markets on account
of political uncertainty, high US interest rates, rising rural distress and delay in much
awaited capex cycle. However, rising probability of NDA win in 2019 elections,
50bps REPO rate cut by RBI and dovish stance of FED on slowdown in US
economy have resulted in Rs444bn FII inflow and sharp reversal in markets, taking
NIFTY to life time high levels. Fundamentals remain fragile with poor demand, rural
distress and uncertainty on monsoons. We believe markets have mostly factored in
a NDA victory and any adverse election results can result in 10% loss of NIFTY to
10500 levels. However, a rally in event of a surprise BJP win can take the markets
towards all time high PE multiples of 24-25x and a NIFTY level of 13272-13825.
Amnish Aggarwal
[email protected] | 91-22-66322233

Jan-Mar’19 Earnings Preview
April 5, 2019 5
Rate cuts difficult to come from now on, Crude approaching USD70/barrel,
inflation has bottomed out: RBI has announced two rate cuts of 24bps each in
past 3 months given benign crude, need to improve liquidity in the system and low
inflation. However, we believe that the room for further cut in interest rates looks
difficult in near term given that 1) retail inflation has risen to 2.6% after falling
continuously for 4 months 2) crude prices are up 36% from the bottom 3) RBI is
factoring in normal monsoons which is an uncertainty.
Consumption demand uncertain in 1QFY20; Contrary to expectations of
acceleration in demand growth, demand has seen slowdown in core sectors like
automobiles. In consumer staples, rural demand is now growing in line with urban
demand, as against earlier trend of 1.3-1.5x growth a couple of quarters back. The
demand in real estate and construction has been poor and cement demand is led
mainly by Govt contracts. The core sector growth is driven by Govt. thrust on
Housing and roads as private capex is yet to pick up. Consumer companies have
indicated QoQ slowdown in sales in rural India and Auto companies on the
passenger and 2Wheeler segments show pressure on volumes and significant
inventory pile up.
PM Kisan holds key as monsoons an uncertainty: Skymet has given initial
signals of a below normal monsoons and poor start to the rainy season in June. We
believe PM Kisan Yojana will be put to test in the coming year itself as it was
expected to be a major driver for rural demand. We expect subdued rural demand
in 1QFy20, any pick up will be a function of monsoons and improvement in general
sentiments post elections in May.
Global slowdown can improve fund flows; Rising chances of a global slowdown
due to falling growth in US, EU and UK can result in higher inflows to emerging
markets. Rising probability of interest rate cut in US given dovish stance of FED
and slowing economic activity is a negative for global demand. Inverted yield curve
and, decline in business confidence and poor consumption demand in UK and
Brexit uncertainty have added to the woes. We believe such a scenario can result
in higher fund flow to emerging markets which can benefit India, if the elections
provide a stable Govt.
Prefer Private Banks, Consumer, Metals: We believe Nifty will have a strong
support at ~10500. We believe markets are factoring in NDA victory in
elections. Strong BJP win will take markets towards 13272-13825 based on
all time high multiples of 24-25x, a weak third front Govt can make it test 10000
over time. We remain overweight on Consumer, Banks, Metals and turn slightly
overweight on Auto. We are equal weight on IT and Pharma. We remain under
weight on NBFC, Cap Goods, Cement and Oil & Gas. We have added TCS and
increased weightage on HUL, HDFC Bank, HDFC and Maruti in our model portfolio.

Jan-Mar’19 Earnings Preview
April 5, 2019 6
Model Portfolio – Overweight on Consumer, Banks, Auto and Metals
We are overweight on Consumers, Banks and Metals. Our stance is
underweight on NBFC’s, Oil and Gas, Cement, Construction and Pharma. We
are equal weight on IT and Automobiles.
Banks: we are positive on select private banks and have HDFC and IIB as play
on retail growth. We believe corporate banks will continue to gain due to lower
incremental stress and rising recoveries. ICICI and Axis Bank are our picks to
play the corporate bank recovery. We are increasing the weight of HDFC Bank
by 50bps in our portfolio.
NBFC and Housing Finance: We believe worst is over for HFC’s and NBFC’s
and we turn equal weight on HDFC Ltd. NBFC’s and HFC’s backed by strong
industrial houses and promoters will continue to outperform.
Automobiles: Poor demand and rising inventories are taking toll on auto
companies. However, we believe that current trends are temporary in
segments like Passenger vehicles and 2W. we expect BSVI led demand for
CV’s starting from 2QFY20. We remain equal weight on the sector but we
increase the weight significantly in favor of Maruti given strong franchisee and
amongst first gainers of demand recovery.
Consumer: we are overweight given steady demand and likely tailwinds from
uptick in rural demand post 1Q and benign input costs. We continue to like ITC
given 30% valuation discount to coverage universe, TTAN on long term
structural story in Jewellery, Britannia on strong product pipeline and steady
growth and Crompton Consumer on play on small durables, improving
distribution and new launches. We increase our weight on HUL given strong
ecosystem of brands, distribution, logistics and strong presence in emerging
categories. We would use any weakness in stock on volume and demand
concerns to increase our positions.
Oil and Gas: Our underweight stance emanates from rising crude prices and
uncertainty on stance on Iran crude supply to select countries. Although we
believe that overhang due to elections is over for OMC’s, we structurally prefer
Gas marketing companies like PLNG and IGL.
Metals: Ferrous metals continue to look good due to strong domestic demand
and likely uptick in global prices. We believe consolidation in domestic industry
augurs well for key players in coming periods.
Pharma: we are underweight given poor visibility in the generics business and
specialty products for leading players.
IT: we are overweight on the sector. LTTS seems a structural story on EDS
and TechM could gain from new deals lead by traction in 5G. We add TCS as
a part of model portfolio and assign it an overweight.
In addition to stocks in the model portfolio, we are adding VIP Inds, Kalpataru
Power, Shriram Transport and Maruti in Top picks. We are removing M&M, ITC
and Cholamandalam Investment from our top picks, although we are positive
on these in the long term.
Jan-Mar’19 Earnings Preview
April 5, 2019 7
Top Pick Changes
Maruti Suzuki
Maruti remains a compelling play on demand recovery despite near term issues
related to demand, high inventory and discounting. With the new Ertiga & WagonR
receiving good response and inventory correction efforts taken by the company, we
expect discounts to come off sequentially. Further, with the softening in
commodities as well as forex rates, we expect margins to improve. While volume
growth is expected to remain muted in near term, we feel this slowdown is
temporary in nature and expect recovery from H2FY20 onwards (festive season,
monsoon, pre-buy, favourable base). We remain structurally positive on domestic
passenger car industry and Maruti’s ability to roll out blockbuster products to
maintain its dominant market position given its strong franchise and dealer network.
We value the stock at 25x Sep21E EPS and continue to maintain our BUY rating
with a target price of Rs7,600.
Shriram Transport Finance Company
While we incorporate near term market headwinds expect AUM growth to
accelerate to 17% over FY20-21E led by consistent rural demand for used CV &
used CV replacement cycle remaining intact. Near term margin pressures (20bps
in FY19) are expected to get offset by improving credit costs (down 90bps in FY19
and 40bps by FY21E) and decent operating leverage (24% cost-income in FY20-
21E; MMFS ~30% and CIFC 38% for FY21). Expect ROA’s to climb to 2.5% over
FY21E and RoEs will stabilize at 17%% over FY20-21E. Valuations of 1.4x FY21E
P/BV, price-in current apprehensions, we reiterate BUY with a price target at
Rs1,568 valuing SHTF at 1.8x Mar-21 ABV.
Kalpataru Power Transmission
One of the leading integrated player in T&D EPC space. The share of new
businesses (Oil & Gas pipeline and Railways Infrastructure) continues to increase
from ~7% in FY14 to 20% in FY18, diversifying itself from a pure T&D EPC player
into new high-growth infrastructure areas. We believe this would bring growth
visibility from a long term perspective and stable growth in earnings. We expect
revenue/PAT to grow at CAGR of 16%/18% over the next two years (FY19-21E).
We recommend BUY on the stock with SOTP based target price of Rs547 which is
summation of Rs427 (12xFY21E Standalone Earnings) and Rs120 from holding in
other group companies and investments.
VIP Industries
VIP is a market leader (~50% share) in the organized luggage industry with a well-
diversified portfolio consisting of six brands and multiple SKUs. Strong distribution
network (~11,000 touch points), GST implementation and entry into under
penetrated ladies’ handbags and backpacks market is likely to drive sales/PAT at
a CAGR of 23.7%/25.1% over FY18-21E. While headwinds from currency & crude
volatility prevail, product Premiumisation (rising share of Caprese and Carlton) and
increase in production from captive facilities at Bangladesh will aid in 40bps
EBITDA margin expansion over FY18-21E. BUY with a TP of Rs579.

Jan-Mar’19 Earnings Preview
April 5, 2019 8
SectorMcap
(Rs bn)
Nifty
Weightage
(%)
PL
Weightage
(%)
Weights
Automobiles 6.3 6.6 Overweight
Maruti Suzuki 2.0 3.5
Mahindra & Mahindra 1.3 2.0
Ashok Leyland 1.1
Banks / Insurance 28.4 28.5 Overweight
HDFC Bank 10.5 11.5
ICICI Bank 5.4 6.0
Axis Bank 3.2 3.5
IndusInd Bank 1.9 3.5
HDFC Life Insurance 4.0
Cement 1.6 1.0 Underweight
ACC 1.0
Construction & Engineering 5.8 5.0 Underweight
Larsen & Toubro 3.6 5.0
Consumer 10.4 17.5 Overweight
ITC 5.4 5.0
Titan Company 1.0 3.5
Hindustan Unilever 2.6 4.0
Britania Industries 3.0
Crompton Consumer Electricals 2.0
Healthcare 2.4 2.4 Equalweight
Aurobindo Pharma 1.0
Dr. Reddy's Laboratories 1.4
IT 13.8 13.8 Equalweight
Infosys 6.1 2.5
Tata Consultancy Services 4.5 5.3
Tech Mahindra 1.0 3.0
L&T Technology Services 3.0
Metals 3.7 4.5 Overweight
Tata Steel 0.9 3.5
Jindal Steel & Power 1.0
NBFC 10.4 8.7 Underweight
HDFC 7.2 7.2
Cholamandalam Finance 1.5
Oil & Gas 13.0 12.0 Underweight
Reliance Industries 9.9 6.0
Petronet LNG 2.5
Indraprastha Gas 2.5
GAIL 1.0
Others 1.9 - NA
Telecom 1.6 - NA

Jan-Mar’19 Earnings Preview
April 5, 2019 9
Market exuberant on likely NDA Victory
In addition to strong FII inflows of Rs444bn in past one quarter, changing political
equations have been a key factor contributing to increase in investor confidence
and improvement in sentiments. We note that the ruling dispensation has taken
some effective steps like PM Kisan scheme of Rs720bn/annum and 10%
reservation based on income levels which have gone a long way in providing relief
to some of the disgruntled sections of the society.
NDA has gained quite a bit of psychological advantage post Pulwama attacks and
the GOI response to the same. We believe that impact of such incidents is usually
more in Hindi heartland and central Indian states which are key to BJP coming to
power at the center.
Nationalism, Farmers and Reservations steal the focus
Key concerns raised prior to election BJP's response Comments
Corruption – Rafale Deal Lokpal appointment and progress in various corruption cases
The Rafale Rhetoric has lost its way
Farmer Distress PM-KISAN scheme, PMSYM (Pension scheme) Poor farm prices and drought in select states has been an issue, PM Kisan provides some relief, more so to marginal farmers
Middle Class dissatisfaction 10% reservation for general category, income tax relief for earnings up to Rs5 lakh
10% reservation and tax break and been able to take care of middle class sentiments to a reasonable extent
Terrorism and Foreign Policy Air force strike post Pulwama attack Post Pulwama attack, the focus shifts to nationalism
Lack of Job creation Job Creation high in unorganized sector Organized job creation has become more of a slogan during elections in a liberal economy
Inflation Crude down ~30% after reaching highs of~$80/brl in Nov 2018
Food Deflation has bottomed out, inflation under control broadly
Source: PL
We note that NIFTY returns ahead of elections have been positive only on two
occasions, 2009 and 2014. While 2009 was on a low base post Lehman crisis, 2014
returns were driven by hopes of NDA coming to power. The NIFTY returns of past
few months suggest that market is factoring in NDA victory, although the level of
confusion prevails relative to 2009 and 2014. We believe that momentum wrests
with NDA as of now given a fragile opposition and likely benefits of schemes
providing electricity connections, Gas cylinders, PM Kisan and nationalistic fervor
post Pulwama.
Nifty Returns
Pre-Election Return % Month/Year
Post-Election Return %
1M 3M 6M 1M 3M 6M
6.2% 8.7% 13.0% April 2019 NA NA NA
8.0% 15.2% 17.1% May-14 3.9% 9.8% 18.8%
28.1% 61.0% 61.5% May-09 -1.3% 6.4% 11.1%
-16.0% -16.2% -6.6% May-04 -0.2% 6.6% 28.6%
-6.2% 1.2% 35.5% Oct-99 3.8% 16.7% 6.1%
5.3% 3.5% -0.6% Mar-98 3.8% -15.7% -19.0%
-2.2% 9.8% 26.4% May-96 2.9% -5.6% -23.8%
Source: PL

Jan-Mar’19 Earnings Preview
April 5, 2019 10
Opinion Polls show a swing of ~36 seats in favor of NDA
Date Published
Polling agency NDA UPA Others NDA UPA Others
Mar-19 Times Now-VMR 283 135 125
Mar-19 News Nation 273 133 137
Mar-19 ABP News – C voter 264 141 138 274 140 129
Mar-19 India TV-CNX 285 126 132
Mar-19 Zee 24 Taas 264 165 114
Feb-19 VDP Associates 242 148 153
Jan-19 Times Now-VMR 252 147 144
Jan-19 ABP News -Cvoter 233 167 143 238 159 146
Jan-19 India Today -Karvy 237 166 140
Jan-19 VDP Associates 225 167 150
Dec-18 India Today 257 146 140
Dec-18 ABP News – C Voter 247 171 125
Dec-18 India TV – CNX 281 124 138 264 134 144
Nov-18 ABP News – C Voter 261 119 163
Oct-18 ABP News 276 112 155
Jan-18 Republic-CVoter 335 89 119 322 96 126
Jan-18 India Today 309 102 132
Source: PL
State Elections post 2014 – NDA was winning most state polls till loss of 3 Big states in Dec2018
Sr. No.
State Year No. of
Constituencies Winning Party
No of Seats
% of vote share
Major Opposition
Party
No of Seats
Ruling Party before
Elections
1 Arunachal Pradesh 2014 60 NDA
2 Haryana 2014 90 BJP 47 33.2 INLD 19 INC
3 Jharkhand 2014 81 BJP 37 31.3 JMM 19 JMM
4 Maharashtra 2014 288 NDA 186 47.2 INC 42 INC
5 Orissa 2014 147 BJD 117 43.4 INC 16 BJD
6 Sikkim 2014 32 SDF 22 55.0 SKM 10 SDF
7 Andhra Pradesh 2014 294 TDP 117 32.5 TRS 63 INC
8 Bihar 2015 243 NDA 124 41.3 RJD 80 JDU+BJP
9 Delhi 2015 70 AAP 67 54.3 BJP 3 INC
10 Assam 2016 126 BJP 60 29.5 INC 26 INC
11 Kerala 2016 140 LDF 91 UDF UDF
12 Puducherry 2016 30 INC 15 30.6 AINRC 8 AINRC
13 Tamil Nadu 2016 234 AIADMK 135 40.8 DMK 88 AIADMK
14 West Bengal 2016 294 AITC 211 44.9 INC 44 AITC
15 Goa 2017 40 NDA 22 60.6 INC 14 BJP
16 Himachal Pradesh 2017 68 BJP 44 48.8 INC 21 INC
17 Manipur 2017 60 NDA 43 51.1 INC 28 INC
18 Punjab 2017 117 INC 77 38.5 AAP 20 Akali Dal + BJP
19 Uttar Pradesh 2017 403 BJP 312 39.7 SP 47 SP
20 Uttarakhand 2017 70 BJP 57 46.5 INC 11 INC
21 Gujarat 2017 182 BJP 99 49.1 INC 78 BJP
22 Karnataka 2018 223 INC+JD(S) 118 56.4 BJP 104 INC
23 Chhattisgarh 2018 90 INC 68 43.0 BJP 15 BJP
24 Madhya Pradesh 2018 230 INC 114 40.9 BJP 109 BJP
25 Mizoram 2018 40 MZF 26 37.6 INC 5 INC
26 Rajasthan 2018 200 INC 100 39.3 BJP 73 BJP
27 Telangana 2018 60 TRS 88 46.9 INC 19 TRS
Source: Election Commission of India, PL

Jan-Mar’19 Earnings Preview
April 5, 2019 11
Monsoon likely at 93% of normal; June rainfall tepid at 77% of LPA
Skymet weather expects 2019 monsoon at 93% of LPA impacted by devolving El
Nino. We believe that the timing and spatial distribution of rainfall spread across all
four months is key to agriculture production. Monsoons are likely to be below-
normal in July and normal in August/September (v/s deficit in June @77% of LPA).
Rainfall in July is expected to be marginally below normal rainfall @ 91% of LPA,
while August/September are expected to have normal rainfall (102%/99% of LPA).
2019 Monsoon to be below normal: Skymet weather expects 2019 monsoon @
93% of LPA i.e below normal, impacted by devolving El Nino. It expects probability
of occurrence of El Nino to be ~80% during March – May which would be dropping
to 60% for June- August. Skymet expects El Nino to be declared anytime now as
moderate El Nino conditions are prevailing over the Pacific Ocean. However, IOD
(Indian Ocean Dipole), which currently is in neutral phase could turn positive during
the monsoon season. Positive IOD is generally associated with higher rainfall.
Rainfall probabilities during Monsoon (June – September’19)
Category Probability
Excess Rainfall 0%
Above Normal Rainfall 0%
Normal Rainfall 30%
Below Normal Rainfall 55%
Draught 15%
Source: Skymet, PL
Expected Monthly precipitation during Monsoon 2019
Month LPA
June 77%
July 91%
August 102%
September 99%
Source: Skymet, PL
2019 monthly precipitation (% of LPA) break up is likely to be a mix
of FY16 & FY17 trend…
Months FY15 FY16 FY17 FY18 FY19 FY20E
Jun-17 115.9% 89.0% 76.8% 100.0% 89.9% 77%
Jul-17 83.6% 107.0% 128.0% 107.0% 94.9% 91%
Aug-17 78.2% 91.0% 116.4% 86.4% 93.6% 102%
Sep-17 75.8% 97.0% 128.0% 83.3% 82.8% 99%
Source: Skymet, IMD, PL
Farmers may defer sowing in case of deficit rainfall in June: Incase of
inadequate rainfall farmers defer sowing by ~15 days and/or switch from long
duration crops to short duration crops. We expect similar pattern to recur this year
again. Hence, Kharif sowing area and production of food grains & horticulture crops
are unlikely to change materially as has been the case in FY16 & FY17 as well.

Jan-Mar’19 Earnings Preview
April 5, 2019 12
Sowing are unlikely to be impacted materially
Particulars FY15 FY16 FY17 FY18 FY19
Kharif Sowing Area (Lakh Ha) 1,049 1,027 1,039 1,073 1,052
YoY (%) -2.2% 1.2% 3.3% -1.9%
Kharif Food grain production (Mn T) 147 142 160 162 164
YoY (%) -3.7% 12.7% 1.2% 1.1%
Horticulture Production (Mn MT) 278 286 301 312 315
YoY (%) 3.1% 5.0% 3.7% 0.9%
Source: Skymet, IMD, PL
Bureau of Metrology (Australia) too upgraded ENSO Outlook from El Nino
WATCH to El Nino ALERT due to weakening of tropical pacific trade winds which
resulted in warmer water in the tropical pacific region (Americas) not flowing
towards west (Asian-Australian region). This is generating moisture in the tropical
pacific region leading to rainfall there. However, the Bureau has also cautioned that
current outlook has minimal validity for the period beyond May, and therefore
predictions for the latter months should be viewed with some caution.
Farm Distress visible as income levels flattish; Rural India has been in
focus in the past few years given that it houses more than 60% of India’s population
but accounts for ~30% of consumption demand. Although rural income has become
significantly broad based, it forms a significant part of income for small farmers (<2-
hectare land holdings) who are 80% of total farming community in India.
MSP increased 2-20% as GOI sticks to at-least 50% return over cost parameters
Rs/Quintal FY17 FY18 FY19 YoY% 5 Yr CAGR FY19 Cost of
Production Return over
Cost
Sept All India Avg
Wholesale price
Wheat 1,625 1,735 1,840 6.10% 6.10% 866 112.50% 2034*
Barley 1,325 1,410 1,440 2.10% 5.80% 860 67.40% 1901*
Gram 4,000 4,400 4,620 5.00% 9.80% 2,637 75.20% 2918*
Lentil (Masur) 3,950 4,250 4,475 5.30% 9.80% 2,532 76.70% 4707*
Rapeseed 3,700 4,000 4,200 5.00% 7.90% 2,212 89.90% 4009*
Safflower 3,700 4,100 4,945 20.60% 12.80% 3,294 50.10% 2667*
Source: Ministry of Agriculture, PL
Input Price Index of Kharif Crop
Input FY16 FY17 FY18 FY19E CAGR
Human Labour 157 165 172 179 4.5%
Bullock Labour 180 186 193 199 3.4%
Machine Labour 113 119 124 131 4.9%
Seeds 146 155 165 176 6.5%
Fertilisers 150 154 158 163 3.0%
Manures 149 154 158 163 2.9%
Agrochemicals 120 125 131 137 4.5%
Irrigation charges 106 108 109 111 1.6%
Input Price Index of Kharif 147 154 161 167 4.3%
Source: GOI, PL
Real farm income largely flat since FY2012
-
20,000
40,000
60,000
80,000
1,00,000
1,20,000
1,40,000
1,60,000
1,80,000
FY94 FY00 FY05 FY12 FY13 FY14 FY15 FY16
(Rs
bn
)
Market Price Real Price
Source: GOI, PL

Jan-Mar’19 Earnings Preview
April 5, 2019 13
GST March collections at Rs1065bn
GST collections exceed revised target: GST Collections have averaged Rs
981.1bn exceeding the revised monthly target of Rs 955.8bn (Original budgeted at
Rs1123bn/ month). FY19 budget target for compensation cess on SIN goods was
accomplished in Nov’18 itself. Unless some change in distribution of compensation
cess is coined, any significant change in compensation cess rates looks unlikely.
Strengthening systems and processes: Post implementation of E-way bills,
government has started testing efficiencies from RFID. A new return filing system
to be implemented by April’19 will have 1 return/month as against 3/month currently
where input tax credit will be claimed only to the extent it is reflected on the GST
portal. GST officers are now cautious in accepting returns and are planning a fresh
crackdown on traders evading payment by seeking new registration for their
businesses without revoking an earlier application. Plans include creating a
centralized body to address issues on contradicting litigations by different states.
Further GST rate cuts unlikely: In the past 6 months, GOI has done a slew of rate
cuts in July’18 and Dec’18 (111 items) leaving only 28 products in the 28% bracket.
GOI intends to restrict the 28% rate to super luxury and demerit goods and bring
majority of the items at 18% or lower GST rates.
Highest ever GST collection in March’19
90
7
92
2
83
3
80
8
86
7
86
3
85
2
1,0
34
.6
94
0.2
95
6.1
96
4.8
93
9.6
94
4.4
1,0
07
.1
97
6.4
94
7.3
1,0
25
.0
97
2.5
1,0
65
.8
800
850
900
950
1,000
1,050
1,100
Sep-1
7
Oct-17
Nov-
17
Dec-
17
Jan-1
8
Feb
-18
Mar-
18
Apr-
18
May-
18
Jun-1
8
Jul-18
Aug-1
8
Sep-1
8
Oct-18
Nov-
18
Dec-
18
Jan-1
9
Feb
-19
Mar-
19
GST Collections (Rs bn)
Source: GSTIN, PL
Compensation cess collections targets achieved
85.5
73.4
81.2
83.6
76.3
79.9 80.0 80.3 78.9
86.9
84.8 82.9
65.0
70.0
75.0
80.0
85.0
90.0
Apr-
18
May-
18
Jun-1
8
Jul-18
Aug-1
8
Sep-1
8
Oct-18
Nov-
18
Dec-
18
Jan-1
9
Feb
-19
Mar-
19
Compensation Cess (Rs bn)
Source: GSTIN, PL

Jan-Mar’19 Earnings Preview
April 5, 2019 14
Divestment target achieved, aggressive borrowing program to keep money supply tight
GOI has been able to achieve the divestment target of FY19 at Rs853bn buoyed
by stake sale in REC and CPSE ETF. There is likely to be a shortfall upto Rs500bn
in the personal income tax collections. Although GST collections during March2019
have been a record high, overall fiscal condition remains stretched.
Money Supply might remain tight: we expect tight money supply as 1HFY20
borrowing program of the GOI at Rs4400bn (FY10 est at Rs7100bn) is 62.3%
of the annual borrowings. In addition there is a repayment of Rs1000bn in 1H20
and while 2H repayment is Rs1440bn. First half borrowings are higher as
higher Govt borrowings in 2H might crowd out private investments in busy
season of the economy.
Farm sector is under significant pressure as below normal monsoons, poor
spatial distribution, decline in prices of several crops and sustained increase in
input costs. Given that agriculture employs ~60% of population, we expect a
mega relief package which might be on lines of the one in Telangana and
Odisha. Reports suggest that such a package could cost upto Rs1500-2300bn
which can increase fiscal deficit by 100-120bps.
Poor growth in Personal Income tax hits tax collections
Tax Revenue (Rs bn) Upto
Feb'19 Upto
Feb’18 YoY %
Budget Est
% to total Budget
Est.
Corporate Tax 4,754 4,118 15% 6,210 77%
Income Tax 3,604 3,157 14% 5,290 68%
GST 5,267 3,866 36% 7,439 71%
Customs 1,167 1,279 -9% 1,125 104%
Union Excise Duties 1,933 2,210 -13% 2,596 74%
Service Tax 66 808 -92% -
Other Tax 131 244 -46% 52 250%
Gross Tax Revenue 16,921 15,684 8% 22,712 75%
Surcharges 15 32 -53% 25 61%
Assignment to states 5,967 5,296 13% 7,881 76%
Net Tax Revenue 10,939 10,355 6% 14,806 74%
Source: CGA, PL
PSU Disinvestment target achieved
Year Target Actual
2010-11 400.0 221.4
2011-12 400.0 138.9
2012-13 300.0 239.5
2013-14 400.0 158.2
2014-15 434.2 242.8
2015-16 695.0 240.0
2016-17 560.0 349.4
2017-18 1,000.0 1,005.6
2018-19 800.0 853.1
Source: GOI, PL

Jan-Mar’19 Earnings Preview
April 5, 2019 15
Trade deficit at lowest since Sept17, aided by low crude and gold imports
FYTD Imports up 9.8%, Gold Imports decline 5.2% FYTD
-30%
-20%
-10%
0%
10%
20%
30%
40%
50%
60%
Feb'1
6
Apr'16
Jun'1
6
Aug'1
6
Oct'16
Dec'1
6
Feb'1
7
Apr'17
Jun'1
7
Aug'1
7
Oct'17
Dec'1
7
Feb'1
8
Apr'18
Jun'1
8
Aug'1
8
Oct'18
Dec'1
8
Feb'1
9
Exports growth YoY Imports growth YoY
Source: Commerce Ministry, PL
Oil imports up 32% in fiscal 19YTD, down 16.6% MOM in Feb19
-60%
-40%
-20%
0%
20%
40%
60%
80%
100%
120%
Feb'1
6
Apr'16
Jun'1
6
Aug'1
6
Oct'16
Dec'1
6
Feb'1
7
Apr'17
Jun'1
7
Aug'1
7
Oct'17
Dec'1
7
Feb'1
8
Apr'18
Jun'1
8
Aug'1
8
Oct'18
Dec'1
8
Feb'1
9
Oil imports growth
Source: Commerce Ministry, PL
Feb Trade Deficit at ~USD9.6bn down USD5bn MOM
(10)(11)
(13)(14)(13)
(11)(13)
(9)
(15)(15)(14)
(16)
(12)(14)(14)
(15)
(17)(18)(17)
(14)
(17)(17)
(13)(15)
(10)
(20.0)
(18.0)
(16.0)
(14.0)
(12.0)
(10.0)
(8.0)
(6.0)
(4.0)
(2.0)
Feb'1
7
Mar'17
Apr'17
May'1
7
Jun'1
7
Jul'17
Aug'1
7
Sep'1
7
Oct'17
Nov'1
7
Dec'1
7
Jan'1
8
Feb'1
8
Mar'18
Apr'18
May'1
8
Jun'1
8
Jul'18
Aug'1
8
Sep'1
8
Oct'18
Nov'1
8
Dec'1
8
Jan'1
9
Feb'1
9
(US
D B
n)
Trade Deficit
Source: Commerce Ministry, PL
Trade deficit during April-Feb 2019
has increased by 14% to
USD169.7bn as against USD145.5bn
in same period last year.
Gold imports are up 11% YTD even
as it has increased 64% in Nov,
indicating some buildup ahead of
marriage season in 4Q
Oil imports have increased 32% YTD
to USD97bn, higher by USD31.2bn,
imports are down 8% in Feb19 and
5.8% in Jan and Feb19
Trade deficit at ~USD9.6bn is lowest
since Sept17 led by 11% decline in
Gold Imports and 8% decline in Oil
imports, expect increase in deficit
given hardening crude prices

Jan-Mar’19 Earnings Preview
April 5, 2019 16
Benchmark rates cut 50bps since Feb: upmove in crude, bottomed out food deflation a risk
RBI has cut the repo rate by 25bps to 6.0%, reverse repo to 5.75% and bank
rate to 6.25% and it retained its stance as Neutral.
US and EU have seen slowdown in economic activity with inverted yield curve.
EU is witnessing soft domestic demand, contracting manufacturing activity and
uncertainty on Brexit
Crude prices have jumped by 36% from the bottom made in Dec on production
cuts by OPEC and Russia and impact of US sanctions on Venezuela. Crude is
also showing firm trend as 6 monthly waiver time for Iran crude exports to select
countries in coming to an end in May19.
Housing and roads led by Govt initiatives is driving growth as GFCF to GDP
has risen from 31.8% in 3Q18 to 33.1% in 3Q19. Slowdown in consumption
(public and private) has impacted GDP growth in past 3 quarters.
Manufacturing IIP has slowed down to 1.3% in Jan2019 led by Automobiles,
pharma and capital goods. Capacity utilization, however improved 75.9% in 3Q
from 74.8% in 2Q. Indicators of transport showed pressure whereas indicators
of construction like steel, cement etc showed growth.
CPI inflation inched up to 2.6% in feb after four months of decline due to lower
deflation in food and increase in prices of non-food. CPI excluding food and
fuel declined to 5.2% in January19 but increased to 5.4% in Feb.
RBI has cut inflation target to 2.4 for 4Q19, 2.9-3% in 1H20 and 3.5-3.8% in
2H20. This factors in recent increase in crude prices and lower than expected
nonfood non fuel inflation. RBI assumed normal monsoons which seems a big
task given that last two years have shown below normal monsoons.
Economic activity has slowed down in past few months, however private
consumption is expected to get a flip from public spending in rural areas and
higher disposable incomes due to lower taxes
India Benchmark Yields stabilised around 7.3-7.5% after peak of
8.215% in Oct
(100)
(50)
-
50
100
150
200
Feb
-18
Mar-
18
Apr-
18
May-
18
Jun-1
8
Jul-18
Aug-1
8
Sep-1
8
Oct-18
Nov-
18
Dec-
18
Jan-1
9
Feb
-19
Mar-
19
Wkly Chg Mnthly Chg Qtrly Chg
Half Yearly Chg Yrly Chg
Source: Bloomberg, PL

Jan-Mar’19 Earnings Preview
April 5, 2019 17
Crude Import bill up USD30bn in 11MFY19
83
87
109
129
47
51
70
59
297
297
356
335
175
181
189
147
47.5 49.0
57.6
69.8
50.9
63.8
74.9
64.6
-
10.0
20.0
30.0
40.0
50.0
60.0
70.0
80.0
-
50
100
150
200
250
300
350
400
FY16 FY17 FY18 11MFY19 H1FY18 5M2H18 H1FY19 5M2H19
Oil Imports Non-Oil Imports Crude Oil (US$ / bbl)
Source: Commerce Ministry, PL
CAD dips to 2.5% of GDP on benign crude prices
1.2
%
1.7
%
1.3
%
0.1
%
0.1
%
0.6
%
1.4
%
0.6
%
2.5
%
1.1
%
2.1
%
1.9
%
2.4
%
2.6
%
2.5
%
62.1
50.2 43.3
34.5
46.0 45.8 50.1
54.0 50.1 51.7
61.4 67.0
74.6 75.3
67.7
-
10.0
20.0
30.0
40.0
50.0
60.0
70.0
80.0
0.0%
0.5%
1.0%
1.5%
2.0%
2.5%
3.0%
CAD as % of GDP Crude Oil (US$ / bbl)
Source: RBI, PL
Food Deflation coming down, fuel and light inflation benign
2.1
1.2
-2.6
-0.8
-4.0
-2.0
-
2.0
4.0
6.0
8.0
10.0
12.0
Jan-1
4
Apr-
14
Jul-14
Oct-14
Jan-1
5
Apr-
15
Jul-15
Oct-15
Jan-1
6
Apr-
16
Jul-16
Oct-16
Jan-1
7
Apr-
17
Jul-17
Oct-17
Jan-1
8
Apr-
18
Jul-18
Oct-18
Jan-1
9
CPI Fuel & Light Consumer Food Price
Source: MOSPI, PL
Crude price increase has pushed up
the import bill by USD 42bn in past
two years, impact of recent softening
yet to play out
Benign crude has enabled 10%bps
decline in CAD from 2.6% to 2.5%
CPI has softened from 4.7% to 2.3%
led by food deflation of 2.6% as
against an inflation of 4.7% last year

Jan-Mar’19 Earnings Preview
April 5, 2019 18
FII’s pour in Rs444bn in 4Q, boost markets
Indian market (NIFTY) was best performing global index till August, however it
has lost ground while Russia, USA, Brazil and Japan have shown
improvement.
IT is holding fort and Metals are steady, some of favorite sectors like FMCG,
Private Banks, Consumer Durables and Auto have borne the brunt resulting in
recent sell-off in the markets.
Although Sensex and Nifty are still in the green YTD, mid-cap/ small cap
indices have been mauled up by 25% and 17% YoY.
DII net cash investments are Rs125bn in Sept (Rs572bn in YTDFY19), FII net
cash is negative Rs96bn (Rs287bn YTD Sept) while FII net debt figures are a
negative Rs105bn (Rs501bn YTD FY19). While FII had invested Rs220bn in
the equity markets in FY18, they had invested Rs1200bn in debt markets in
FY19 and Rs1000bn in 1HFY19. We believe FII outflow in debt markets relative
to huge inflows in previous year has also led to liquidity squeeze.
India is 3rd best performing market in CY18
20.2
11.6 10.1 9.4 8.6
7.5 7.1 6.7 6.6 5.4 5.3 4.6 4.4
-
5.0
10.0
15.0
20.0
25.0
Chin
a
S&
P
Hong K
ong
US
A
Austr
alia
Germ
any
Japan
FTS
E
Bra
zil
Russia
S.K
ore
a
India
Indonesia
(%)
Source: Bloomberg, PL
Durable, Banks, Realty and Oil & Gas lead recovery, Auto FMCG,
Cap Goods a drag
11.8
15.9
1.3
15.6
(4.3)(8.8)
2.1 0.3 1.5
(21.3)(17.1)
14.4 11.2 10.0 8.2
6.0 1.5 1.5
(2.3) (3.2)(6.5)
(10.9)
(25.0) (20.0) (15.0) (10.0) (5.0)
- 5.0
10.0 15.0 20.0
Realit
y
Consum
er D
ura
ble
Oil &
Gas
Bankex IT
Health C
are
Pow
er
FM
CG
Capital G
oods
Meta
l
Auto
(%)
CHG_PCT_6M CHG_PCT_YTD
Source: Bloomberg, PL

Jan-Mar’19 Earnings Preview
April 5, 2019 19
Small Cap and Mid Cap continue to underperform
6.1 5.9 4.8 4.2 1.3
(1.3)
3.5 2.8 2.1 1.3
(4.0) (2.4)
14.4 12.1
9.8
5.8
(13.6)
(5.7)
(15.0)
(10.0)
(5.0)
-
5.0
10.0
15.0
20.0
Sensex
Nifty
BS
E-1
00
BS
E-5
00
BS
E S
mall-C
ap
BS
E M
id-C
ap
(%)
CHG_PCT_3M CHG_PCT_6M CHG_PCT_1YR
Source: Bloomberg, PL
CY19 has seen Rs444bn inflow so far
262
-219
278
-569
-735
-303
676
371 9
08
1,0
94
-119
843 1,3
39
-37
1,2
93
1,1
13
974
184
188
529
-342
444
-1,000
-500
-
500
1,000
1,500
2009
2010
2011
2012
2013
2014
2015
2016
2017
2018
YT
D2019
(Rs
bn
)
DII Net Cash FII Net Cash
Source: Bloomberg, PL
FII Debt pullout has been halted
48
489
415
362
-537
1,5
92
469
-443
1,4
85
-465
28
-1,000
-500
-
500
1,000
1,500
2,000
(Rs
bn
)
Source: Bloomberg, PL
NIFTY move backed by strong FII inflows
71.5%
17.2%
-24.9%
27.4%
5.9%
31.4%
-4.1%2.8%
28.1%
4.1% 4.6%
-40.0%
-20.0%
0.0%
20.0%
40.0%
60.0%
80.0%
-600 -400 -200
- 200 400 600 800
1,000 1,200 1,400 1,600
FII Net Cash % Nifty Chng.
Source: Company, PL
Small cap index turned positive,
however it still underperforming other
indices by 290-480bps

Jan-Mar’19 Earnings Preview
April 5, 2019 20
Key Sector Snapshots
Agri: 4Q has been a lackluster quarter for the agrochemical companies. Lower
liquidation of molecules has led to inventory piling at various pockets in India. The
sector is expected to drive growth largely alongside companies having significant
exports/international business share. Industry exports have grown by ~17.4% and
22.8% YoY in volumes and value respectively for 11MFY19. Companies have
reported volume growth mostly driven by the South American market, even though
other geographies except European region have also managed to do well.
Automobiles: For Q4FY19, we yet again anticipate a muted quarter for auto
companies in our coverage, since EBITDA/profit is expected to witness a sharp
decline of 22%/37% YoY (on a high base). Volumes for the quarter across
4Ws/2Ws/CVs have registered a decline of ~1%/2%/2% YoY respectively, due to
production cuts taken by most OEMs for inventory clearance given the continued
weak retail demand. Tractors too witnessed weak quarter wherein M&M tractor
volumes plummeted by 14% YoY. Commodity cost pressure has somewhat eased
sequentially in Q4FY19 but full benefit should come in the next quarter. With lower
operating leverage along with high discounts/incentives over Q4FY19, we expect
an EBITDA margin decline of ~245bps YoY (rise of ~50bps QoQ), resulting in net
profit fall of 37% YoY (down ~9% QoQ) in our coverage universe.
Aviation: The recent disruptions in form of partial shutdown of Mumbai airport,
grounding of Jet Airways fleet and Boeing 737 Max aircrafts has led to capacity
pangs thereby stirring up air fares. While domestic passenger traffic slowed down
for the second consecutive month in February, airlines are expected to report strong
margins & profitability on the back of yield increase due to capacity pangs and
marginal increase in ATF prices (2% YoY).
Banks: NII is expected to improve across banks on the back of steady margins,
steady loan growth and due to last year’s low base (impacted due to Feb’12
circular), however, low treasury gains may lead to lower other income. We expect
PCR to shoot up given bank’s emphasis on containing NNPA and with recent capital
infusion from Govt. Important metrics to monitor will be liabilities growth
(CASA/Retail liabilities) and change in mix. Banks would also be providing guidance
for FY20 and their strategy going forward.
Capital Goods: We expect execution momentum to continue over the next 2-3
quarters despite upcoming general elections, however order inflow, which remained
buoyant (+20% YoY in 9MFY19), could witness some slowdown in 4QFY19. We
expect order inflow to pick-up from 2QFY20 onwards post general election. For
4QFY19, we expect our capital goods coverage universe to report
revenue/EBITDA/PAT growth of 6%/11%/19%. We remain positive on the sector
due to robust order back-log & order pipeline, better execution focus and
reasonable valuations.
Cement & Metals: Cement underweight stance continues due to marginal increase
in prices and rising input costs. In Metals space, Ferrous metals continue to look
good due to strong domestic demand and likely uptick in global prices.

Jan-Mar’19 Earnings Preview
April 5, 2019 21
Consumer: Demand remains stable QoQ, with Rural and Urban demand growing
more or less at the same pace. However, rural demand witnesses sign of slowdown
as against expectations of acceleration. Prolonged winters has affected summer
portfolio of companies like Emami, Dabur etc. Competitive activities have marginally
picked up in 4Q. Input costs remain a mixed bag this quarter. Increase in margins
from this levels would be in a calibrated manner only.
Consumer Durables: Notwithstanding the extended winters, RAC inventory levels
have managed to normalize as brands offered heavy discount (~20-30%).
However, this shall have a bearing on the margins. Competitive intensity remains
high in the LED market; companies continue to innovate & focus on optimizing cost
to improve margins. Structurally Demand outlook continues to remain positive given
the low penetration levels across categories. Industry continues to focus on
providing a differentiated value proposition
Education: While for Navneet 4QFY19 is expected to be a non-event (derives 50-
55% of sales in 1Q) S Chand would be in focus as ~75-80% of the revenue accrues
in the last quarter. Though paper prices are on a rise, higher realization (passing
on cost inflation) and pre-stocking of paper inventory in advance is expected to
cushion margins.
Financial Services: Largely mirroring trends of Q3FY19, Q4FY19 should also
prove to be a sombre quarter on loans and margins with elevated funding costs but
should be offset to an extent by the improving credit costs this quarter. While
recalibration of balance sheets stands imminent for NBFCs, the risk perception
continues to hurt the earnings and multiples likewise. We like HDFC, CIFC for their
steady performance across key parameters, and remain cautiously optimistic on
SHTF from our NBFC coverage universe.
Information Technology: We saw a strong demand environment for most of the
Tier-1 & Tier-2 companies in our IT universe which will led to revenue conversion
in coming quarters. Indian IT companies have indicated strong order pipeline &
trends of increasing digital sizes was visible early in 2018 & now has picked up its
pace. US slowdown is a reality, but impact is yet to filter its way into decision making
process or budgeting cycle. Clients budgets & spends are now of 3 months-6
months’ span only, any change in external environment can create a pressure on
IT spends. We expect some pressure on EBIT margins due INR appreciation,
projects ramp-ups & continued supply side constraints. Also, we expect companies
to accelerate investments training & onsite talent despite recent INR appreciation.
We advise defensiveness & Selectivity in Indian IT Services, as valuations of most
of the large cap and midcap IT companies are at heady levels & slowdown in
US/Euro can impact on the demand environment of IT services.
Media: Radio companies are expected to report strong growth due to pick up in
political/government ad spends. Top-line will be driven by increase in utilization
from legacy and batch 1 stations as pricing environment is subdued. In the news
broadcasting space, traction is expected to be strong driven by improvement in
yields & utilization since Lok Sabha elections are around the corner. However,
competitive pressure has intensified due to launch of Republic Bharat.
Jan-Mar’19 Earnings Preview
April 5, 2019 22
Oil and Gas: Oil sector earnings are likely to be strong due to healthy marketing
margins and inventory gains by the Oil Marketing Companies (OMCs) and healthy
performance by gas players. Upstream earnings are likely to be hit by lower crude
oil prices despite stable volumes for ONGC. GAIL’s earnings are likely to be weak,
given muted LPG profitability and lower gas trading earnings. IGL, MGL and PLNG
are likely to report healthy performance during the quarter.
Pharma/Healthcare: With lower depreciation of USD vs INR, we expect limited
headwinds in sales of US sales. Emerging market (EM) sales are to be tepid as all
major EM currencies (against USD) declined further in Q4FY19. India Formulations
growth to be 11-13% vs below 10% in Q3FY19 in our coverage universe. An
increase in volume and bigger growth in price were the reason for better India
formulations growth in Q4FY19. The sector valuation remains unaffected and fails
to reflect unfavorable risk-return matrices.

Jan-Mar’19 Earnings Preview
April 5, 2019 23
Sales and EBIDTA growth (ex Oil & Gas) slows down QoQ
Aviation, Banks and IT drive sales
Source: Company, PL
Sales growth continues to soften
Source: Company, PL
Auto, Cap Goods drag EBIDTA
Source: Company, PL
QoQ improvement in EBIDTA growth
Source: Company, PL
Banks, IT & Metals drive growth, Auto & Pharma
drag
Source: Company, PL
PAT growth up QoQ
Source: Company, PL
8.7
%
19.8
%
24
.0%
22
.0%
14
.0%
14
.6%
12
.0%
11
.8%17
.6%
10
.6%
5.8
%
0.2
%
1.3
%
-6.4
%
Q4F
Y19
Q3F
Y19
Q2F
Y19
Q1F
Y19
Q4F
Y18
Q3F
Y18
Q2F
Y18
Q1F
Y18
Q4F
Y17
Q3F
Y17
Q2F
Y17
Q1F
Y17
Q4F
Y16
Q3F
Y16
All Sector - Sales
9.1%
14.4%14.8%
18.3%
12.7%13.6%11.7%
6.7%
11.0%9.2%9.8%9.6%9.2%
2.5%
Q4F
Y19
Q3F
Y19
Q2F
Y19
Q1F
Y19
Q4F
Y18
Q3F
Y18
Q2F
Y18
Q1F
Y18
Q4F
Y17
Q3F
Y17
Q2F
Y17
Q1F
Y17
Q4F
Y16
Q3F
Y16
All Sector - Sales (Excl. Oil & Gas)
13
.8%
3.0
%8.7
%
26
.3%
13
.0%
17
.5%
16
.5%
-4.5
%
11
.1%
20
.4%
23
.6%
12
.9%
4.6
%9.6
%
Q4F
Y19
Q3F
Y19
Q2F
Y19
Q1F
Y19
Q4F
Y18
Q3F
Y18
Q2F
Y18
Q1F
Y18
Q4F
Y17
Q3F
Y17
Q2F
Y17
Q1F
Y17
Q4F
Y16
Q3F
Y16
All Sector - EBITDA
13.0%
9.3%7.1%
21.0%
5.5%
13.7%13.3%
-0.1%
12.8%
19.6%21.5%
14.8%12.5%
-0.9%
Q4F
Y19
Q3F
Y19
Q2F
Y19
Q1F
Y19
Q4F
Y18
Q3F
Y18
Q2F
Y18
Q1F
Y18
Q4F
Y17
Q3F
Y17
Q2F
Y17
Q1F
Y17
Q4F
Y16
Q3F
Y16
All Sector - EBITDA (Excl. Oil & Gas)
76
.4%
4.6
%
12
.5%
17
.0%
-21
.4%1
2.2
%
13.6
%
-9.2
%
23
.9%
21
.9%
13.8
%
4.3
%
-16
.7%
1.9
%
Q4F
Y19
Q3F
Y19
Q2F
Y19
Q1F
Y19
Q4F
Y18
Q3F
Y18
Q2F
Y18
Q1F
Y18
Q4F
Y17
Q3F
Y17
Q2F
Y17
Q1F
Y17
Q4F
Y16
Q3F
Y16
All Sector - Adj. PAT
121
.2%
15.3
%
11.4
%
9.8
%
-35.2
%
7.0
%
11.5
%
-3.9
%25.4
%
22.9
%
3.1
%
0.7
%
-17
.5%
-17
.1%
Q4F
Y19
Q3F
Y19
Q2F
Y19
Q1F
Y19
Q4F
Y18
Q3F
Y18
Q2F
Y18
Q1F
Y18
Q4F
Y17
Q3F
Y17
Q2F
Y17
Q1F
Y17
Q4F
Y16
Q3F
Y16
All Sector - Adj. PAT (Excl. Oil & Gas)

Jan-Mar’19 Earnings Preview
April 5, 2019 24
NIFTY: Earnings expected to grow at 16.8% CAGR over FY19-21
Against earnings contraction of 3.8% in FY18, FY19 NIFTY EPS is expected to
increase by 8.4%. FY20 and FY21 NIFTY EPS is expected to grow by 16.9% and
16.8% to Rs553.6 and Rs646.7 which is 11.4% and 11.6% lower than consensus.
NIFTY is currently trading at 21x 1 year forward earnings which shows 16.6%
premium to long term average of 18. We note that the markets had recently gone
down to 19x earnings on rising uncertainty on election outcome, NBFC crisis and
poor demand scenario. However, decline in crude prices, rising chances of NDA
coming to power in 2019 elections and Rs444bn FII inflow have resulted in PE rising
to 21x, still below 23x achieved post 2014 victory of BJP and 25x touched in
Jan2018. MSCI India premium over Asia is at 50% is at a 10-year average of 50X.
we note that 16.8% CAGR for NIFTY for next 2 years are optimistic given that it has
given EPS CAGR of less than 6% in the past 10 years. We have already seen EPS
estimates for FY19 and FY20 being cut by 5.6% and 7.6% since Dec 2018. EPS
est for Fy21 have also seen a cut of 7.4%. Any adverse political outcome in
elections and global volatility can take P/E multiples to pre rally levels of 19x which
means strong market support at 10500 levels. Rally post a stable NDA Govt can
make markets test 24-25x earnings which gives a target of 13272-13825.
Nifty 1-yr forward PE
21.0
8.0
10.0
12.0
14.0
16.0
18.0
20.0
22.0
24.0
26.0
Apr-
09
Oct-09
Apr-
10
Oct-10
Apr-
11
Oct-11
Apr-
12
Oct-12
Apr-
13
Oct-13
Apr-
14
Oct-14
Apr-
15
Oct-15
Apr-
16
Oct-16
Apr-
17
Oct-17
Apr-
18
Oct-18
Apr-
19
10 year Avg.18.0x
Source: Bloomberg, PL
MSCI India Premium to MSCI Asia (Ex-Japan)
50%
0%
10%
20%
30%
40%
50%
60%
70%
80%
90%
100%
Apr-
09
Oct-09
Apr-
10
Oct-10
Apr-
11
Oct-11
Apr-
12
Oct-12
Apr-
13
Oct-13
Apr-
14
Oct-14
Apr-
15
Oct-15
Apr-
16
Oct-16
Apr-
17
Oct-17
Apr-
18
Oct-18
Apr-
19
10 year Avg.50%
Source: Bloomberg, PL

Jan-Mar’19 Earnings Preview
April 5, 2019 25
Nifty Valuation
Source: Company Data, Bloomberg, PL Research
Note: Telecom Nos. is Bloomberg Consensus / Sector Weightages are updated as on Apr 05, 2019
Weight-
age (%)FY18 FY19E FY20E FY21E
Weight-
age (%)FY18 FY19E FY20E FY21E
Banking & Fin. 38.8% Cement 0.9%
PER (x) 48.8 36.5 25.3 20.1 PER (x) 43.4 50.5 39.1 31.7
PAT Grow th (%) 2.3 33.6 44.7 26.0 PAT Grow th (%) (3.4) (14.1) 29.2 23.2
Technology 13.8% Others 0.7%
PER (x) 24.1 21.1 19.1 17.3 PER (x) 14.9 10.8 8.9 7.1
PAT Grow th (%) 1.1 14.6 10.0 11.0 PAT Grow th (%) (15.4) 37.2 22.2 25.6
Oil & Gas 13.0% Media 0.5%
PER (x) 14.5 12.9 12.9 11.7 PER (x) 26.9 24.4 21.3 18.5
PAT Grow th (%) 2.0 12.4 0.1 10.1 PAT Grow th (%) (33.4) 10.4 14.6 15.1
Consumer 11.2% Ports & Logistics 0.6%
PER (x) 49.9 44.4 38.1 33.1 PER (x) 10.8 10.3 8.7 7.5
PAT Grow th (%) 14.3 12.3 16.6 15.1 PAT Grow th (%) (6.1) 5.0 19.2 15.4
Auto 6.3% Agro Chemicals 0.7%
PER (x) 20.0 26.0 22.5 18.7 PER (x) 20.4 16.7 14.8 13.1
PAT Grow th (%) (7.3) (22.8) 15.6 19.9 PAT Grow th (%) 7.7 22.6 12.7 12.6
Eng. & Power 5.8% Nifty as on Apr 05 11,598
PER (x) 16.4 14.6 13.0 11.4 EPS (Rs) - Free Float 436.8 473.6 553.6 646.7
PAT Grow th (%) 7.8 12.1 12.9 13.5 Growth (%) (3.6) 8.4 16.9 16.8
PER (x) 26.6 24.5 21.0 17.9
Metals 3.7%
PER (x) 13.6 8.5 8.5 8.2 EPS (Rs) - Free Float - Nifty Cons. 436.8 497.6 625.1 731.4
PAT Grow th (%) 15.5 59.2 0.1 3.4 Var. (PLe v/s Cons.) (%) - (4.8) (11.4) (11.6)
Pharma 2.4% Sensex as on Apr 05 38,862
PER (x) 43.2 31.1 23.3 21.6 EPS (Rs) - Free Float 1,380.8 1,456.8 1,753.7 2,073.7
PAT Grow th (%) (50.0) 39.0 33.8 7.6 Growth (%) (10.7) 5.5 20.4 18.2
PER (x) 28.1 26.7 22.2 18.7
Telecom 1.6%
PER (x) 55.9 114.6 208.1 67.6 EPS (Rs) - Free Float - Sensex Cons. 1,380.8 1,518.7 1,969.9 2,339.2
PAT Grow th (%) (45.1) (51.2) (45.0) 207.9 Var. (PLe v/s Cons.) (%) - (4.1) (11.0) (11.4)

Jan-Mar’19 Earnings Preview
April 5, 2019 26
Top Picks
2020E 2021E 2020E 2021E 2020E 2021E 2020E 2021E 2020E 2021E 2020E 2021E
Large Cap
HDFCB IN HDFC Bank 2,306 2,371 2.8% 6,270.0 90,673.1 20.2 20.6 18.5 21.1 16.1 17.1 1.8 1.9 24.7 20.4 3.9 3.4
HUVR IN Hindustan Unilever 1,659 1,854 11.8% 3,583.7 51,824.4 11.2 11.4 15.5 14.4 99.3 112.1 131.8 149.1 50.9 44.5 50.2 49.2
ICICIBC IN ICICI Bank 391 427 9.3% 2,515.9 36,383.8 15.7 15.5 145.7 36.0 9.1 11.3 1.0 1.2 24.8 18.2 2.7 2.4
MSIL IN Maruti Suzuki 7,108 7,600 6.9% 2,146.5 31,041.6 9.3 8.7 10.6 12.2 17.6 17.6 19.9 19.9 24.8 22.1 4.1 3.7
LT IN Larsen & Toubro 1,374 1,728 25.8% 1,925.2 27,840.6 13.9 NA 19.5 NA 16.2 NA 9.6 NA 18.3 NA 2.8 NA
TTAN IN Titan Company 1,106 1,195 8.0% 982.3 14,204.8 19.8 20.1 26.5 26.5 28.0 28.9 37.2 38.3 49.7 39.3 12.7 10.3
TECHM IN Tech Mahindra 777 886 14.0% 690.0 9,978.4 9.5 9.3 12.7 9.0 21.5 19.9 24.5 23.2 14.3 13.1 2.8 2.4
TATA IN Tata Steel 549 652 18.7% 660.9 9,557.9 8.2 1.0 0.7 3.3 8.7 8.4 10.2 10.1 8.2 7.9 0.7 0.6
UPLL IN UPL 941 975 3.6% 479.9 6,940.1 9.1 8.5 12.7 12.6 25.5 25.0 20.3 21.4 17.8 15.8 4.4 3.6
PLNG IN Petronet LNG 239 306 28.3% 357.8 5,173.5 8.6 8.9 20.5 15.2 23.8 22.8 30.2 27.5 12.5 10.8 2.7 2.3
Mid Caps
SHTF IN Shriram Transport Finance 1,224 1,562 27.7% 277.7 4,015.5 21.8 16.3 26.2 14.6 17.0 16.5 2.4 2.3 9.1 7.9 1.4 1.2
AL IN Ashok Leyland 88 103 17.5% 256.9 3,714.4 11.4 (1.1) 11.7 (9.0) 22.3 19.0 13.4 11.2 13.0 14.3 2.7 2.7
IDFCFB IN IDFC First Bank 54 60 10.7% 213.7 3,090.9 54.3 27.3 (145.7) 39.3 4.2 5.6 0.4 0.5 32.5 23.3 1.4 1.3
LTTS IN L&T Technology Services 1,609 1,807 12.3% 164.9 2,384.6 17.4 17.9 7.8 15.9 30.0 29.1 36.3 35.2 21.0 18.2 5.8 4.9
CROMPTON IN Crompton Greaves Consumer Electricals232 272 17.3% 145.2 2,099.3 15.3 14.0 22.0 18.0 38.6 35.4 43.6 46.7 31.8 26.9 10.8 8.5
Small Caps
KPP IN Kalpataru Power Transmission 460 547 19.0% 70.6 1,020.7 14.5 17.3 15.0 20.8 13.6 14.5 18.4 19.5 15.6 12.9 2.0 1.8
VIP IN V.I.P. Industries 477 579 21.5% 67.4 974.3 22.2 21.9 32.1 29.2 26.6 27.8 38.2 40.0 35.1 27.2 9.3 7.6
HEIM IN Heidelberg Cement India 182 214 18.0% 41.2 595.6 4.0 5.0 2.5 1.6 17.7 16.3 20.8 20.1 18.3 18.0 3.1 2.8
NOCIL IN NOCIL 141 252 78.7% 23.2 335.4 20.8 26.0 16.2 24.5 17.8 19.4 27.0 29.4 10.4 8.4 1.7 1.5
* For Banks P/BV = P/ABV & RoCE = RoAA
PER (x) P/BV (x)*RoE (%)Upside
Mcap
(Rs bn)
RoCE (%)*CMP (Rs.) TP (Rs)
Revenue Gr. (%) Earnings Gr. (%)Mcap
(US$ m)
Bloomberg
Code

Jan-Mar’19 Earnings Preview
April 5, 2019 27
SECTORS

April 5, 2019 88
April 5, 2019
Top Picks
PI Industries
UPL
Dhanuka Agritech
Insecticide India
Prashant Biyani
[email protected] | 91-22-66322260
Agro Chemicals
Jan-Mar’19 Earnings Preview
Q4 generally is a slow moving quarter for the agrochemical companies as
placement for the Rabi season happens mostly in Q3. At the fag-end of March,
placement for the Kharif season starts for few geographies. Overall, 4Q has been
a lacklustre quarter for the agrochemical companies. The sector is expected to drive
growth largely alongside companies having significant exports/international
business share. Industry exports have grown by ~17.4% and 22.8% YoY in volumes
and value respectively for 11MFY19.
Rabi sowing for FY19 has been down by 4.0% to 618 lakh hectares led by
15%/14%/10% decline in sowing of Coarse Cereals, Rice and Maize. Pulses
acreage is down by 6% while it continues to remain the same for Wheat as per last
year.
The key factors contributing towards the tepid demand are; Lower Rabi sowing,
extended winter & pleasant weather conditions causing low pest infestation, deficit
rainfall in South India & prolonged effect of draught in various parts of India and
pressure on farm income. Lower liquidation of molecules has led to inventory piling
at various pockets in India. Channel inventory is expected to be higher by 10% after
the end of Rabi season. At other places carry forward stock of Kharif is also being
liquidated.
Last year, the global macroeconomic set up for the agrochemical industry has been
quiet decent. Companies have reported volume growth mostly driven by the South
American market, even though other geographies except European region have
also managed to do well. Europe & Australia had witnessed severe draught last
year and Brazil had also seen dry weather towards the end of calendar year, which
impacted their crop yields.
Outlook
As we enter into the Kharif season - monsoon, pest infestation and crop prices
would be the key factors to monitor. Also, Investment support by various state
governments and Central government in the form of cash credit is expected to give
a fillip to the agri-inputs industry in future.
Improving availability and reduction in raw material prices is expected to ease
pressure on EBITDA margins. However, the recent blast in China’s Jiangsu
province can once again cause disruptions in the medium term supply as the
government may increase further inspections. But the same is unlikely to impact
the availability of agrochemicals for the upcoming Kharif season.
While the Bureau of Metrology (Australia) has upgraded the El Nino’s outlook to El
Nino ALERT, the validity of the same beyond May is minimal. Indian Ocean Dipole
(IOD) is also expected to turn positive (currently neutral) from June. Hence it would
be too early to assess the impact of monsoon.

Agro Chemicals
April 5, 2019 29
Q4FY19 Result Preview
Company Name Q4FY19E Q4FY18 YoY gr.
(%) Q3FY19
QoQ gr. (%)
Remark
Bayer Cropscience
Sales 3,152 3,002 5.0 6,210 (49.2) We expect Bayer to report mid-single digit revenue growth of ~5% on the back of lower pest infestation and pleasant weather. Incremental revenue is expected to have been driven by exports. Gross margins may continue to expand (exp 120 bps YoY improvement) on the back of benefits from internal sourcing from the parent and price hikes on select products.
EBITDA 3 -163 (101.9) 466 (99.3)
Margin (%) 0.1 -5.4 7.5
Adj. PAT -37 -129 (71.6) 275 (113.3)
Dhanuka Agritech
Sales 1,805 1,851 (2.5) 2,168 (16.8) Revenue decline of ~2.5% will be led by ~5.0% decline in volume. Incremental pressure on gross margin is expected to reduce with 150 bps decline to 43.6%. EBITDA is expected to decline by 7.2% to Rs 292 mn due to impact of negative operating leverage. Margins are expected to contract by 81 bps to 16.2%.
EBITDA 292 314 (7.2) 215 35.9
Margin (%) 16.2 17.0 9.9
Adj. PAT 254 286 (11.5) 146 73.9
Insecticides India
Sales 1,964 1,689 16.2 2,157 (9.0) New launches will continue to drive growth for Insecticides India. Gross margin is expected to expand by 69 bps to driven by higher realisation for Phorate & DDVP and better profitability on new products. Incremental expansion in EBITDA margin will be contained to 34 bps (@ 11.4%) due to high base last year. Interest cost is expected to increase by 25% YoY as working capital is expected to have been increased on YoY basis.
EBITDA 224 187 19.8 320 (30.0)
Margin (%) 11.4 11.0 14.8
Adj. PAT 98 77 27.1 168 (41.9)
P.I. Industries
Sales 7,960 6,251 27.3 7,075 12.5 Blended topline growth of 27.3% would be driven by 27.0% growth in the CSM business and 13.1% growth in the domestic business. Gross margin is expected to contract by 60 bps to 47.8%. Employee cost and Other expenses are expected to contract by 46 bps & 40 bps to 10.5% & 15.5% of sales respectively.
EBITDA 1,737 1,347 29.0 1,486 16.9
Margin (%) 21.8 21.5 21.0
Adj. PAT 1,294 1,054 22.7 1,073 20.6
Rallis India
Sales 3,896 3,711 5.0 4,174 (6.6) Consolidated revenue is expected to grow by 5.0% driven largely by the standalone business. Gross margin pressure is expected to ease marginally on the back of improvement in supply and reduction in price of raw materials. Standalone EBITDA is expected to grow by 7.9% YoY to Rs 461 mn YoY while margins are expected to expand by 33 bps to 12.6%. 4Q is off-season for Metahelix and the company may continue to report EBITDA loss.
EBITDA 363 336 8.1 276 31.7
Margin (%) 9.3 9.1 6.6
Adj. PAT 220 198 11.3 139 59.0
Sharda Cropchem
Sales 8,823 7,687 14.8 4,714 87.1 Agrochemical segment revenue is expected to grow 13.4% to Rs 7.9 bn led by 30% & 10% growth in NAFTA & European region. Despite garnering registrations in Q3FY19, Sharda is unlikely to see healthy revenue growth in the European region due to tepid demand and some molecule specific issues. LatAM may continue to see sharp decline in revenue due to dollar availability issues in Argentina. Belts segment is expected to grow at ~30.0% YoY. Gross margins are likely to contract by 130 bps to 33.4% due to lower sales in the European region (high margin geography).
EBITDA 2,138 1,975 8.2 473 352.0
Margin (%) 24.2 25.7 10.0
Adj. PAT 1,295 1,176 10.1 201 543.1
UPL
Sales 90,064 56,910 58.3 49,210 83.0 Q4FY19 nos of UPLL will not be comparable YoY as the company will consolidate ~2 month financials of Arysta for the first time. For UPL group we expect 7.5% YoY revenue growth to Rs 61 bn. India, LatAM and North America are likely to show tepid mid-single digit growth while Europe and RoW are expected to grow in double digits. Arysta is expected to clock revenue of Rs 28.9 bn (US $ 410 mn). For UPL group we expect ~60 bps reduction in gross margin but on a consolidated level it is expected to largely remain unchanged at 50.9%. At Consolidated EBITDA of Rs 19 bn, we expect EBITDA margins to contract by ~30 bps to 21.1% on the back of higher other expenses.
EBITDA 19,035 12,180 56.3 10,160 87.3
Margin (%) 21.1 21.4 20.6
Adj. PAT 10,359 7,650 35.4 6,310 64.2
Source: Company, PL

Agro Chemicals
April 5, 2019 30
Valuation Summary
Company Names Rating CMP (Rs)
TP (Rs) Sales (Rs bn) EBITDA (Rs bnm) PAT (Rs bn) EPS (Rs) RoE (%) PE (x)
FY18 FY19E FY20E FY21E FY18 FY19E FY20E FY21E FY18 FY19E FY20E FY21E FY18 FY19E FY20E FY21E FY18 FY19E FY20E FY21E FY18 FY19E FY20E FY21E
Bayer Cropscience Acc 4,240 4,517 27.1 28.5 31.0 34.4 4.1 4.8 5.5 6.4 2.7 3.1 3.7 4.4 77.8 90.3 107.8 129.2 13.9 16.4 17.2 18.0 54.5 46.9 39.3 32.8
Dhanuka Agritech Buy 388 624 9.6 10.3 11.4 12.5 1.7 1.6 2.0 2.2 1.3 1.2 1.5 1.6 25.7 25.5 30.8 34.7 21.8 19.1 21.3 20.7 15.1 15.2 12.6 11.2
Insecticides India BUY 640 896 10.7 11.8 13.0 14.3 1.5 1.8 2.1 2.3 0.8 1.1 1.2 1.4 40.6 51.3 59.2 68.9 16.6 17.3 17.1 17.5 15.7 12.5 10.8 9.3
P.I. Industries Buy 1,052 1,023 22.8 28.3 33.9 40.4 4.9 5.8 7.3 9.0 3.7 4.2 5.1 6.1 26.6 30.3 37.1 44.5 20.8 20.1 20.8 21.0 39.6 34.8 28.3 23.7
Rallis India BUY 162 242 17.9 20.2 22.5 24.7 2.6 3.0 3.6 4.0 1.7 1.8 2.3 2.6 8.6 9.4 11.6 13.5 14.6 14.6 16.3 16.9 18.8 17.2 13.9 12.0
Sharda Cropchem BUY 387 444 17.1 19.6 22.7 25.8 3.5 3.6 4.2 4.9 1.9 1.9 2.3 2.7 21.1 21.5 25.9 29.7 18.2 16.1 17.0 17.0 18.3 18.0 14.9 13.0
UPL Buy 941 975 173.8 191.1 208.4 226.1 35.2 39.5 43.9 47.4 19.5 23.9 26.9 30.3 38.2 46.8 52.8 59.4 23.5 24.6 25.5 25.0 24.6 20.1 17.8 15.8
Source: Company, PL

April 5, 2019 31
Automobiles
Jan-Mar’19 Earnings Preview
For Q4FY19, we yet again anticipate a muted quarter for auto companies in our
coverage, since EBITDA/profit is expected to witness a sharp decline of 22%/37%
YoY (on a high base). Volumes for the quarter across 4Ws/2Ws/CVs have
registered a decline of ~1%/2%/2% YoY respectively, due to production cuts taken
by most OEMs for inventory clearance given the continued weak retail demand.
Tractors too witnessed weak quarter wherein M&M tractor volumes plummeted by
14% YoY. Commodity cost pressure has somewhat eased sequentially in Q4FY19
but full benefit should come in the next quarter. With lower operating leverage along
with high discounts/incentives over Q4FY19, we expect an EBITDA margin decline
of ~245bps YoY (rise of ~50bps QoQ), resulting in net profit fall of 37% YoY (down
~9% QoQ) in our coverage universe. Revenue growth of companies under our
coverage (excluding Tata Motors) is expected to be ~2% YoY with EBITDA margin
likely to decrease by ~170bps YoY.
Commodity pressures easing should help margins inch up sequentially: With
low commodity costs QoQ (Steel / Aluminium down ~11%/6% QoQ assuming a 2-
month inventory lag), we expect OEM EBITDA margins to inch up by ~50bps QoQ.
However, YoY margins are expected to be lower ~270bps on account of (1) higher
discounts, consumer offers & dealer incentives across segments and (2) negative
operating leverage.
Weak consumer sentiment continues to hamper volume growth: With 2Ws
seeing the maximum impact of the slowdown in demand leading to huge inventory
built-ups, we expect EBITDA of Hero/Eicher to decline by ~24%/11% YoY, owing
to their volume decline of ~11%/13% YoY. On the other hand, TVS is expected to
see a YoY rise in OPM on the back of operating leverage benefits. In the 4Ws
segment, we expect Maruti margins to be lower by 220bps YoY (owing to high
discounts) but up by 220bps QoQ given volume growth of 7% QoQ. However, M&M
is likely to report weakest operating performance with margins slipping 320bps
YoY/160bps QoQ given the adverse product mix as well as one-time launch costs.
Diversified revenue mix cushions ancillaries against low OEM demand: For
most of the Auto ancillary suppliers, we expect some benefits to come in from the
diversified revenue mix (aftermarket, exports & industrial segments) which should
help revenue growth, despite the OEM demand slowdown. We, therefore expect
revenue growth of ~9.5% YoY for ancillaries under our coverage while their EBITDA
is expected to grow ~4% YoY (+8% QoQ).
Two & Three-wheeler companies
Volume (units) Q4FY19 YoY gr. (%) QoQ gr. (%)
Total 4,090,612 -2.0 -3.9
Hero Motocorp 1,781,250 -11.0 -1.0
Bajaj Auto 1,193,590 14.2 -5.3
TVS Motors 907,328 2.0 -8.3
Royal Enfield 196,162 -13.6 0.9
Atul Auto 12,282 5.7 -11.1
Source: Company, PL
April 5, 2019
Top Picks
Maruti Suzuki
Mahindra & Mahindra
Poorvi Banka
[email protected] | 91-22-66322426

Automobiles
April 5, 2019 32
Four-wheeler companies
Volume (units) Q4FY19 YoY gr. (%) QoQ gr. (%)
Total 1,113,182 -2.8 8.6
Tata Motors (Standalone) 193,015 -5.4 12.4
Jaguar Land Rover 145,598 -10.3 12.0
Maruti Suzuki 458,481 -0.7 7.0
M&M 235,557 -0.1 0.7
Ashok Leyland 59,521 1.3 36.0
VECV 21,010 -9.1 24.1
Source: Company, PL
Q4FY19 Result Preview
Company Name Q4FY19E Q4FY18 YoY gr.
(%) Q3FY19
QoQ gr. (%)
Remark
Ashok Leyland
Sales 86,232 87,725 -1.7 63,252 36.3 Despite the high base, AL reported a 1% YoY growth in volumes this quarter while they were up a strong 36% QoQ. Anticipating realisations to decline by 3% YoY, we expect revenues to dip ~2% YoY and margins to contract by 30bps YoY given the continued discounting (up 120bps QoQ on account of some commodity price relief & higher operating leverage).
EBITDA 9,917 10,327 (4.0) 6,496 52.7
Margin (%) 11.5 11.8 10.3
Adj. PAT 6,556 6,615 (0.9) 3,879 69.0
Bharat Forge
Sales 16,921 14,666 15.4 16,925 (0.0) With user industries like North America trucks as well as domestic MHCVs lower YoY, we expect shipment tonnage to rise by a modest 5% YoY in Q4FY19E. Overall revenue for Bharat Forge is expected to increase by 15.4% YoY and EBITDA margin is expected at 29.3%, up 80bps YoY but lower 180bps QoQ (although up 50bps QoQ v/s adjusted Q3FY19 margins).
EBITDA 4,949 4,177 18.5 5,258 (5.9)
Margin (%) 29.3 28.5 31.1
Adj. PAT 2,697 1,003 168.8 3,098 (13.0)
Bajaj Auto
Sales 74,688 67,733 10.3 74,094 0.8 Given the weak industry demand, BJAUT's overall volume growth over Q4FY19 has been decent at 14.2% YoY (down 5.3% QoQ). Product mix has been favourable sequentially (adverse YoY) with higher share of 3Ws (at 16.1% v/s 14.4%), however, overall exports are at 40.3% of total volumes over Q4FY19 against 41.6% in Q3FY19 / 40.7% in Q4FY18. We expect margins to decline 310bps YoY but inch up 50bps QoQ.
EBITDA 12,019 13,152 (8.6) 11,561 4.0
Margin (%) 16.1 19.4 15.6
Adj. PAT 10,484 10,799 (2.9) 11,019 (4.9)
CEAT
Sales 17,366 16,739 3.8 17,139 1.3 Owing to the weak OEM demand, Ceat is expected to report a modest 2.5% YoY growth in its sales tonnage over Q4FY19. Expecting realisation improvement of 1.5% YoY, we anticipate the standalone revenues to grow ~3% YoY to Rs16.9bn. With rubber prices as well as crude level lower QoQ (~6%/7% respectively), we expect consol EBITDA margin to be at 10.5%, down 130bps YoY but higher 220bps QoQ.
EBITDA 1,823 1,976 (7.7) 1,426 27.9
Margin (%) 10.5 11.8 8.3
Adj. PAT 714 1,012 (29.4) 517 38.0
Eicher Motors
Sales 24,052 25,280 -4.9 23,411 2.7 Royal Enfield's Q4FY19 volumes have recorded a de-growth yet again, down a sharp 13.6% YoY (up 1% QoQ) to 196K units, while VECV volumes were lower 9% YoY (up 24% QoQ) to 21K units. We expect EIM to report consolidated revenue dip of ~5% YoY to Rs24bn, with EBITDA margin slipping to 29.5%, lower 200bps YoY (lower operating leverage)/ higher 50bps QoQ (commodity pressures easing sequentially, better product mix).
EBITDA 7,095 7,972 (11.0) 6,795 4.4
Margin (%) 29.5 31.5 29.0
Adj. PAT 5,351 6,486 (17.5) 5,330 0.4

Automobiles
April 5, 2019 33
Company Name Q4FY19E Q4FY18 YoY gr.
(%) Q3FY19
QoQ gr. (%)
Remark
Exide Industries
Sales 26,439 24,594 7.5 24,968 5.9 We expect Exide Industries to record a moderate revenue growth of 7.5% YoY / 6% QoQ on account of dip in OEM demand but some support from the Automotive replacement segment as well as the industrial segment (telecom / inverter). With lead prices softening (down 3% QoQ assuming a 2 month inventory lag), our EBITDA margin expectation is at 13.5%, higher 100bps QoQ but dipping 20bps YoY.
EBITDA 3,569 3,380 5.6 3,125 14.2
Margin (%) 13.5 13.7 12.5
Adj. PAT 2,009 1,896 6.0 1,550 29.6
Hero Motocorp
Sales 75,451 85,640 -11.9 78,648 (4.1) With volume decline of 11% YoY (-1% QoQ) and expected realisation dip of ~1% YoY over Q4FY19, revenue is likely to decline ~12% YoY. Operating margins are expected to contract 230bps YoY / 30bps QoQ (high discounts/dealer incentives for inventory clearance, volume decline).
EBITDA 10,375 13,706 (24.3) 11,048 (6.1)
Margin (%) 13.7 16.0 14.0
Adj. PAT 7,228 9,674 (25.3) 7,691 (6.0)
Mahindra & Mahindra
Sales 129,570 133,079 -2.6 130,704 (0.9) M&M’s overall volumes for Q4FY19 were flat YoY & QoQ, however, tractors degrew ~14% YoY (auto vol up 5.7% YoY), forming ~26% of total volumes (v/s 30% in Q4FY18 & 39% in Q3FY19). Resultantly, we expect M&M’s standalone revenues to dip ~3% YoY and margin to slip to 10%, lower 320bps YoY / 160bps QoQ on account of weak segmental mix, higher share of low margin new UV launches & high one-time XUV3oo launch costs.
EBITDA 12,957 17,542 (26.1) 15,172 (14.6)
Margin (%) 10.0 13.2 11.6
Adj. PAT 7,874 10,112 (22.1) 11,568 (31.9)
Maruti Suzuki
Sales 213,150 211,656 0.7 196,683 8.4 MSIL volumes dipped 0.7% YoY (up 7% QoQ). Expecting realisaitons to inch up ~1% YoY/2% QoQ on account of better product mix with higher share of new launches (Ertiga/WagonR), we expect MSIL to report revenue growth of ~1% YoY/8% QoQ. With discounts being lower QoQ (higher YoY) and slight QoQ commodity relief, we expect margins to be at ~12%, up 220bps QoQ but lower 220bps YoY .
EBITDA 25,578 30,150 (15.2) 19,311 32.5
Margin (%) 12.0 14.2 9.8
Adj. PAT 16,744 18,821 (11.0) 14,893 12.4
Motherson Sumi Systems
Sales 170,370 154,078 10.6 164,730 3.4 For Q4FY19, we expect MSS to record a 10.6% YoY revenue growth to Rs170bn. We expect consolidated EBITDA margin of 9% (up 50bps QoQ but lower 70bps YoY). SMR / SMP revenue growth & margins are likely to be 5%/10% (SMR growth to be supported by Reydel business) & 11.8%/6.1%, respectively (ramp up costs to again hamper SMP margins).
EBITDA 15,333 15,001 2.2 13,934 10.0
Margin (%) 9.0 9.7 8.5
Adj. PAT 8,805 5,390 63.4 3,891 126.3
Tata Motors
Sales 809,282 912,791 -11.3 770,009 5.1 Standalone domestic volumes over Q4FY19 were down 5% YoY but higher ~12% QoQ. With continued high discounting in the industry but some sequential commodity relief, we expect standalone margins to be at 9.2%, down 330bps YoY but up 50bps QoQ. JLR’s Q4FY19E volumes are expected to be down 10% YoY but up ~12% QoQ (Q4 seasonally the best quarter for JLR), with margins at 8.8%, higher 150bps QoQ (down 350bps YoY).
EBITDA 79,018 119,252 (33.7) 71,733 10.2
Margin (%) 9.8 13.1 9.3
Adj. PAT -3,178 34,098 (109.3) 8,506 (137.4)
TVS Motors
Sales 42,890 39,928 7.4 46,640 (8.0) With ~2% YoY volume growth (lower 8% QoQ) and ~5% YoY realisation improvement expected (higher share of exports as well as mopeds in the product mix, price hike taken), TVS Motors' Q4FY19 revenue is expected to grow ~7% YoY. On the back of operating leverage and some currency benefit, we expect margins to expand 130bps YoY. With better product mix & some commodity cost relief, we expect OPM to inch up 20bps QoQ too.
EBITDA 3,538 2,807 26.1 3,757 (5.8)
Margin (%) 8.3 7.0 8.1
Adj. PAT 1,601 1,656 (3.3) 1,784 (10.2)
Wabco India
Sales 7,524 7,849 -4.1 6,999 7.5 Given the decline in the domestic M&HCV sector (down ~15% YoY, up ~20% QoQ), expecting weaker realisations, Wabco India's Q4FY19 revenue is likely to decline 4% YoY. Operating margins are expected to be higher 50bps YoY / 40bps QoQ on account of commodity cost relief.
EBITDA 1,110 1,122 (1.1) 1,005 10.5
Margin (%) 14.8 14.3 14.4
Adj. PAT 755 772 (2.2) 598 26.3
Source: Company, PL

Automobiles
April 5, 2019 34
Valuation Summary
Company Names Rating CMP (Rs)
TP (Rs) Sales (Rs bn) EBITDA (Rs bn) PAT (Rs bn) EPS (Rs) RoE (%) PE (x)
FY18 FY19E FY20E FY21E FY18 FY19E FY20E FY21E FY18 FY19E FY20E FY21E FY18 FY19E FY20E FY21E FY18 FY19E FY20E FY21E FY18 FY19E FY20E FY21E
Ashok Leyland BUY 88 103 262.5 291.7 325.0 321.3 27.4 30.7 34.4 32.1 15.6 17.7 19.7 17.9 5.3 6.0 6.7 6.1 23.5 22.9 22.3 19.0 16.4 14.5 13.0 14.3
Bharat Forge HOLD 512 504 81.7 96.8 103.9 109.9 17.6 21.8 22.7 23.4 9.4 12.6 13.4 13.9 20.2 27.0 28.8 30.0 21.2 24.5 22.9 20.9 25.4 19.0 17.8 17.1
Bajaj Auto Reduce 2,862 2,362 251.6 286.5 301.2 316.7 47.8 47.4 50.1 52.8 40.9 40.8 43.3 44.5 141.4 141.1 149.7 153.8 22.6 20.2 19.2 17.8 20.2 20.3 19.1 18.6
CEAT Acc 1,124 1,178 62.3 66.7 78.7 94.2 6.1 6.6 7.7 9.4 2.7 2.9 3.1 3.3 67.2 72.3 75.8 81.3 10.8 10.8 10.5 10.4 16.7 15.6 14.8 13.8
Eicher Motors HOLD 20,980 20,021 89.6 99.0 105.7 111.8 28.1 29.3 31.7 32.9 21.8 23.2 25.2 26.6 799.6 850.2 925.0 977.0 35.2 29.7 26.9 24.4 26.2 24.7 22.7 21.5
Exide Industries Acc 219 238 91.9 105.2 119.1 124.6 12.4 13.7 15.7 16.6 7.1 7.7 9.0 9.5 8.4 9.0 10.6 11.2 13.7 13.6 14.5 13.9 26.2 24.3 20.6 19.5
Hero Motocorp Acc 2,618 2,947 322.3 339.3 364.7 383.6 52.8 50.4 54.3 57.4 37.0 33.4 35.9 37.7 185.1 167.4 179.6 188.8 33.8 27.0 26.3 25.1 14.1 15.6 14.6 13.9
Mahindra & Mahindra BUY 658 878 486.9 548.5 609.6 668.6 62.2 70.0 79.3 87.3 39.2 48.8 54.7 61.4 33.0 41.0 46.0 51.6 13.7 15.6 16.3 16.9 20.0 16.1 14.3 12.7
Maruti Suzuki BUY 7,108 7,600 797.6 868.7 949.7 1,032.5 120.6 116.5 128.7 142.0 78.2 78.3 86.6 97.1 259.0 259.2 286.7 321.5 20.0 17.8 17.6 17.6 27.4 27.4 24.8 22.1
Motherson Sumi Systems ACC 151 150 562.9 527.3 643.6 696.2 51.2 46.1 61.4 66.8 14.2 14.3 25.8 28.2 6.7 4.5 8.2 8.9 15.6 14.2 23.6 23.0 22.4 33.4 18.5 16.9
Tata Motors BUY 205 207 2,946.2 2,986.6 3,257.5 3,538.7 369.7 283.7 349.8 395.8 58.3 -12.1 0.9 27.6 17.2 -3.6 0.3 8.1 7.6 -1.3 0.1 2.9 12.0 -57.7 808.6 25.2
TVS Motors Acc 485 665 151.3 181.3 214.0 251.9 11.3 15.3 19.7 24.0 6.6 8.9 11.6 14.7 13.9 18.7 24.5 30.9 25.1 27.3 28.5 28.2 34.8 26.0 19.8 15.7
Wabco India ACC 6,326 7,111 25.7 29.8 34.1 37.0 3.9 4.6 5.5 5.9 2.7 3.3 3.9 4.2 143.8 175.4 203.2 221.8 19.5 19.8 19.1 17.5 44.0 36.1 31.1 28.5
Source: Company, PL

April 5, 2019 35
April 5, 2019
Paarth Gala
[email protected] | 91-22-66322242
Aviation
Jan-Mar’19 Earnings Preview
Capacity pangs leads to higher yields: The recent disruptions in form of partial
shutdown of Mumbai airport (6 hrs - thrice a week), grounding of Jet Airways fleet
due to financial crisis and over safety concerns of Boeing 737 Max aircrafts has led
to capacity pangs thereby stirring up air fares. While domestic passenger traffic
slowed down for the second consecutive month in February, higher yields and load
factors compensated for the loss.
Margins expected to recover: With ATF prices up by ~2% YoY for the quarter and
on the back of yield increase due to capacity pangs, we expect airlines to report
strong margins & profitability. We expect IndiGo & SJET to report EBITDAR
margins of 23.7%/20.1% respectively.
In 4Q19 ATF up by 2%
49 50 55 53 50
56 62
67 70 74
63
- 10 20 30 40 50 60 70 80
Aviation Turbine Fuel (Rs/ltr)
Source: Company, PL
IndiGo/SJET’s yield to rise by 8.5%/8.3% YoY
3.5
3.8
3.6 3.7
3.3
3.6
3.2
3.8
3.6
3.5
4.0
3.6
4.0
3.7
4.1
3.5
4.1 4.0
3.0 3.2 3.4 3.6 3.8 4.0 4.2
Yield (Rs)
IndiGo SJET
Source: Company, PL
Q4FY19 Result Preview
Company Name Q4FY19E Q4FY18 YoY gr.
(%) Q3FY19
QoQ gr. (%)
Remark
InterGlobe Aviation
Sales 80,299 57,991 38.5 79,162 1.4 With net addition of ~9 aircrafts in the quarter, IndiGo continues to lead the industry growth. Due to the recent capacity pangs in the industry, we expect IndiGo to report yield expansion (8.5% YoY) along with high load factors (88%). With ATF prices in check (up ~2% YoY), we expect IndiGo to report strong EBITDAR margins & profitability
EBITDAR 19,048 10,821 76.0 15,953 19.4
Margin (%) 23.7 18.7 20.2
Adj. PAT 3,411 1,176 189.9 1,909 78.7
SpiceJet
Sales 26,196 20,293 29.1 24,868 5.3 With deliveries ramping up only towards the end of 3Q19 (13 net additions), we expect SJET to report robust revenue growth aided by ~8.3% YoY increase in yields & high load factors (92%). With B737 Max being grounded only during the end of March, impact of grounding to be minimal in the quarter
EBITDAR 5,271 3,676 43.4 4,563 15.5
Margin (%) 20.1 18.1 18.4
Adj. PAT 1,306 462 183.1 551 137.2
Source: Company, PL

Aviation
April 5, 2019 36
Valuation Summary
Company Names Rating CMP (Rs)
TP (Rs) Sales (Rs bn) EBITDAR (Rs bn) PAT (Rs bn) EPS (Rs) RoE (%) PE (x)
FY18 FY19E FY20E FY21E FY18 FY19E FY20E FY21E FY18 FY19E FY20E FY21E FY18 FY19E FY20E FY21E FY18 FY19E FY20E FY21E FY18 FY19E FY20E FY21E
InterGlobe Aviation BUY 1,419 1,552 230.2 286.4 368.4 473.4 65.7 46.4 76.3 109.1 22.4 -0.9 15.4 31.3 58.3 -2.4 40.2 81.4 41.3 -1.3 20.3 32.3 24.3 -590.8 35.3 17.4
SpiceJet BUY 97 123 78.0 92.2 116.2 141.8 17.9 13.0 18.8 25.4 5.7 -1.8 1.7 5.6 9.5 -3.0 2.9 9.4 -173.8 134.9 -127.4 242.2 10.3 -32.6 33.8 10.3
Source: Company, PL

April 5, 2019 37
Banks
Jan-Mar’19 Earnings Preview
Banks are likely to head into a steady Q4FY19 quarter and continue to see
improvement in asset quality metrics with low stress and constant
provisioning, leading to high PCRs. Though the recent large resolutions are
not likely to reflect in Q4FY19 they should not even attract ageing provisions.
While operating wise- NII are expected to improve across banks on back of
steady margins, steady loan growth and last year’s low base (due to impact
from Feb’12 circular), lack of material treasury gains may lead to low other
income. Important metrics to monitor will be liabilities growth (CASA/Retail
liabilities) while most bank provide crucial FY20 guidance.
Loan growth has been at a steady pace for system: Overall systemic loan
growth has been at a steady rate of 14-15% YoY, although it has been skewed
towards selective sectors & segments. Also, deposit growth rate has lagged for
some time now at 9-10% YoY increasing C-D ratio to multi-year high of 78%.
Hence, banks will continue to be aggressive on deposit accretion especially
retail deposits (incl. CASA).
Asset quality for sector will continue to see improvement: Stress assets
ratios have been coming off as the unrecognized stress has been eliminated,
also discipline enforced due to Feb-12 circular along with some resolutions in
recent times would result in improvement of asset quality. Similar trends on low
stress should continue to lower the GNPAs, while continued provisions to
improve PCR will help NNPAs. We continue to watch and worry on Agri/SME
related stress which may not be as large as corporate segments but some
banks have shared certain discomfort in a last few quarters.
Margins should remain steady for most Banks, other income should be
under pressure: Adjusting to a one-off interest recoveries, NIMs are expected
to be stable (similar to Q3FY19) since banks are very selective in cutting
MCLRs across durations, while o/s weighted deposit rates also haven’t moved
up much. Bank’s other income will remain under pressure as low volatility has
limited treasury gains, whereas fee income streams have narrowed on to
regulatory and asset mix changes.
Earnings picture – Improvement in topline, relatively lower credit cost to
boost earnings: We expect coverage Bank’s NII to grow by 20% YoY on back
of lower interest reversals, steady margins and lower base in Q4FY18. NII for
both private and PSBs to grow at 23% YoY & 18% YoY respectively. Although
PPOP growth will lower at 14% YoY due to low treasury and fee pressures,
bottom line across banks will improve due to lower credit cost and
improvement in asset quality. Among private banks, we expect HDFCB/KMB
to report steady numbers, while IIB/Yes are likely to accelerate provisions. IIB
due to provisioning arising from IL&FS exposure will witness impact on bottom
line. Yes Bank commentary from new management will be very crucial.
ICICI/Axis bank should witness much better earnings than previous quarters
whereas PSBs are likely to have a profitable quarter on back of capital infusion
support from Govt. thus encouraging higher provisions .
April 5, 2019
Top Picks
HDFC Bank
ICICI Bank
Axis Bank
Pritesh Bumb
[email protected] | 91-22-66322232
Prabal Gandhi
[email protected] | 91-22-66322258
Banks
April 5, 2019 38
Q4FY19 Banks Preview:
Private Banks – Loan growth for private banks (except ICICI/Axis) are
expected to be 20-30% YoY and much above industry, while ICICI/Axis loan
growth should be near to industry growth of 13-14% YoY. It is difficult for banks
to garner CASA deposits, hence in order to stabilize the deposit base banks
have started growing its retail deposits (also benefit on LCR). Hence CASA
ratio may likely come off but continue to grow at 12-13% YoY for banks.
Although chasing deposits will increase cost of funds but banks have been very
selective in cutting MCLRs across tenure post RBI rate cut leading to stable
margins and NII growth of 23% YoY. ICICI/Axis PPOP are expected to have
low growth since base quarter of Q4FY18 had gains from ICICI Sec listing and
Axis had seen strong recovery from write off in Q3FY19, while IIB could
accelerate provisions of IL&FS to impact earnings. Yes should likely slowdown
its business growth due to low capital thresholds.
Public Sector Banks – PSBs are recovering steadily with improvement in
stress/impairment ratios and continued provisions to enhance PCR. Provisions
will continue to remain bit high due to higher write offs, while slow resolutions
are attracting ageing based provisions. We expect NII growth of 18% will
further improve (on lower base quarter), while earnings are expected be
positive considering the dipping provisions and capital infusions. SBI to see
sharp earnings recovery but we do not expect recent resolution reflecting in
Q4FY19 and should flow through in Q1FY20, while BOB to be operationally
better however the merger integration will be a key factor to watch. PNB should
benefit from stake sale of PNBHF, while BOI/Union should see steady quarter
with lower slippages and improving asset quality.
Regional/Mid-sized banks – Regional focused & mid-sized banks should
continue to be stable on all parameters with their loan growth near-to-slightly
above the industry growth. SME/Agri/Retail with region specific issues will
continue to display subdued but steady margins and hence we do not expect
any offbeat earnings skewness from their individual reporting trends. Federal
will continue to showcase strong loan growth with better NII but we will watch
SME/Agri slippages. For IDFCFBK metrics should further improve on earnings,
liabilities and loan mix. For SIB we expect earnings to be under pressure as
bank will keep high provisions and enhance PCR which is quite low, while
JKBK should continue with better loan growth, better margins and benefit from
insurance stake sale in PNB Met Life.
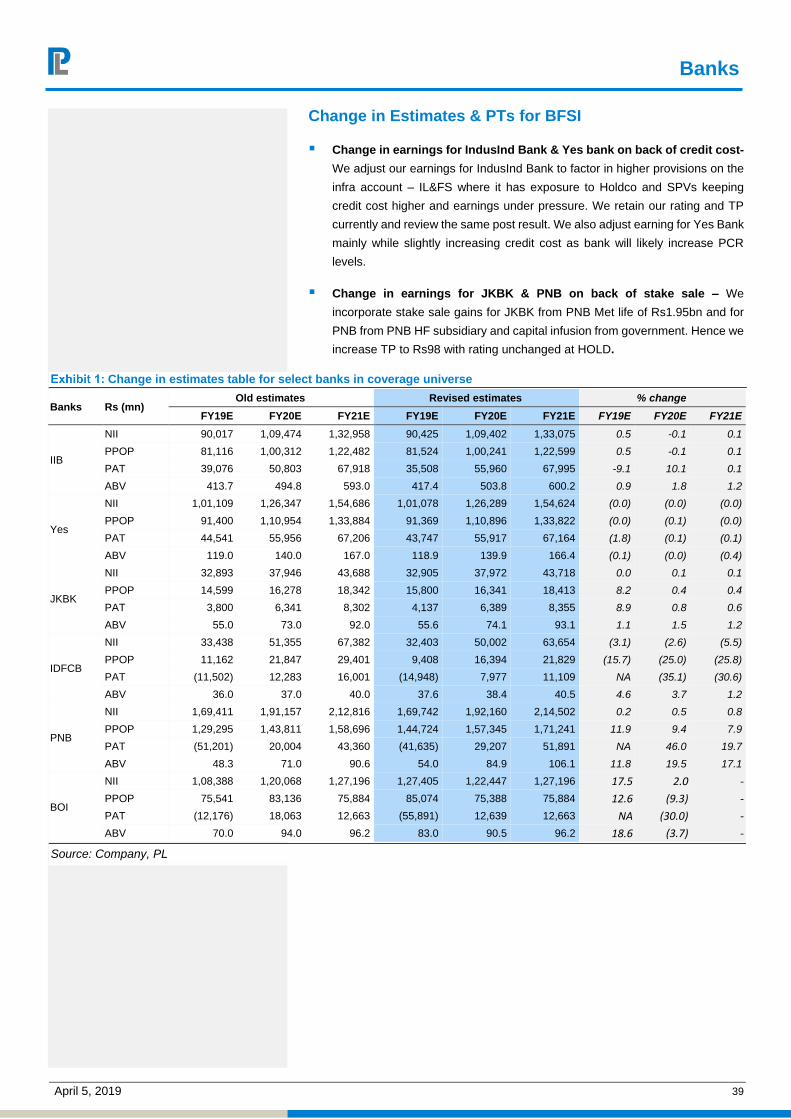
Banks
April 5, 2019 39
Change in Estimates & PTs for BFSI
Change in earnings for IndusInd Bank & Yes bank on back of credit cost-
We adjust our earnings for IndusInd Bank to factor in higher provisions on the
infra account – IL&FS where it has exposure to Holdco and SPVs keeping
credit cost higher and earnings under pressure. We retain our rating and TP
currently and review the same post result. We also adjust earning for Yes Bank
mainly while slightly increasing credit cost as bank will likely increase PCR
levels.
Change in earnings for JKBK & PNB on back of stake sale – We
incorporate stake sale gains for JKBK from PNB Met life of Rs1.95bn and for
PNB from PNB HF subsidiary and capital infusion from government. Hence we
increase TP to Rs98 with rating unchanged at HOLD.
Change in estimates table for select banks in coverage universe
Banks Rs (mn) Old estimates Revised estimates % change
FY19E FY20E FY21E FY19E FY20E FY21E FY19E FY20E FY21E
IIB
NII 90,017 1,09,474 1,32,958 90,425 1,09,402 1,33,075 0.5 -0.1 0.1
PPOP 81,116 1,00,312 1,22,482 81,524 1,00,241 1,22,599 0.5 -0.1 0.1
PAT 39,076 50,803 67,918 35,508 55,960 67,995 -9.1 10.1 0.1
ABV 413.7 494.8 593.0 417.4 503.8 600.2 0.9 1.8 1.2
Yes
NII 1,01,109 1,26,347 1,54,686 1,01,078 1,26,289 1,54,624 (0.0) (0.0) (0.0)
PPOP 91,400 1,10,954 1,33,884 91,369 1,10,896 1,33,822 (0.0) (0.1) (0.0)
PAT 44,541 55,956 67,206 43,747 55,917 67,164 (1.8) (0.1) (0.1)
ABV 119.0 140.0 167.0 118.9 139.9 166.4 (0.1) (0.0) (0.4)
JKBK
NII 32,893 37,946 43,688 32,905 37,972 43,718 0.0 0.1 0.1
PPOP 14,599 16,278 18,342 15,800 16,341 18,413 8.2 0.4 0.4
PAT 3,800 6,341 8,302 4,137 6,389 8,355 8.9 0.8 0.6
ABV 55.0 73.0 92.0 55.6 74.1 93.1 1.1 1.5 1.2
IDFCB
NII 33,438 51,355 67,382 32,403 50,002 63,654 (3.1) (2.6) (5.5)
PPOP 11,162 21,847 29,401 9,408 16,394 21,829 (15.7) (25.0) (25.8)
PAT (11,502) 12,283 16,001 (14,948) 7,977 11,109 NA (35.1) (30.6)
ABV 36.0 37.0 40.0 37.6 38.4 40.5 4.6 3.7 1.2
PNB
NII 1,69,411 1,91,157 2,12,816 1,69,742 1,92,160 2,14,502 0.2 0.5 0.8
PPOP 1,29,295 1,43,811 1,58,696 1,44,724 1,57,345 1,71,241 11.9 9.4 7.9
PAT (51,201) 20,004 43,360 (41,635) 29,207 51,891 NA 46.0 19.7
ABV 48.3 71.0 90.6 54.0 84.9 106.1 11.8 19.5 17.1
BOI
NII 1,08,388 1,20,068 1,27,196 1,27,405 1,22,447 1,27,196 17.5 2.0 -
PPOP 75,541 83,136 75,884 85,074 75,388 75,884 12.6 (9.3) -
PAT (12,176) 18,063 12,663 (55,891) 12,639 12,663 NA (30.0) -
ABV 70.0 94.0 96.2 83.0 90.5 96.2 18.6 (3.7) -
Source: Company, PL

Banks
April 5, 2019 40
Valuation Summary for PL Banks & Insurance Coverage
Coverage Universe Rating MCap (Rs B)
CMP (Rs)
Old PT (Rs)
New PT
(Rs)
Upside (%)
P/ABV (x) RoE (%)
FY19E FY20E FY21E FY19E FY20E FY21E
Axis Bank ACC 1,960 762 845 845 10.9 3.3 2.8 2.4 7.1 12.9 15.7
HDFC Bank BUY 6,279 2,306 2371 2,371 2.8 4.5 3.9 3.4 16.5 16.1 17.1
ICICI Bank BUY 2,518 391 427 427 9.3 2.1 1.9 1.7 4.0 9.3 11.6
IndusInd Bank BUY 1,066 1,768 1765 1,791 1.3 4.2 3.5 2.9 14.2 19.3 19.7
Yes Bank ACC 618 267 245 245 (8.2) 2.2 1.9 1.6 15.9 17.6 18.2
Kotak HOLD 2,550 1,336 1291 1,291 (3.4) 5.1 4.5 3.9 11.5 12.3 13.3
Federal BUY 196 99 102 102 3.3 1.8 1.6 1.4 9.5 11.7 13.0
J&K Bank BUY 33 59 76 76 29.4 1.1 0.8 0.6 7.2 10.3 12.1
South Indian Bank BUY 32 18 22 22 25.7 1.0 0.8 0.7 5.3 8.3 8.2
IDFC First Bank ACC 259 54 55 60 10.7 1.3 1.2 1.3 1.4 2.6 1.5
Bank of Baroda BUY 346 131 161 161 23.3 1.2 1.0 0.8 5.5 10.5 13.6
Bank of India REDUCE 278 101 89 90 (10.7) 1.2 1.1 1.0 (16.0) 3.2 3.1
Punjab National Bank HOLD 354 93 83 98 5.3 1.7 1.1 0.9 (10.4) 6.7 11.1
SBI BUY 2,830 317 361 361 13.9 1.4 1.2 1.1 2.5 7.4 9.4
Union Bank REDUCE 109 93 79 79 (15.1) 1.8 1.3 1.0 (24.0) 1.1 4.2
HDFC Life BUY 779 386 438 438 13.3 4.2 3.4 2.8 23.3 23.8 24.4
ICICI Pru Life BUY 523 364 471 471 29.2 2.5 2.2 1.9 11.5 13.8 14.4
Max Financial BUY 118 439 629 629 43.3 1.3 1.1 1.0 19.9 21.0 21.6
SBI Life BUY 612 612 779 779 27.2 2.8 2.4 2.0 15.3 17.5 18.1
Source: Company, PL
Note – *Kotak & SBI valuation on S’lone bookNote – For Insurance companies, valuations are based on P/EV (x) and Op. RoEV (%)

Banks
April 5, 2019 41
Q4FY19 Results Preview – Better NII growth across banking universe; lowering credit cost to support earnings
Rs Million NII YoY QoQ PPOP YoY QoQ PAT YoY QoQ
HDFC Bank 128,845 20.9% 2.4% 107,525 21.1% -0.2% 57,724 19.2% 3.3%
ICICI Bank 70,782 17.5% 3.0% 61,449 -18.2% 0.0% 17,324 69.8% 7.9%
Axis Bank 58,389 23.4% 4.2% 42,234 15.0% -23.6% 15,694 -171.7% -6.6%
Kotak 30,799 19.4% 4.8% 23,891 18.4% 23.2% 14,013 24.7% 8.6%
IndusInd 24,287 21.0% 6.1% 21,315 20.5% 0.7% 6,094 -36.1% -38.1%
Yes 28,047 30.2% 5.2% 23,253 8.9% 16.8% 11,478 -2.7% 14.6%
SIB 5,514 12.0% 6.1% 3,422 10.1% 3.1% 919 -19.5% NA
J&K 8,378 27.8% -5.0% 4,627 73.7% 8.9% 1,635 475.7% 57.6%
Federal 11,134 19.3% 3.3% 7,369 25.2% 4.1% 3,414 135.5% 2.3%
IDFC First Bank 11,320 149.8% -1.2% 5,126 809.1% 66.5% 3,086 635.9% -70.9%
SBI 233,085 16.7% 2.7% 136,287 -14.2% 8.0% 50,937 -166.0% 28.8%
PNB 40,182 31.2% -6.3% 43,384 NA 40.0% 10,623 NA NA
BOI 31,272 22.0% -6.2% 27,184 131.9% 19.6% 2,096 NA NA
BOB 45,043 12.5% -5.0% 29,140 9.3% -17.6% 10,206 NA NA
Union 25,508 16.3% 2.3% 16,529 -12.5% -5.6% (1,785) NA NA
Total Banks 752,585 20.4% 1.5% 552,735 14.3% 3.2% 203,458 -186.5% 47.2%
Total Private Banks 377,495 23.0% 3.2% 300,211 10.3% -0.8% 131,381 81.0% -4.3%
Total Public Banks 375,090 18.0% -0.1% 252,524 19.3% 8.4% 72,077 -123.4% NA
Rs Billion Loans YoY QoQ Margins YoY QoQ Credit Cost YoY QoQ
HDFC Bank 8,163 24.0% 4.5% 4.40% 0.10% 0.10% 0.93% -0.01% -0.21%
ICICI Bank 5,816 13.5% 3.1% 3.36% 0.12% -0.04% 2.36% -2.82% -0.65%
Axis Bank 5,012 14.0% 5.5% 3.43% 0.10% -0.04% 1.45% -5.08% -1.12%
Kotak 2,088 23.0% 6.3% 4.35% 0.00% 0.02% 0.51% -0.21% 0.58%
IndusInd 1,884 30.0% 8.8% 3.85% -0.12% 0.02% 2.69% 1.76% 1.29%
Yes 2,544 25.0% 4.3% 3.35% -0.05% 0.05% 0.85% 0.06% -0.05%
SIB 627 15.0% 5.9% 2.75% 0.02% 0.09% 1.34% 0.25% -0.03%
J&K 666 17.0% 2.4% 3.90% 0.71% -0.01% 1.64% -0.12% 0.09%
Federal 1,136 23.5% 7.6% 3.15% 0.04% -0.02% 0.76% -0.86% 0.04%
IDFC First Bank 861 65.0% -15.4% 2.08% 0.58% 2.08% 0.98% -0.88% 0.15%
SBI 21,574 11.5% 5.4% 2.78% 0.28% 0.02% 1.34% -4.47% 0.17%
PNB 4,424 2.0% 1.8% 2.45% 0.75% -0.08% 2.64% -16.13% 0.10%
BOI 3,380 -1.0% 2.1% 2.20% 0.55% -0.35% 2.60% -5.22% -8.27%
BOB 4,787 12.0% 6.7% 2.59% 0.08% -0.10% 1.25% -4.99% -1.24%
Union 3,090 7.0% 5.9% 2.20% 0.21% -0.03% 1.89% -5.96% -0.33%
Banks 75,346 13.4% 4.7% 3.12% 0.22% 0.11% 1.70% -3.15% -0.17%
Source: Company, PL
Margins in Q4FY19E – Steady to slight better
margins mainly from mix changes
Q4FY18 Q3FY19 Q4FY19E YoY QoQ
HDFC Bank 4.30% 4.30% 4.40% 0.10% 0.10%
ICICI Bank 3.24% 3.40% 3.36% 0.12% -0.04%
Axis Bank 3.33% 3.47% 3.43% 0.10% -0.04%
Kotak 4.35% 4.33% 4.35% 0.00% 0.02%
IndusInd 3.97% 3.83% 3.85% -0.12% 0.02%
Yes 3.40% 3.30% 3.35% -0.05% 0.05%
SIB 2.73% 2.66% 2.75% 0.02% 0.09%
J&K 3.19% 3.91% 3.90% 0.71% -0.01%
Federal 3.11% 3.17% 3.15% 0.04% -0.02%
IDFC First Bank 1.50% 3.27% 3.30% 1.80% 0.03%
SBI 2.50% 2.76% 2.78% 0.28% 0.02%
PNB 1.70% 2.53% 2.45% 0.75% -0.08%
BOI 1.65% 2.55% 2.20% 0.55% -0.35%
BOB 2.51% 2.69% 2.59% 0.08% -0.10%
Union 1.99% 2.23% 2.20% 0.21% -0.03%
Source: Company, PL
Credit cost in Q4FY19E to come off relatively on
lower slippages but banks to maintain high PCR
Q4FY18 Q3FY19 Q4FY19E YoY QoQ
HDFC Bank 0.94% 1.13% 0.93% -0.01% -0.21%
ICICI Bank 5.17% 3.01% 2.36% -2.82% -0.65%
Axis Bank 6.53% 2.57% 1.45% -5.08% -1.12%
Kotak 0.72% -0.07% 0.51% -0.21% 0.58%
IndusInd 0.93% 1.40% 2.69% 1.76% 1.29%
Yes 0.79% 0.90% 0.85% 0.06% -0.05%
SIB 1.09% 1.37% 1.34% 0.25% -0.03%
J&K 1.76% 1.56% 1.64% -0.12% 0.09%
Federal 1.62% 0.72% 0.76% -0.86% 0.04%
IDFC First Bank 1.86% 0.84% 0.98% -0.88% 0.15%
SBI 5.81% 1.17% 1.34% -4.47% 0.17%
PNB 18.77% 2.54% 2.64% -16.13% 0.10%
BOI 7.82% 10.87% 2.60% -5.22% -8.27%
BOB 6.24% 2.49% 1.25% -4.99% -1.24%
Union 7.85% 2.22% 1.89% -5.96% -0.33%
Source: Company, PL

Banks
April 5, 2019 42
Benchmark G-sec yields have been stable
7.429
7.324
6.0
6.5
7.0
7.5
8.0
8.5
9.0
9.5
Mar-
12
Jul-12
Nov-
12
Mar-
13
Jul-13
Nov-
13
Mar-
14
Jul-14
Nov-
14
Mar-
15
Jul-15
Nov-
15
Mar-
16
Jul-16
Nov-
16
Mar-
17
Jul-17
Nov-
17
Mar-
18
Jul-18
Nov-
18
Mar-
19
10Yr G-Sec Yield
Source: Bloomberg, PL
Moderation has been in lower tenure yields
5.86.06.26.46.66.87.07.27.47.67.88.08.2
3Month 1Year 5Year 10Year
Jun'18 Sep'18 Dec'18
Source: Company, PL
RBI has been moving its benchmark rates in lieu of benign inflation and support growth
4.5
5.0
5.5
6.0
6.5
7.0
7.5
8.0
8.5
9.0
9.5
Mar-
06
Sep-0
6
Mar-
07
Sep-0
7
Mar-
08
Sep-0
8
Mar-
09
Sep-0
9
Mar-
10
Sep-1
0
Mar-
11
Sep-1
1
Mar-
12
Sep-1
2
Mar-
13
Sep-1
3
Mar-
14
Sep-1
4
Mar-
15
Sep-1
5
Mar-
16
Sep-1
6
Mar-
17
Sep-1
7
Mar-
18
Sep-1
8
Mar-
19
(%)
Movement in Repo Rate
Source: Bloomberg, PL
Systemic liquidity supported by RBI intervention...
(3,000)
(2,500)
(2,000)
(1,500)
(1,000)
(500)
-
500
1,000
Dec-
16
Mar-
17
Jun-1
7
Sep-1
7
Dec-
17
Mar-
18
Jun-1
8
Sep-1
8
Dec-
18
Mar-
19
Net Liquidity (Rs Bn)
Source: Bloomberg, PL
…via OMOs & forex swap
(28) (24) (20) (16) (12) (8) (4) - 4 8
12
Dec-
16
Mar-
17
Jun-1
7
Sep-1
7
Dec-
17
Mar-
18
Jun-1
8
Sep-1
8
Dec-
18
Mar-
19
Rs
Tri
llio
n
Repo R-Repo Var Repo Var R-Repo MSF Net OMOs SLF MSS
Source: Bloomberg, PL

Banks
April 5, 2019 43
Short term rates softening post liquidity crisis
8.98
7.95
6.0
6.5
7.0
7.5
8.0
8.5
9.0
9.5
10.0
10.5
Jan-1
7
Feb-1
7
Mar-
17
Apr-
17
May-1
7
Jun-1
7
Jul-17
Aug-1
7
Sep-1
7
Oct-17
Nov-1
7
Dec-1
7
Jan-1
8
Feb-1
8
Mar-
18
Apr-
18
May-1
8
Jun-1
8
Jul-18
Aug-1
8
Sep-1
8
Oct-18
Nov-1
8
Dec-1
8
Jan-1
9
Feb-1
9
Mar-
19
3 MTH CP 6 MTH CP
Source: Bloomberg, PL
Long term rates similarly sliding for AAA issuers
8.868.10
6.5
7.0
7.5
8.0
8.5
9.0
9.5
10.0
Mar-
16
Jun-1
6
Sep-1
6
Dec-
16
Mar-
17
Jun-1
7
Sep-1
7
Dec-
17
Mar-
18
Jun-1
8
Sep-1
8
Dec-
18
Mar-
19
FIMMDA 3 YR AAA FIMMDA 5 YR AAA
Source: Bloomberg, PL
A-rated issuers witnessing bigger drop in rates
8.34
10.79
9.88
8.0
8.5
9.0
9.5
10.0
10.5
11.0
11.5
Mar-
16
Jun-1
6
Sep-1
6
Dec-
16
Mar-
17
Jun-1
7
Sep-1
7
Dec-
17
Mar-
18
Jun-1
8
Sep-1
8
Dec-
18
Mar-
19
FIMMDA 3 YR A FIMMDA 5 YR A
Source: Bloomberg, PL
Credit growth on strong footing; deposits seeing steady growth
12.3%
5.4%
10.0%
5.1%
10.2%
14.5%
3%
5%
7%
9%
11%
13%
15%
17%
19%
21%
23%
25%
Mar-
12
Jun-1
2
Sep-1
2
Dec-1
2
Mar-
13
Jun-1
3
Sep-1
3
Dec-1
3
Mar-
14
Jun-1
4
Sep-1
4
Dec-1
4
Mar-
15
Jun-1
5
Sep-1
5
Dec-1
5
Mar-
16
Jun-1
6
Sep-1
6
Dec-1
6
Mar-
17
Jun-1
7
Sep-1
7
Dec-1
7
Mar-
18
Jun-1
8
Sep-1
8
Dec-1
8
Mar-
19
Deposit growth Credit growth
Source: Bloomberg, PL Note – Data released upto mid Dec’18

Banks
April 5, 2019 44
Term deposit rates movement has been steady and buckets
-0.20
-0.15
-0.10
-0.05
0.00
0.05
0.10
Feb
-16
Apr-
16
Jun-1
6
Aug-1
6
Oct-16
Dec-
16
Feb
-17
Apr-
17
Jun-1
7
Aug-1
7
Oct-17
Dec-
17
Feb
-18
Apr-
18
Jun-1
8
Aug-1
8
Oct-18
Dec-
18
Feb
-19
MoM chg in Rupee Term Deposits Rate
SCBs PSBs Pvt Banks
Source: Bloomberg, PL
Bond market rates have cooled hence expanding gap between MCLR and AAA rated paper
-0.2 0.1 0.4 0.7 1.0 1.3 1.6 1.9 2.2 2.5
Dec-
16Ja
n-1
7F
eb-1
7M
ar-
17
Apr-
17
May-
17
Jun-1
7Ju
l-17
Aug-1
7S
ep-1
7O
ct-17
Nov-
17D
ec-
17Ja
n-1
8F
eb-1
8M
ar-
18
Apr-
18
May-
18
Jun-1
8Ju
l-18
Aug-1
8S
ep-1
8O
ct-18
Nov-
18D
ec-
18Ja
n-1
9F
eb-1
9
Diff bet SBI 1Yr MCLR & FIMMDA 1Yr AAA
Diff bet SCB Median - MCLR & FIMMDA 1Yr AAA
Source: Bloomberg, PL
Mixed cuts has been seen by respective banks post RBI’s change in stance
Banks MCLR 1YR
MCLR 1YR
% Change
Sept-18 Dec-18 Mar-19 3Months 6Months
Axis Bank 8.60%
8.70% 8.90% 0.20% 0.30%
HDFC Bank 8.70% 8.85% 8.75% -0.10% 0.05%
ICICI Bank 8.55% 8.80% 8.80% 0.00% 0.25%
KMB 8.95% 9.00% 9.00% 0.00% 0.05%
IndusInd Bank 9.65% 9.80% 9.90% 0.10% 0.25%
Yes Bank 9.65% 9.85% 9.70% -0.15% 0.05%
SBI 8.45% 8.55% 8.55% 0.00% 0.10%
Bank of Baroda 8.55% 8.65% 8.65% 0.00% 0.10%
Bank of India 8.60% 8.70% 8.65% -0.05% 0.05%
Punjab National Bank 8.45% 8.50% 8.45% -0.05% 0.00%
Canara Bank 8.60% 8.70% 8.70% 0.00% 0.10%
Union Bank 8.55% 8.70% 8.60% -0.10% 0.05%
Federal 9.20% 9.20% 9.20% 0.00% 0.00%
South Indian Bank 9.35% 9.45% 9.45% 0.00% 0.10%
J&K Bank 8.85% 9.00% 9.00% 0.00% 0.15%
Source: Company, PL
Banks have been selective on rate
-0.15%
-0.10%
-0.05%
0.00%
0.05%
0.10%
0.15%
0.20%
0.25%
0.30%
Axis HDFCB ICICIBC IIB KMB Yes SBI BOB
Quarterly Change in MCLRs
ON 1M 3M 6M 1Y
Source: Company, PL
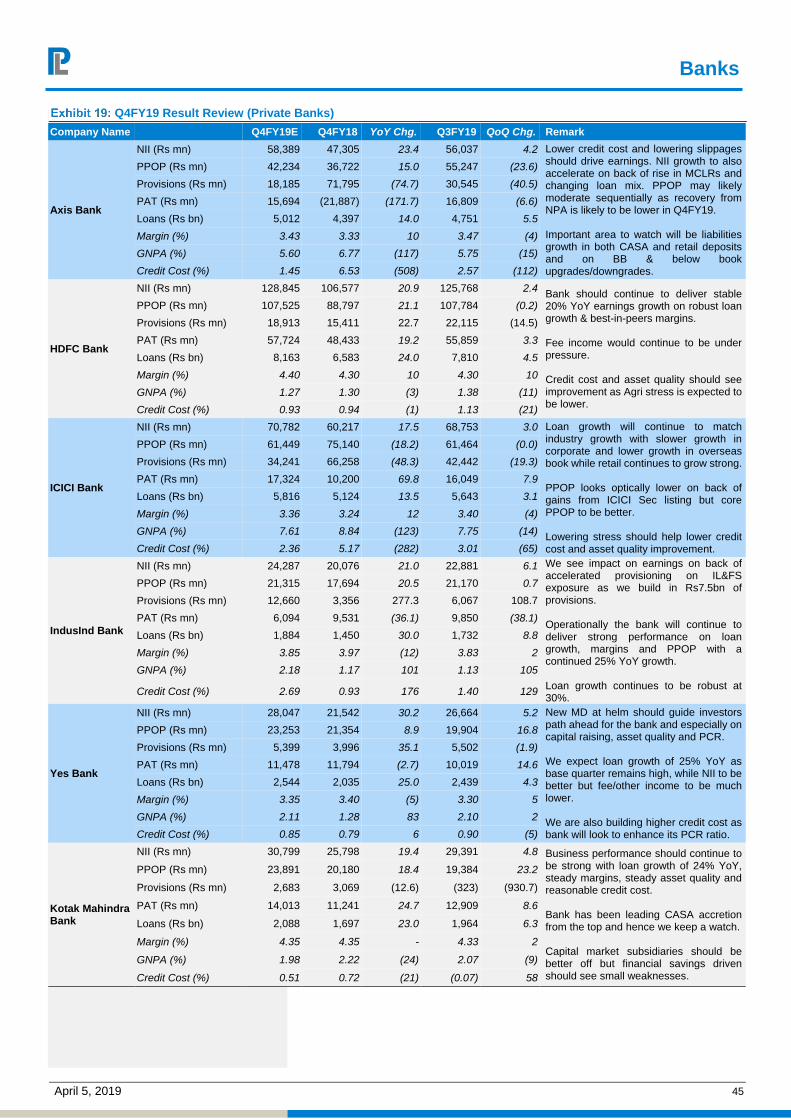
Banks
April 5, 2019 45
Q4FY19 Result Review (Private Banks)
Company Name Q4FY19E Q4FY18 YoY Chg. Q3FY19 QoQ Chg. Remark
Axis Bank
NII (Rs mn) 58,389 47,305 23.4 56,037 4.2 Lower credit cost and lowering slippages should drive earnings. NII growth to also accelerate on back of rise in MCLRs and changing loan mix. PPOP may likely moderate sequentially as recovery from NPA is likely to be lower in Q4FY19. Important area to watch will be liabilities growth in both CASA and retail deposits and on BB & below book upgrades/downgrades.
PPOP (Rs mn) 42,234 36,722 15.0 55,247 (23.6)
Provisions (Rs mn) 18,185 71,795 (74.7) 30,545 (40.5)
PAT (Rs mn) 15,694 (21,887) (171.7) 16,809 (6.6)
Loans (Rs bn) 5,012 4,397 14.0 4,751 5.5
Margin (%) 3.43 3.33 10 3.47 (4)
GNPA (%) 5.60 6.77 (117) 5.75 (15)
Credit Cost (%) 1.45 6.53 (508) 2.57 (112)
HDFC Bank
NII (Rs mn) 128,845 106,577 20.9 125,768 2.4 Bank should continue to deliver stable 20% YoY earnings growth on robust loan growth & best-in-peers margins. Fee income would continue to be under pressure. Credit cost and asset quality should see improvement as Agri stress is expected to be lower.
PPOP (Rs mn) 107,525 88,797 21.1 107,784 (0.2)
Provisions (Rs mn) 18,913 15,411 22.7 22,115 (14.5)
PAT (Rs mn) 57,724 48,433 19.2 55,859 3.3
Loans (Rs bn) 8,163 6,583 24.0 7,810 4.5
Margin (%) 4.40 4.30 10 4.30 10
GNPA (%) 1.27 1.30 (3) 1.38 (11)
Credit Cost (%) 0.93 0.94 (1) 1.13 (21)
ICICI Bank
NII (Rs mn) 70,782 60,217 17.5 68,753 3.0 Loan growth will continue to match industry growth with slower growth in corporate and lower growth in overseas book while retail continues to grow strong. PPOP looks optically lower on back of gains from ICICI Sec listing but core PPOP to be better. Lowering stress should help lower credit cost and asset quality improvement.
PPOP (Rs mn) 61,449 75,140 (18.2) 61,464 (0.0)
Provisions (Rs mn) 34,241 66,258 (48.3) 42,442 (19.3)
PAT (Rs mn) 17,324 10,200 69.8 16,049 7.9
Loans (Rs bn) 5,816 5,124 13.5 5,643 3.1
Margin (%) 3.36 3.24 12 3.40 (4)
GNPA (%) 7.61 8.84 (123) 7.75 (14)
Credit Cost (%) 2.36 5.17 (282) 3.01 (65)
IndusInd Bank
NII (Rs mn) 24,287 20,076 21.0 22,881 6.1 We see impact on earnings on back of accelerated provisioning on IL&FS exposure as we build in Rs7.5bn of provisions. Operationally the bank will continue to deliver strong performance on loan growth, margins and PPOP with a continued 25% YoY growth. Loan growth continues to be robust at 30%.
PPOP (Rs mn) 21,315 17,694 20.5 21,170 0.7
Provisions (Rs mn) 12,660 3,356 277.3 6,067 108.7
PAT (Rs mn) 6,094 9,531 (36.1) 9,850 (38.1)
Loans (Rs bn) 1,884 1,450 30.0 1,732 8.8
Margin (%) 3.85 3.97 (12) 3.83 2
GNPA (%) 2.18 1.17 101 1.13 105
Credit Cost (%) 2.69 0.93 176 1.40 129
Yes Bank
NII (Rs mn) 28,047 21,542 30.2 26,664 5.2 New MD at helm should guide investors path ahead for the bank and especially on capital raising, asset quality and PCR. We expect loan growth of 25% YoY as base quarter remains high, while NII to be better but fee/other income to be much lower. We are also building higher credit cost as bank will look to enhance its PCR ratio.
PPOP (Rs mn) 23,253 21,354 8.9 19,904 16.8
Provisions (Rs mn) 5,399 3,996 35.1 5,502 (1.9)
PAT (Rs mn) 11,478 11,794 (2.7) 10,019 14.6
Loans (Rs bn) 2,544 2,035 25.0 2,439 4.3
Margin (%) 3.35 3.40 (5) 3.30 5
GNPA (%) 2.11 1.28 83 2.10 2
Credit Cost (%) 0.85 0.79 6 0.90 (5)
Kotak Mahindra Bank
NII (Rs mn) 30,799 25,798 19.4 29,391 4.8 Business performance should continue to be strong with loan growth of 24% YoY, steady margins, steady asset quality and reasonable credit cost. Bank has been leading CASA accretion from the top and hence we keep a watch. Capital market subsidiaries should be better off but financial savings driven should see small weaknesses.
PPOP (Rs mn) 23,891 20,180 18.4 19,384 23.2
Provisions (Rs mn) 2,683 3,069 (12.6) (323) (930.7)
PAT (Rs mn) 14,013 11,241 24.7 12,909 8.6
Loans (Rs bn) 2,088 1,697 23.0 1,964 6.3
Margin (%) 4.35 4.35 - 4.33 2
GNPA (%) 1.98 2.22 (24) 2.07 (9)
Credit Cost (%) 0.51 0.72 (21) (0.07) 58

Banks
April 5, 2019 46
Company Name Q4FY19E Q4FY18 YoY Chg. Q3FY19 QoQ Chg. Remark
IDFC First Bank
NII (Rs mn) 11,320 4,532 149.8 11,452 (1.2)
IDFC First Bank should report small improvement in NII but start seeing much higher opex cost on branch additions and product marketing. Although early in stage but liabilities build-up will be a key area to watch.
PPOP (Rs mn) 5,126 564 809.1 3,080 66.5
Provisions (Rs mn) 2,115 2,425 (12.8) 2,125 (0.5)
PAT (Rs mn) 3,086 419 635.9 10,613 (70.9)
Loans (Rs bn) 861 522 65.0 1,017 (15.4)
Margin (%) 2.08 1.50 58 - 208
GNPA (%) 1.28 3.35 (207) 1.97 (69)
Credit Cost (%) 0.98 1.86 (88) 0.84 15
Federal
NII (Rs mn) 11,134 9,332 19.3 10,773 3.3 FB will continue to have strong PPOP on back of steady NII growth led by steady margins and a continued strong loan growth of 25%. Agri/SME slippages to remain on elevated run rate but within the bank’s guidance. We also watch any lagged impact from Kerala floods on asset quality.
PPOP (Rs mn) 7,369 5,886 25.2 7,078 4.1
Provisions (Rs mn) 2,152 3,715 (42.1) 1,901 13.2
PAT (Rs mn) 3,414 1,450 135.5 3,336 2.3
Loans (Rs bn) 1,136 920 23.5 1,056 7.6
Margin (%) 3.15 3.11 4 3.17 (2)
GNPA (%) 3.02 3 2 3.14 (12)
Credit Cost (%) 0.76 1.62 (86) 0.72 4
J&K Bank
NII (Rs mn) 8,378 6,558 27.8 8,816 (5.0) Loan growth expected to be at 17% YoY but J&K growth book will be strong. Other income & earnings will be benefitted from insurance stake sale. Asset quality should see improvement on back of recovery/write-offs and bank will continue to build PCR towards 70%. We watch movement in restructured book as the moratorium based performance ends.
PPOP (Rs mn) 4,627 2,665 73.7 4,249 8.9
Provisions (Rs mn) 2,731 2,511 8.7 2,528 8.0
PAT (Rs mn) 1,635 284 475.7 1,038 57.6
Loans (Rs bn) 666 569 17.0 650 2.4
Margin (%) 3.90 3.19 71 3.91 (1)
GNPA (%) 9.04 9.96 (92) 9.94 (90)
Credit Cost (%) 1.64 1.76 (12) 1.56 9
South Indian Bank
NII (Rs mn) 5,514 4,922 12.0 5,196 6.1 We expect loan growth to be healthy at 15% YoY but NII will be slow on low treasury yields. PPOP is likely to be impacted from continued wage & gratuity provision and low other income. Credit cost though should come off but PCR continues to be low and we expect bank will gradually improve it.
PPOP (Rs mn) 3,422 3,109 10.1 3,320 3.1
Provisions (Rs mn) 2,099 1,486 41.2 2,031 3.3
PAT (Rs mn) 919 1,141 (19.5) 838 9.6
Loans (Rs bn) 627 546 15.0 593 5.9
Margin (%) 2.75 2.73 2 2.66 9
GNPA (%) 4.54 3.59 95 4.88 (34)
Credit Cost (%) 1.34 1.09 25 1.37 (3)
Source: Company, PL

Banks
April 5, 2019 47
Q4FY19 Result Review (PSU Banks)
Company Name Q4FY19E Q4FY18 YoY Chg. Q3FY19 QoQ Chg. Remark
Bank of Baroda
NII (Rs mn) 45,043 40,023 12.5 47,432 (5.0) BOB earnings should continue to see good recovery on lowered provisions, while higher write-offs to result in a decline in GNPA. PPOP growth should be lower on back of lower other income (treasury) while NII should see slower growth with small decline in margins.
PPOP (Rs mn) 29,140 26,655 9.3 35,385 (17.6)
Provisions (Rs mn) 15,006 66,724 (77.5) 27,942 (46.3)
PAT (Rs mn) 10,206 (31,023) (132.9) 4,712 116.6
Loans (Rs bn) 4,787 4,274 12.0 4,487 6.7
Margin (%) 2.59 2.51 8 2.69 (10)
GNPA (%) 10.24 12.26 (202) 11.01 (77)
Credit Cost (%) 1.25 6.24 (499) 2.49 (124)
Bank of India
NII (Rs mn) 31,272 25,639 22.0 33,322 (6.2) High and continuous capital infusion by Govt would help BOI improve its operations and improve PCR further, while we expect asset quality improve on back of relatively lower slippages and recovery/w.offs Loan growth is likely to see de-growth YoY but improve sequentially as bank have come of PCA in Q4FY19.
PPOP (Rs mn) 27,184 11,721 131.9 22,728 19.6
Provisions (Rs mn) 21,979 66,741 (67.1) 90,007 (75.6)
PAT (Rs mn) 2,096 (39,693) (105.3) (47,376) (104.4)
Loans (Rs bn) 3,380 3,414 (1.0) 3,311 2.1
Margin (%) 2.20 1.65 55 2.55 (35)
GNPA (%) 15.91 16.58 (67) 16.31 (40)
Credit Cost (%) 2.60 7.82 (522) 10.87 (827)
Punjab National Bank
NII (Rs mn) 40,182 30,634 31.2 42,901 (6.3) Key operating metrics to see improvement mainly on back of lower base in Q4FY18 especially in NII and stake sale in PNB housing. Bank has been showcasing strong recovery/upgrades trends for last few quarters which should continue, while recent capital infusion will help provisioning and PCR enhancement.
PPOP (Rs mn) 43,384 (4,474) (1,069.7) 30,999 40.0
Provisions (Rs mn) 29,179 203,531 (85.7) 27,538 6.0
PAT (Rs mn) 10,623 (134,169) (107.9) 2,465 330.9
Loans (Rs bn) 4,424 4,337 2.0 4,344 1.8
Margin (%) 2.45 1.70 75 2.53 (8)
GNPA (%) 15.07 18.38 (331) 16.33 (126)
Credit Cost (%) 2.64 18.77 (1,613) 2.54 10
State Bank of India
NII (Rs mn) 233,085 199,743 16.7 226,910 2.7 We expect loan growth at steady 11-12% YoY with largely steady NIMs leading to 16-17% NII growth. Asset quality should improve as we expect very similar slippages as seen in Q3FY19 but do not see recent announced resolutions factoring in this quarter. We expect bank will continue to enhance PCR.
PPOP (Rs mn) 136,287 158,832 (14.2) 126,250 8.0
Provisions (Rs mn) 72,235 280,961 (74.3) 60,062 20.3
PAT (Rs mn) 50,937 (77,182) (166.0) 39,548 28.8
Loans (Rs bn) 21,574 19,349 11.5 20,478 5.4
Margin (%) 2.78 2.50 28 2.76 2
GNPA (%) 7.92 10.91 (299) 8.71 (79)
Credit Cost (%) 1.34 5.81 (447) 1.17 17
Union Bank of India
NII (Rs mn) 25,508 21,931 16.3 24,942 2.3 Loan growth should see improvement of 6-7% YoY leading to better NII (also Q4FY18 was low base). PPOP to see decline on lower treasury and lower benefit on pension liabilities (staff cost). Asset quality to see improvement on lower slippages from corporate but Agri/MSME stress should remain evident.
PPOP (Rs mn) 16,529 18,894 (12.5) 17,504 (5.6)
Provisions (Rs mn) 14,581 56,679 (74.3) 16,171 (9.8)
PAT (Rs mn) (1,785) (25,834) NA 1,532 NA
Loans (Rs bn) 3,090 2,888 7.0 2,919 5.9
Margin (%) 2.20 1.99 21 2.23 (3)
GNPA (%) 14.92 15.73 (81) 15.66 (74)
Credit Cost (%) 1.89 7.85 (596) 2.22 (33)
Source: Company, PL

April 5, 2019 48
Capital Goods
Jan-Mar’19 Earnings Preview
We expect execution momentum to continue over the next 2-3 quarters
despite upcoming general elections, however order inflow, which remained
buoyant (+20% YoY in 9MFY19), could witness some slowdown in 4QFY19.
We expect order inflow to pick-up from 2QFY20 onwards post general
election. We remain positive on the sector due to robust order back-log &
order pipeline, better execution focus and reasonable valuations.
The optimism amongst corporates continue to be high and expect awarding
activity/momentum to prevail. Most corporates continue to be confident from
medium-term growth prospects, given the various initiatives taken by the
government. For 9MFY19, companies under our coverage witnessed robust
execution (except GE T&D) with a revenue growth of ~18% YoY. Generally,
the execution is highest in 4Q (35-40%) due to year end deadlines/targets.
With an improvement in liquidity situation plus upcoming elections, we
expect the trajectory to continue in 4QFY19 and ahead.
Pick up in execution led to higher revenue growth (Rs m)
9MFY18 9MFY19 YoY gr.
ABB India (CY) 58,655 61,707 5.2%
Apar Industries 41,425 54,993 32.8%
Bharat Electronics 67,005 82,000 22.4%
BHEL 186,735 200,518 7.4%
Cummins India 38,493 43,186 12.2%
Engineers India 12,779 18,317 43.3%
KEC International 64,286 71,594 11.4%
Kalpataru Power Transmission 38,098 46,237 21.4%
Larsen & Toubro 791,840 960,732 21.3%
Siemens (SY) 82,221 98,193 19.4%
Thermax 30,219 38,995 29.0%
Voltamp Transformers 4,195 5,700 35.9%
GE T&D 35,178 33,235 -5.5%
Triveni Turbines 5,070 6,003 18.4%
Total 1,456,197 1,721,410 18.2%
Source: PL
Commentary on end markets like Power T&D led by SEB/Urban
Transport/Renewable/Railways/Defence/Water/O&G continues to be positive.
Government recently approved power projects worth Rs310bn and announced
several initiatives to revive 40GW of stressed power assets. Corporates are
relatively positive as compared to the past, in terms of enquiry levels and project
pipelines. Commentary on international markets continues to be a mixed bag, while
investment environment may improve once crude oil stabilizes. Order
inflow/enquiries from South East ASIA/Europe/USA /Africa continue to look up.
April 5, 2019
Top Picks
Larsen & Toubro
Kalpataru Power Transmission
Ashwani Sharma
[email protected] | 91-22-66322247
Khushboo Parekh
[email protected] | 91-22-66322257

Capital Goods
April 5, 2019 49
Overview of stressed assets
Total No. of projects (Nos.) 34
Total Stressed Capacity (MW) 40,130
Commissioned Capacity (MW) 24,405
Under Construction Capacity (MW) 15,725
PPAs tied up (MW) 18,516
PPAs not tied up (MW) 21,614
Linkage available (MW) 29,190
Linkage required 10,940
Resolved project's (08 nos.) capacity (MW) 8,820
Source: Power Ministry, PL
T&D EPC companies to benefit from tendering capex under Green Corridor:
The domestic transmission sector remained subdued in the last two years due to
PGCIL’s lower capex. However, activities have picked up in the last six months due
to increased tendering under Green Corridor. Overall, the targeted tendering stood
at Rs100-120bn, out of which Rs50-60bn has already been awarded. Remaining
targets are expected to be tendered out by end of 1QFY20. Secondly, states like
Jharkhand, Bihar, UP, West Bengal, Southern States etc. are likely to announce
tenders worth Rs50-70bn within next six months. Likewise,
modernization/upgradation of existing transmission lines from lower KV range to
higher KV range will determine the future ordering activity.
Capacity utilization raised to 74.8% in Sep 2018 from 73.4% in June 2018. This was
the highest utilization rate reported by RBI’s OBICUS in four years. While new
orders received by companies in FY19 are higher - 14% YoY at Rs9.4trn, 4QFY19
are at lowest level in the last five quarters. This indicates front-ending of orders
(33% in 1QFY19) in the first 9Months of the year due to general elections ahead.
We expect pick-up in new projects from 2QFY20 onwards post general elections.
Quarterly Capex Aggregates
Rs trillion Jun-17 Sep-17 Dec-17 Mar-18 Jun-18 Sep-18 Dec-18 Mar-19
New projects 1.7 0.9 1.3 4.3 3.1 2.0 2.3 2.0
Completed projects 1.1 0.5 1.2 1.7 1.3 1.0 1.3 1.9
Stalled projects 0.9 0.2 0.9 4.0 0.4 0.5 3.2 2.7
Revived projects 0.3 0.1 0.2 0.3 0.3 0.5 0.9 0.1
Implementation stalled projects NA NA 0.7 1.5 0.1 0.6 0.3 1.5
Source: CMIE, PL
IIP Trends
-5
0
5
10
15
20
25
IIP growth (%) Capital Goods (%)
Source: CMIE, PL

Capital Goods
April 5, 2019 50
Q4FY19 Result Preview
Company Name Q4FY19E Q4FY18 YoY gr.
(%) Q3FY19
QoQ gr. (%)
Remark
ABB
Sales 17,318 25,255 -31.4 19,663 (11.9) The numbers are not comparable due to demerger of the Power grid business. We expect steady growth in residual business of ABB. The residual business has higher service content which could result into higher margin going ahead.
EBITDA 1,250 1,890 (33.8) 2,154 (42.0)
Margin (%) 7.2 7.5 11.0
Adj. PAT 1,157 1,025 12.9 1,286 (10.0)
Apar Industries
Sales 19,337 17,675 9.4 21,191 (8.7) Revenue is expected to grow at 9% mainly led by Conductor segment (45% of revenue). EBITDA margins are expected to improve sequentially on account of rising contribution of HEC segment.
EBITDA 1,257 1,259 (0.1) 1,144 9.9
Margin (%) 6.5 7.1 5.4
Adj. PAT 430 400 7.4 347 23.8
Bharat Electronics
Sales 36,094 36,085 0.0 27,165 32.9 Expect flat revenue growth which is in line with 12-14% full year growth guidance. Margins could come lower than 9MFY19 average margin due to pre- ponement of FERV claim in 3QFY19.
EBITDA 6,447 7,962 (19.0) 7,681 (16.1)
Margin (%) 17.9 22.1 28.3
Adj. PAT 4,469 5,587 (20.0) 5,076 (12.0)
BHEL
Sales 118,264 101,470 16.6 73,364 61.2 Expect revenue growth of 17% YoY mainly led by improved executable order book. Improved execution should help margins. Key monitorable would be debtors days and commentary on order inflow.
EBITDA 10,022 12,316 (18.6) 2,187 358.2
Margin (%) 8.5 12.1 3.0
Adj. PAT 6,334 4,572 38.6 1,920 230.0
Engineers India
Sales 5,833 5,097 14.4 5,770 1.1 Expect revenue growth of 14%YoY mainly led by dip in margin led by growth in Lump-sum Turnkey Project segment. Margins improvement due to lower base and provision during the last quarter.
EBITDA 818 575 42.3 949 (13.8)
Margin (%) 14.0 11.3 16.4
Adj. PAT 973 689 41.2 908 7.2
GE T&D India
Sales 10,387 8,139 27.6 11,678 (11.1) Expect revenue growth of 28% YoY mainly due to lower base in 4QFY18. Margin pressure to be seen on QoQ basis due to near completion execution of HVDC order.
EBITDA 834 119 601.8 1,126 (26.0)
Margin (%) 8.0 1.5 9.6
Adj. PAT 308 278 10.9 531 (41.9)
KEC International
Sales 41,009 36,642 11.9 26,466 54.9 key monitorable would be guidance on interest cost/sale. Expect a steady Q4 on the back of a strong Order Book (up 30% yoy). Margins likely to be stable YoY as margin in new business improves.
EBITDA 4,215 3,699 14.0 2,814 49.8
Margin (%) 10.3 10.1 10.6
Adj. PAT 2,237 1,963 14.0 1,109 101.7
Cummins India
Sales 14,106 12,332 14.4 15,038 (6.2)
Expecting ~16% growth in domestic market and ~8% growth in exports . Margins likely to improve YoY due to pick up in both domestic and exports.
EBITDA 2,451 1,731 41.7 2,267 8.1
Margin (%) 17.4 14.0 15.1
Adj. PAT 2,076 1,612 28.8 1,871 11.0
Kalpataru Power Transmission
Sales 22,153 19,314 14.7 17,247 28.4 Expect revenue growth of 15% on the back of robust order backlog and improved execution in domestic/international markets. Margins likley to improve due to better margin in new business segments.
EBITDA 2,405 2,092 15.0 1,839 30.8
Margin (%) 10.9 10.8 10.7
Adj. PAT 1,290 1,048 23.1 920 40.2
Larsen & Toubro
Sales 413,245 406,781 1.6 357,089 15.7 Expect healthy execution led by E&C and Services business. Expect company to achieve full year guidance of 25bps YoY margin expansion. Key monitorable would be FY20 guidance and commentary.
EBITDA 46,135 53,905 (14.4) 39,963 15.4
Margin (%) 11.2 13.3 11.2
Adj. PAT 26,605 31,675 (16.0) 20,416 30.3
Power Grid Corporation of India
Sales 80,848 78,113 3.5 84,712 (4.6)
Expectation of Rs100 bn during the quarter, taking FY19 capialization of Rs250 bn.
EBITDA 72,775 65,241 11.5 75,694 (3.9)
Margin (%) 90.0 83.5 89.4
Adj. PAT 29,488 20,047 47.1 23,312 26.5
Siemens
Sales 36,946 32,834 12.5 28,071 31.6 Base Business orders will continue to grow leading to an 13% increase in Revenues. Expect 90bps improvement in margins due to operating efficiencies. Public spending to continue to drive capex.
EBITDA 3,965 3,228 22.8 3,065 29.4
Margin (%) 10.7 9.8 10.9
Adj. PAT 2,843 2,197 29.4 2,280 24.7

Capital Goods
April 5, 2019 51
Company Name Q4FY19E Q4FY18 YoY gr.
(%) Q3FY19
QoQ gr. (%)
Remark
Thermax
Sales 16,607 14,430 15.1 14,366 15.6 Expect execution to ramp up and margins to improve. TMX will continue to see positive traction in sectors like Fertilizer, Steel, O&G and Cement. Key monitorable would be subsidiary performance and outlook.
EBITDA 1,367 1,382 (1.0) 1,073 27.4
Margin (%) 8.2 9.6 7.5
Adj. PAT 877 757 15.8 750 16.8
Triveni Turbine
Sales 2,530 2,441 3.6 2,113 19.7
Expect revenue growth of 3.6% YoY mainly led by growth in international geographies. Key monitorables would be performance GE Triveni JV.
EBITDA 520 594 (12.6) 359 44.8
Margin (%) 20.5 24.3 17.0
Adj. PAT 348 354 (1.6) 228 52.5
Voltamp Transformers
Sales 2,296 2,196 4.6 2,152 6.7 Expect revenue growth of 5% on higher base. Steady demand from the industrial segment, however solar continues to be slow. Pricing scenario continues to be competitive, hence flat margin on QoQ.
EBITDA 268 290 (7.7) 241 11.0
Margin (%) 11.7 13.2 11.2
Adj. PAT 256 201 27.5 222 15.3
Source: Company, PL

Capital Goods
April 5, 2019 52
Valuation Summary
Company Names Rating CMP (Rs)
TP (Rs) Sales (Rs bn) EBITDA (Rs bn) PAT (Rs bn) EPS (Rs) RoE (%) PE (x)
FY18 FY19E FY20E FY21E FY18 FY19E FY20E FY21E FY18 FY19E FY20E FY21E FY18 FY19E FY20E FY21E FY18 FY19E FY20E FY21E FY18 FY19E FY20E FY21E
ABB Hold 1,378 1,320 60.9 66.9 77.0 88.9 4.1 4.6 5.5 6.8 4.2 5.1 6.2 7.7 19.8 24.1 29.5 36.2 12.2 13.4 15.2 17.8 69.5 57.1 46.7 38.1
Apar Industries Acc 681 762 58.2 74.3 81.1 88.9 4.1 4.6 5.4 6.1 1.4 1.4 1.8 2.2 37.8 35.4 46.0 56.4 13.5 11.7 13.9 15.4 18.0 19.3 14.8 12.1
Bharat Electronics BUY 97 112 103.2 118.1 132.1 142.9 20.0 25.8 27.1 28.6 14.0 16.9 17.5 18.2 5.7 6.9 7.2 7.5 18.3 20.6 19.2 18.1 16.9 13.9 13.5 13.0
BHEL Reduce 73 78 288.1 318.8 354.8 378.5 19.3 17.9 25.6 29.6 8.1 12.1 17.0 19.4 2.2 3.5 4.9 5.6 2.5 3.8 5.4 6.1 33.1 20.9 14.9 13.0
Engineers India BUY 120 136 18.2 24.2 27.0 31.7 4.3 3.5 3.9 4.8 3.8 3.7 4.0 4.8 6.1 5.9 6.4 7.6 14.8 15.6 16.8 20.5 19.7 20.3 18.8 15.8
GE T&D India Reduce 278 278 43.3 43.6 47.5 52.9 2.6 4.3 4.7 5.2 2.1 2.5 2.5 2.8 8.2 9.7 9.7 11.1 18.8 19.6 17.2 17.3 34.1 28.5 28.5 25.0
KEC International BUY 290 400 100.6 112.6 129.0 145.2 10.1 11.7 13.2 14.6 4.6 5.2 5.9 7.0 17.9 20.1 22.9 27.0 25.7 23.3 22.1 21.7 16.2 14.4 12.6 10.7
Cummins India Acc 715 867 50.8 57.3 62.8 69.3 7.3 9.0 10.0 11.1 7.1 7.6 8.5 9.2 25.6 27.4 30.6 33.3 18.3 18.5 19.3 19.7 28.0 26.1 23.4 21.4
Kalpataru Power Transmission
BUY 460 547 57.4 68.4 78.3 91.9 6.3 7.5 8.7 10.2 3.2 3.9 4.5 5.5 21.0 25.6 29.5 35.6 12.3 13.4 13.6 14.5 21.9 17.9 15.6 12.9
Larsen & Toubro BUY 1,374 1,728 1196.8 1374.0 1564.3 1769.1 135.7 163.8 188.9 212.3 73.7 87.9 105.0 120.8 52.6 62.7 74.9 86.2 13.9 15.0 16.2 16.9 26.1 21.9 18.3 15.9
Power Grid Corporation of India
BUY 196 247 297.5 329.7 370.4 411.1 259.4 287.5 323.0 358.5 82.4 90.4 103.7 116.9 15.7 17.3 19.8 22.3 15.8 15.5 15.6 15.4 12.5 11.4 9.9 8.8
Siemens Acc 1,147 1,146 128.0 142.1 160.7 178.5 13.3 14.9 17.3 19.7 9.0 10.0 11.7 13.3 25.3 28.0 32.7 37.3 11.3 11.5 12.5 13.0 45.3 41.0 35.0 30.8
Thermax Acc 960 1,164 44.6 55.6 61.3 69.4 4.0 4.2 5.4 6.5 2.3 2.9 3.7 4.4 20.5 25.4 32.6 38.8 8.8 10.2 12.2 13.3 46.8 37.8 29.5 24.8
Triveni Turbine BUY 111 132 7.5 8.5 10.0 11.5 1.6 1.6 2.2 2.5 1.0 1.1 1.4 1.7 2.9 3.3 4.5 5.3 22.4 24.5 31.6 30.9 38.1 33.8 24.7 21.0
Voltamp Transformers BUY 1,125 1,380 6.4 8.0 8.9 9.7 0.7 0.9 0.9 1.0 0.7 0.8 0.9 0.9 72.6 77.4 84.8 92.0 12.4 12.0 12.0 11.9 15.5 14.5 13.3 12.2
Source: Company, PL

April 5, 2019 53
Cement
Jan-Mar’19 Earnings Preview
We expect EBITDA of our coverage universe to grow by 14.6% YoY on the back of
bottomed out earnings in the base year. Our coverage universe volume is expected
to grow at 11.8% YoY largely due to the increased demand ahead of Central Govt.
Elections. We continue to like ACC and Heidelberg Cement (HEIM) basis their
attractive valuations and strong earnings outlook.
Based on the DIPP data, cement production grew by 9.5% YoY in Jan-Feb’19. The
growth was led by strong demand from Government sponsored infra and affordable
housing sector. However, retail demand remained subdued due to weak sentiments
and sluggish private spending.
All India Cement Production
-15.0
-10.0
-5.0
0.0
5.0
10.0
15.0
20.0
40.045.050.055.060.065.070.075.080.085.090.095.0
Q4
FY
15
Q1
FY
16
Q2
FY
16
Q3
FY
16
Q4
FY
16
Q1
FY
17
Q2
FY
17
Q3
FY
17
Q4
FY
17
Q1
FY
18
Q2
FY
18
Q3
FY
18
Q4
FY
18
Q1
FY
19
Q2
FY
19
Q3
FY
19
Q4
FY
19
e
(%)
(m t
on
ne
s)
India Cement Production (LHS) YoY Growth (%)
Source: Economic Advisor to Ministry of Commerce & Industry
All India cement prices grew 1.6%/Rs6 per bag QoQ (+2%/Rs5 per bag YoY).
During Feb19, South India witnessed highest price hike followed by marginal
increase in West (specifically Maharashtra) region. Except for some pockets in
South, the prices had softened across markets in Mar19.
North – Muted Prices: Efforts to hike prices by Rs5/bag failed to reap any
benefit in the region due to weak demand. Prices in Jaipur/Delhi remained
unchanged QoQ. Prices in Punjab and Haryana dipped by Rs5/bag in a month.
Region’s average is down by Rs1/bag QoQ.
Central – High base and slow pick-up hit the prices: Regions average
prices rose by Rs3/bag QoQ. Prices in Central UP/MP fell by Rs4/bag QoQ
due to softer demand and tight liquidity. Prices in rest of UP were up by Rs6-
8/bag QoQ.
South – Strongest region: After a long spell of weakness in prices, during
February the South region witnessed a sharp increase of Rs80/Rs60/Rs80/
Rs50 in Hyderabad/Chennai/Bengaluru/Trivandrum respectively. However due
to intense competition, prices have softened by Rs10/Rs15/Rs10/Rs25 in
March. Region’s average prices rose by Rs22/bag QoQ.
April 5, 2019
Top Picks
ACC
Heidelberg Cement India
Amit Khimesra
[email protected] | 91-22-66322244

Cement
April 5, 2019 54
West – Maharashtra prices rebounds; Gujarat remains weak: Prices in
Gujarat fell by Rs20/bag in the month due to sharp fall in demand and increase
in supplies from Ultratech owned Binani plant. Prices in Mumbai rose by
Rs25/bag in February however, reversed back by Rs10 in March due to poor
demand. Prices in rest of Maharashtra held the ground with an increase of
Rs10-15/bag QoQ on the back of high prices in South.
East – Strong on demand but prices remain flat: Price in
Bihar/Odisha/WB/Chhattisgarh fell by Rs5/Rs5/Rs10/Rs5 QoQ due to intense
competition and restriction on prices by Chhattisgarh Govt. Average prices in
Eastern region remained flat QoQ despite being the best performing region on
demand front.
Region-wise prices
220
235
250
265
280
295
310
325
340
355
370
Apr-
16
May-
16
Jun-1
6Ju
l-16
Aug-1
6S
ep-1
6O
ct-16
Nov-
16D
ec-
16Ja
n-1
7F
eb-1
7M
ar-
17
Apr-
17
May-
17
Jun-1
7Ju
l-17
Aug-1
7S
ep-1
7O
ct-17
Nov-
17D
ec-
17Ja
n-1
8F
eb-1
8M
ar-
18
Apr-
18
May-
18
Jun-1
8Ju
l-18
Aug-1
8S
ep-1
8O
ct-18
Nov-
18D
ec-
18Ja
n-1
9F
eb-1
9M
ar-
19
Rs
/50k
g b
ag
North South West Central East
Source: Company, PL
Outlook
Among large caps, we continue to be positive on ACC due to its Pan-India presence
with a better regional mix and strong cost control. Backed by quality operations and
attractive valuations, stock trades at EV/t of US$105 of CY20e, significantly lower
than US$152 of UTCEM. We maintain BUY rating on the stock with TP of Rs1,735,
EV/EBITDA of 13x CY20e.
We prefer HeidelbergCement (HEIM) due to positive demand outlook in Central
region basis strong government spending on rural and affordable
housing/infrastructure sector and better sentiments compared to other regions.
Overall, led by strong outlook on Central region, efficiency improvements through
debottlenecking, quality operations and attractive valuations, we have BUY rating
on the stock with TP of Rs214, EV/EBITDA of 10x FY21e.

Cement
April 5, 2019 55
Q4FY19 Result Preview
Company Name Q4FY19E Q4FY18 YoY gr.
(%) Q3FY19
QoQ gr. (%)
Remark
ACC
Sales 38,258 35,570 7.6 37,886 1.0
Volume is expected to grow 4.5% YoY at 7.4m tonnes (t). Realisations are expected to improve by 3%/Rs146 YoY (+1.9%/Rs98/t QoQ) at Rs5,150/t. Due to lower input costs and better realisations, EBITDA/t is expected to expand 12.2%/Rs73 YoY at Rs670.
EBITDA 4,975 4,243 17.3 4,038 23.2
Margin (%) 13.0 11.9 10.7
Adj. PAT 3,120 2,504 24.6 2,471 26.3
Volume (mn te) 7.4 7.1 4.5 7.5 -0.9
Net Realisations (Rs/te) 5,149 5,003 2.9 5,051 1.9
EBITDA (Rs/te) 670 597 12.2 538 24.4
Ambuja Cement
Sales 29,545 27,630 6.9 27,650 6.9
Volume is expected to grow 4% YoY at 6.5m tonnes. Realisations are expected to expand by 2.8%/Rs125 YoY (+1.2%/Rs52/t QoQ) at Rs4,563/t. Due to higher realisations, EBITDA/t is expected to increase 7.8%/Rs51 YoY to Rs705.
EBITDA 4,567 4,075 12.1 3,056 49.5
Margin (%) 15.5 14.7 11.1
Adj. PAT 3,120 2,718 14.8 2,415 29.2
Volume (mn te) 6.5 6.2 4.0 6.1 5.6
Net Realisations (Rs/te) 4,563 4,438 2.8 4,511 1.2
EBITDA (Rs/te) 705 655 7.8 498 41.5
Heidelberg Cement
Sales 5,634 5,254 7.2 5,584 0.9
Volume is expected to grow 2.4% YoY at 1.3m tonnes. Realisations are expected to improve by 4.8%/Rs197 YoY (+0.4%/Rs18/t QoQ) at Rs4,334/t. Due to marginally increase in realisations, EBITDA/t is expected to expand by 6.2%/Rs56 YoY at Rs955.
EBITDA 1,242 1,143 8.7 1,133 9.7
Margin (%) 22.0 21.7 20.3
Adj. PAT 635 521 21.9 561 13.2
Volume (mn te) 1.3 1.3 2.4 1.3 0.5
Net Realisations (Rs/te) 4,334 4,137 4.8 4,315 0.4
EBITDA (Rs/te) 955 900 6.2 875 9.2
JK Lakshmi Cement
Sales 10,875 8,970 21.2 9,350 16.3
Volume is expected to increase 20% YoY at 2.7m tonnes due to low base. Realisations are expected to grow marginally 1%/Rs42/t YoY (flat QoQ) at Rs4,060/t. EBITDA/t is expected to increase 5.4%/Rs25 YoY at Rs478.
EBITDA 1,281 1,013 26.5 983 30.4
Margin (%) 11.8 11.3 10.5
Adj. PAT 360 338 6.3 148 144.0
Volume (mn te) 2.7 2.2 20.0 2.3 16.2
Net Realisations (Rs/te) 4,060 4,019 1.0 4,056 0.1
EBITDA (Rs/te) 478 454 5.4 426 12.2
Shree Cement
Sales 32,553 28,111 15.8 27,806 17.1
Cement volume is expected to grow 9.4% YoY at 7.1m tonnes. Realisations are expected to improve by 4.3% YoY/Rs179/t (+0.5%/Rs22/t QoQ) at Rs4,337. Due to increase in realisations, cement EBITDA/t is expected to expand 14.8% YoY/Rs141 to Rs1,096.
EBITDA 8,170 6,294 29.8 6,901 18.4
Margin (%) 25.1 22.4 24.8
Adj. PAT 3,896 3,993 (2.4) 2,813 38.5
Volume (mn te) - Cement 7.1 6.4 9.4 5.9 18.8
Volume (mn units) - Power 440 345 27.7 446 (1.4)
Net Realisations (Rs/te) 4,337 4,157 4.3 4,315 0.5
Realised rate (Rs/unit) 5 3.8 17.3 5.0 -9.2
Cement EBITDA (Rs/te) 1,096 955 14.8 1,067 2.7
The Ramco Cements
Sales 13,851 12,508 10.7 12,065 14.8
Volume is expected to grow 13% YoY at 3.1m tonnes. Realisations are expected to fall 2%/Rs91 YoY (+2%/Rs88 QoQ) at Rs4,480. Due to lower realisations and higher costs, EBITDA/t is expected to fall by 20.5%/Rs200 YoY at Rs780.
EBITDA 2,410 2,682 (10.1) 2,101 14.7
Margin (%) 17.4 21.4 17.4
Adj. PAT 1,204 1,374 (12.4) 1,011 19.1
Volume (mn te) 3.1 2.7 13.0 2.7 12.5
Net Realisations (Rs/te) 4,480 4,571 (2.0) 4,392 2.0
EBITDA (Rs/te) 780 980 (20.5) 765 1.9
UltraTech Cement
Sales 106,157 88,810 19.5 86,850 22.2 Blended realisations are expected to increase by 2%/Rs98 YoY (+1.2%/Rs57 QoQ) to Rs4,910/t. Grey cement volumes are expected to grow 17.5% YoY at 21.2m tonnes due to consolidation of acquired assets. On the back of higher costs, EBITDA/t is expected to fall 3.7%/Rs31 to Rs825.
EBITDA 17,846 15,813 12.9 12,624 41.4
Margin (%) 16.8 17.8 14.5
Adj. PAT 8,131 6,319 28.7 4,491 81.1
Volume (mn te) 21.2 18.1 17.5 17.5 21.0
Net Realisations (Rs/te) 4,909 4,811 2.0 4,852 1.2
EBITDA (Rs/te) 825 857 (3.7) 705 17.0
Source: Company, PL

Cement
April 5, 2019 56
Valuation Summary
Company Names Rating CMP (Rs)
TP (Rs) Sales (Rs bn) EBITDA (Rs bn) PAT (Rs bn) EPS (Rs) RoE (%) PE (x)
FY18 FY19E FY20E FY21E FY18 FY19E FY20E FY21E FY18 FY19E FY20E FY21E FY18 FY19E FY20E FY21E FY18 FY19E FY20E FY21E FY18 FY19E FY20E FY21E
ACC BUY 1,664 1,735 129.3 144.8 153.3 161.5 15.2 17.2 19.3 21.9 9.0 10.7 12.1 14.1 48.0 56.8 64.2 75.1 9.9 10.7 11.0 11.8 34.7 29.3 25.9 22.2
Ambuja Cement Hold 224 205 231.0 254.2 268.1 283.2 32.7 33.9 36.9 42.0 14.4 22.8 17.5 20.5 7.3 11.5 8.8 10.3 7.1 10.6 7.6 8.4 30.9 19.5 25.4 21.7
Heidelberg Cement India BUY 182 214 18.6 21.2 22.0 23.1 3.3 4.6 4.5 4.5 1.3 2.2 2.3 2.3 5.9 9.7 9.9 10.1 13.2 19.6 17.7 16.3 30.9 18.7 18.3 18.0
JK Lakshmi Cement Hold 357 320 34.1 36.6 39.6 41.5 4.1 4.1 4.9 5.2 0.8 0.9 1.5 1.9 7.1 7.5 12.8 16.1 5.9 5.9 9.4 10.8 50.1 47.4 27.8 22.2
Shree Cement Hold 18,950 16,824 98.1 116.9 130.2 144.0 24.5 27.7 31.5 34.5 13.8 14.5 16.9 19.5 397.3 416.8 485.6 560.7 16.7 15.3 15.6 15.8 47.7 45.5 39.0 33.8
The Ramco Cements Hold 759 654 43.2 49.8 57.2 66.0 10.1 9.4 10.9 12.6 5.6 5.1 6.1 6.7 23.6 21.7 25.8 28.3 14.3 12.0 12.8 12.6 32.2 34.9 29.4 26.8
Ultratech Cement Hold 4,190 3,725 309.7 372.5 469.1 501.3 57.1 60.7 78.3 85.5 26.2 22.5 29.1 35.9 95.5 82.1 100.9 124.3 10.3 8.2 9.0 9.4 43.9 51.1 41.5 33.7
Source: Company, PL

April 5, 2019 57
April 5, 2019
Top Picks
Crompton Greaves Consumer Electricals
Amnish Aggarwal
[email protected] | 91-22-66322233
Paarth Gala
[email protected] | 91-22-66322242
Consumer Durables
Jan-Mar’19 Earnings Preview
Inventory levels normalizing as brands offer a heavy discount: Though
extended winters have additionally compiled to RAC industry’s woes (poor summer
& subdued festive sales), the inventory levels have still managed to normalize since
brands started offering a heavy discount of ~20-30%. Due to this, the margins shall
be under pressure. However, for the upcoming summer season, brands have
launched new SKUs without any fresh discounts. Overall, intensity of upcoming
summer season and its ensuing demand will remain the key determinants for price
rise, if any.
Price erosion continues in LED battens; completive intensity high: Price
erosion continues in LED battens while prices of LED bulbs have stabilized. With
competitive intensity continuing to remain high, companies continue to innovate
(Crompton launched anti-bacterial bulbs) and focus on optimizing cost to improve
margins. Structurally the demand for LED’s continues to remain high as the
conversion rate to LED lighting stands at ~40%.
Q4FY19 Result Preview
Company Name Q4FY19E Q4FY18 YoY gr.
(%) Q3FY19
QoQ gr. (%)
Remark
Crompton Greaves Consumer Electricals
Sales 12,451 11,263 10.5 10,303 20.8 ECD to continue to grow on the back of strong performance in fans, pumps and further aided by product gaps filled in the appliances - revamped geyser portfolio to benefit from extended winters.
EBITDA 1,793 1,645 9.0 1,261 42.2
Margin (%) 14.4 14.6 12.2
Adj. PAT 1,137 1,032 10.2 797 42.8
Voltas
Sales 22,412 20,484 9.4 14,918 50.2 RAC Inventory in the channel brought down to 1 month by offering higher discounts. Although demand remains subdued in the north on account of extended winters, pickup in demand witnessed in the southern regions. Commodity pressures easing out, however inability to take price hikes shall hurt margins
EBITDA 2,519 2,532 (0.5) 1,157 117.8
Margin (%) 11.2 12.4 7.8
Adj. PAT 1,787 1,940 (7.9) 927 92.8
Source: Company, PL

Consumer Durables
April 5, 2019 58
Valuation Summary
Company Names Rating CMP (Rs)
TP (Rs) Sales (Rs m) EBITDA (Rs m) PAT (Rs m) EPS (Rs) RoE (%) PE (x)
FY18 FY19E FY20E FY21E FY18 FY19E FY20E FY21E FY18 FY19E FY20E FY21E FY18 FY19E FY20E FY21E FY18 FY19E FY20E FY21E FY18 FY19E FY20E FY21E
Crompton Greaves Consumer Electricals
Buy 232 272 40,797 45,171 52,070 59,361 5,310 5,965 7,076 8,073 3,238 3,746 4,570 5,392 5.2 6.0 7.3 8.6 49.5 41.1 38.6 35.4 44.8 38.8 31.8 26.9
Voltas Acc 609 600 64,044 73,024 80,424 88,845 6,626 7,193 8,042 8,885 5,718 5,588 6,365 7,208 17.3 16.9 19.2 21.8 15.9 13.6 14.0 14.3 35.3 36.1 31.7 28.0
Source: Company, PL

April 5, 2019 59
Consumer
Jan to Mar’19 Earnings Preview
Q4FY19 Adj. PAT to increase 22.2%; 31% excluding ITC
4Q is likely to show a steady performance with 14.2% increase in sales (17.4% in
3Q19) and 22.2% increase in PAT (13.8% in 3Q19) on a 4bps decline in EBIDTA
margin (75bps decline in 3Q19). Excluding ITC, the sales and Adj. PAT are
expected to increase by 14% and 31% respectively on 16bps EBITDA margin
expansion EBITDA margins.
Avenue Supermart, Titan, Jubilant FoodWorks, Marico and ITC are expected to
sustain the sales momentum. Raw materials remain a mixed bag with tailwinds for
Nestle, and HUVR. Jubilant Foodworks, Avenue Supermart, Asian paints and
Marico are expected to report a strong profit growth.
Rural distress and prolonged winters hit demand
Stable demand with signs of Rural distress: Despite elections being round the
corner, overall demand has remained stable QoQ on the back of tight liquidity and
rural distress witnessed in some pockets as against expectations of demand
acceleration. The Rural and Urban demand gap has been constantly narrowing post
2QFY19, with both now growing more or less at par.
Prolonged winters hampers sales: Prolonged winters and delay in onset of
summers has affected summer portfolio of companies. Generally, summer portfolio
is picked up by trade channels from mid Feb. However, this year the process has
been hampered by more than a month. We expect companies like Dabur (Juices)
and Emami (Personal care and other cooling products) are likely to be affected.
Elections and Smaller SKUs remain key: With elections round the corner,
government has announced various direct benefit schemes for farmers and poor
section of the society. Considering previous track records, rural demand for staples
and FMCG generally surges during the election phase. Hence companies have
started expanding their reach in Rural and Tier III cities while launching smaller
SKU products for catering to this price sensitive market. We believe that companies
like HUVR, BRIT, Emami etc., with higher share of rural distribution and more
offerings at smaller SKUs are likely to reap benefits from increased Rural demand.
Crude has softened; Raw material remains a mix bag
Brent Crude has softened 38.4% from the peak of USD86/barrel to the current
USD68/barrel bringing the 4QFY19 average to USD63/barrel (3QFY19
average at USD68/barrel). Consequently, most crude linked inputs have
declined in 4Q.
VAM prices (China) remained range-bound around USD1058/MT during entire
March’19. It is down by 14.7% YoY and 8.6% QoQ.
TiO2 prices have slid 0.4% to Rs 273/kg in last week of March’19 on the back
of stable crude prices. It had remained at Rs 274/kg level for entire 4Q19.
April 5, 2019
Top Picks
ITC
Titan Company
HUVR
Amnish Aggarwal
[email protected] | 91-22-66322233
Nishita Doshi
[email protected] | 91-22-66322381

Consumer
April 5, 2019 60
Wheat prices remained range bound for 4Q19 averaging at Rs2091/Quintal
levels, up 16.6% YoY and 1.7% QoQ
Sugar prices remain flattish QoQ and down 3% YoY. Barley prices took a sharp
dip of 12.1% in March’19 from Rs 1960/Quintal to now Rs 1722/Quintal. It is
up 29.7% YoY and remains flattish QoQ in 4Q19. We expect sugar and Barley
prices to remain benign.
Mentha prices have seen a sharp increase of 50% from the bottom which would
impact Emami’s raw material costs.
Export incentives had increased SMP prices by Rs20/- in Dec’18. It has
increased by 44.8% YoY and 16.5% QoQ.
Palm oil prices fell 18.4% in March’19 and made a bottom at Rs 30830/ton. It
remains down 14.5% YoY however up by 4% QoQ in 4QFY19.
Exhibit 1: Crude linked Commodities see softening in prices after Crude prices cooled
Input Price Trend
(Y-o-Y) Unit 52 Week H/L
Current Price
YoY change %
QoQ change %
Impact Companies (% of sales)
LAB Down INR/Kg 123/101 101 -4% -14.2% Positive HUL, Jyothy Labs
VAM Down USD/MT 1355/989 1058 -15.0% -9.0% Positive PIDI (6.4%)
HDPE Down INR/MT 94920/73012 74475 -12.7% -12.7% Positive All Companies (8-15%)
TiO2 Down INR/Kg 280/250 273 14% 3.4% Negative APNT (19%), Kansai Nerolac, and other paint companies
Source: PL, Bloomberg
Exhibit 2: Agri linked commodity remains a mixed bag
Input Price Trend
(Y-o-Y) Unit
52 Week H/L
Current Price
YoY change %
QoQ change %
Impact Companies (% of sales)
Mentha Oil Up INR/Kg 2010/1210 1815 11% -5.4% Negative YoY Emami (22%)
PFAD Acid Up INR/MT 40781/21893 32079 -21.4% 13.5% Positive YoY HUL (6.5%)
Palm Oil Down INR/MT 41958/29051 32024 -14.4% 4.1% Positive YoY Britannia (9%) , Nestle (3.5%), HUL
Sugar Flattish INR/Qtl 3395/2635 3145 -3.0% -0.3% Flattish Britannia (8.5%) , Nestle (2.5%) , GSK Consumer, Dabur, ITC
Wheat Up INR/Qtl 2120/1735 2060 16.9% 2.0% Negative Nestle (5%) , Britannia (14%), ITC
SMP Up Rs/kg 159/101 152 44.8% 16.5% Negative Nestle (5%) , GSK Consumer (5%)
Barley Up Rs/Quintal 1960/1366 1722 29.9% 0.7% Negative GSK Consumer (6%)
Source: PL, Bloomberg

Consumer
April 5, 2019 61
Exhibit 3: LAB prices decline in Dec’18 post softening of
crude prices, down 4.1% QoQ and 14.2% YoY
114.1
86.1
95.1
123
101
60
70
80
90
100
110
120
130
140
Aug-1
3N
ov-
13F
eb-1
4M
ay-
14
Aug-1
4N
ov-
14F
eb-1
5M
ay-
15
Aug-1
5N
ov-
15F
eb-1
6M
ay-
16
Aug-1
6N
ov-
16F
eb-1
7M
ay-
17
Aug-1
7N
ov-
17F
eb-1
8M
ay-
18
Aug-1
8N
ov-
18F
eb-1
9
(Rs
/Kg
)
Source: Bloomberg, PL
Exhibit 4: Wheat Prices have marginally increased QoQ, up
16.9% YoY
1,508
1,463
1,705
2,367
1,743
1,980 2,060
1,400
1,500
1,600
1,700
1,800
1,900
2,000
2,100
2,200
2,300
2,400
Mar-
14
Jun-1
4
Sep-1
4
Dec-
14M
ar-
15
Jun-1
5
Sep-1
5
Dec-
15
Mar-
16
Jun-1
6
Sep-1
6
Dec-
16M
ar-
17
Jun-1
7
Sep-1
7
Dec-
17M
ar-
18
Jun-1
8
Sep-1
8
Dec-
18M
ar-
19
(Rs
/ Q
uin
tal)
Source: Bloomberg, PL
Exhibit 5: PFAD prices have rallied from the bottom; down
21.4% YoY and up 13.5% QoQ
-28.9
-4.4
6.7
28.7
69.7
30.3
3.1 2.7
-6.9-15.3-13.7
-14.6-32.2
-21.4-40.0
-20.0
0.0
20.0
40.0
60.0
80.0
Dec-
15
Mar-
16
Jun-1
6
Sep-1
6
Dec-
16
Mar-
17
Jun-1
7
Sep-1
7
Dec-
17
Mar-
18
Jun-1
8
Sep-1
8
Dec-
18
Mar-
19
YoY QoQ
Source: Bloomberg, PL
Exhibit 6: Sugar prices remain benign. It is down 3% YoY and
remain flattish QoQ
3,145
2,200
2,400
2,600
2,800
3,000
3,200
3,400
3,600
3,800
4,000
4,200M
ar-
14
Jul-14
Nov-
14
Mar-
15
Jul-15
Nov-
15
Mar-
16
Jul-16
Nov-
16
Mar-
17
Jul-17
Nov-
17
Mar-
18
Jul-18
Nov-
18
Mar-
19
(Rs
/ Q
uin
tal)
Source: Bloomberg, PL
Exhibit 7: Mentha prices have softened a little yet remain at
high levels, up 11% YoY and down 5.4% QoQ
1700
1915
1715
1815
700
900
1100
1300
1500
1700
1900
2100
2300
Feb
-17
Apr
-17
Jun-
17
Aug
-17
Oct
-17
Dec
-17
Feb
-18
Apr
-18
Jun-
18
Aug
-18
Oct
-18
Dec
-18
Feb
-19
Mentha
Source: Bloomberg, PL
Exhibit 8: Tio2 price remained at Rs 274/kg entire quarter
post increasing to Rs 280/kg in Dec’18;
273
200
220
240
260
280
300
Apr
-16
Jul-
16
Oct
-16
Jan-
17
Apr
-17
Jul-
17
Oct
-17
Jan-
18
Apr
-18
Jul-
18
Oct
-18
Jan-
19
TiO2
Source: Bloomberg, PL

Consumer
April 5, 2019 62
Exhibit 9: VAM prices soften 23% from the peak in June’18
post softening in crude prices
956
1102 1168
1054
650
750
850
950
1050
1150
1250
1350
1450
May-
16
Jul-16
Sep-1
6
Nov-
16
Jan-1
7
Mar-
17
May-
17
Jul-17
Sep-1
7
Nov-
17
Jan-1
8
Mar-
18
May-
18
Jul-18
Sep-1
8
Nov-
18
Jan-1
9
US
D/M
T
Source: Bloomberg, PL
Exhibit 10: Gold prices continue to increase ahead of
wedding season, up 7% YoY and 4% QoQ
28905
31854
20000
22000
24000
26000
28000
30000
32000
34000
36000
Dec-
15
Mar-
16
Jun-1
6
Sep-1
6
Dec-
16
Mar-
17
Jun-1
7
Sep-1
7
Dec-
17
Mar-
18
Jun-1
8
Sep-1
8
Dec-
18
Mar-
19
(Rs
/ 10g
m)
Source: Bloomberg, PL
Exhibit 11: SMP price up 44.8% YoY and 16.5% QoQ
128.8
120.4107.5
129.4
152.4
80
90
100
110
120
130
140
150
160
170
Aug-1
5
Oct-15
Dec-
15
Feb
-16
Apr-
16
Jun-1
6
Aug-1
6
Oct-16
Dec-
16
Feb
-17
Apr-
17
Jun-1
7
Aug-1
7
Oct-17
Dec-
17
Feb
-18
Apr-
18
Jun-1
8
Aug-1
8
Oct-18
Dec-
18
Feb
-19
(Rs
/ K
g)
Source: Bloomberg, PL
Exhibit 12: Barley price up 29% YoY and flattish QoQ
1,615
1,794
1,478 1,479 1,620
1,651
1,917
1,200
1,300
1,400
1,500
1,600
1,700
1,800
1,900
2,000M
ay-
16
Jul-16
Aug-1
6O
ct-16
Nov-
16D
ec-
16F
eb-1
7M
ar-
17
May-
17
Jun-1
7A
ug-1
7S
ep-1
7N
ov-
17D
ec-
17F
eb-1
8M
ar-
18
May-
18
Jun-1
8A
ug-1
8S
ep-1
8N
ov-
18D
ec-
18
(Rs
/ Q
uin
tal)
Source: Bloomberg, PL
Exhibit 13: APNT, MRCO, JUBI and TTAN is expected to report healthy volume growth
Volume growth (%) 4QFY17 1QFY18 2QFY18 3QFY18 4QFY18 1QFY19 2QFY19 3QFY19 4QFY19E
Asian Paints 11.0 3.0 9.0 7.5 10.5 12.0 11.0 24.0 14.5
Britannia 2.0 2.5 6.0 13.0 13.0 13.0 12.0 7.0 8.5
Colgate (3.0) (5.0) (0.9) 12.0 4.0 4.0 7.0 7.0 6.5
Dabur India 2.4 (4.4) 7.2 13.0 7.7 21.0 8.1 12.4 9.0
GSK Consumer (1.0) (6.5) 2.5 17.0 8.0 12.8 13.7 9.6 9.0
ITC (Cigarettes) 0.0 1.5 (7.0) (5.0) (2.5) 1.5 6.0 7.5 5.0
HUVR 4.0 0.0 4.0 11.0 11.0 12.0 10.0 10.0 8.5
Kansai Nerolac 14.9 10.0 18.0 14.5 14.5 15.0 9.0 15.0 11.0
MRCO - Parachute 15.0 (9.0) 12.0 15.0 (5.0) 9.0 8.0 9.0 12.0
- Saffola 6.0 (9.0) 3.0 0.0 (1.0) 10.0 5.0 2.0 3.0
- Hair Oil 10.0 (8.0) 12.0 8.0 11.0 15.0 5.0 7.0 8.0
Pidilite (C&B) 8.2 (0.1) 12.0 23.0 14.0 18.0 9.6 10.8 10.0
Titan - Jewellery 37.0 49.0 49.0 6.0 6.0 (3.0) 24.0 34.0 32.0
Jubilant (Dominos) (7.5) 6.5 5.5 17.8 26.5 26.5 20.5 14.6 13.5
Future Retail 13.3 11.8 10.2 10.4 6.0 3.6 5.9 5.9 6.0
Source: Company, PL

Consumer
April 5, 2019 63
Top Pick: ITC, HUVR and Titan Company
ITC: ITC continues to trade at ~40% discount to consumer universe given investor
fears of frequent increase in GST rates of cigarettes right from introduction of GST
and 20% increase in excise. Compensation cess collections have already exceeded
the budgeted expectations thereby removing the urgency to increase taxes on
cigarettes in the near term. Cigarette volumes are gradually recovering on
stabilization of sales mix, stable taxation regime and low base. Post 2 years of
stable pricing, ITC has recently hiked prices of select cigarette brands which
enhances our confidence on the company’s ability to take price increase. We expect
3% volume growth in FY18-20. FMCG profits are expected to increase by 2-3x in
coming few years given scaled up foods business and peaked out losses in lifestyle
retailing. Paperboard margins are expected to improve on benign input costs, gains
of refurbishment of Décor machine and revamp of 1.5lakh TPA value added
paperboard machine. While Agri is likely to remain under pressure, INR
depreciation should provide some relief. Hotels profitability is likely to improve on
higher ARR and occupancy and growth in F&B sales. Retain Buy at 23.4xFY21
EPS, ~65% dividend payout with 2.2% dividend yield. Maintain BUY.
Titan Company: Titan is creating building blocks to achieve Vision 2023 with focus
on factors like Digital, Youth and GEN-A, Omni channel, Rural India,
Premiumisation, rising affluence and emerging women power. The conversion of
Gold plus stores into Tanishq and the shift to organized sector led by fear of buying
from unknown and without bills will foster sales growth in FY19. Watch business is
on steady recovery post restructuring and investment since a couple of years which
has started yielding results. Eyewear business has seen strong traction and is on
track to achieve 3.7mn customers in FY19 and 5mn in FY20, benefits of backward
integration and scale should enable profitable growth by FY20. The significant
increase in ad-spend would increase pressure on margins in the near term. With
the expectations of 25.8% PAT CAGR over FY19-21, we value the stock at
45xDec20 EPS and arrive at a target price of Rs1195 given the good growth outlook
and strong tailwinds. Maintain BUY.
Hindustan Unilever: HUVR remains one of the key consumer stocks to gain from
1) expected pick‐up in rural demand during elections 2) lower GST rates on more
than 2/3rd of its portfolio and 3) benefits from sustained cost‐savings programs.
HUVR should drive a strong growth, given comprehensive portfolio across
categories and price points, right to win in emerging categories, significant
distribution expansion in low penetration states of North and Central India (WIMI –
20% of the market which is growing at 1.5x rate) and strong push in high growth
natural segment. We estimate 16% EBITDA CAGR and 15.2% PAT CAGR over
FY19‐21. Maintain “Hold”.

Consumer
April 5, 2019 64
Exhibit 14: Q4FY19 Result Preview
Company Name Q4FY19E Q4FY18 YoY gr.
(%) Q3FY19
QoQ gr. (%)
Remark
Asian Paints
Sales 51,334 44,836 14.5 52,940 (3.0)
Demand momentum continues post GST rate reduction. Recent price increases in Oct'18 and Dec'18 would enable margin expansion.
EBITDA 9,925 8,399 18.2 10,430 (4.8)
Margin (%) 19.3 18.7 19.7
Adj. PAT 5,879 4,959 18.5 6,356 (7.5)
Volume Growth (%) 14.5 10.5 24.0
Britannia Industries
Sales 26,638 23,884 11.5 27,032 (1.5) We believe that rural slowdown to dampen volume growth of BRIT. Raw material has been benign YoY and would aid gross margin expansion of 190bps. However, EBITDA margin would remain flat on increased ad-spends
EBITDA 4,147 3,699 12.1 4,463 (7.1)
Margin (%) 15.6 15.5 16.5
Adj. PAT 2,763 2,447 12.9 3,027 (8.7)
Gross Margin (%) 39.5 37.6 41.1
Volume Growth (%) 8.5 12.0 7.0
Colgate Palmolive
Sales 11,572 10,917 6.0 10,994 5.3 Demand remains stable QoQ as against the expected Rural demand pickup. Competitive activity remains high as Patanjali has been aggressive in Ad-spends. Watch out for toothpaste market share
EBITDA 3,353 3,075 9.0 3,145 6.6
Margin (%) 29.0 28.2 28.6
Adj. PAT 2,095 1,826 14.7 1,831 14.4
Volume Growth (%) 6.5 4.0 7.0
Dabur India
Sales 22,173 20,329 9.1 21,992 0.8 Demand has slowed down in some pockets of Rural. Prolonged winter has resulted in poor performance in Juices. Competitive intensity in Oral care and Juices remain high.
EBITDA 5,173 4,852 6.6 4,454 16.2
Margin (%) 23.3 23.9 20.3
Adj. PAT 4,294 3,972 8.1 3,672 16.9
Volume Growth (%) 9.0 7.7 12.4
Avenue Supermarts
Sales 49,266 38,100 29.3 54,509 (9.6) D'Mart is estimated to report 29.3% sales growth and 24.6% PAT growth as the focus on Low Cost Low Price strategy continues. We estimate significant acceleration in store openings as it has opened only 9 stores in 9MFY19
EBITDA 3,964 2,945 34.6 4,533 (12.6)
Margin (%) 8.0 7.7 8.3
Adj. PAT 2,082 1,671 24.6 2,571 (19.0)
Cost of Retail (%) 6.6 7.1 6.4
Number of Stores added 18.0 14.0 4.0
Future Retail
Sales 51,281 45,747 12.1 53,011 (3.3)
We expect 9% SSG growth in Big Bazaar as demand situation is steadily improving. We expect Hypercity performance to improve QoQ though EasyDay will still take time to achieve EBITDA breakeven.
EBITDA 2,635 2,015 30.8 2,778 (5.2)
Margin (%) 5.1 4.4 5.2
Adj. PAT 1,920 (4,636) (141.4) 2,014 (4.7)
SSG % 6.0 6.0 5.9
Big Bazaar SSG % 9.0 11.0 10.1
Cost of Retail (%) 22.2 22.6 20.8
Emami
Sales 6,514 6,170 5.6 8,109 (19.7) We expect muted volume growth of 3.5% as extended winters have hampered demand of summer portfolio. We expect gross margins to decline as Mentha prices continue to remain at elevated levels.
EBITDA 1,724 1,733 (0.5) 2,665 (35.3)
Margin (%) 26.5 28.1 32.9
Adj. PAT 675 597 13.1 1,476 (54.2)
Volume Growth (%) 3.5 9.0 3.5
Hindustan Unilever
Sales 100,937 90,970 11.0 95,580 5.6 We estimate 8.5% volume growth due to slowdown in rural demand. Crude prices have moderated QoQ and food inflation is picking up. Price increase has been taken for Skin care and Face wash to maintain margins.
EBITDA 23,254 20,480 13.5 20,460 13.7
Margin (%) 23.0 22.5 21.4
Adj. PAT 16,118 14,090 14.4 14,010 15.0
Volume Growth (%) 8.5 11.0 10.0
ITC
Sales 122,040 105,867 15.3 112,277 8.7
We estimate healthy cigarette volume growth on demand momentum and low base. Price increases in select brands from March to improve profitability.
EBITDA 46,584 41,440 12.4 43,258 7.7
Margin (%) 38.2 39.1 38.5
Adj. PAT 32,300 29,327 10.1 32,091 0.7
Cigarette Volume Growth (%) 5.0 (2.5) 7.5
Cigarette EBIT Growth (%) 9.1 7.6 8.8
FMCG EBIT 1,209 912 767

Consumer
April 5, 2019 65
Company Name Q4FY19E Q4FY18 YoY gr.
(%) Q3FY19
QoQ gr. (%)
Remark
Jubilant FoodWorks
Sales 9,047 7,798 16.0 9,291 (2.6) JUBI has launched 10 different Pizza variants to boost sales of the ongoing IPL season. Gains from EDV offer and new innovations to deliver 13.5% SSG growth despite a high base. We estimate 39 store openings in 4Q in-line with the guided 75 openings in FY19.
EBITDA 1,618 1,278 26.6 1,706 (5.1)
Margin (%) 17.9 16.4 18.4
Adj. PAT 862 681 26.6 965 (10.7)
SSG % 13.5 26.5 14.6
Dominos Stores 1,239 1,134 1,200
Kansai Nerolac Paints
Sales 12,582 11,036 14.0 13,507 (6.8) We estimate Decorative demand momentum to continue on the back of GST rate cuts. Recent slowdown in Auto sector shall impact Industrial paints. We estimate Gross margin to decline on higher input costs, INR depreciation and lag in taking price increases in Industrial paints.
EBITDA 1,761 1,689 4.2 1,770 (0.5)
Margin (%) 14.0 15.3 13.1
Adj. PAT 1,134 1,058 7.2 1,127 0.6
Volume Growth (%) 11.0 14.5 15.0
Gross Margin (%) 36.0 38.0 34.5
Marico
Sales 17,127 14,801 15.7 18,610 (8.0)
We estimate 6% India and 12% parachute volume growth on a low base. We expect gross margins to expand given recent softening Copra prices. Watch out for any price cuts taken in Parachute
EBITDA 3,161 2,523 25.3 3,489 (9.4)
Margin (%) 18.5 17.0 18.8
Adj. PAT 2,169 1,832 18.4 2,517 (13.8)
Parachute Volume Growth % 12.0 (5.0) 9.0
Volume Growth (%) 6.0 1.0 5.0
Saffola Vol Gr (%) 3.0 (1.0) 2.0
VAHO Vol Gr (%) 8.0 11.0 7.0
Nestle India
Sales 30,330 27,572 10.0 28,973 4.7 We estimate demand momentum of CY18 to continue in CY19 with sustained traction in Maggi and recovery in chocolates. Innovations and new launches to aid growth.
EBITDA 7,734 7,119 8.6 6,137 26.0
Margin (%) 25.5 25.8 21.2
Adj. PAT 4,937 4,391 12.4 4,049 21.9
Pidilite Industries
Sales 14,278 12,736 12.1 15,897 (10.2) Estimate 10% overall volume growth and in Consumer and Bazaar products. Prolonged winters had no significant impact. Input costs are expected to remain soft on stable currency rate.
EBITDA 3,097 2,552 21.4 3,259 (5.0)
Margin (%) 21.7 20.0 20.5
Adj. PAT 2,198 1,917 14.7 2,247 (2.2)
Volume Growth (%) 10.0 13.0 10.8
GlaxoSmithKline Consumer Healthcare
Sales 13,000 11,796 10.2 11,168 16.4
We estimate 9% volume on sustained demand momentum. Market share remains key factor to watch.
EBITDA 2,810 2,500 12.4 2,385 17.8
Margin (%) 21.6 21.2 21.4
Adj. PAT 2,258 2,118 6.6 2,211 2.1
Volume Growth (%) 9.0 8.0 9.6
Titan Company
Sales 46,518 39,168 18.8 56,722 (18.0) Though Industry consumption demand remained weak on increasing Gold prices and financing issues, we expect good performance led by market share gain from unorganised players and traction form product activations. We expect Titan to continue the pace of its store openings.
EBITDA 5,486 4,554 20.5 6,542 (16.2)
Margin (%) 11.8 11.6 11.5
Adj. PAT 3,720 3,628 2.5 4,862 (23.5)
Jewellery Volume Growth (%) 13.5 6.0 34.0
Jewellery Margins (%) 13.3 13.7 11.0
Watch Volume Growth (%) 7.0 (1.0) 16.0
Watch Margins (%) 8.5 7.1 18.4
Source: Company, PL

Consumer
April 5, 2019 66
Exhibit 15: Valuation Summary
Company Names Rating CMP (Rs)
TP (Rs) Sales (Rs bn) EBITDA (Rs bn) PAT (Rs bn) EPS (Rs) RoE (%) PE (x)
FY18 FY19E FY20E FY21E FY18 FY19E FY20E FY21E FY18 FY19E FY20E FY21E FY18 FY19E FY20E FY21E FY18 FY19E FY20E FY21E FY18 FY19E FY20E FY21E
Asian Paints Acc 1,514 1,480 168.2 194.6 221.2 254.2 32.0 36.9 43.6 52.4 19.7 22.7 27.1 32.8 20.6 23.7 28.3 34.2 24.7 25.1 26.1 27.4 73.6 63.9 53.5 44.3
Britannia Industries Acc 2,994 3,142 93.0 104.8 120.6 138.8 14.3 16.5 19.7 23.4 9.6 11.1 12.8 15.5 40.0 46.2 53.5 64.7 33.1 35.0 36.3 34.7 74.8 64.8 56.0 46.3
Colgate Palmolive Hold 1,227 1,258 41.9 44.7 49.4 55.0 11.1 12.6 13.9 15.5 6.6 7.4 8.2 9.4 24.2 27.4 30.3 34.5 47.1 46.9 47.5 49.8 50.6 44.8 40.5 35.6
Dabur India Hold 400 454 77.2 86.2 96.1 108.6 16.2 18.0 21.1 24.6 13.7 15.0 17.6 20.9 7.8 8.5 10.0 11.9 25.9 25.9 27.4 27.5 51.5 46.9 40.0 33.8
Avenue Supermarts Reduce 1,449 1,270 150.3 198.1 256.6 329.4 13.5 16.6 23.2 32.1 7.7 9.4 13.5 19.0 12.3 15.1 21.6 30.4 18.0 18.6 22.3 25.4 117.8 96.1 67.2 47.6
Future Retail BUY 446 554 184.8 199.0 231.2 267.6 8.3 10.1 12.5 15.2 6.2 7.2 9.6 9.2 12.3 14.4 19.1 18.2 21.8 21.2 23.3 18.9 36.4 31.0 23.3 24.4
Emami Acc 412 484 25.3 27.0 30.3 33.9 7.2 7.5 8.5 9.7 5.1 5.1 6.0 7.0 22.3 11.3 13.3 15.4 26.8 24.7 27.0 28.8 18.5 36.4 31.1 26.8
Hindustan Unilever Hold 1,659 1,854 345.3 383.7 426.6 475.2 72.8 86.4 99.1 113.6 53.0 61.0 70.5 81.0 24.5 28.2 32.6 37.3 78.1 86.3 99.3 112.1 67.6 58.7 50.9 44.5
ITC BUY 295 362 406.3 452.1 495.5 541.5 155.4 173.9 201.4 224.7 112.2 122.1 140.9 157.8 9.2 10.0 11.4 12.7 23.2 22.5 23.5 23.8 32.0 29.6 25.8 23.1
Jubilant FoodWorks Acc 1,418 1,458 29.8 35.7 40.6 48.1 4.5 6.2 7.2 8.6 2.1 3.4 4.0 5.1 31.3 25.4 30.5 38.3 21.8 28.6 27.8 28.2 45.3 55.8 46.5 37.0
Kansai Nerolac Paints Acc 467 498 45.9 52.8 59.7 68.9 7.9 7.7 9.3 11.1 5.2 4.9 5.8 7.0 9.6 9.1 10.7 12.9 17.4 15.0 16.2 17.7 48.8 51.6 43.6 36.1
Marico HOLD 357 371 63.2 74.4 83.6 94.1 11.4 13.1 16.7 18.4 8.1 9.4 11.7 12.9 6.3 7.3 9.1 10.0 33.5 35.5 40.1 40.2 56.5 48.9 39.4 35.7
Nestle India Acc 10,981 10,828 100.1 112.9 126.7 141.9 22.2 26.8 30.6 34.9 13.5 16.7 19.5 22.7 140.0 173.5 202.6 235.4 40.3 47.2 48.3 48.2 78.4 63.3 54.2 46.6
Pidilite Industries Acc 1,287 1,163 53.5 61.4 71.0 81.6 12.9 13.4 16.2 18.8 9.6 9.6 11.6 13.4 18.8 18.8 22.8 26.5 27.4 24.8 25.6 25.3 68.4 68.3 56.4 48.6
GlaxoSmithKline Consumer Healthcare
Hold 6,996 8,139 43.1 48.0 53.9 60.8 8.7 11.0 12.8 14.4 7.0 9.2 9.9 11.1 166.5 219.4 235.7 264.4 21.2 24.6 23.1 22.9 42.0 31.9 29.7 26.5
Titan Company BUY 1,106 1,195 156.2 190.5 228.2 274.0 17.4 22.1 27.8 34.8 12.5 15.6 19.8 25.0 14.1 17.6 22.3 28.2 26.4 27.1 28.0 28.9 78.3 62.9 49.7 39.3
Source: Company, PL

April 5, 2019 67
April 5, 2019
Jinesh Joshi
[email protected] | 91-22-66322238
Education
Jan-Mar ‘19 Earnings Preview
4QFY19 will be more or less a non-event for Navneet (derives 50-55% of sales in
1Q). However, S Chand would be in focus since it derives 75-80% of sales in 4Q.
Rising share of exports and syllabus changes in Gujarat & Maharashtra is expected
to aid growth for Navneet. However, for S Chand, the growth is expected to be tepid
as focus has now shifted to cash flow management in order to improve the working
capital cycle.
Q4FY19 Result Preview
Company Name Q4FY19E Q4FY18 YoY gr.
(%) Q3FY19
QoQ gr. (%)
Remark
Navneet Education
Sales 2,237 2,126 5.2 1,816 23.2 Backed by steady double digit growth in publishing aided by syllabus changes in the states of Gujarat & Maharashtra and strong visibility for stationery export orders we expect top-line growth to be in the region of 5% in a seasonally lean quarter.
EBITDA 291 238 22.3 157 85.3
Margin (%) 13.0 11.2 8.6
Adj. PAT 163 151 8.4 75 116.5
S Chand and Company (Standalone)
Sales 2,662 2,511 6.0 28 NM Focus on cash flow management and tightening of credit terms is expected to result in single digit top-line growth. EBITDA margin is expected to decline marginally due to loss of operating leverage resulting from lower growth partially offset by locking in paper inventory at ~5-6% higher value (rise in paper prices in open market is higher).
EBITDA 1,137 1,084 4.9 -277 NM
Margin (%) 42.7 43.2 NM
Adj. PAT 729 746 (2.3) -94 NM
Source: Company, PL

Education
April 5, 2019 68
Valuation Summary
Company Names Rating CMP (Rs)
TP (Rs) Sales (Rs m) EBITDA (Rs m) PAT (Rs m) EPS (Rs) RoE (%) PE (x)
FY18 FY19E FY20E FY21E FY18 FY19E FY20E FY21E FY18 FY19E FY20E FY21E FY18 FY19E FY20E FY21E FY18 FY19E FY20E FY21E FY18 FY19E FY20E FY21E
Navneet Education BUY 110 157 12,040 14,039 15,798 17,810 2,225 2,780 3,208 3,648 1,270 1,715 1,996 2,261 5.4 7.5 8.7 9.9 17.6 21.4 22.1 22.2 20.2 14.7 12.6 11.1
S Chand and Company HOLD 180 234 7,944 8,426 9,110 9,927 1,927 1,898 2,029 2,178 1,072 864 1,021 1,101 30.7 24.7 29.2 31.5 13.1 8.3 9.1 9.0 5.9 7.3 6.2 5.7
Source: Company, PL

April 5, 2019 69
Financial Services
Jan-Mar’19 Earnings Preview
After largely mirroring the Q3FY19 trends, Q4FY19 should also prove to be a
somber quarter on loans and margins with elevated funding costs but should
be offset to an extent by the improving credit costs. While recalibration of
balance sheets stands imminent for NBFCs, the risk perception continues to
hurt the earnings and multiples likewise. We are positive on HDFC, CIFC for
their steady performance across key parameters, and remain cautiously
optimistic on SHTF from our NBFC coverage universe.
Tightened liquidity concerns are now concluded due to RBI’s timely
intervention (OMOs, FX swaps) however increased risk perception continues
to haunt investors interest into NBFCs. We strongly believe, it is time for
recalibration of both asset and liability side of balance sheets for NBFCs to
limit credit risks and combat liquidity cycles.
While cautious lending towards MSME, real estate, LAP and higher ticket
wholesale exposures have resulted into slower disbursements, NBFCs have
been adopting retailization of balance sheets limiting credit risks. With
increased competition from banks, NBFCs now have to focus on
diversification of assets.
On the liability side - overseas borrowings and co-lending with banks and
securitization shall continue to support funding structure for NBFCs. With the
diminishing reliance on capital market instruments, bank term loans too have
been coming at elevated rates. While policy rates are expected to soften and
inflation turning relatively benign, funding costs pressures have taken a
breather.
Q4FY19 should witness improving credit costs offsetting the benign credit
growth and soft margins for NBFCs. Headwinds in the form of elections and
aftermath, not so desirable demand scenario in the CV and RE space prompt
us to place confidence on large caps with strong management pedigree and
hence place our bets on HDFC, Bajaj Finance. While, we derive greater
confidence in diversified vehicle finance business model like CIFC, the
valuations run-up would imply tad consolidation in momentum there. We also
like SHTF at compelling valuations of 1.4x FY21E P/BV that adequately price-
in most of the current apprehensions and hence, we reiterate BUY with a price
target at Rs1,568.
Growth should be somber: Underscored by tough market conditions,
competitive intensities on retail side and higher diligence on lending to certain
business segments, we reckon NBFCs to clock 6% sequential loan growth and
15% YoY for Q4FY19 across our coverage universe.
Costs pressures up, NIMs soft: Recalibration of funding mix with higher
share of bank term loans, securitization & external borrowings should take
precedence. Q4FY19 is expected to see 30-40 bps increase in incremental
funding costs as against 60-80bps incremental increase in funding costs
for Q3FY19. Margins, therefore, look weaker YoY while for QoQ remains
flattish given the lending rate transmission by most NBFCs and renewed
liquidity conditions.
April 5, 2019
Top Picks
HDFC Ltd
Shriram Transport Finance Company
Cholamandalam Investment Finance Company
Shweta Daptardar
[email protected] | 91-22-66322245
Prabal Gandhi
[email protected] | 91-22-66322258

Financial Services
April 5, 2019 70
Credit costs improve: With INDAS accounting normalizing, we expect credit
costs to increase mere 5 bps YoY led by improved recoveries in seasonally
strong quarter across our coverage universe. Q4 improved credit costs’ trends
should also help offset the NIM and growth pressures.
CIFC to outperform; SHTF at compelling valuations: Under PL NBFC
universe, we expect CIFC/LTFH to witness robust business traction (17-18%
YoY) followed by MMFS (16% YoY). While HFCs continue to lose market share
to private banks, HDFC maintains strong positioning with an expectation to
clock 16% YoY growth, LICHF to report 14.6% loan growth largely supported
by LAP/developer disbursements and retail loans run-rate catching up well too.
We expect moderation in growth trends for SHTF at 13.3% YoY growth. While
credit costs YoY should improve across coverage universe, we expect MMFS
to report sharper recoveries for Q4FY19 as rural market holds up. We reckon
CIFC to clock healthy performance across key operational parameters for
Q4FY19 from the PL, NBFC Universe. We also find SHTF attractive at
compelling valuations of 1.4x FY21E P/BV that adequately price-in most
of the current apprehensions, we reiterate BUY with a price target at
Rs1,568 valuing SHTF at 1.8x Mar-21 ABV. Consistent rural demand for
used CV & used CV replacement cycle remaining intact provides a
business stability.
Change in Estimates & PTs for BFSI
HDFC - TP increase: We fine-tune HDFC estimates to incorporate slightly
higher funding costs, however should be offset by improved recoveries and
investment income aiding operating profit over FY20-21. Consolidation in small
HFCs and market share gains, should imply steady business and improved
RoEs trends for FY20-21E. We are watchful of key developer/ILFS exposures.
We roll over our TP to Mar’21 Rs2,275 (from Rs 2,265) based on SOTP valuing
core book at 2.6x Mar-21 ABV.
MMFS – TP maintained: While we roll over our TP on MMFS to Mar’21E ABV
to Rs 519 (from Rs 516) and continue to value at 3.1x multiple as part of SoTP,
we do incorporate certain sluggishness on vehicle business in terms of growth.
Having said that, better recoveries with expectations of improved rural farm
income should support PAT and we maintain ACCUMULATE stance.
Two of NBFC universe stocks met their target prices; CIFC and LICHF
LICHF – We incorporate stable lending yields and margins with steady-state
16% loan growth as there lies scope for individual growth improvement ahead.
Also, we recent price momentum, we step-up valuation multiple to 1.7x (1.5x)
and roll over TP to Mar-21E to Rs 597 (earlier Rs 537). However, we remain
watchful of sustainable strong business and earnings trends. Reiterate
ACCUMULATE
CIFC – Superior performance across key business parameters and prudent
asset quality management has also been reflecting into increased trading
multiples that the company enjoy (3.5x PABV FY20E, 2.9x PABV FY21E).
While the stock momentum has caught up well and key positives building in
price, we trim the target multiple slightly to 3.2x (3.3x earlier) and roll over our
TP to Mar’21 PBV estimates to Rs 1,666. Having said that, we reiterate BUY
as CIFC remains as one of the better placed auto financiers sailing
successfully across credit and liquidity cycles with clear execution skills.

Financial Services
April 5, 2019 71
Change in Estimates
Banks Rs (mn) Old estimates Revised estimates % change
FY20E FY21E FY20E FY21E FY20E FY21E
HDFC
NII 1,43,080 1,69,591 1,48,470 1,76,609 3.8 4.1
PPOP 1,65,274 1,91,834 1,76,170 2,04,093 6.6 6.4
PAT 1,10,976 1,28,753 1,12,588 1,30,267 1.5 1.2
ABV 453.9 504.3 451.8 503.1 (0.5) (0.2)
MMFS
NII 53,542 64,267 55,066 64,553 2.8 0.4
PPOP 36,348 44,639 38,243 46,249 5.2 3.6
PAT 15,867 19,335 16,170 19,305 1.9 (0.2)
ABV 129.1 151.9 127.6 149.5 (1.2) (1.6)
LICHF
NII 49,960 57,893 51,844 59,702 3.8 3.1
PPOP 44,225 51,264 46,183 53,249 4.4 3.9
PAT 25,915 29,449 26,685 30,759 3.0 4.4
ABV 301.5 350.6 308.4 359.9 2.3 2.6
CIFC
NII 42,842 49,407 41,310 49,407 (4) -
PPOP 26,600 30,048 25,615 30,048 (4) -
PAT 14,702 16,020 14,065 16,020 (4) -
ABV 442.6 516.1 435.9 516.1 (2) -
Source: PL
Valuation Summary for PL NBFC Coverage
Coverage Universe Rating MCap (Rs B)
CMP (Rs)
Old PT (Rs)
New PT
(Rs)
Upside (%)
P/ABV (x) RoE (%)
FY18 FY19E FY20E FY18 FY19E FY20E
Cholamandalam BUY 232 1,484 1,562 1,666 12.2 4.1 3.5 3.5 21.3 20.4 20.4
LTFH ACC 304 152 172 172 13.2 3.0 2.4 2.0 23.6 20.8 19.3
HDFC BUY 3,545 2,059 2,265 2,275 10.5 2.6 2.4 2.1 14.5 15.4 16.1
LIC Housing Finance ACC 278 550 537 597 8.5 2.0 1.8 1.5 17.0 17.1 17.2
MMFS ACC 257 416 516 519 24.6 3.3 2.8 2.4 14.3 15.3 16.4
Shriram Transport BUY 278 1,224 1,657 1,568 28.2 2.0 1.6 1.4 16.2 17.2 17.2
Source: Company, PL
Q4FY19 Results Preview (Rs m) – Decent PPOP performance; earnings to be skewed on INDAS adjustments
Rs Million NII YoY QoQ PPOP YoY QoQ PAT YoY QoQ
HDFC 29,740 -7.4% 3.6% 42,955 16.2% 43.9% 27,435 -3.6% 29.8%
LIC Housing 11,240 12.0% 3.7% 8,502 -1.9% -14.0% 5,739 6.4% -3.3%
MMFSL 12,535 -3.9% 4.1% 9,198 11.4% 23.6% 4,097 -3.5% 28.6%
Shriram Tran. 20,809 15.1% 2.1% 17,730 13.7% 9.4% 6,134 324.2% -3.5%
Cholamandalam 9,365 11.2% 7.1% 5,577 20.0% -0.2% 3,550 18.3% 16.6%
LTFH 14,012 6.9% 1.6% 13,605 31.6% 14.2% 6,193 51.4% 6.6%
Total NBFCs (Incl HFCs) 97,701 3.1% 3.4% 97,567 15.5% 20.6% 53,148 14.0% 16.9%
Rs Billion Loans YoY QoQ Margins YoY QoQ Credit Cost YoY QoQ
HDFC 4,156 15.6% 7.8% 2.80% -1.20% 0.10% 0.75% 0.55% 0.63%
LIC Housing 1,906 14.6% 4.9% 2.42% -0.07% 0.09% 0.16% 0.09% -0.13%
MMFSL 647 16.0% 2.6% 7.85% -1.86% -0.01% 1.67% 0.54% 0.24%
Shriram Tran. 1,093 13.3% 5.3% 7.81% 0.10% -0.02% 3.36% -2.31% 0.91%
Chola 516 18.3% 2.3% 7.35% -0.81% 0.22% 0.64% 0.64% 0.64%
LTFH 978 16.9% 4.3% 5.85% -0.65% -0.09% 2.29% 0.02% 0.51%
NBFCs 9,295 15.4% 5.8% 5.68% -0.75% 0.05% 1.16% -4.22% -0.88%
Source: Company, PL

Financial Services
April 5, 2019 72
Margins in Q4FY19E decline 75bps YoY as costs pressures persist
Q4FY18 Q3FY19 Q4FY19E YoY QoQ
HDFC 4.00% 2.70% 2.80% -1.20% 0.10%
LIC Housing 2.49% 2.33% 2.42% -0.07% 0.09%
MMFSL 9.71% 7.86% 7.85% -1.86% -0.01%
Shriram Tran. 7.72% 7.83% 7.81% 0.10% -0.02%
Cholamandalam 8.16% 7.13% 7.35% -0.81% 0.22%
LTFH 6.50% 5.94% 5.85% -0.65% -0.09%
Source: Company, PL
INDAS provisioning normalizing; Q4 credit costs trend better
Q4FY18 Q3FY19 Q4FY19E YoY QoQ
HDFC 0.20% 0.12% 0.75% 0.55% 0.63%
LIC Housing 0.07% 0.29% 0.16% 0.09% -0.13%
MMFSL 1.13% 1.43% 1.67% 0.54% 0.24%
Shriram Tran. 5.67% 2.45% 3.36% -2.31% 0.91%
Cholamandalam 0.11% 0.76% 0.64% 0.53% -0.12%
LTFH 2.27% 1.78% 2.29% 0.02% 0.51%
Source: Company, PL
Benchmark G-sec yields have been stable
7.429
7.324
6.0
6.5
7.0
7.5
8.0
8.5
9.0
9.5
Mar-
12
Jul-12
Nov-
12
Mar-
13
Jul-13
Nov-
13
Mar-
14
Jul-14
Nov-
14
Mar-
15
Jul-15
Nov-
15
Mar-
16
Jul-16
Nov-
16
Mar-
17
Jul-17
Nov-
17
Mar-
18
Jul-18
Nov-
18
Mar-
19
10Yr G-Sec Yield
Source: Bloomberg, PL
Moderation has been in lower tenure yields
5.86.06.26.46.66.87.07.27.47.67.88.08.2
3Month 1Year 5Year 10Year
Jun'18 Sep'18 Dec'18
Source: Company, PL
RBI has been moving its benchmark rates in lieu of benign inflation and support growth
4.5
5.0
5.5
6.0
6.5
7.0
7.5
8.0
8.5
9.0
9.5
Mar-
06
Sep-0
6
Mar-
07
Sep-0
7
Mar-
08
Sep-0
8
Mar-
09
Sep-0
9
Mar-
10
Sep-1
0
Mar-
11
Sep-1
1
Mar-
12
Sep-1
2
Mar-
13
Sep-1
3
Mar-
14
Sep-1
4
Mar-
15
Sep-1
5
Mar-
16
Sep-1
6
Mar-
17
Sep-1
7
Mar-
18
Sep-1
8
Mar-
19
(%)
Movement in Repo Rate
Source: Bloomberg, PL

Financial Services
April 5, 2019 73
Systemic liquidity supported by RBI intervention...
(3,000)
(2,500)
(2,000)
(1,500)
(1,000)
(500)
-
500
1,000
Dec-
16
Mar-
17
Jun-1
7
Sep-1
7
Dec-
17
Mar-
18
Jun-1
8
Sep-1
8
Dec-
18
Mar-
19
Net Liquidity (Rs Bn)
Source: Bloomberg, PL
…via OMOs & forex swap
(28) (24) (20) (16) (12) (8) (4) - 4 8
12
Dec-
16
Mar-
17
Jun-1
7
Sep-1
7
Dec-
17
Mar-
18
Jun-1
8
Sep-1
8
Dec-
18
Mar-
19
Rs
Tri
llio
n
Repo R-Repo Var Repo Var R-Repo MSF Net OMOs SLF MSS
Source: Bloomberg, PL
Short term rates softening post liquidity crisis
8.98
7.95
6.0
6.5
7.0
7.5
8.0
8.5
9.0
9.5
10.0
10.5
Jan-1
7
Feb-1
7
Mar-
17
Apr-
17
May-1
7
Jun-1
7
Jul-17
Aug-1
7
Sep-1
7
Oct-17
Nov-1
7
Dec-1
7
Jan-1
8
Feb-1
8
Mar-
18
Apr-
18
May-1
8
Jun-1
8
Jul-18
Aug-1
8
Sep-1
8
Oct-18
Nov-1
8
Dec-1
8
Jan-1
9
Feb-1
9
Mar-
19
3 MTH CP 6 MTH CP
Source: Bloomberg, PL
Long term rates similarly sliding for AAA issuers
8.868.10
6.5
7.0
7.5
8.0
8.5
9.0
9.5
10.0
Mar-
16
Jun-1
6
Sep-1
6
Dec-
16
Mar-
17
Jun-1
7
Sep-1
7
Dec-
17
Mar-
18
Jun-1
8
Sep-1
8
Dec-
18
Mar-
19
FIMMDA 3 YR AAA FIMMDA 5 YR AAA
Source: Bloomberg, PL
A-rated issuers witnessing bigger drop in rates
8.34
10.79
9.88
8.0
8.5
9.0
9.5
10.0
10.5
11.0
11.5
Mar-
16
Jun-1
6
Sep-1
6
Dec-
16
Mar-
17
Jun-1
7
Sep-1
7
Dec-
17
Mar-
18
Jun-1
8
Sep-1
8
Dec-
18
Mar-
19
FIMMDA 3 YR A FIMMDA 5 YR A
Source: Bloomberg, PL

Financial Services
April 5, 2019 74
Credit growth on strong footing; deposits seeing steady growth
12.3%
5.4%
10.0%
5.1%
10.2%
14.5%
3%
5%
7%
9%
11%
13%
15%
17%
19%
21%
23%
25%
Mar-
12
Jun-1
2
Sep-1
2
Dec-1
2
Mar-
13
Jun-1
3
Sep-1
3
Dec-1
3
Mar-
14
Jun-1
4
Sep-1
4
Dec-1
4
Mar-
15
Jun-1
5
Sep-1
5
Dec-1
5
Mar-
16
Jun-1
6
Sep-1
6
Dec-1
6
Mar-
17
Jun-1
7
Sep-1
7
Dec-1
7
Mar-
18
Jun-1
8
Sep-1
8
Dec-1
8
Mar-
19
Deposit growth Credit growth
Source: Bloomberg, PL Note – Data released upto mid Dec’18
Term deposit rates movement has been steady and buckets
-0.20
-0.15
-0.10
-0.05
0.00
0.05
0.10
Feb
-16
Apr-
16
Jun-1
6
Aug-1
6
Oct-16
Dec-
16
Feb
-17
Apr-
17
Jun-1
7
Aug-1
7
Oct-17
Dec-
17
Feb
-18
Apr-
18
Jun-1
8
Aug-1
8
Oct-18
Dec-
18
Feb
-19
MoM chg in Rupee Term Deposits Rate
SCBs PSBs Pvt Banks
Source: Bloomberg, PL
Bond market rates have cooled hence expanding gap between MCLR and AAA rated paper
-0.2 0.1 0.4 0.7 1.0 1.3 1.6 1.9 2.2 2.5
Dec-
16Ja
n-1
7F
eb-1
7M
ar-
17
Apr-
17
May-
17
Jun-1
7Ju
l-17
Aug-1
7S
ep-1
7O
ct-17
Nov-
17D
ec-
17Ja
n-1
8F
eb-1
8M
ar-
18
Apr-
18
May-
18
Jun-1
8Ju
l-18
Aug-1
8S
ep-1
8O
ct-18
Nov-
18D
ec-
18Ja
n-1
9F
eb-1
9
Diff bet SBI 1Yr MCLR & FIMMDA 1Yr AAA
Diff bet SCB Median - MCLR & FIMMDA 1Yr AAA
Source: Bloomberg, PL
Mixed cuts has been seen by respective banks post RBI’s change in stance
Banks MCLR 1YR
MCLR 1YR
% Change
Sept-18 Dec-18 Mar-19 3Months 6Months
Axis Bank 8.60%
8.70% 8.90% 0.20% 0.30%
HDFC Bank 8.70% 8.85% 8.75% -0.10% 0.05%
ICICI Bank 8.55% 8.80% 8.80% 0.00% 0.25%
KMB 8.95% 9.00% 9.00% 0.00% 0.05%
IndusInd Bank 9.65% 9.80% 9.90% 0.10% 0.25%
Yes Bank 9.65% 9.85% 9.70% -0.15% 0.05%
SBI 8.45% 8.55% 8.55% 0.00% 0.10%
Bank of Baroda 8.55% 8.65% 8.65% 0.00% 0.10%
Bank of India 8.60% 8.70% 8.65% -0.05% 0.05%
Punjab National Bank 8.45% 8.50% 8.45% -0.05% 0.00%
Canara Bank 8.60% 8.70% 8.70% 0.00% 0.10%
Union Bank 8.55% 8.70% 8.60% -0.10% 0.05%
Federal 9.20% 9.20% 9.20% 0.00% 0.00%
South Indian Bank 9.35% 9.45% 9.45% 0.00% 0.10%
J&K Bank 8.85% 9.00% 9.00% 0.00% 0.15%
Source: Company, PL

Financial Services
April 5, 2019 75
Banks have been selective on rate
-0.15%
-0.10%
-0.05%
0.00%
0.05%
0.10%
0.15%
0.20%
0.25%
0.30%
Axis HDFCB ICICIBC IIB KMB Yes SBI BOB
Quarterly Change in MCLRs
ON 1M 3M 6M 1Y
Source: Company, PL
Q4FY19 Result Review
Company Name Q4FY19E Q4FY18 YoY Chg. Q3FY19 QoQ Chg. Remark
HDFC
NII (Rs mn) 29,740 32,110 (7.4) 28,711 3.6
While YoY earnings look down due to base effect, Q4 should also prove to be a healthy quarter with 30% PAT growth QoQ led by improved margins and stable GNPA. Expect credit costs on higher side.
PPOP (Rs mn) 42,955 36,972 16.2 29,848 43.9
Provisions (Rs mn) 7,785 1,800 332.5 1,160 571.2
PAT (Rs mn) 27,435 28,462 (3.6) 21,138 29.8
Loans (Rs bn) 4,156 3,594 15.6 3,855 7.8
Margin (%) 2.80 4.00 (120) 2.70 10
GNPA (%) 1.20 1.12 8 1.23 (3)
Credit Cost (%) 0.75 0.20 55 0.12 63
CIFC
NII (Rs mn) 9,365 8,424 11.2 8,746 7.1 Continued strong AUM momentum at 18% YoY growth; pre-closure cases to see a decline. Sequential growth looks somber at 2% growth on account of tough environs in past few months and greater thrust on asset quality. Sequential NIMs improve as yields should be maintained. RoA should be maintained at healthy levels. Lower NPA and provs YoY on SARFAESI execution should largely aid PAT growth; however, expect credit costs stay at 60-70bps levels on account of focus on higher yielding mix.
PPOP (Rs mn) 5,577 4,647 20.0 5,588 (0.2)
Provisions (Rs mn) 824 116 612.2 953 (13.6)
PAT (Rs mn) 3,550 3,001 18.3 3,044 16.6
Loans (Rs bn) 516 436 18.3 504 2.3
Margin (%) 7.35 8.16 (81) 7.13 22
GNPA (%) 2.65 2.9 (25) 2.70 (5)
Credit Cost (%) 0.64 0.11 53 0.76 (12)
LICHF
NII (Rs mn) 11,240 10,036 12.0 10,843 3.7 Expect 14.6% YoY loan growth largely led by LAP and developer loans. Said that retail home loans should grow at 10% YoY+ 70bps PLR hike in current FY should aid NIMs expansion this quarter offsetting funding cost pressures Expect GNPAs to stabilize at 1.2% levels
PPOP (Rs mn) 8,502 8,669 (1.9) 9,891 (14.0)
Provisions (Rs mn) 764 281 171.5 1,325 (42.3)
PAT (Rs mn) 5,739 5,393 6.4 5,933 (3.3)
Loans (Rs bn) 1,906 1,664 14.6 1,817 4.9
Margin (%) 2.42 2.49 (7) 2.33 9
GNPA (%) 1.2 0.78 41 1.26 (7)
Credit Cost (%) 0.16 0.07 9 0.29 (13)
LTFH
NII (Rs mn) 14,012 13,111 6.9 13,793 1.6 NIMs should be maintained at 5.9% QoQ with market share gains across key products; CoF continue to climb. We expect the credit costs to climb up to 2.3% from 1.8% a quarter ago. Higher provisions but healthy loan traction at 17% YoY should support overall profitability YoY.
PPOP (Rs mn) 13,605 10,341 31.6 11,918 14.2
Provisions (Rs mn) 5,599 4,746 18.0 4,160 34.6
PAT (Rs mn) 6,193 4,091 51.4 5,810 6.6
Loans (Rs bn) 978 837 16.9 937 4.3
Margin (%) 5.85 6.50 (65) 5.94 (9)
GNPA (%) 6.57 4.80 177 6.74 (17)
Credit Cost (%) 2.29 2.27 2 1.78 51

Financial Services
April 5, 2019 76
Company Name Q4FY19E Q4FY18 YoY Chg. Q3FY19 QoQ Chg. Remark
MMFS
NII (Rs mn) 12,535 13,050 (3.9) 12,040 4.1
Expect 16% YoY loan growth for MMFS. We expect NIMs to decline to 7.9% from 9.8% a year ago, but a flat QoQ as Co. maintains pricing power. Better recoveries stand supportive of PAT and hence GNPA to fall down this quarter.
PPOP (Rs mn) 9,198 8,261 11.4 7,444 23.6
Provisions (Rs mn) 2,699 1,572 71.6 2,247 20.1
PAT (Rs mn) 4,097 4,245 (3.5) 3,187 28.6
Loans (Rs bn) 647 558 16.0 631 2.6
Margin (%) 7.85 9.71 (186) 7.86 (1)
GNPA (%) 7.50 8.50 (100) 7.70 (20)
Credit Cost (%) 1.67 1.13 54 1.43 24
SHTF
NII (Rs mn) 20,809 18,076 15.1 20,373 2.1
Growth remains constrained at 13.3% for this quarter as CV demand remains tepid NIMs stand maintained QoQ as incrementally higher yielding used CV component adds to the business. Lower provisioning and INDAS adjustments YoY presents a skewed PAT on YoY basis.
PPOP (Rs mn) 17,730 15,599 13.7 16,201 9.4
Provisions (Rs mn) 9,174 13,666 (32.9) 6,362 44.2
PAT (Rs mn) 6,134 1,446 324.2 6,354 (3.5)
Loans (Rs bn) 1,093 965 13.3 1,038 5.3
Margin (%) 7.81 7.72 10 7.83 (2)
GNPA (%) 8.70 9.15 (45) 7.36 134
Credit Cost (%) 3.36 5.67 (231) 2.45 91
Source: Company, PL

April 5, 2019 88
Information Technology
Jan-Mar’19 Earnings Preview
We expect a steady quarter with strong growth from TCS, HCLT, Infosys &
muted growth for Wipro & Tech M in Tier-1 IT services pack. In Tier-II, we
expect steady growth from NIIT Tech, MTCL, Hexaware & weak growth from
Cyient, Persistent & Zensar. We expect revenue growth in CC between 0.8-
2.3% QoQ for Tier-1 IT companies. Despite seasonality, we expect strong deal
closures in-line with the previous quarter and anticipate some pressure on
EBIT margins due to INR appreciation, projects ramp-ups & continued supply
side constraints. We reiterate TCS as our top pick in tier-1 IT sector since it’s
likely to gain more market share using its specific core strengths viz. lowest
cost/attrition, large agile workforce, early investments in building digital
capabilities & strong execution. Among large-caps, we continue to prefer
TCS, HCLT & Tech M while among mid-caps we remain positive on LTTS &
LTI as a growth champions along with NIIT Tech as a value picks. We also
remain positive on Infosys but would wait for a better entry price.
Strong revenue growth for Tier-1 IT companies: We expect constant
currency growth of 2.3%, 2.3%, 2.8%, 1.6% & 0.8% for TCS, Infosys, HCLT,
Wipro & Tech M respectively. Tech M is expected to report muted numbers
due to seasonal weakness in retail & weak growth in manufacturing. In HCLT,
revenue performance will be driven by IMS segment due to ramp-up of large
deals. Q4FY19 performance will be determined by steady ramp-ups deals,
stable sales cycle & strong demand commentary.
Muted growth for Tier-II IT companies: In tier-II IT companies - MTCL & NIIT
Tech are expected to deliver steady revenue growth whereas Persistent &
Cyient may witness a revenue decline. In Cyient, growth momentum is
impacted by order delay in DLM (USD 5mn) in Q4FY19E. LTTS could be
impacted by client specific issues (impact USD 2.8mn in Q4FY19) and may
guide a revenue of high-teens (18%-20%) in FY20E. We expect a pressure on
EBIT margin of MTCL due to scale up of investments in digital talents.
Infosys & HCLT to guide better growth guidance for FY20E: We expect
Infosys to guide a revenue growth of 8-10% in constant currency as on
FY2020E. We expect HCLT to guide for 14-16% revenue growth which will
include an inorganic component of 5.4% revenues from the IBM products
buyout. Excluding revenues from IBM products but including revenues from
other inorganic components, we expect HCLT to guide for 9.0-11.0%. We
expect the company to retain 19.5-20.5% EBIT margin guidance band. We
expect Wipro to guide a revenue growth of 0.5%-2.5% for Q1FY20E. The
management commentaries will remain positive due to the strong tailwind of
demand provided by digital business.
Pressure on EBIT margins: We expect some pressure on EBIT margins due
INR appreciation, projects ramp-ups & continued supply side constraints. Also,
we expect companies to accelerate investments training & onsite talent despite
recent INR appreciation.
April 5, 2019
Top Picks
Tata Consultancy Services
Tech Mahindra
L&T Technology Services
NIIT Technologies
Aniket Pande
[email protected] | 91-22-66322300
Rajat Gandhi
[email protected] | 91-22-66322246
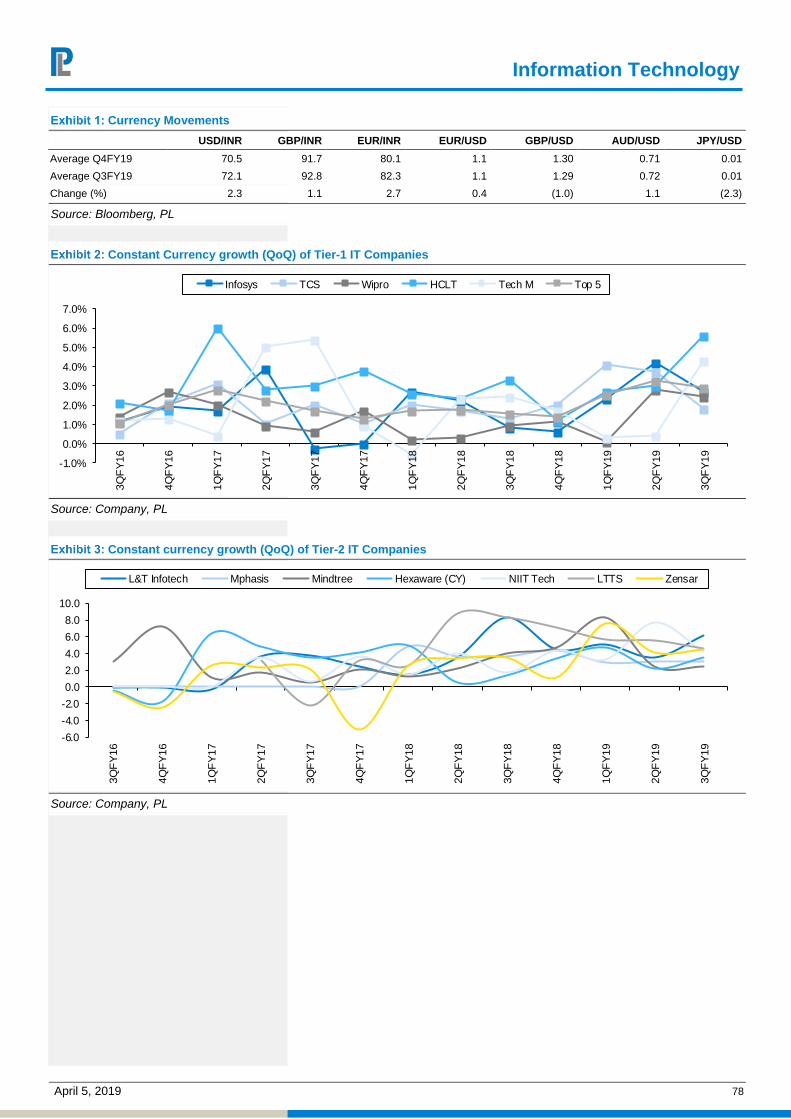
Information Technology
April 5, 2019 78
Currency Movements
USD/INR GBP/INR EUR/INR EUR/USD GBP/USD AUD/USD JPY/USD
Average Q4FY19 70.5 91.7 80.1 1.1 1.30 0.71 0.01
Average Q3FY19 72.1 92.8 82.3 1.1 1.29 0.72 0.01
Change (%) 2.3 1.1 2.7 0.4 (1.0) 1.1 (2.3)
Source: Bloomberg, PL
Constant Currency growth (QoQ) of Tier-1 IT Companies
-1.0%
0.0%
1.0%
2.0%
3.0%
4.0%
5.0%
6.0%
7.0%
3Q
FY
16
4Q
FY
16
1Q
FY
17
2Q
FY
17
3Q
FY
17
4Q
FY
17
1Q
FY
18
2Q
FY
18
3Q
FY
18
4Q
FY
18
1Q
FY
19
2Q
FY
19
3Q
FY
19
Infosys TCS Wipro HCLT Tech M Top 5
Source: Company, PL
Constant currency growth (QoQ) of Tier-2 IT Companies
-6.0
-4.0
-2.0
0.0
2.0
4.0
6.0
8.0
10.0
3Q
FY
16
4Q
FY
16
1Q
FY
17
2Q
FY
17
3Q
FY
17
4Q
FY
17
1Q
FY
18
2Q
FY
18
3Q
FY
18
4Q
FY
18
1Q
FY
19
2Q
FY
19
3Q
FY
19
L&T Infotech Mphasis Mindtree Hexaware (CY) NIIT Tech LTTS Zensar
Source: Company, PL
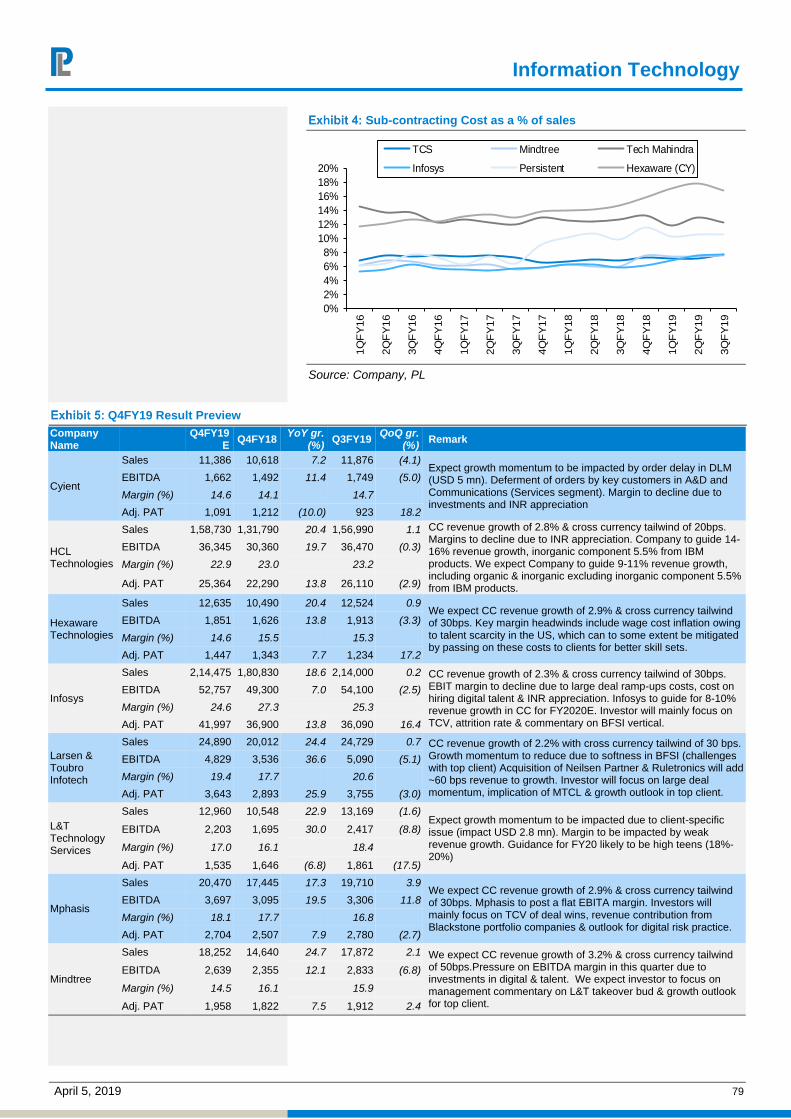
Information Technology
April 5, 2019 79
Sub-contracting Cost as a % of sales
0%
2%
4%
6%
8%
10%
12%
14%
16%
18%
20%
1Q
FY
16
2Q
FY
16
3Q
FY
16
4Q
FY
16
1Q
FY
17
2Q
FY
17
3Q
FY
17
4Q
FY
17
1Q
FY
18
2Q
FY
18
3Q
FY
18
4Q
FY
18
1Q
FY
19
2Q
FY
19
3Q
FY
19
TCS Mindtree Tech Mahindra
Infosys Persistent Hexaware (CY)
Source: Company, PL
Q4FY19 Result Preview
Company Name
Q4FY19
E Q4FY18
YoY gr. (%)
Q3FY19 QoQ gr.
(%) Remark
Cyient
Sales 11,386 10,618 7.2 11,876 (4.1) Expect growth momentum to be impacted by order delay in DLM (USD 5 mn). Deferment of orders by key customers in A&D and Communications (Services segment). Margin to decline due to investments and INR appreciation
EBITDA 1,662 1,492 11.4 1,749 (5.0)
Margin (%) 14.6 14.1 14.7
Adj. PAT 1,091 1,212 (10.0) 923 18.2
HCL Technologies
Sales 1,58,730 1,31,790 20.4 1,56,990 1.1 CC revenue growth of 2.8% & cross currency tailwind of 20bps. Margins to decline due to INR appreciation. Company to guide 14-16% revenue growth, inorganic component 5.5% from IBM products. We expect Company to guide 9-11% revenue growth, including organic & inorganic excluding inorganic component 5.5% from IBM products.
EBITDA 36,345 30,360 19.7 36,470 (0.3)
Margin (%) 22.9 23.0 23.2
Adj. PAT 25,364 22,290 13.8 26,110 (2.9)
Hexaware Technologies
Sales 12,635 10,490 20.4 12,524 0.9 We expect CC revenue growth of 2.9% & cross currency tailwind of 30bps. Key margin headwinds include wage cost inflation owing to talent scarcity in the US, which can to some extent be mitigated by passing on these costs to clients for better skill sets.
EBITDA 1,851 1,626 13.8 1,913 (3.3)
Margin (%) 14.6 15.5 15.3
Adj. PAT 1,447 1,343 7.7 1,234 17.2
Infosys
Sales 2,14,475 1,80,830 18.6 2,14,000 0.2 CC revenue growth of 2.3% & cross currency tailwind of 30bps. EBIT margin to decline due to large deal ramp-ups costs, cost on hiring digital talent & INR appreciation. Infosys to guide for 8-10% revenue growth in CC for FY2020E. Investor will mainly focus on TCV, attrition rate & commentary on BFSI vertical.
EBITDA 52,757 49,300 7.0 54,100 (2.5)
Margin (%) 24.6 27.3 25.3
Adj. PAT 41,997 36,900 13.8 36,090 16.4
Larsen & Toubro Infotech
Sales 24,890 20,012 24.4 24,729 0.7 CC revenue growth of 2.2% with cross currency tailwind of 30 bps. Growth momentum to reduce due to softness in BFSI (challenges with top client) Acquisition of Neilsen Partner & Ruletronics will add ~60 bps revenue to growth. Investor will focus on large deal momentum, implication of MTCL & growth outlook in top client.
EBITDA 4,829 3,536 36.6 5,090 (5.1)
Margin (%) 19.4 17.7 20.6
Adj. PAT 3,643 2,893 25.9 3,755 (3.0)
L&T Technology Services
Sales 12,960 10,548 22.9 13,169 (1.6) Expect growth momentum to be impacted due to client-specific issue (impact USD 2.8 mn). Margin to be impacted by weak revenue growth. Guidance for FY20 likely to be high teens (18%- 20%)
EBITDA 2,203 1,695 30.0 2,417 (8.8)
Margin (%) 17.0 16.1 18.4
Adj. PAT 1,535 1,646 (6.8) 1,861 (17.5)
Mphasis
Sales 20,470 17,445 17.3 19,710 3.9 We expect CC revenue growth of 2.9% & cross currency tailwind of 30bps. Mphasis to post a flat EBITA margin. Investors will mainly focus on TCV of deal wins, revenue contribution from Blackstone portfolio companies & outlook for digital risk practice.
EBITDA 3,697 3,095 19.5 3,306 11.8
Margin (%) 18.1 17.7 16.8
Adj. PAT 2,704 2,507 7.9 2,780 (2.7)
Mindtree
Sales 18,252 14,640 24.7 17,872 2.1 We expect CC revenue growth of 3.2% & cross currency tailwind of 50bps.Pressure on EBITDA margin in this quarter due to investments in digital & talent. We expect investor to focus on management commentary on L&T takeover bud & growth outlook for top client.
EBITDA 2,639 2,355 12.1 2,833 (6.8)
Margin (%) 14.5 16.1 15.9
Adj. PAT 1,958 1,822 7.5 1,912 2.4

Information Technology
April 5, 2019 80
Company Name Q4FY19E Q4FY18 YoY gr.
(%) Q3FY19
QoQ gr. (%)
Remark
NIIT Technologies
Sales 9,770 7,888 23.9 9,717 0.5
We expect CC revenue growth of 3.2% & cross currency tailwind of 30bps. Margin to decline due to INR appreciation & investments
EBITDA 1,807 1,418 27.5 1,805 0.1
Margin (%) 18.5 18.0 18.6
Adj. PAT 1,052 861 22.2 1,002 5.0
Persistent Systems
Sales 8,546 7,525 13.6 8,642 (1.1)
Expect USD revenue to de-grew by 1.0% on weakness in IP revenue. Margin to decline by 30 bps owning to weak revenue momentum
EBITDA 1,641 1,111 47.7 1,703 (3.7)
Margin (%) 19.2 14.8 19.7
Adj. PAT 1,078 738 46.0 917 17.4
Redington (India)
Sales 1,26,616 1,13,140 11.9 1,26,301 0.3
We expect Redington revenues at Rs126.6bn up 11.9% YoY. We expect consolidated EBIDTA margin at 1.6% down ~60bps QoQ.
EBITDA 2,033 2,321 (12.4) 2,766 (26.5)
Margin (%) 1.6 2.1 2.2
Adj. PAT 1,184 1,436 (17.5) 1,301 (9.0)
Sonata Software
Sales 8,728 6,258 39.5 8,440 3.4
We expect 2.5% USD revenue growth in Sonata.
EBITDA 943 635 48.4 998 (5.5)
Margin (%) 10.8 10.2 11.8
Adj. PAT 672 543 23.8 639 5.1
Tata Consultancy Services
Sales 3,78,086 3,20,750 17.9 3,73,380 1.3 We expect CC revenue growth of 2.3% & cross currency tailwind of 60bps. Strong deal momentum to continue. We expect stable margins, there will a slight impact of rupee appreciation. We will keep a watch on management commentary of BFSI vertical & outcome of budgeting cycle.
EBITDA 1,02,386 86,520 18.3 1,00,830 1.5
Margin (%) 27.1 27.0 27.0
Adj. PAT 80,244 69,040 16.2 81,050 (1.0)
TeamLease Services
Sales 12,115 9,774 24.0 11,722 3.4 We expect 3.4% revenue growth in teamlease services.In last quarter Revenue growth was highest in the last eight quarter led by core staffing.
EBITDA 279 228 22.4 245 13.7
Margin (%) 2.3 2.3 2.1
Adj. PAT 259 212 22.2 252 2.8
Tech Mahindra
Sales 89,392 80,545 11.0 89,437 (0.0) We expect CC revenue growth of 0.8% & cross currency tailwind of 50bps. Revenue growth will be led by telecom vertical, enterprise vertical to report weak growth. Weak growth in retail due to strong last quarter. Expect less forex gain in Q4FY19E. EBIT margin to decline due to rupee appreciation. TCV to be around US$ 280-300mn range.
EBITDA 16,970 14,119 20.2 17,226 (1.5)
Margin (%) 19.0 17.5 19.3
Adj. PAT 10,785 12,221 (11.7) 12,161 (11.3)
Wipro
Sales 1,50,720 1,37,686 9.5 1,50,595 0.1 We expect CC revenue growth of 1.6% & cross currency tailwind of 30bps. We expect EBIT margin to remain flat on account of rupee appreciation. We expect Wipro to guide revenue growth of 0.5%-2.5% for Q1FY20E.
EBITDA 56,357 24,028 134.5 32,700 72.3
Margin (%) 37.4 17.5 21.7
Adj. PAT 48,576 18,028 169.4 25,103 93.5
Zensar Technologies
Sales 10,210 8,185 24.7 10,376 (1.6) We expect revenue growth of 1.5% QoQ. Deal ramp up and INR appreciation to hurt margins further. Key focus will be on management commentary on improving the margins. Last quarter margin dropped by 220bps.
EBITDA 1,123 999 12.4 1,126 (0.2)
Margin (%) 11.0 12.2 10.8
Adj. PAT 630 726 (13.3) 555 13.6
Source: Company, PL

Information Technology
April 5, 2019 81
Valuation Summary
Company Names Rating CMP (Rs)
TP (Rs) Sales (Rs bn) EBITDA (Rs bnm) PAT (Rs bn) EPS (Rs) RoE (%) PE (x)
FY18 FY19E FY20E FY21E FY18 FY19E FY20E FY21E FY18 FY19E FY20E FY21E FY18 FY19E FY20E FY21E FY18 FY19E FY20E FY21E FY18 FY19E FY20E FY21E
Cyient Acc 595 621 39.2 45.9 50.1 56.3 5.5 6.4 7.2 8.4 4.1 4.1 4.7 5.4 36.3 36.5 41.6 47.7 18.3 16.7 17.2 17.9 16.4 16.3 14.3 12.5
HCL Technologies BUY 1,093 1,186 505.7 603.1 669.9 741.7 114.4 140.1 152.5 166.9 87.8 100.9 105.8 115.3 62.7 73.3 77.8 84.8 25.0 25.7 22.9 20.7 17.4 14.9 14.1 12.9
Hexaware Technologies Reduce 360 325 39.4 46.5 53.7 60.6 6.9 7.7 8.4 9.6 5.0 5.8 6.4 7.0 16.8 19.7 21.6 23.7 26.6 26.8 25.3 24.1 21.4 18.3 16.7 15.2
Infosys Acc 759 808 705.2 825.8 910.5 997.1 190.1 210.2 232.2 256.6 146.0 155.3 167.2 190.1 33.6 35.7 38.5 43.7 21.8 25.1 28.8 33.0 22.6 21.3 19.7 17.4
Larsen & Toubro Infotech BUY 1,652 2,032 73.2 94.4 110.4 126.6 12.6 18.8 21.8 24.4 11.8 15.0 17.0 19.2 68.4 87.0 98.7 111.8 33.6 34.6 32.0 30.0 24.2 19.0 16.7 14.8
L&T Technology Services Acc 1,609 1,807 37.5 50.3 59.1 69.6 5.8 8.9 10.9 12.6 5.1 7.3 7.8 9.1 49.5 70.9 76.5 88.6 29.6 33.7 30.0 29.1 32.5 22.7 21.0 18.2
Mphasis Acc 975 1,090 65.5 77.5 88.7 100.1 10.6 13.6 16.2 18.1 8.5 10.8 12.3 14.1 43.2 55.1 62.9 71.8 14.6 19.8 21.1 20.9 22.6 17.7 15.5 13.6
Mindtree Reduce 953 873 54.6 70.1 77.5 87.0 7.4 10.5 12.0 13.5 5.7 7.5 8.4 9.6 34.4 45.8 50.9 58.3 21.4 25.0 23.2 22.0 27.7 20.8 18.7 16.3
NIIT Technologies BUY 1,348 1,539 29.9 36.8 43.1 49.9 5.0 6.6 7.8 9.0 2.8 4.0 4.8 5.6 45.6 65.5 77.7 90.4 16.2 21.3 22.1 22.5 29.6 20.6 17.4 14.9
Persistent Systems Hold 627 653 30.3 33.9 37.3 40.9 4.7 6.2 6.6 7.3 3.2 3.8 4.2 4.8 40.4 46.9 52.8 59.4 16.0 16.6 16.6 16.7 15.5 13.4 11.9 10.5
Redington (India) BUY 98 108 434.6 466.1 508.7 557.2 8.2 8.3 7.3 8.3 4.8 5.0 4.3 5.1 11.9 12.5 10.7 12.7 14.3 13.4 10.6 11.6 8.2 7.9 9.2 7.7
Sonata Software Acc 346 400 24.5 30.0 39.0 42.1 2.3 3.4 4.1 4.6 1.9 2.5 3.0 3.3 18.5 24.2 29.0 32.1 30.9 35.6 37.0 35.4 18.7 14.3 11.9 10.8
TCS BUY 2,048 2,265 1,231.0 1,462.6 1,629.6 1,823.4 324.8 396.7 449.2 502.6 258.3 313.7 352.1 394.1 67.5 81.9 92.0 102.9 30.9 36.3 34.9 33.5 30.4 25.0 22.3 19.9
TeamLease Services HOLD 3,031 3,203 36.2 45.0 53.5 62.0 0.7 1.0 1.3 1.5 0.7 1.0 1.2 1.5 43.1 57.4 72.7 89.2 18.3 20.0 20.6 20.6 70.3 52.8 41.7 34.0
Tech Mahindra BUY 777 886 307.7 347.9 380.8 416.3 47.2 64.0 70.8 78.0 38.0 42.8 48.3 52.6 43.0 48.2 54.4 59.2 21.5 21.7 21.5 19.9 18.1 16.1 14.3 13.1
Wipro Hold 262 247 544.9 586.5 629.1 663.7 103.1 114.8 128.5 132.9 81.2 87.5 96.8 102.5 12.8 14.6 16.1 17.1 16.2 16.9 16.7 16.1 20.5 18.0 16.3 15.4
Zensar Technologies Acc 231 256 31.1 39.3 44.8 50.6 3.7 4.6 5.9 7.0 2.4 2.8 3.6 4.5 10.8 12.6 16.1 19.9 15.4 15.9 17.9 19.1 21.4 18.4 14.4 11.6
Source: Company, PL
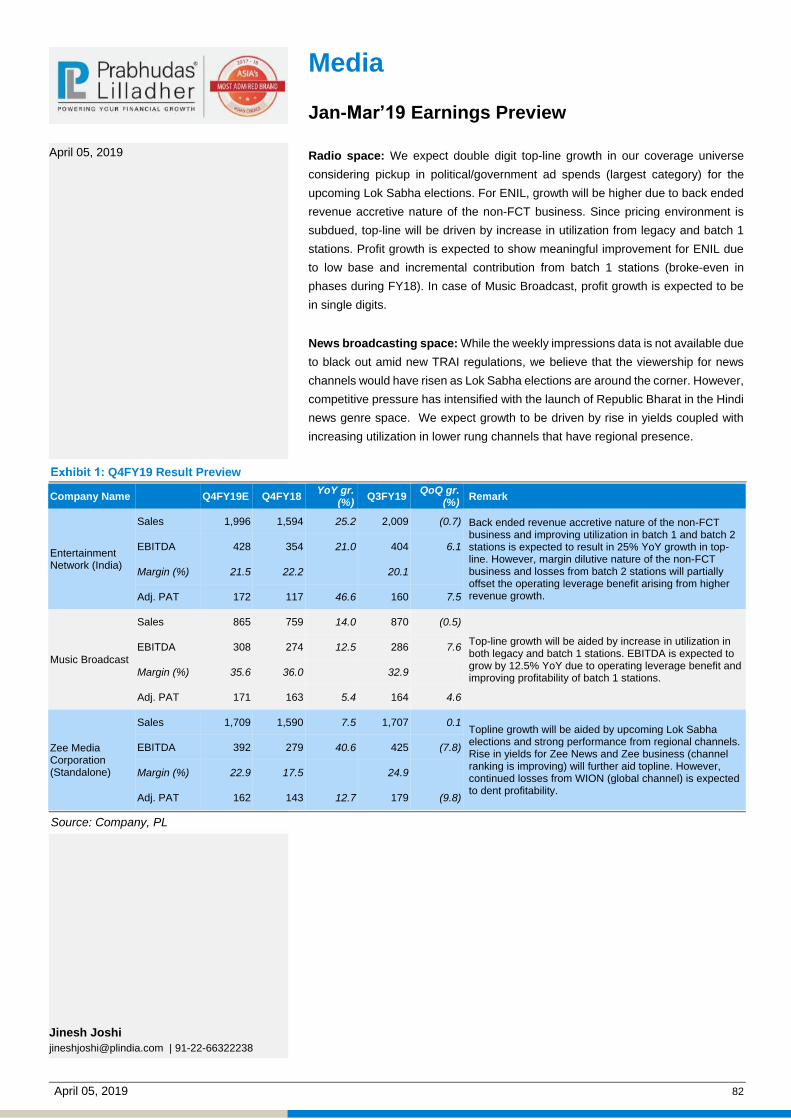
April 05, 2019 82
April 05, 2019
Jinesh Joshi
[email protected] | 91-22-66322238
Media
Jan-Mar’19 Earnings Preview
Radio space: We expect double digit top-line growth in our coverage universe
considering pickup in political/government ad spends (largest category) for the
upcoming Lok Sabha elections. For ENIL, growth will be higher due to back ended
revenue accretive nature of the non-FCT business. Since pricing environment is
subdued, top-line will be driven by increase in utilization from legacy and batch 1
stations. Profit growth is expected to show meaningful improvement for ENIL due
to low base and incremental contribution from batch 1 stations (broke-even in
phases during FY18). In case of Music Broadcast, profit growth is expected to be
in single digits.
News broadcasting space: While the weekly impressions data is not available due
to black out amid new TRAI regulations, we believe that the viewership for news
channels would have risen as Lok Sabha elections are around the corner. However,
competitive pressure has intensified with the launch of Republic Bharat in the Hindi
news genre space. We expect growth to be driven by rise in yields coupled with
increasing utilization in lower rung channels that have regional presence.
Q4FY19 Result Preview
Company Name Q4FY19E Q4FY18 YoY gr.
(%) Q3FY19
QoQ gr. (%)
Remark
Entertainment Network (India)
Sales 1,996 1,594 25.2 2,009 (0.7) Back ended revenue accretive nature of the non-FCT business and improving utilization in batch 1 and batch 2 stations is expected to result in 25% YoY growth in top-line. However, margin dilutive nature of the non-FCT business and losses from batch 2 stations will partially offset the operating leverage benefit arising from higher revenue growth.
EBITDA 428 354 21.0 404 6.1
Margin (%) 21.5 22.2 20.1
Adj. PAT 172 117 46.6 160 7.5
Music Broadcast
Sales 865 759 14.0 870 (0.5)
Top-line growth will be aided by increase in utilization in both legacy and batch 1 stations. EBITDA is expected to grow by 12.5% YoY due to operating leverage benefit and improving profitability of batch 1 stations.
EBITDA 308 274 12.5 286 7.6
Margin (%) 35.6 36.0 32.9
Adj. PAT 171 163 5.4 164 4.6
Zee Media Corporation (Standalone)
Sales 1,709 1,590 7.5 1,707 0.1 Topline growth will be aided by upcoming Lok Sabha elections and strong performance from regional channels. Rise in yields for Zee News and Zee business (channel ranking is improving) will further aid topline. However, continued losses from WION (global channel) is expected to dent profitability.
EBITDA 392 279 40.6 425 (7.8)
Margin (%) 22.9 17.5 24.9
Adj. PAT 162 143 12.7 179 (9.8)
Source: Company, PL

Media
April 05, 2019 83
Valuation Summary
Company Names Rating CMP (Rs)
TP (Rs) Sales (Rs m) EBITDA (Rs m) PAT (Rs m) EPS (Rs) RoE (%) PE (x)
FY18 FY19E FY20E FY21E FY18 FY19E FY20E FY21E FY18 FY19E FY20E FY21E FY18 FY19E FY20E FY21E FY18 FY19E FY20E FY21E FY18 FY19E FY20E FY21E
Entertainment Network (India)
BUY 534 776 5,371 6,446 7,313 8,131 1,166 1,389 1,828 2,114 352 513 794 989 7.4 10.8 16.6 20.8 4.0 5.5 7.9 9.0 72.4 49.6 32.1 25.7
Music Broadcast BUY 58 81 2,983 3,294 3,696 4,166 971 1,120 1,320 1,525 517 604 764 918 9.1 2.2 2.8 3.3 8.6 9.2 10.8 11.9 6.4 26.7 21.1 17.5
Zee Media Corporation BUY 18 38 5,102 6,275 7,530 8,999 1,025 1,387 1,732 2,106 406 540 721 903 0.9 1.1 1.5 1.9 6.1 7.7 9.4 10.6 20.7 15.6 11.7 9.3
Source: Company, PL
PS: The EPS figure for MBL for FY18 is pre-split and hence not comparable with the ensuing years.

April 5, 2019 84
Metals & Mining
Jan-Mar’19 Earnings Preview
Chinese steel production grew by 9.2% YoY to 150mn tonnes (t), which is above
the growth rate of world steel production of 3.8% YoY to 288mn t in Jan-Feb 2019.
RoW’s production witnessed a fall of 1.5% to 138mn t. Production in India rose
marginally by 0.12% YoY to 17.9mn t on the back of muted demand. South Korea’s
production grew by 1% YoY to 11.9mn t due to increase in domestic demand,
partially negated weakness in exports. EU’s production witnessed a further de-
growth of 3.9% YoY to 26.9mn t due to increased imports, shutdown of some of the
capacities and sluggish demand. USA’s production grew by 6.9% YoY to 14.4mn t,
led by hefty duties imposed on imports.
Exhibit 1: Movement in Crude Steel Production
-10.0
-5.0
0.0
5.0
10.0
15.0
20.0
Feb
-16
Apr-
16
Jun-1
6
Aug-1
6
Oct-16
Dec-
16
Feb
-17
Apr-
17
Jun-1
7
Aug-1
7
Oct-17
Dec-
17
Feb
-18
Apr-
18
Jun-1
8
Aug-1
8
Oct-18
Dec-
18
Feb
-19
(%)
China World steel World steel ex China
Source: World Steel, PL
Average Chinese steel prices (including 17% VAT) fell marginally by 0.7% QoQ or
US$4/t to US$580 due to increase in production during the peak March-April
season and less harsh production restrictions in Chinese steel producing province.
Higher raw material prices pulled spreads of Chinese mills to near 12-month low.
Exhibit 2: China HRC Price
500
520
540
560
580
600
620
640
660
680
700
Mar-
18
Apr-
18
May-
18
Jun-1
8
Jul-18
Aug-1
8
Sep-1
8
Oct-18
Nov-
18
Dec-
18
Jan-1
9
Feb
-19
Mar-
19
(US
$ / to
nn
e)
Source: Bloomberg, PL
April 5, 2019
Top Picks
Tata Steel
Amit Khimesra
[email protected] | 91-22-66322244

Metals & Mining
April 5, 2019 85
Exhibit 3: North America HRC Price
850
870
890
910
930
950
970
Mar-
18
Apr-
18
May-
18
Jun-1
8
Jul-18
Aug-1
8
Sep-1
8
Oct-18
Nov-
18
Dec-
18
Jan-1
9
Feb
-19
Mar-
19
(US
$ / s
ho
rt to
nn
e)
Source: Bloomberg, PL
Exhibit 4: Europe HRC Price
550
570
590
610
630
650
670
690
710
730
Mar-
18
Apr-
18
May-
18
Jun-1
8
Jul-18
Aug-1
8
Sep-1
8
Oct-18
Nov-
18
Dec-
18
Jan-1
9
Feb
-19
Mar-
19
(US
$ / t
on
ne
)
Source: Bloomberg, PL
Exhibit 5: Indian origin Iron Ore (62% Fe) Export Prices (CIF) to China
60
64
68
72
76
80
84
88
92
Mar-
18
Apr-
18
May-
18
Jun-1
8
Jul-18
Aug-1
8
Sep-1
8
Oct-18
Nov-
18
Dec-
18
Jan-1
9
Feb
-19
Mar-
19
(US
$ / t
on
ne
)
Source: Bloomberg, PL
Average HRC prices in North
America grew by 1.6% QoQ or
US$16/short t to US$970 on account
of import constraints and strong
demand.
Average HRC price in Europe fell
further sharply by 7.7% QoQ or
US$48/t to US$566 due to
depreciation of € against dollar and
slowing domestic demand.
Average spot iron ore prices (CIF
China) spurred sharply by 16.5%
QoQ or US$12/t to US$85 due to
global supply concerns post dam
disaster in Brazil mines owned by
Vale SA.

Metals & Mining
April 5, 2019 86
Exhibit 6: China Heavy Steel Scrap Prices
340
355
370
385
400
415
Mar-
18
Apr-
18
May-
18
Jun-1
8
Jul-18
Aug-1
8
Sep-1
8
Oct-18
Nov-
18
Dec-
18
Jan-1
9
Feb
-19
Mar-
19
(US
$ / t
on
ne
)
Source: Bloomberg, PL
Exhibit 7: Region-wise spreads of Blast furnace producers
-50
50
150
250
350
450
550
Dec-
15
Mar-
16
Jun-1
6
Sep-1
6
Dec-
16
Mar-
17
Jun-1
7
Sep-1
7
Dec-
17
Mar-
18
Jun-1
8
Sep-1
8
Dec-
18
Mar-
19
(US
$ / T
on
ne
)
US China Europe
Source: Bloomberg, PL
We expect EBITDA of our coverage universe to grow by 3.4% QoQ on the back of
firm domestic demand. Chinese steel HR/Rebar prices have corrected by
0.7%/↓6.3% QoQ due to weak demand. However, we believe that any further
elimination of steel capacity by Chinese authorities to reduce the pollution levels
and ease of trade frictions between China and USA. This will help in sustainable
price improvement and significant demand pick-up. We continue to maintain our
Overweight outlook on the sector with TATA Steel (TATA) as the top pick.
Average eavy steel scrap prices rose
by 3.9% QoQ or US$14/t to
US$380/t, led by imposition of import
duty by Chinese govt on US scrap
leading to increased demand from
other markets.
Spreads improved further to near
decade high in USA due to spurt in
prices on the back of additional duties
imposed on imports under Sec-232.
Spreads in China softened further to
yearly low due to weakness in prices
and high input costs. Spreads in
Europe remained under pressure due
to weakness in prices and currency
depreciation.

Metals & Mining
April 5, 2019 87
Exhibit 8: Q4FY19 Result Preview
Company Name
Q4FY19E Q4FY18 YoY gr.
(%) Q3FY19
QoQ gr. (%)
Remark
Coal India
Sales 278,412 269,092 3.5 250,458 11.2 Coal dispatches are expected to grow 5.5% QoQ to 162.3mn tonnes on the back of higher demand from power sector. Realisations are expected grow 5.8%/Rs88/t QoQ. Due to increased volume and better realisation in e-auction, EBITDA/t is expected to grow 25% QoQ to Rs552.
EBITDA 89,607 1,955 4,483.5 67,878 32.0
Margin (%) 32.2 0.7 27.1
Adj. PAT 60,065 12,942 364.1 45,658 31.6
Coal desp. (mn tn) 162.3 158.9 2.1 153.8 5.5
Real. / tonne (Rs) 1,608 1,581 1.7 1,520 5.8
EBITDA / tonne (Rs) 552 12 4,387.2 441 25.1
Hindalco Industries
Sales 117,852 116,811 0.9 119,377 (1.3)
Al production is expected to grow 0.3% QoQ. Cu production is expected to remain flat QoQ. Al/Cu LME is expected to fall 5.8%/+0.6% QoQ. Due to weak realisations, Al EBITDA is expected to fall 5% QoQ to Rs4.8bn. Due to better realisations, Cu EBITDA is expected to grow 7% QoQ to Rs4.6bn. Total EBITDA is expected to grow 1.6% QoQ to Rs9.4bn.
EBITDA 9,431 12,576 (25.0) 9,282 1.6
Margin (%) 8.0 10.8 7.8
Adj. PAT 2,084 3,770 (44.7) 2,020 3.2
Alum. (Al) prod (t) 325,000 320,000 1.6 324,000 0.3
Copper (Cu) prod (t) 105,000 106,466 (1.4) 105,000 -
EBITDA‐Al (Rs m) 4,888 9,204 (46.9) 5,148 (5.0)
EBITDA‐Cu (Rs m) 4,616 3,291 40.2 4,311 7.1
EBITDA-Utkal Alumina (Rs m) 6,212 3,450 80.0 7,710 (19.4)
Hindustan Zinc
Sales 53,608 62,770 -14.6 55,400 (3.2) Total refined zinc‐lead volumes are expected to fall 6% QoQ to 227kt. Silver volumes are expected to grow 7.3% QoQ to 191t. Refined metal realisations are expected to grow 1% QoQ on the back of better Zinc & Lead realisations. Due to lower metal output, EBITDA would fall by 5.2% QoQ to Rs27.2bn.
EBITDA 27,187 36,200 (24.9) 28,380 (4.2)
Margin (%) 50.7 57.7 51.2
Adj. PAT 20,010 25,410 (21.3) 22,110 (9.5)
Ttl. Refined metal‐tns 226,944 260,000 (12.7) 241,000 (5.8)
Silver Sales Vol. (kg) 191,000 167,000 14.4 178,000 7.3
Jindal Steel & Power
Sales 104,396 85,228 22.5 94,350 10.6
Standalone volume is expected to grow 20.8% QoQ to 1.45m tonnes. Realisations are expected to fall 4%/Rs2,200/t QoQ due to higher volume. Standalone EBITDA is expected grow 2.8% QoQ to Rs14.3bn. Due to expected higher volume growth in domestic operations, consolidated EBITDA to grow 2.7% QoQ to Rs20bn.
EBITDA 19,992 20,605 (3.0) 19,463 2.7
Margin (%) 19.1 24.2 20.6
Adj. PAT 11 1,295 (99.2) -240 (104.5)
Steel Sales Vol. (Tonne) 1.5 1 22.9 1 20.8
Standalone EBITDA 14,274 14,695 (2.9) 13,888 2.8
Standalone EBITDA / t (Rs) 9,844 12,454 (21.0) 11,574 (14.9)
JPL‐Kwh sold (m) 2,469 2,125 16.2 2,400 2.9
JPL‐Rate Rs/ Kwh 4.2 4.5 (6.2) 4.2 0.8
JSW Steel
Sales 202,786 209,740 -3.3 203,180 (0.2) Volume is expected to grow 12.2% QoQ at 4.1m tonnes. Realisations are expected to fall 4.7%/Rs2,362/t QoQ at Rs47,619/t. Due to weak realisations, EBITDA/t is expected to fall 16.8%/Rs2,032 QoQ to Rs10,028. Consolidated EBITDA is expected to report marginal fall of 0.4% QoQ to Rs44.8bn.
EBITDA 44,849 49,280 (9.0) 45,010 (0.4)
Margin (%) 22.1 23.5 22.2
Adj. PAT 17,062 21,903 (22.1) 16,240 5.1
Sales Vol. (mt) 4.1 4.2 -2.1 3.7 12.2
Real. / tonne (Rs) 47,619 46,917 1.5 49,981 (4.7)
EBITDA / tonne (Rs) 10,028 11,097 (9.6) 12,060 (16.8)
NMDC
Sales 32,260 38,830 -16.9 36,494 (11.6)
Iron ore volumes is expected to grow 17.1% QoQ to 10.2m tonnes. Realisations are expected to fall 24.6% QoQ to Rs3,135/t. Hence, EBITDA/t is expected to fall 44.5% QoQ to Rs1,373. EBITDA is expected to fall 35% QoQ to Rs14bn.
EBITDA 13,995 19,010 (26.4) 21,544 (35.0)
Margin (%) 43.4 49.0 59.0
Adj. PAT 9,583 11,064 (13.4) 15,768 (39.2)
Total Volume (mt) 10.2 10.5 -3.3 8.7 17.1
Realization/t (Rs.) 3,135 3,653 (14.2) 4,157 (24.6)
EBITDA/t (Rs) 1,373 1,804 (23.9) 2,475 (44.5)
Steel Authority of India
Sales 228,000 170,378 33.8 158,358 44.0 Volumes are expected to grow 50.7% QoQ to 4.9m tonnes. Realisations are expected to fall 4.6%/Rs2,228/t QoQ to Rs46,150/t. Due to weak realisations, EBITDA/t is expected to fall 30.5%/Rs2,431 QoQ at Rs5,534. EBITDA is expected to grow 4.7% QoQ to Rs27bn.
EBITDA 26,987 23,473 15.0 25,782 4.7
Margin (%) 11.8 13.8 16.3
Adj. PAT 7,482 4,381 70.8 6,324 18.3
Sales Vol. (m tonnes) 4.9 3.7 30.5 3.2 50.7
Real. / Tonne (Rs) 46,150 44,973 2.6 48,378 (4.6)
EBITDA / Tonne (Rs) 5,534 6,280 (11.9) 7,965 (30.5)

Metals & Mining
April 5, 2019 88
Company Name
Q4FY19E Q4FY18 YoY gr.
(%) Q3FY19
QoQ gr. (%)
Remark
Tata Steel - India
Sales 188,011 162,809 15.5 171,739 9.5
Standalone volume is expected to grow 13.8% QoQ to 3.4m tonnes. Realisations are expected to fall 3.8% or Rs2,200/t QoQ to Rs55,625/t. Due to weak realisations, EBITDA/t is expected to fall 13.5%/Rs2,063 QoQ to Rs13,255.
EBITDA 44,801 48,093 (6.8) 45,494 (1.5)
Margin (%) 23.8 29.5 26.5
Adj. PAT 21,158 19,747 7.1 22,871 (7.5)
Sales Vol. (m tonnes) 3.4 3.0 11.6 3.0 13.8
Realization/t (Rs.) 55,625 53,732 3.5 57,824 (3.8)
EBITDA / Tonne (Rs) 13,255 15,872 (16.5) 15,318 (13.5)
Tata Steel - Consol
Sales 454,862 361,323 25.9 412,199 10.4 Tata Steel Europe (TSE) is expected to report 1.5% QoQ fall in EBITDA/t to US$55 due to weaker spreads and lower scale. Benefitted by higher volume growth partially offset by weaker realisations lower realisations in domestic business, we expect consolidated EBITDA to grow 1% QoQ to Rs67.9bn.
EBITDA 67,949 64,989 4.6 67,233 1.1
Margin (%) 14.9 18.0 16.3
Adj. PAT 24,156 35,203 (31.4) 22,751 6.2
SalesVol.‐Corus (mt) 2.6 2.6 1.4 2.4 10.0
EBITDA/Tn‐Corus (US$) 55 70 (21.8) 56 (1.5)
Sales Vol.‐South East (mt) 0.5 0.6 (16.1) 0.5 -
EBITDA/Tn‐SEAN (US$) 10.0 23.8 (58.0) 2.7 275.0
Source: Company, PL

Metals & Mining
April 5, 2019 89
Exhibit 9: Valuation Summary
Company Names Rating CMP (Rs)
TP (Rs) Sales (Rs bn) EBITDA (Rs bn) PAT (Rs bn) EPS (Rs) RoE (%) PE (x)
FY18 FY19E FY20E FY21E FY18 FY19E FY20E FY21E FY18 FY19E FY20E FY21E FY18 FY19E FY20E FY21E FY18 FY19E FY20E FY21E FY18 FY19E FY20E FY21E
Coal India Hold 235 265 858.6 988.3 1,004.1 1,056.3 95.7 257.3 228.8 222.7 66.9 174.5 154.7 149.6 10.8 28.3 25.1 24.3 30.1 77.1 56.9 49.1 21.8 8.3 9.3 9.7
Hindalco Industries ACC 215 245 1,151.7 1,328.8 1,348.2 1,378.3 139.2 165.0 158.0 157.0 47.5 65.4 60.2 59.3 21.3 29.3 27.0 26.6 9.4 11.3 9.4 8.5 10.1 7.3 8.0 8.1
Hindustan Zinc ACC 289 275 220.8 215.4 218.7 238.9 122.7 112.6 110.8 119.7 91.0 86.7 80.2 87.8 21.5 20.5 19.0 20.8 27.3 24.6 22.0 21.5 13.4 14.1 15.2 13.9
Jindal Steel & Power BUY 187 221 270.7 366.7 402.1 422.9 61.5 83.4 86.4 92.7 -8.2 2.0 5.2 12.8 -8.1 1.9 5.1 12.6 -2.7 0.6 1.7 3.9 -23.1 96.8 36.8 14.9
JSW Steel BUY 294 364 689.5 826.7 856.5 1,047.4 135.2 190.0 181.5 219.8 45.4 78.2 73.9 82.5 15.0 25.9 24.5 27.3 17.9 24.9 19.5 18.5 19.6 11.4 12.0 10.8
NMDC Reduce 105 86 116.1 119.9 105.2 106.2 58.1 67.0 53.4 50.9 38.8 45.2 35.7 33.7 12.3 14.8 11.7 11.0 16.6 17.8 13.0 11.4 8.6 7.1 9.0 9.6
Steel Authority of India Hold 59 50 575.6 694.9 764.7 806.7 46.2 95.7 104.4 109.3 -5.0 19.8 22.6 22.3 -1.2 4.8 5.5 5.4 -1.4 5.4 5.8 5.4 -49.1 12.4 10.8 11.0
Tata Steel BUY 549 652 1,313.0 1,585.3 1,715.4 1,732.9 210.3 280.0 281.4 286.8 29.2 80.1 80.7 83.3 25.5 66.6 67.1 69.3 5.9 10.7 8.7 8.4 21.6 8.2 8.2 7.9
Source: Company, PL

March 26, 2019 90
Oil & Gas
Jan-Mar’19 Earnings Preview
Q4FY19 Oil sector earnings are likely to be strong- led by inventory gains for the
Oil Marketing Companies (OMCs) and healthy performance by gas players despite
a weak show of upstream companies. Upstream earnings will be impacted by lower
crude oil prices. GAIL’s earnings are likely to be weak, given weak LPG profitability
and subdued gas trading earnings. IGL, MGL and PLNG are likely to report healthy
performance during the quarter.
Exhibit 1: Q4FY19 sector aggregates impacted by OMCs performance
Total (Rs m) Q4FY19E Q3FY19 % chg Q4FY18 % chg
Sales 44,41,429 49,31,403 -10% 4,196,844 6%
EBITDA 5,41,216 4,19,884 29% 462,581 17%
PAT 2,84,273 2,24,766 26% 269,137 6%
Brent (USD/bbl) 62.9 67.5 -7% 67.1 -6%
USD/Rs 70.6 72.1 -2% 64.4 10%
Source: Company, PL
RIL: Despite healthy petrochemicals profitability, RIL’s standalone earnings
are likely to be weak at Rs84.8bn led by weak refinery earnings and
appreciating exchange rate; factored at US$8.4/bbl (US$8.8/bbl in Q3). We
have factored in lower refining thruput at 16.8MTPA (Q3FY19 18MTPA) due to
maintenance shutdown. Strong petrochemical spreads and higher volumes will
support petrochemicals earnings. Appreciating exchange rate will also be a
drag for the company even though finance charges are expected to come off.
Downstream: Despite weak GRMs due to crash in gasoline spreads, we
expect OMCs to report Q4 profits of Rs118bn vis-à-vis Q3 profits of Rs15bn
due to inventory gains and high marketing margins. Marketing margins have
recovered sharply on the back of falling crude prices and appreciating
exchange rate of ~Rs5/liter. Benchmark refining margins for Q4 were at
US$3.1/bbl, US$4.3/bbl in Q4 due to weak gasoline spreads of US$3.5/bbl
(US$12/bbl in H1). With recovery in crude and product price, we expect
inventory gains to be at Rs88bn against loss of Rs175bn in Q3.
Exhibit 2: OMC earnings impacted by inventory losses
Total (Rs m) Q4FY19E Q3FY19 % chg Q4FY18 % chg
Sales 2,973,033 3,255,582 -9% 2,794,406 6%
EBITDA 210,332 53,106 296% 176,655 19%
PAT 118,044 14,595 709% 96,396 22%
Singapore GRM (US/bbl) 3.1 4.3 -28% 7.1 -56%
Source: Company, PL
Upstream: Upstream companies will see drop in earnings at Rs57bn due to
drop in average crude oil prices and appreciating exchange rate. Production
and sales volumes are likely to improve. We have not factored in any subsidy
burden and expect net realization of ~US$62/bbl.
April 5, 2019
Top Picks
Petronet LNG
Indraprastha Gas
Avishek Datta
[email protected] | 91-22-66322254

Oil & Gas
April 5, 2019 91
Exhibit 3: Upstream earnings supported by higher realisation
Total (Rs m) Q4FY19E Q3FY19 % chg Q4FY18 % chg
Sales 281,203 312,081 -10% 269,683 4%
EBITDA 149,625 180,923 -17% 121,828 23%
PAT 57,436 94,962 -40% 67,816 -15%
Source: Company, PL
Exhibit 4: Brent prices have come down in Q3
34.6
45.945.950.0
54.150.351.7
61.367.1
74.375.467.5
62.9
0.0
10.0
20.0
30.0
40.0
50.0
60.0
70.0
80.0
Q4F
Y16
Q1F
Y17
Q2F
Y17
Q3F
Y17
Q4F
Y17
Q1F
Y18
Q2F
Y18
Q3F
Y18
Q4F
Y18
Q1F
Y19
Q2F
Y19
Q3F
Y19
Q4F
Y19E
(US
$ / b
bl)
Source: Company, PL
Exhibit 5: Singapore GRMs have come down sequentially
7.8
5.0 5.1
6.7 6.4 6.4
8.3
7.3 7.1
6.0 6.1
4.3
3.1
0.0
1.0
2.0
3.0
4.0
5.0
6.0
7.0
8.0
9.0
Q4F
Y16
Q1F
Y17
Q2F
Y17
Q3F
Y17
Q4F
Y17
Q1F
Y18
Q2F
Y18
Q3F
Y18
Q4F
Y18
Q1F
Y19
Q2F
Y19
Q3F
Y19
Q4F
Y19E
(US
$ / b
bl)
Source: Company, PL
Exhibit 6: Q4FY19 Result Preview
Company Name Q4FY19E Q4FY18 YoY gr.
(%) Q3FY19
QoQ gr. (%)
Remark
Bharat Petroleum Corporation
Sales 741,599 652,393 13.7 791,688 (6.3) BPCL earnings to increase sequentially led by inventory gains and higher marketing margins. Core GRMs will come off led by lower gasoline spreads.
EBITDA 53,779 37,216 44.5 7,374 629.4
Margin (%) 7.3 5.7 0.9
Adj. PAT 33,656 26,736 25.9 4,951 579.7
GAIL (India)
Sales 196,506 154,307 27.3 197,890 (0.7) GAIL earnings will see a decline due to soft LPG spreads and muted gas trading earnings. However, petrochemicals earnings will revive post shutdown in Q3.
EBITDA 24,292 16,953 43.3 26,735 (9.1)
Margin (%) 12.4 11.0 13.5
Adj. PAT 14,847 9,932 49.5 16,812 (11.7)
Hindustan Petroleum Corporation
Sales 656,489 608,101 8.0 721,118 (9.0) HPCL earnings to increase sequentially led by inventory gains and higher marketing margins. Core GRMs will come off led by lower gasoline spreads.
EBITDA 53,966 29,226 84.6 9,632 460.3
Margin (%) 8.2 4.8 1.3
Adj. PAT 31,735 17,479 81.6 2,475 1,182.1
Indraprastha Gas
Sales 14,755 12,141 21.5 15,084 (2.2)
IGL earnings to be better led by appreciating exchange rate and soft LNG prices. Volume trajectory likely to be at double digit for the Q4.
EBITDA 3,334 2,914 14.4 3,179 4.9
Margin (%) 22.6 24.0 21.1
Adj. PAT 2,135 1,747 22.2 1,980 7.8
I.G. Petrochemicals
Sales 3,160 3,128 1.0 3,154 0.2
IGPL earnings to revive from Q3 levels due to spreads revival.
EBITDA 526 637 (17.5) 335 56.8
Margin (%) 16.6 20.4 10.6
Adj. PAT 300 334 (10.3) 176 70.6
Indian Oil Corporation
Sales 1,273,950 1,173,685 8.5 1,399,689 (9.0) IOCL earnings to increase sequentially led by inventory gains and higher marketing margins. Core GRMs will come off led by lower gasoline spreads.
EBITDA 102,587 110,213 (6.9) 36,101 184.2
Margin (%) 8.1 9.4 2.6
Adj. PAT 52,653 52,181 0.9 7,168 634.6

Oil & Gas
April 5, 2019 92
Company Name Q4FY19E Q4FY18 YoY gr.
(%) Q3FY19
QoQ gr. (%)
Remark
Mahanagar Gas
Sales 7,361 5,870 25.4 7,527 (2.2) MGL earnings to be better led by appreciating exchange rate and soft LNG prices. Volume trajectory likely to be steady albeit strike by bus transporter.
EBITDA 2,439 1,762 38.5 2,391 2.0
Margin (%) 33.1 30.0 31.8
Adj. PAT 1,554 1,048 48.3 1,484 4.7
NOCIL
Sales 2,600 2,759 -5.8 2,612 (0.5)
Nocil earnings to be soft due to high cost inventory from the previous quarters and sluggish sales.
EBITDA 680 846 (19.6) 725 (6.2)
Margin (%) 26.2 30.7 27.8
Adj. PAT 434 510 (14.8) 447 (2.8)
Oil India
Sales 30,341 29,984 1.2 35,140 (13.7)
OINL earnings to be impacted by lower crude oil realisation and appreciating exchange rate. Volume growth will be muted.
EBITDA 11,555 8,006 44.3 15,215 (24.1)
Margin (%) 38.1 26.7 43.3
Adj. PAT 5,799 8,665 (33.1) 12,334 (53.0)
Oil & Natural Gas Corporation
Sales 250,862 239,698 4.7 276,941 (9.4) ONGC earnings to be impacted by lower crude oil realisation and appreciating exchange rate. Crude oil volume growth will be muted, however, gas volumes might inch up.
EBITDA 138,071 113,822 21.3 165,708 (16.7)
Margin (%) 55.0 47.5 59.8
Adj. PAT 51,637 59,151 (12.7) 82,628 (37.5)
Petronet LNG
Sales 100,243 86,362 16.1 100,977 (0.7)
Steady quarter expected as soft spot LNG prices will support earnings.
EBITDA 8,416 8,221 2.4 8,481 (0.8)
Margin (%) 8.4 9.5 8.4
Adj. PAT 5,471 5,227 4.7 5,653 (3.2)
Reliance Industries
Sales 865,988 872,270 -0.7 1,039,980 (16.7)
RIL standalone earnings to be weak led by soft refining margins and lower throughput. Petrochemicals earnings to be resilient.
EBITDA 142,776 134,250 6.4 145,070 (1.6)
Margin (%) 16.5 15.4 13.9
Adj. PAT 84,785 86,970 (2.5) 89,280 (5.0)
Source: Company, PL

Oil & Gas
April 5, 2019 93
Exhibit 7: Valuation Summary
Company Names Rating CMP (Rs)
TP (Rs) Sales (Rs bn) EBITDA (Rs bn) PAT (Rs bn) EPS (Rs) RoE (%) PE (x)
FY18 FY19E FY20E FY21E FY18 FY19E FY20E FY21E FY18 FY19E FY20E FY21E FY18 FY19E FY20E FY21E FY18 FY19E FY20E FY21E FY18 FY19E FY20E FY21E
BPCL BUY 358 499 2,357.7 3,090.4 3,475.6 3,654.0 151.7 160.6 180.0 178.5 85.0 94.5 108.6 106.4 39.2 43.6 50.1 49.1 25.2 23.3 22.6 19.3 9.1 8.2 7.2 7.3
GAIL (India) BUY 349 482 536.6 683.1 812.7 918.6 76.3 103.7 113.8 119.2 45.9 66.0 74.8 79.5 20.4 29.3 33.2 35.3 11.7 15.6 16.1 15.7 17.1 11.9 10.5 9.9
HPCL BUY 264 326 2,195.1 2,958.6 3,234.1 3,526.4 107.1 141.6 129.8 138.2 72.2 62.5 49.8 54.7 47.4 41.0 32.6 35.9 31.0 22.4 15.4 14.9 5.6 6.4 8.1 7.3
Indraprastha Gas BUY 306 360 45.9 50.2 57.6 66.3 11.1 12.4 13.5 15.1 6.7 7.5 8.2 9.5 9.6 10.8 11.8 13.6 20.8 20.0 19.0 19.0 32.0 28.4 26.0 22.5
I.G. Petrochemicals BUY 305 530 11.4 12.0 14.2 18.4 2.7 2.3 2.4 3.1 1.5 1.3 1.4 1.7 47.6 43.3 44.1 56.0 31.8 22.4 18.6 19.5 6.4 7.0 6.9 5.4
Indian Oil Corporation Acc 158 207 4,214.9 5,470.8 6,004.8 6,561.0 415.9 358.3 351.9 399.1 208.0 184.5 192.9 228.2 21.9 19.0 19.9 23.5 23.2 16.6 14.5 15.7 7.2 8.3 8.0 6.7
Mahanagar Gas BUY 1,002 1,179 22.3 27.5 29.8 31.9 7.8 8.9 9.5 10.1 4.8 5.6 6.1 6.8 48.4 57.1 61.6 68.4 24.3 24.5 22.6 21.7 20.7 17.6 16.3 14.7
NOCIL BUY 141 252 9.7 11.2 13.5 17.0 2.6 3.0 3.4 4.3 1.7 1.9 2.2 2.8 10.3 11.7 13.5 16.9 17.4 17.3 17.8 19.4 13.7 12.1 10.4 8.4
Oil India Acc 180 236 106.6 134.1 141.8 150.6 41.9 52.2 51.4 50.6 26.7 31.3 29.8 26.8 23.5 27.6 26.3 23.6 9.4 11.7 11.5 9.9 7.6 6.5 6.8 7.6
ONGC BUY 157 223 3,622.5 2,053.6 2,051.5 2,227.2 643.3 792.7 710.1 772.3 258.2 338.3 261.9 280.1 20.1 26.4 20.4 21.8 13.0 14.5 9.7 9.7 7.8 5.9 7.7 7.2
Petronet LNG BUY 239 306 306.0 352.5 383.0 417.0 33.1 36.0 41.1 45.0 20.8 23.8 28.7 33.1 13.9 15.9 19.1 22.0 23.3 23.1 23.8 22.8 17.2 15.0 12.5 10.8
Reliance Industries Acc 1,354 1,406 2,900.4 3,664.9 4,002.0 4,284.7 517.4 596.0 659.4 710.5 336.1 366.1 412.5 462.1 53.1 57.8 65.1 72.9 11.1 11.5 12.7 13.8 25.5 23.4 20.8 18.6
Source: Company, PL

April 5, 2019 94
Pharma
Jan-Mar’19 Earnings Preview
With few important launches in US and QoQ appreciating INR against major
economic currencies, we expect moderate growth in exports. INR has appreciated
QoQ against US Dollar, UK Sterling, Brazilian Real, Russian Rouble, South African
Zar, Australian Dollar and Euro while it depreciated QoQ only against Japanese
Yen and Mexican Peso. Depreciating South African Zar (-0.1%) and Brazilian Real
(-1.2%) will impact sales and margin of Cipla (in Cipla-Medpro) and Torrent/Dr.
Reddy’s Lab (DRL) in relevant countries as on Q4FY19. The depreciation of INR
against Japanese Yen by (-0.1%) may help to report better sales for Lupin’s generic
business in Japan, while we expect impact in revenues and margin of ROW
business due to depreciating EM currencies against USD. The appreciating INR
against Rouble and Euro may result in reporting of lower sales growth of the
geographies by Sun Pharma, DRRD, GNP, IPCA, Torrent, ARBP and Lupin. The
USD depreciation (vs. INR) in Q4FY19 was 2.1% lower in comparison to 2.7%
appreciation in Q3FY19, which may result in reporting of lower sales from US
generics.
Exhibit 1: Emerging market currencies v/s USD in Q4FY19 v/s Q4FY18
-
20.00
40.00
60.00
80.00
100.00
Jan
-18
Feb
-18
Ma
r-1
8
Ap
r-1
8
Ma
y-1
8
Jun
-18
Jul-
18
Au
g-1
8
Sep
-18
Oct
-18
No
v-1
8
De
c-1
8
Jan
-19
Feb
-19
Ma
r-1
9
USDINR Curncy GBPINR Curncy BRLINR Curncy
MXNINR Curncy RUBINR Curncy ZARINR Curncy
AUDINR Curncy JPYINR Curncy EURINR Curncy
Source: Bloomberg, PL
US continue to be major market for Indian Pharma companies with 32% of the
revenues coming from the USA in our coverage universe.
Exhibit 2: Contribution of US generics in Revenues in Q4FY19E
Companies US rev (%)
Aurobindo 46
Cipla 19
Dr Reddy's 38
Glenmark 35
Indoco Remedies 1
Jubilant Life 47
Lupin 30
Sun Pharma 34
Zydus Cadila 47
Average 33
Source: Company, PL
April 5, 2019
Top Picks
Aurobindo Pharma
Thyrocare Technologies
IPCA Laboratories
Surajit Pal
[email protected] | 91-22-66322259
Pharma
April 5, 2019 95
Major approvals for Indian Peers: With significant improvement in the flow of
generic approvals for Indian peers in the US, there will be major benefits for
companies with no major manufacturing issues with USFDA. There were however
very few approvals with limited competition opportunity in Q4FY19. The new
approvals in Q4FY19 Levothyroxyn (Lupin) along with few ones in Q3FY19
(gInvanz Inj and gReyataz (both for Auro), gIsuprel (Cipla), gWelchol (Glenmark),
and gSuboxone (DRL)) will also draw benefits of full quarter sales. There will be
additional benefits from few drugs, which were launched at the fag end of Q2FY19,
such as gTreximet (Auro), gTruvada (Auro), gNuvigil (Auro) and gArixtra (Auro).
While there is marginal growth in US for our coverage universe, we expect varied
growth for individual companies due to uneven distribution of competitive intensity
of individual products in US. We assume 2-4% QoQ price correction across the
companies in older US generics in Q4FY19. There were 65 and 70 ANDAs
approval given to Indian companies in Q4FY19 and Q3FY19 respectively, vis-à-vis
73 ANDAs in Q2FY19. The number of key approvals (with sizeable market size and
opportunity) remains far and few due to shrinking options of available molecules
and increase in number of approvals on the first day of genericisation. With large
number of pending approvals, Zydus Cadila received largest (9 ANDAs) number of
approvals followed by Aurobindo’s six approvals among the Indian pharma
companies in Q4FY19.
Among key launches, we expect DRL to report partial gain from the relaunch of
gSuboxone in Q4FY19 as it competes with three generics and one authorized
generic post vacation of the injunction order by the Appeal Court in US. The initial
earnings estimate from gSuboxone will most likely to be moderated post launch of
other generics in comparison to the solo launch in Q2FY19. We believe Aurobindo
launched gInvanz and gReyataz in the last week Q2FY19 and expect major benefit
to receive in Q3FY19 and Q4FY19 as major part of injectable are procured during
winter season in US. Aurobindo surprising benefits in gReyataz will be lower as
Mylan and Cipla received approvals and launched the drug in Q3FY19.
Exhibit 3: Movement of INR vs. major ROW currencies in Q4FY19
Foreign Exchange Rates vis-à-vis INR Q4FY19 (Avg) Q3FY19 (Avg) Growth (%)
Euro 80.05 82.21 2.6
GB Pound Sterling 91.71 92.68 1.0
Japanese Yen 0.64 0.64 (0.1)
Russian Rouble 1.07 1.08 1.2
South African Zar 5.03 5.04 0.1
Brazilian Real 18.69 18.93 1.2
USD 70.47 72.02 2.1
Mexican Peso 3.67 3.64 (0.9)
Source: Company, PL
With no major disruption of sales due to festivity (as it was in Q3FY19) IPM growth
and no benefits of lower base (due to GST implementation) YoY, we expect IPM
growth to be 10-12% in Q4FY19. IPM growth in Oct and Nov 2018 was 12.2% and
6.3% (IPM-AIOCD) respectively and we expect growth in Dec-2018 will not be
vastly different than the other two months of the quarter. A vast majority of growth
in Oct-Nov 2018 was due to increase in price while significant fall in volume of older
products are noticed. We expect domestic formulation market to continue to be
challenging, especially for the companies which are highly dependent on acute
therapy drugs. It would be more challenging for large Indian Pharma companies
due to large base and strong restriction on churning out of new combination drugs.

Pharma
April 5, 2019 96
Exhibit 4: Q4FY19 Result Preview
Company Name Q4FY19E Q4FY18 YoY gr.
(%) Q3FY19
QoQ gr. (%)
Remark
Aurobindo Pharma
Sales 50,207 39,886 25.9 51,753 (3.0) gInvanz (Ertapenem) continue to be lead growth driver followed by revenues from new business opportunities (NBOs). We expects US inj sales to be US$60-65m in Q4FY19E, to be helped by additional sales of Tazo-pip and relaunch of Vancomycin and pantoprazole.
EBITDA 9,682 7,436 30.2 9,920 (2.4)
Margin (%) 19.3 18.6 19.2
Adj. PAT 6,249 5,285 18.2 7,373 (15.2)
Cadila Healthcare
Sales 31,348 32,502 -3.6 35,779 (12.4) With launch of three new generics, the US sales of CDH to be impacted due to lower sales (QoQ) of gLialda to US$225m. EBITDA margin to be lower due to higher R&D costs from the trials of complex products in US. India sales to remain subdued.
EBITDA 7,232 8,704 (16.9) 8,399 (13.9)
Margin (%) 23.1 26.8 23.5
Adj. PAT 4,199 5,908 (28.9) 5,107 (17.8)
Cipla
Sales 38,291 34,958 9.5 39,062 (2.0) Expect steady growth in US sales to US$125m. India formulations sales to remain tepid at 8-10% vs peers of 11-13%. Overhead costs remain high due to initiation of high costs trials in complex injectables and inhalers in US.
EBITDA 5,386 3,547 51.8 6,063 (11.2)
Margin (%) 14.1 10.1 15.5
Adj. PAT 2,831 1,786 58.5 3,322 (14.8)
Dr. Lal PathLabs
Sales 3,474 2,668 30.2 2,925 18.8 Expect DLPL growht in Q4FY19 to be driven by sales from packaged of Tests offer, a new set of products with 13% sales contribution and lower EBITDA margin. Higher overhead to be maintained due to commissioning of Kolkata central lab.
EBITDA 763 640 19.2 656 16.3
Margin (%) 22.0 24.0 22.4
Adj. PAT 506 401 26.2 458 10.5
Dr. Reddy's Laboratories
Sales 39,943 35,539 12.4 38,646 3.4 The relaunch of gSuboxone will be key revenu driver and expand profitability in Q4FY19. Majority of its core portfolio in US have stability of price QoQ. Storng momentum of rationalizing overhead costs to help better and sustainable profit going forward.
EBITDA 8,188 5,636 45.3 8,046 1.8
Margin (%) 20.5 15.9 20.8
Adj. PAT 5,127 2,721 88.4 5,003 2.5
Eris Lifesciences
Sales 2,540 2,122 19.7 2,524 0.6 Eris is gradually recovering lost sales in CNS portfolio acquired from Strides. Without the acquired portfolio, own sales to grow at 13-15% in Q4FY19. Margin to be rationalised more with focus on promotion of newly launched and acquired products.
EBITDA 819 717 14.1 935 (12.5)
Margin (%) 32.2 33.8 37.1
Adj. PAT 642 558 15.1 801 (19.9)
Glenmark Pharmaceuticals
Sales 24,902 22,479 10.8 25,098 (0.8) With competitive intensity in gWelchol, we expect 5% QoQ decline in US sales to US$112m. Ebitda margin to remain subdued due to price erosion in its core portfolio in US. Domestic sales to grow by 10%-12%, exluding the divesting sales of Rs400m/quarter.
EBITDA 2,887 2,947 (2.0) 3,894 (25.9)
Margin (%) 11.6 13.1 15.5
Adj. PAT 1,964 1,511 30.0 1,163 68.8
Indoco Remedies
Sales 2,386 2,589 -7.8 2,480 (3.8) Domestic formulation sales growth to remain impacted with decline YoY. EBITDA margin to be 3-5%. Management expects normalised sales growth expected in FY20E post its revamp in sales team. The benefits of EIR from USFDA to reflect from Q1FY20E onwards.
EBITDA 110 387 (71.6) 102 7.5
Margin (%) 4.6 14.9 4.1
Adj. PAT -7 205 (103.4) 53 (112.9)
Ipca Laboratories
Sales 9,708 7,816 24.2 9,476 2.5 IPCA conventionally received lowest growth and weakest EBITDA margin in Q4 of a fiscal year. We expect 10% YoY gr in India formulations along with initial sales in the Global Fund tender business. Expect Adj. EBITDA margin to be 13-14%.
EBITDA 1,676 1,087 54.2 2,317 (27.7)
Margin (%) 17.3 13.9 24.5
Adj. PAT 1,058 513 106.1 1,602 (34.0)
Jubilant Life Sciences
Sales 23,365 22,520 3.8 23,771 (1.7) Radiology continue to lead its growth in pharmaceutical business while LSI sales to be laggard due to subdued pricing environment globally. Formulations and API sales to be lower post warning letter from USFDA. EBITDA margin to be lower on higher overhead.
EBITDA 4,501 4,579 (1.7) 4,933 (8.7)
Margin (%) 19.3 20.3 20.8
Adj. PAT 2,112 1,549 36.3 2,608 (19.0)

Pharma
April 5, 2019 97
Company Name Q3FY19E Q3FY18 YoY gr.
(%) Q2FY19
QoQ gr. (%)
Remark
Lupin
Sales 40,610 39,785 2.1 43,779 (7.2) While majority of its porduct in US portfolio witnessed bottom of the price erosion cycle, we expect US sales to be subdued due to warning letter in four plants. India sales to gr 13% YoY. EBITD margin traditionally lower due to acccounting of higher overhead.
EBITDA 5,601 6,534 (14.3) 6,256 (10.5)
Margin (%) 13.8 16.4 14.3
Adj. PAT 2,532 6,808 (62.8) 1,905 32.9
Sun Pharmaceutical Industries
Sales 72,529 67,110 8.1 76,567 (5.3) Exports from Halol unit remained at lower scale as SUNP has rationalised many products post receiveing resolution on the plant. Major focus on launch and promotion of specialty generics and R&D costs on trials to keep overhead higher and margin lower.
EBITDA 15,549 14,174 9.7 20,694 (24.9)
Margin (%) 21.4 21.1 27.0
Adj. PAT 8,370 13,090 (36.1) 12,419 (32.6)
Thyrocare Technologies
Sales 1,305 967 35.0 963 35.5 Traditionally, the Q4 quarter featured with strong revenue growth with lower margin vs. other quarters in a year. Management maintains that higher competitive intensity continue to impact growth and margin and Q4FY19 is not different to the guidance.
EBITDA 505 372 35.8 355 42.3
Margin (%) 38.7 38.5 36.9
Adj. PAT 297 251 18.1 202 47.3
Source: Company, PL

Pharma
April 5, 2019 98
Exhibit 5: Valuation Summary
Company Names Rating CMP (Rs)
TP (Rs) Sales (Rs bn) EBITDA (Rs bn) PAT (Rs bn) EPS (Rs) RoE (%) PE (x)
FY18 FY19E FY20E FY21E FY18 FY19E FY20E FY21E FY18 FY19E FY20E FY21E FY18 FY19E FY20E FY21E FY18 FY19E FY20E FY21E FY18 FY19E FY20E FY21E
Aurobindo Pharma BUY 787 952 162.3 192.9 212.8 227.7 35.2 37.2 42.6 49.6 24.0 24.7 30.2 34.9 40.9 42.2 51.5 59.5 22.8 19.3 19.7 19.1 19.2 18.6 15.3 13.2
Cadila Healthcare ACC 345 362 116.3 126.8 137.5 145.2 25.4 26.9 29.6 31.6 17.8 19.0 21.6 23.2 17.3 18.6 21.1 22.7 22.6 20.9 20.8 18.7 19.9 18.6 16.3 15.2
Cipla REDUCE 532 475 147.5 156.7 170.4 185.3 27.6 24.7 30.3 33.5 18.1 14.9 17.6 19.1 22.5 18.5 21.8 23.7 13.5 10.0 10.8 10.6 23.7 28.8 24.4 22.4
Dr. Lal PathLabs ACC 1,034 1,070 10.6 12.5 14.7 16.9 2.6 3.0 3.5 3.7 1.7 2.0 2.4 2.5 20.5 24.3 28.7 30.3 24.6 23.9 24.1 21.4 50.4 42.5 36.0 34.1
Dr. Reddy's Laboratories REDUCE 2,754 2,558 142.8 152.6 165.9 183.9 23.5 31.1 34.8 38.6 9.5 19.6 20.4 22.3 57.0 118.4 123.0 134.6 7.6 14.6 13.4 13.0 48.3 23.3 22.4 20.5
Eris Lifesciences Acc 625 695 8.6 10.2 12.0 13.7 3.2 3.6 4.3 5.0 2.9 3.0 3.6 4.3 21.4 21.9 26.2 31.2 41.2 30.0 27.3 25.3 29.2 28.5 23.8 20.0
Glenmark Pharmaceuticals
Reduce 645 591 89.7 99.4 109.5 117.0 14.8 16.9 18.9 20.8 8.0 9.3 10.6 11.9 28.4 32.9 37.7 42.2 16.6 16.6 16.3 15.7 22.7 19.6 17.1 15.3
Indoco Remedies REDUCE 204 111 10.2 9.5 10.4 11.3 1.1 0.4 0.8 1.0 0.5 -0.2 0.2 0.3 5.1 -1.6 2.0 3.7 7.1 -2.3 2.9 5.1 39.6 -124.3 100.4 55.2
Ipca Laboratories BUY 957 921 32.8 37.7 43.3 49.6 4.5 6.8 8.1 9.6 2.4 4.3 5.4 6.5 19.0 33.7 42.5 51.6 9.3 14.7 15.9 16.4 50.4 28.4 22.5 18.5
Jubilant Life Sciences Reduce 709 703 74.6 89.6 96.9 103.7 11.8 17.3 17.9 19.3 4.1 9.3 10.0 11.2 26.3 59.9 64.2 71.7 10.9 20.6 18.4 17.4 26.9 11.8 11.1 9.9
Lupin REDUCE 788 820 155.6 160.9 178.2 193.5 29.0 21.4 31.2 37.7 17.1 9.9 13.9 18.5 37.9 22.0 30.8 41.0 12.6 7.4 10.0 12.3 20.8 35.9 25.6 19.2
Sun Pharmaceutical Industries
Reduce 463 427 260.7 281.1 304.7 321.8 51.8 60.4 67.0 70.6 18.7 29.8 48.2 51.3 7.8 12.4 20.1 21.4 5.0 8.2 13.1 12.4 59.3 37.2 23.1 21.7
Thyrocare Technologies BUY 536 795 3.6 4.3 5.2 6.3 1.4 1.5 1.9 2.3 0.9 1.0 1.2 1.5 17.4 19.0 23.1 27.7 21.9 21.7 24.1 25.3 30.9 28.3 23.2 19.4
Source: Company, PL

April 5, 2019 99
April 5, 2019
Jinesh Joshi
[email protected] | 91-22-66322238
Others
Jan-Mar’19 Earnings Preview
Q4FY19 Result Preview
Company Name Q4FY19E Q4FY18 YoY gr.
(%) Q3FY19
QoQ gr. (%)
Remark
VIP Industries
Sales 4,420 3,626 21.9 4,301 2.8 We expect top-line growth to be upwards of 20% given upscaling visible at the mass end of the luggage industry post GST implementation & ensuing product premiumsation. However, gross margins are expected to remain under pressure due to high cost inventory on books.
EBITDA 398 543 (26.8) 378 5.2
Margin (%) 9.0 15.0 8.8
Adj. PAT 253 351 (27.7) 238 6.3
Source: Company, PL

Others
April 5, 2019 100
Valuation Summary
Company Names Rating CMP (Rs)
TP (Rs) Sales (Rs m) EBITDA (Rs m) PAT (Rs m) EPS (Rs) RoE (%) PE (x)
FY18 FY19E FY20E FY21E FY18 FY19E FY20E FY21E FY18 FY19E FY20E FY21E FY18 FY19E FY20E FY21E FY18 FY19E FY20E FY21E FY18 FY19E FY20E FY21E
V.I.P. Industries BUY 477 579 14,096 17,917 21,897 26,695 1,934 2,249 2,934 3,764 1,268 1,453 1,920 2,481 9.0 10.3 13.6 17.6 25.6 25.0 26.6 27.8 53.2 46.4 35.1 27.2
Source: Company, PL

Oct-Dec’18 Earnings Preview
April 5, 2019 101
PL’s Recommendation Nomenclature (Absolute Performance)
Buy : > 15%
Accumulate : 5% to 15%
Hold : +5% to -5%
Reduce : -5% to -15%
Sell : < -15%
Not Rated (NR) : No specific call on the stock
Under Review (UR) : Rating likely to change shortly

Oct-Dec’18 Earnings Preview
April 5, 2019 102
ANALYST CERTIFICATION
(Indian Clients)
We/I, Mr. Amnish Aggarwal- MBA, CFA, Research Analysts, authors and the names subscribed to this report, hereby certify that all of the views expressed in this research report accurately reflect our views about the subject issuer(s) or securities. We also certify that no part of our compensation was, is, or will be directly or indirectly related to the specific recommendation(s) or view(s) in this report.
(US Clients)
The research analysts, with respect to each issuer and its securities covered by them in this research report, certify that: All of the views expressed in this research report accurately reflect his or her or their personal views about all of the issuers and their securities; and No part of his or her or their compensation was, is or will be directly related to the specific recommendation or views expressed in this research report.
DISCLAIMER
Indian Clients
Prabhudas Lilladher Pvt. Ltd, Mumbai, India (hereinafter referred to as “PL”) is engaged in the business of Stock Broking, Portfolio Manager, Depository Participant and distribution for third party financial products. PL is a subsidiary of Prabhudas Lilladher Advisory Services Pvt Ltd. which has its various subsidiaries engaged in business of commodity broking, investment banking, financial services (margin funding) and distribution of third party financial/other products, details in respect of which are available at www.plindia.com.
This document has been prepared by the Research Division of PL and is meant for use by the recipient only as information and is not for circulation. This document is not to be reported or copied or made available to others without prior permission of PL. It should not be considered or taken as an offer to sell or a solicitation to buy or sell any security.
The information contained in this report has been obtained from sources that are considered to be reliable. However, PL has not independently verified the accuracy or completeness of the same. Neither PL nor any of its affiliates, its directors or its employees accepts any responsibility of whatsoever nature for the information, statements and opinion given, made available or expressed herein or for any omission therein.
Recipients of this report should be aware that past performance is not necessarily a guide to future performance and value of investments can go down as well. The suitability or otherwise of any investments will depend upon the recipient's particular circumstances and, in case of doubt, advice should be sought from an independent expert/advisor.
Either PL or its affiliates or its directors or its employees or its representatives or its clients or their relatives may have position(s), make market, act as principal or engage in transactions of securities of companies referred to in this report and they may have used the research material prior to publication.
PL may from time to time solicit or perform investment banking or other services for any company mentioned in this document.
PL is in the process of applying for certificate of registration as Research Analyst under Securities and Exchange Board of India (Research Analysts) Regulations, 2014
PL submits that no material disciplinary action has been taken on us by any Regulatory Authority impacting Equity Research Analysis activities.
PL or its research analysts or its associates or his relatives do not have any financial interest in the subject company.
PL or its research analysts or its associates or his relatives do not have actual/beneficial ownership of one per cent or more securities of the subject company at the end of the month immediately preceding the date of publication of the research report.
PL or its research analysts or its associates or his relatives do not have any material conflict of interest at the time of publication of the research report.
PL or its associates might have received compensation from the subject company in the past twelve months.
PL or its associates might have managed or co-managed public offering of securities for the subject company in the past twelve months or mandated by the subject company for any other assignment in the past twelve months.
PL or its associates might have received any compensation for investment banking or merchant banking or brokerage services from the subject company in the past twelve months.
PL or its associates might have received any compensation for products or services other than investment banking or merchant banking or brokerage services from the subject company in the past twelve months
PL or its associates might have received any compensation or other benefits from the subject company or third party in connection with the research report.
PL encourages independence in research report preparation and strives to minimize conflict in preparation of research report. PL or its analysts did not receive any compensation or other benefits from the subject Company or third party in connection with the preparation of the research report. PL or its Research Analysts do not have any material conflict of interest at the time of publication of this report.
It is confirmed that Mr. Amnish Aggarwal- MBA, CFA, Research Analysts of this report have not received any compensation from the companies mentioned in the report in the preceding twelve months
Compensation of our Research Analysts is not based on any specific merchant banking, investment banking or brokerage service transactions.
The Research analysts for this report certifies that all of the views expressed in this report accurately reflect his or her personal views about the subject company or companies and its or their securities, and no part of his or her compensation was, is or will be, directly or indirectly related to specific recommendations or views expressed in this report.
The research analysts for this report has not served as an officer, director or employee of the subject company PL or its research analysts have not engaged in market making activity for the subject company
Our sales people, traders, and other professionals or affiliates may provide oral or written market commentary or trading strategies to our clients that reflect opinions that are contrary to the opinions expressed herein, and our proprietary trading and investing businesses may make investment decisions that are inconsistent with the recommendations expressed herein. In reviewing these materials, you should be aware that any or all o the foregoing, among other things, may give rise to real or potential conflicts of interest.
PL and its associates, their directors and employees may (a) from time to time, have a long or short position in, and buy or sell the securities of the subject company or (b) be engaged in any other transaction involving such securities and earn brokerage or other compensation or act as a market maker in the financial instruments of the subject company or act as an advisor or lender/borrower to the subject company or may have any other potential conflict of interests with respect to any recommendation and other related information and opinions.
US Clients
This research report is a product of Prabhudas Lilladher Pvt. Ltd., which is the employer of the research analyst(s) who has prepared the research report. The research analyst(s) preparing the research report is/are resident outside the United States (U.S.) and are not associated persons of any U.S. regulated broker-dealer and therefore the analyst(s) is/are not subject to supervision by a U.S. broker-dealer, and is/are not required to satisfy the regulatory licensing requirements of FINRA or required to otherwise comply with U.S. rules or regulations regarding, among other things, communications with a subject company, public appearances and trading securities held by a research analyst account.
This report is intended for distribution by Prabhudas Lilladher Pvt. Ltd. only to "Major Institutional Investors" as defined by Rule 15a-6(b)(4) of the U.S. Securities and Exchange Act, 1934 (the Exchange Act) and interpretations thereof by U.S. Securities and Exchange Commission (SEC) in reliance on Rule 15a 6(a)(2). If the recipient of this report is not a Major Institutional Investor as specified above, then it should not act upon this report and return the same to the sender. Further, this report may not be copied, duplicated and/or transmitted onward to any U.S. person, which is not the Major Institutional Investor.
In reliance on the exemption from registration provided by Rule 15a-6 of the Exchange Act and interpretations thereof by the SEC in order to conduct certain business with Major Institutional Investors, Prabhudas Lilladher Pvt. Ltd. has entered into an agreement with a U.S. registered broker-dealer, Marco Polo Securities Inc. ("Marco Polo").
Transactions in securities discussed in this research report should be effected through Marco Polo or another U.S. registered broker dealer.
Prabhudas Lilladher Pvt. Ltd. 3rd Floor, Sadhana House, 570, P. B. Marg, Worli, Mumbai-400 018, India | Tel: (91 22) 6632 2222 Fax: (91 22) 6632 2209
www.plindia.com | Bloomberg Research Page: PRLD <GO>

Oct-Dec’18 Earnings Preview
April 5, 2019 103
Notes

Oct-Dec’18 Earnings Preview
April 5, 2019 104
Report Archives